3.2. Analysis of Design Parameters
To reveal the influence of the circumferential groove design parameters and their interactions on SMI and PEI (objective functions), a design parameter sensitivity analysis based on the Sobol index method was conducted for the circumferential groove design parameters. The importance ranking of the design parameters was given according to the magnitude of the influence.
The Sobol index method is a global sensitivity analysis method that uses variance decomposition to define sensitivity indices. It has the advantages of being easy to understand, easy to calculate, and applicable to nonlinear or non-monotone models. This section provides a brief introduction to the sensitivity definition in the Sobol index method [
18]. Suppose the relationship between the input variable
and the output variable
of a model is
. According to the high-dimensional model description of the model response function,
, can be expanded into
function terms:
When the variables are independent, the variances of the left and right sides of Equation (3) can be obtained as follows:
It can be seen that Equation (4) decomposes the output variance of the model into
terms of increasing order, which can be used to describe the variances caused by each input variable and its interactions. Therefore, the contribution of each input variable to the variance of the output variable can be measured by the ratio of the variance of each term to the total variance of the output variable. This leads to the definition of sensitivity indices:
Substituting Equation (4), we get the following expression:
The first-order index
is the main effect index, and its definition is given in Equation (7). It represents the individual contribution of each input variable to the variance of the output variable. The second-order sensitivity index,
, is defined as Equation (8), which can measure the contribution of the interaction between two input variables to the output variance.
The total effect index of
is defined as the sum of all sensitivity indices on the left side of Equation (6) that include the index
:
The total effect index,
, can measure the total contribution of the input variable
itself and its interactions with other variables of all orders to the variance. According to Equation (6), the total effect index,
, can also be indirectly calculated by the first-order partial variance of the input vector,
, containing all input variables except
:
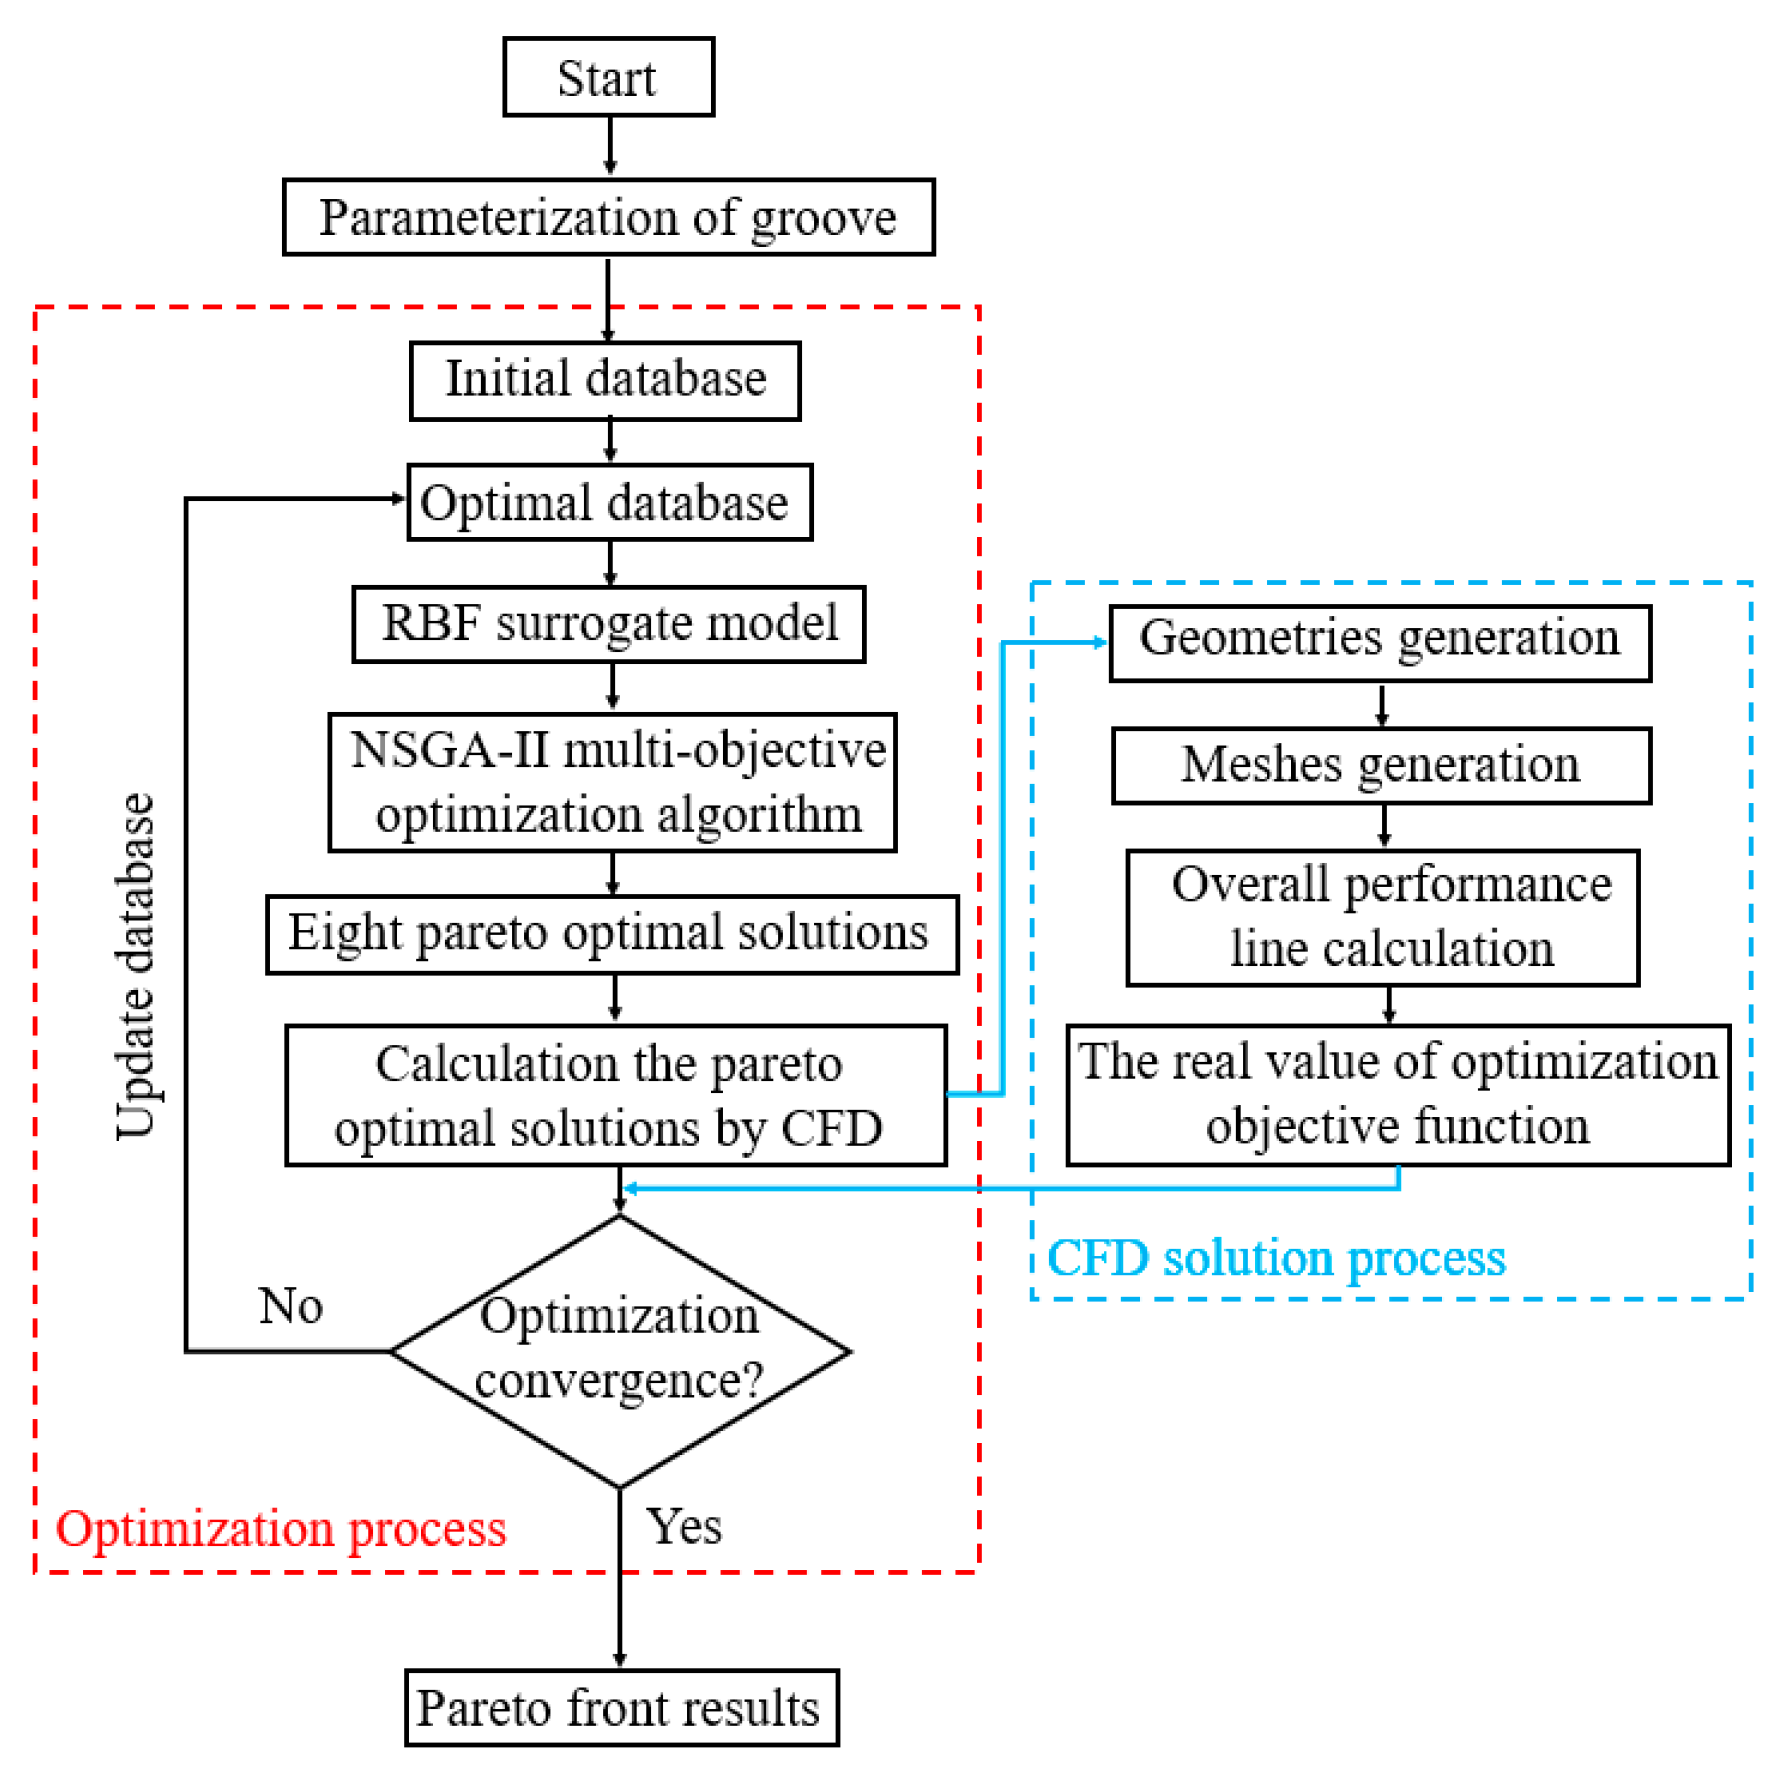
In this section, the design parameters of the circumferential groove are selected as input variables, and the optimization objective function is selected as the output variable to establish a global sensitivity analysis model. About 10,000 sample points were sampled based on the Sobol sequence method. In order to save computing time and resources, this paper directly uses the RBF neural network surrogate model trained during the optimization process to estimate the model output values required in the sensitivity calculation process. That is, the RBF neural network surrogate model is used as the object of sensitivity analysis.
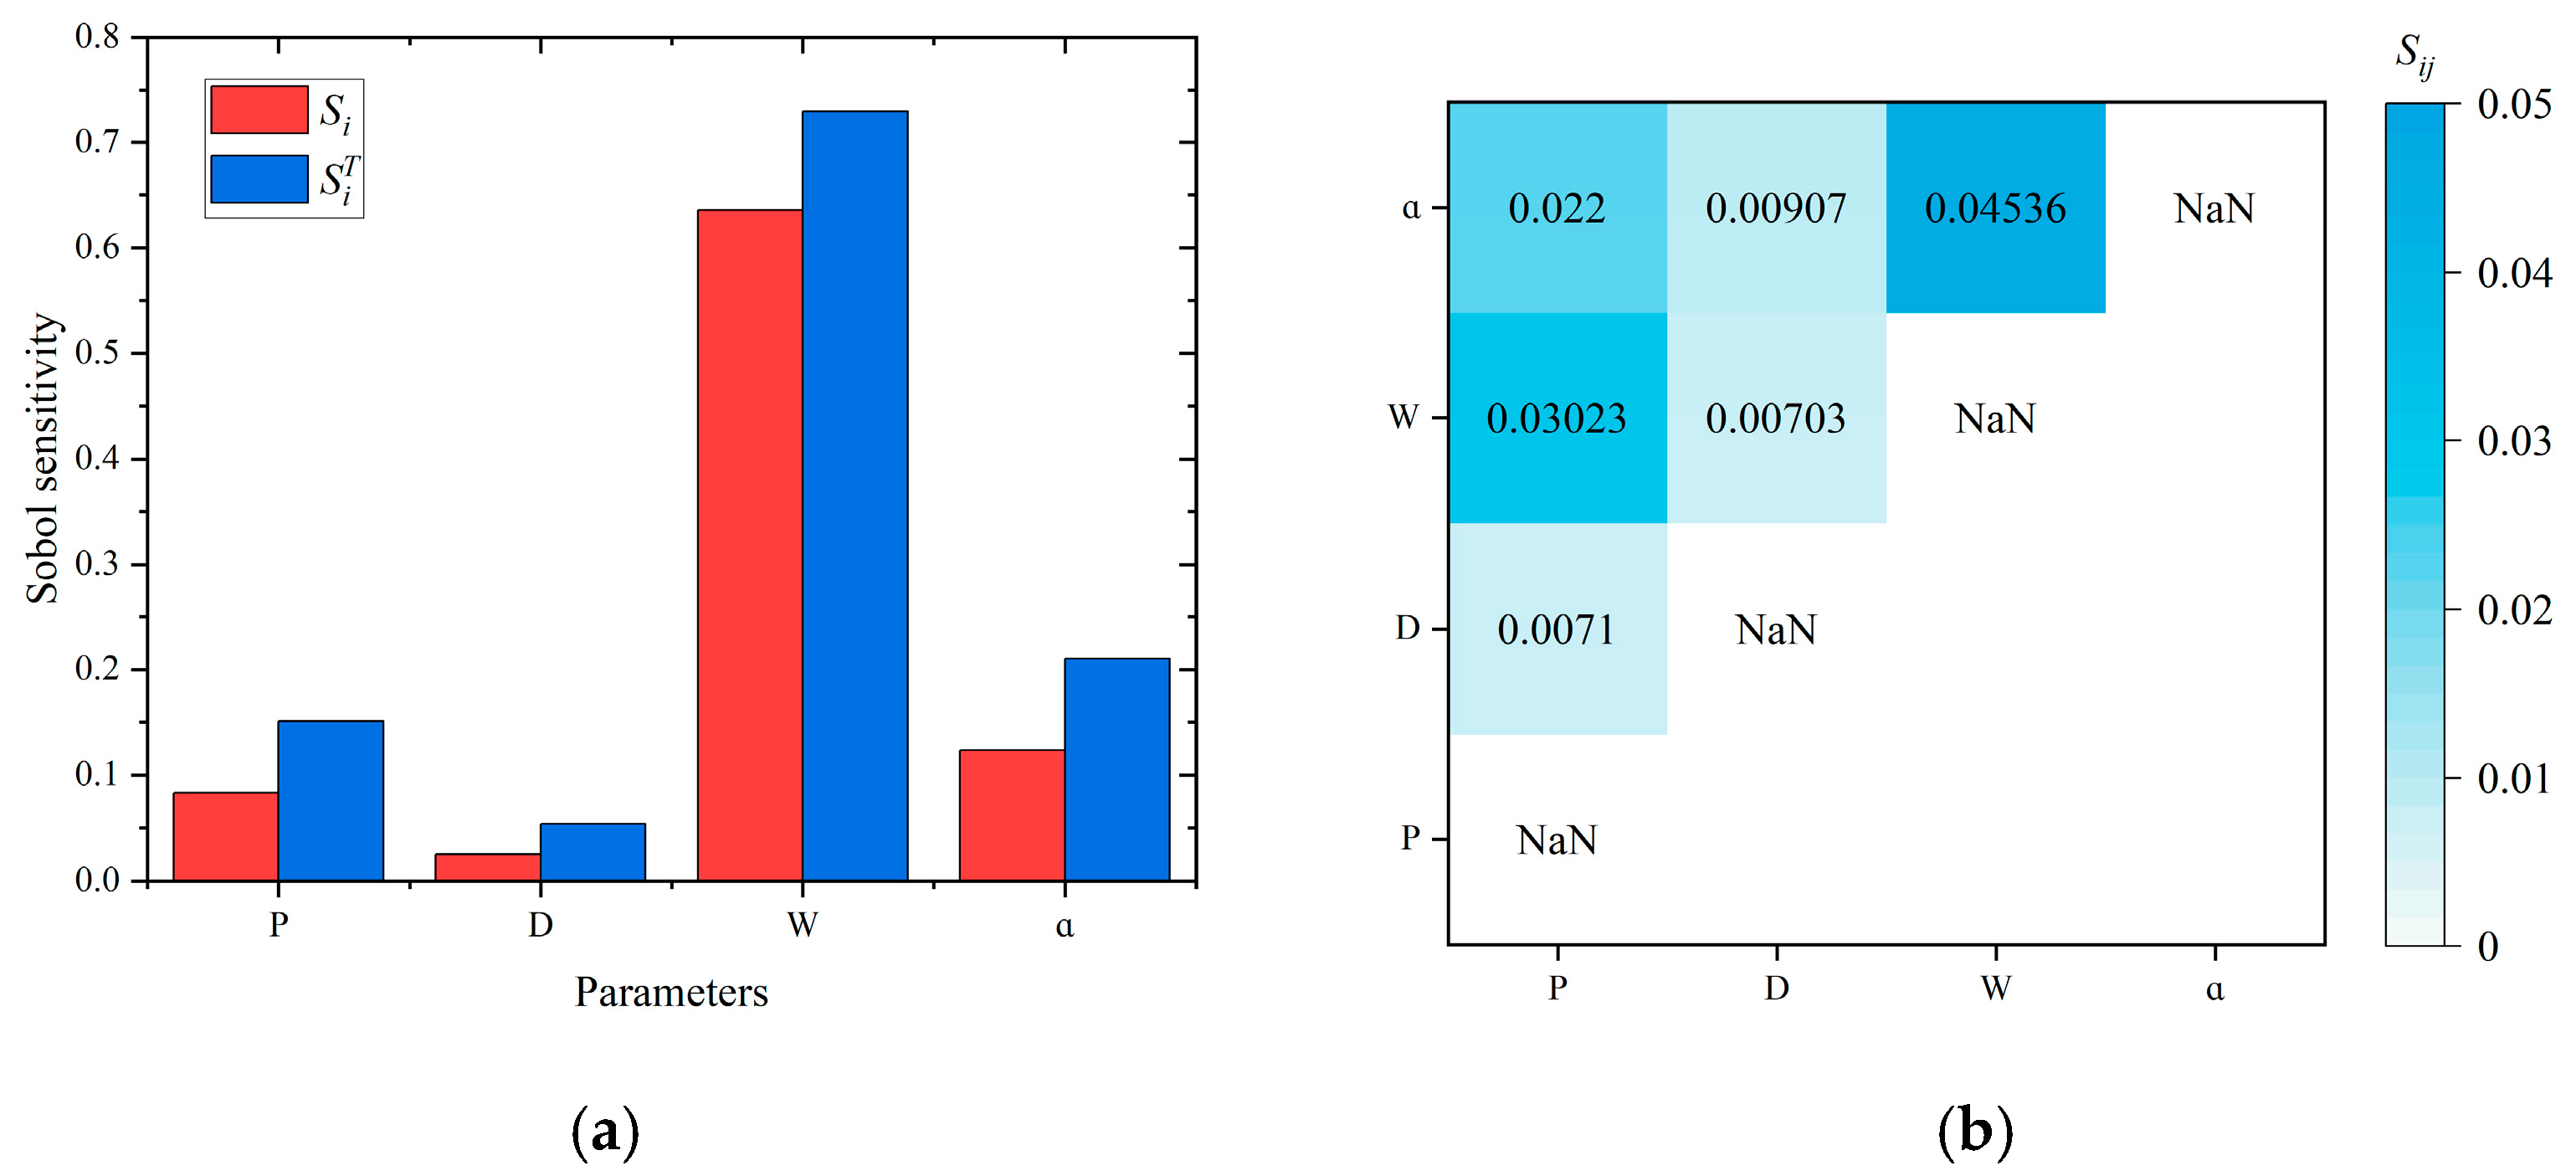
Figure 9 shows the results of the sensitivity analysis of the design parameters for objective function SMI. As shown in
Figure 9a, the design parameter importance ranking obtained according to the size of the main effect index is
. The importance ranking obtained according to the size of the total effect index is also
. It can be seen that parameters
and
have a significant impact on the stall margin of the compressor, while the impact of parameters
and
is small. In addition, it can be noted that the main effect index and total effect index of parameters
and
are significantly different, indicating that their interaction with other parameters also has a significant impact on the stall margin. As shown in the second-order sensitivity index heat map in
Figure 9b, the interaction between
and
has the most significant impact on the stall margin.
Figure 10 shows the results of the sensitivity analysis of the design parameters for objective function PEI. As shown in
Figure 10a, the design parameter importance ranking obtained according to the size of the main effect index is
. The importance ranking obtained according to the size of the total effect index is also
. It can be seen that parameter
has a significant impact on the peak efficiency of the compressor, while the impact of parameters
,
, and
is small. In addition, it can be noted that the main effect index and total effect index of parameters
,
, and
are significantly different, indicating that their interaction with other parameters also has a significant impact on the peak efficiency. As shown in the second-order sensitivity heat map in
Figure 10b, the interaction between
and
has the most significant impact on the peak efficiency.
The above research found that stall margin, groove width (), groove inclination angle (), and the interaction between groove position () and groove width () have a significant impact on the SMI. For efficiency, groove width () and the interaction between groove width () and groove inclination angle () have a significant impact on the PEI. When designing a single circumferential groove, these parameters should be given priority.
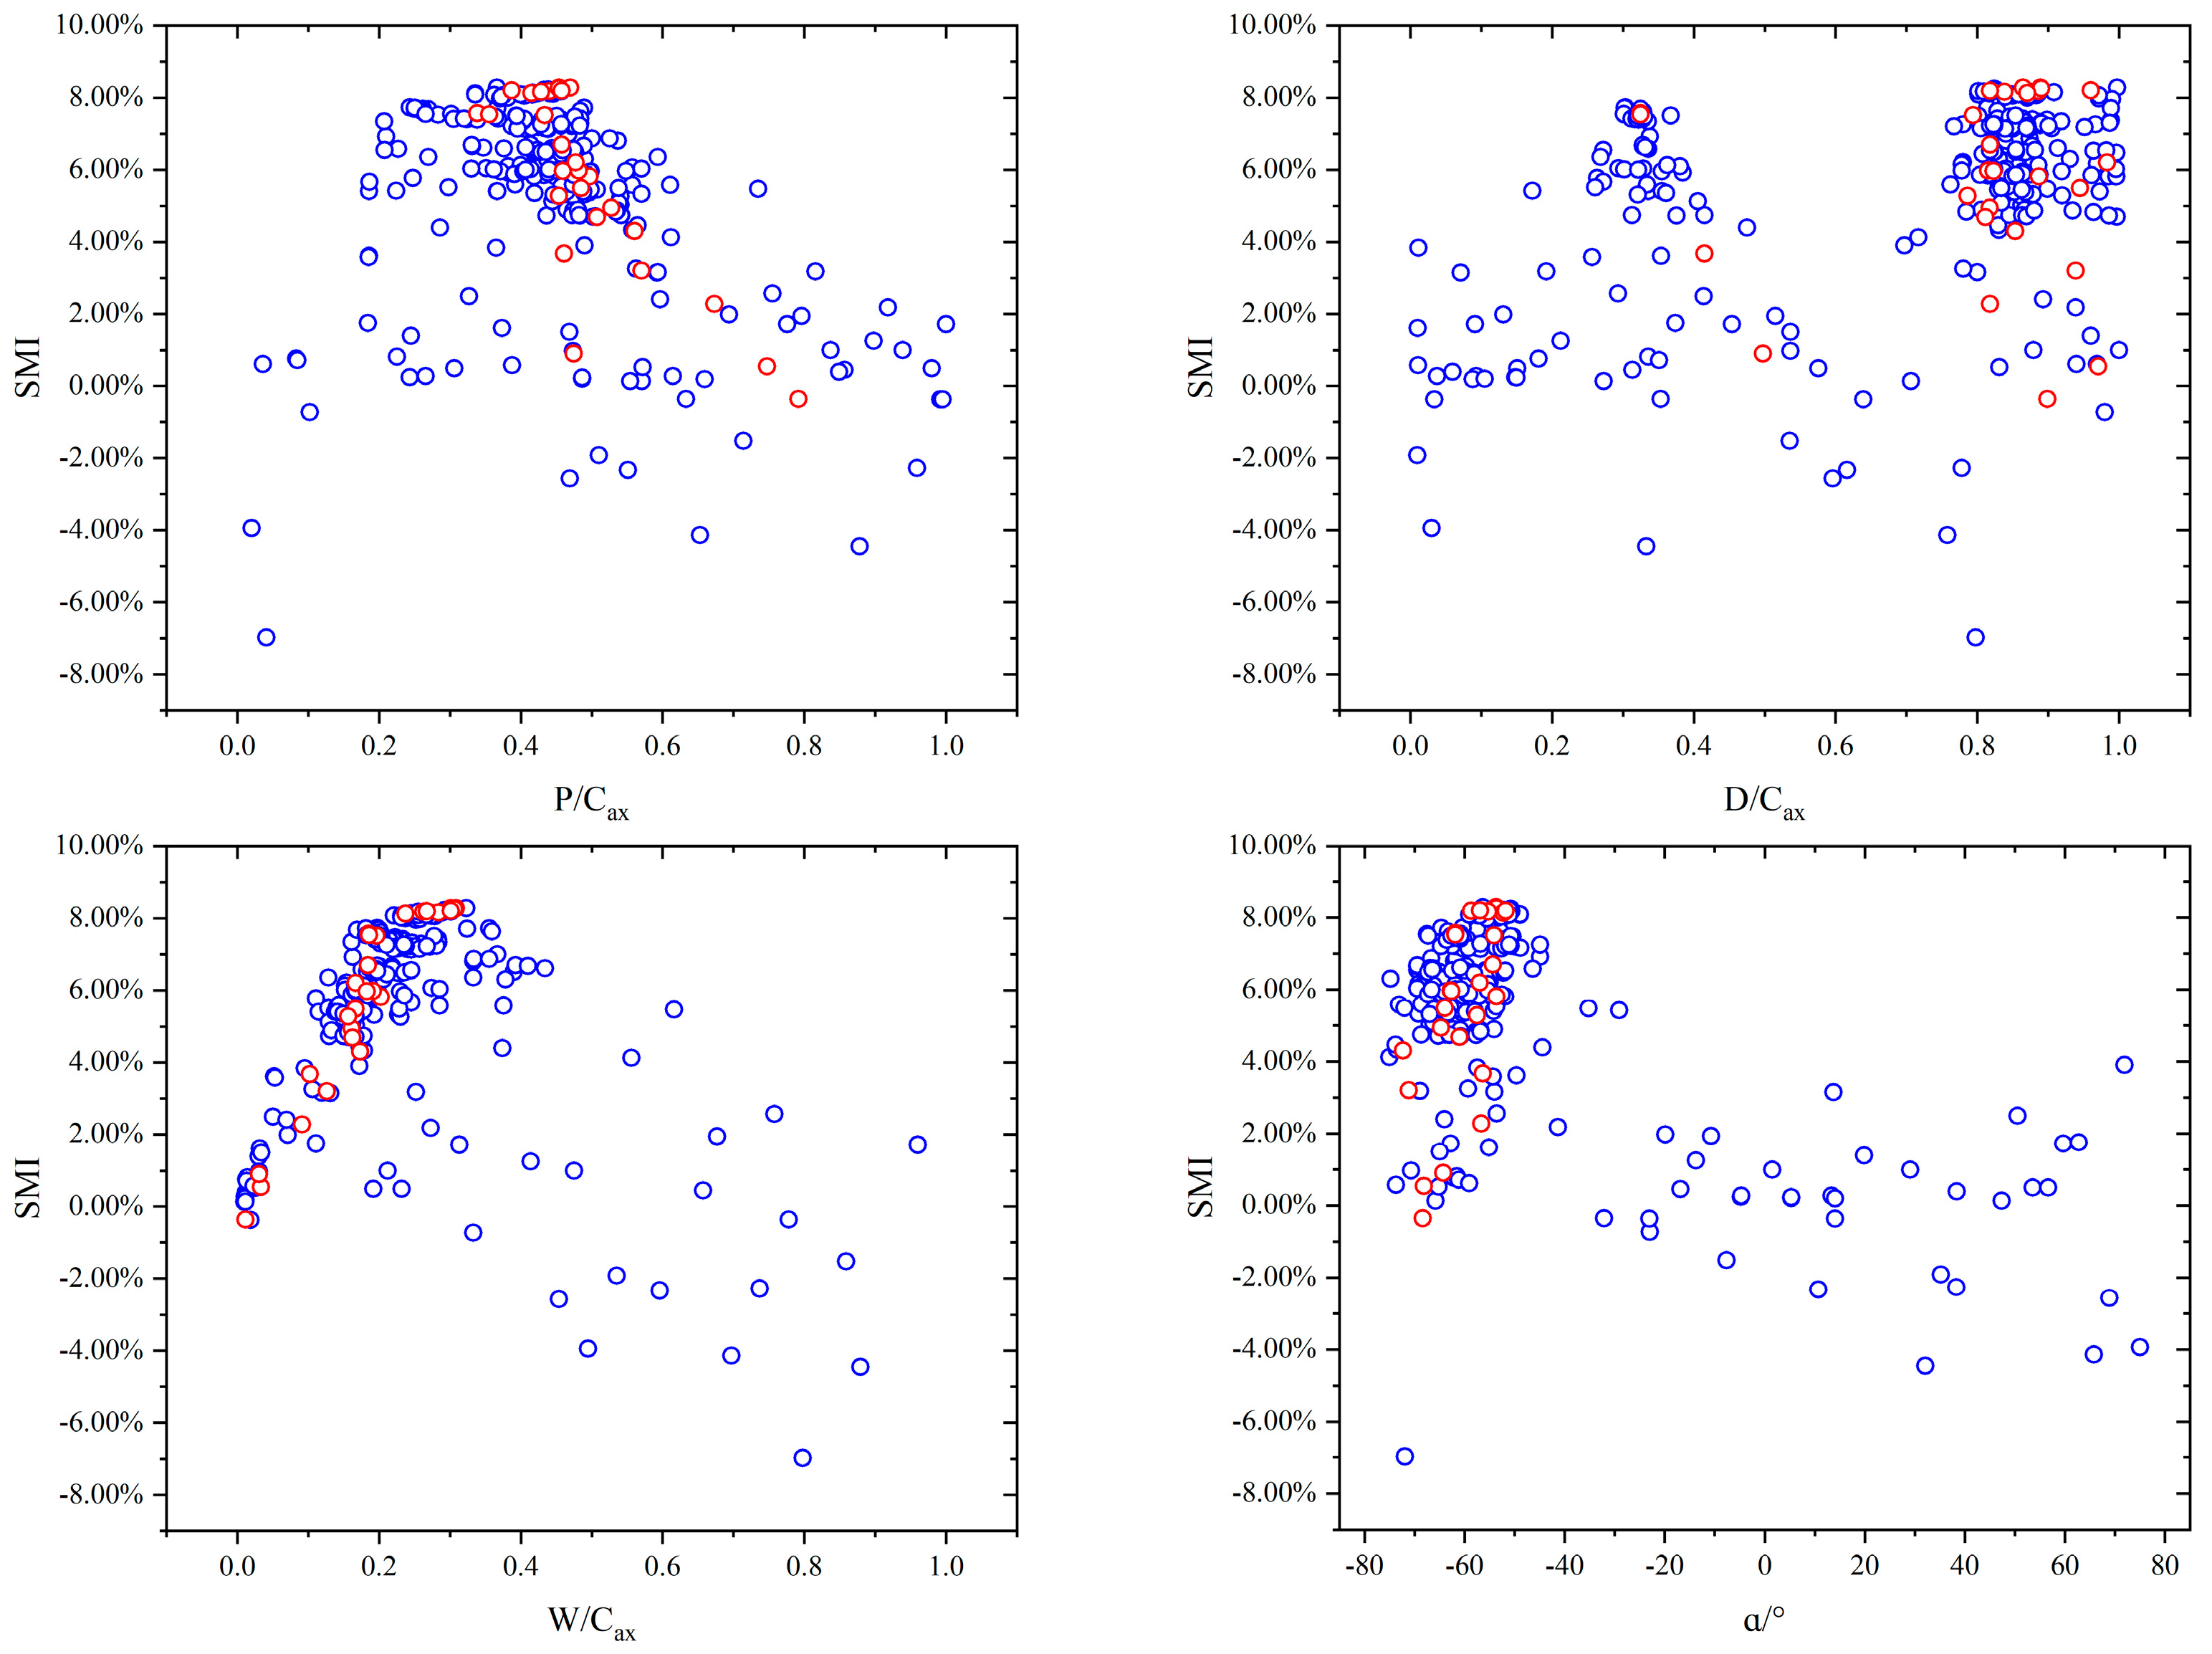
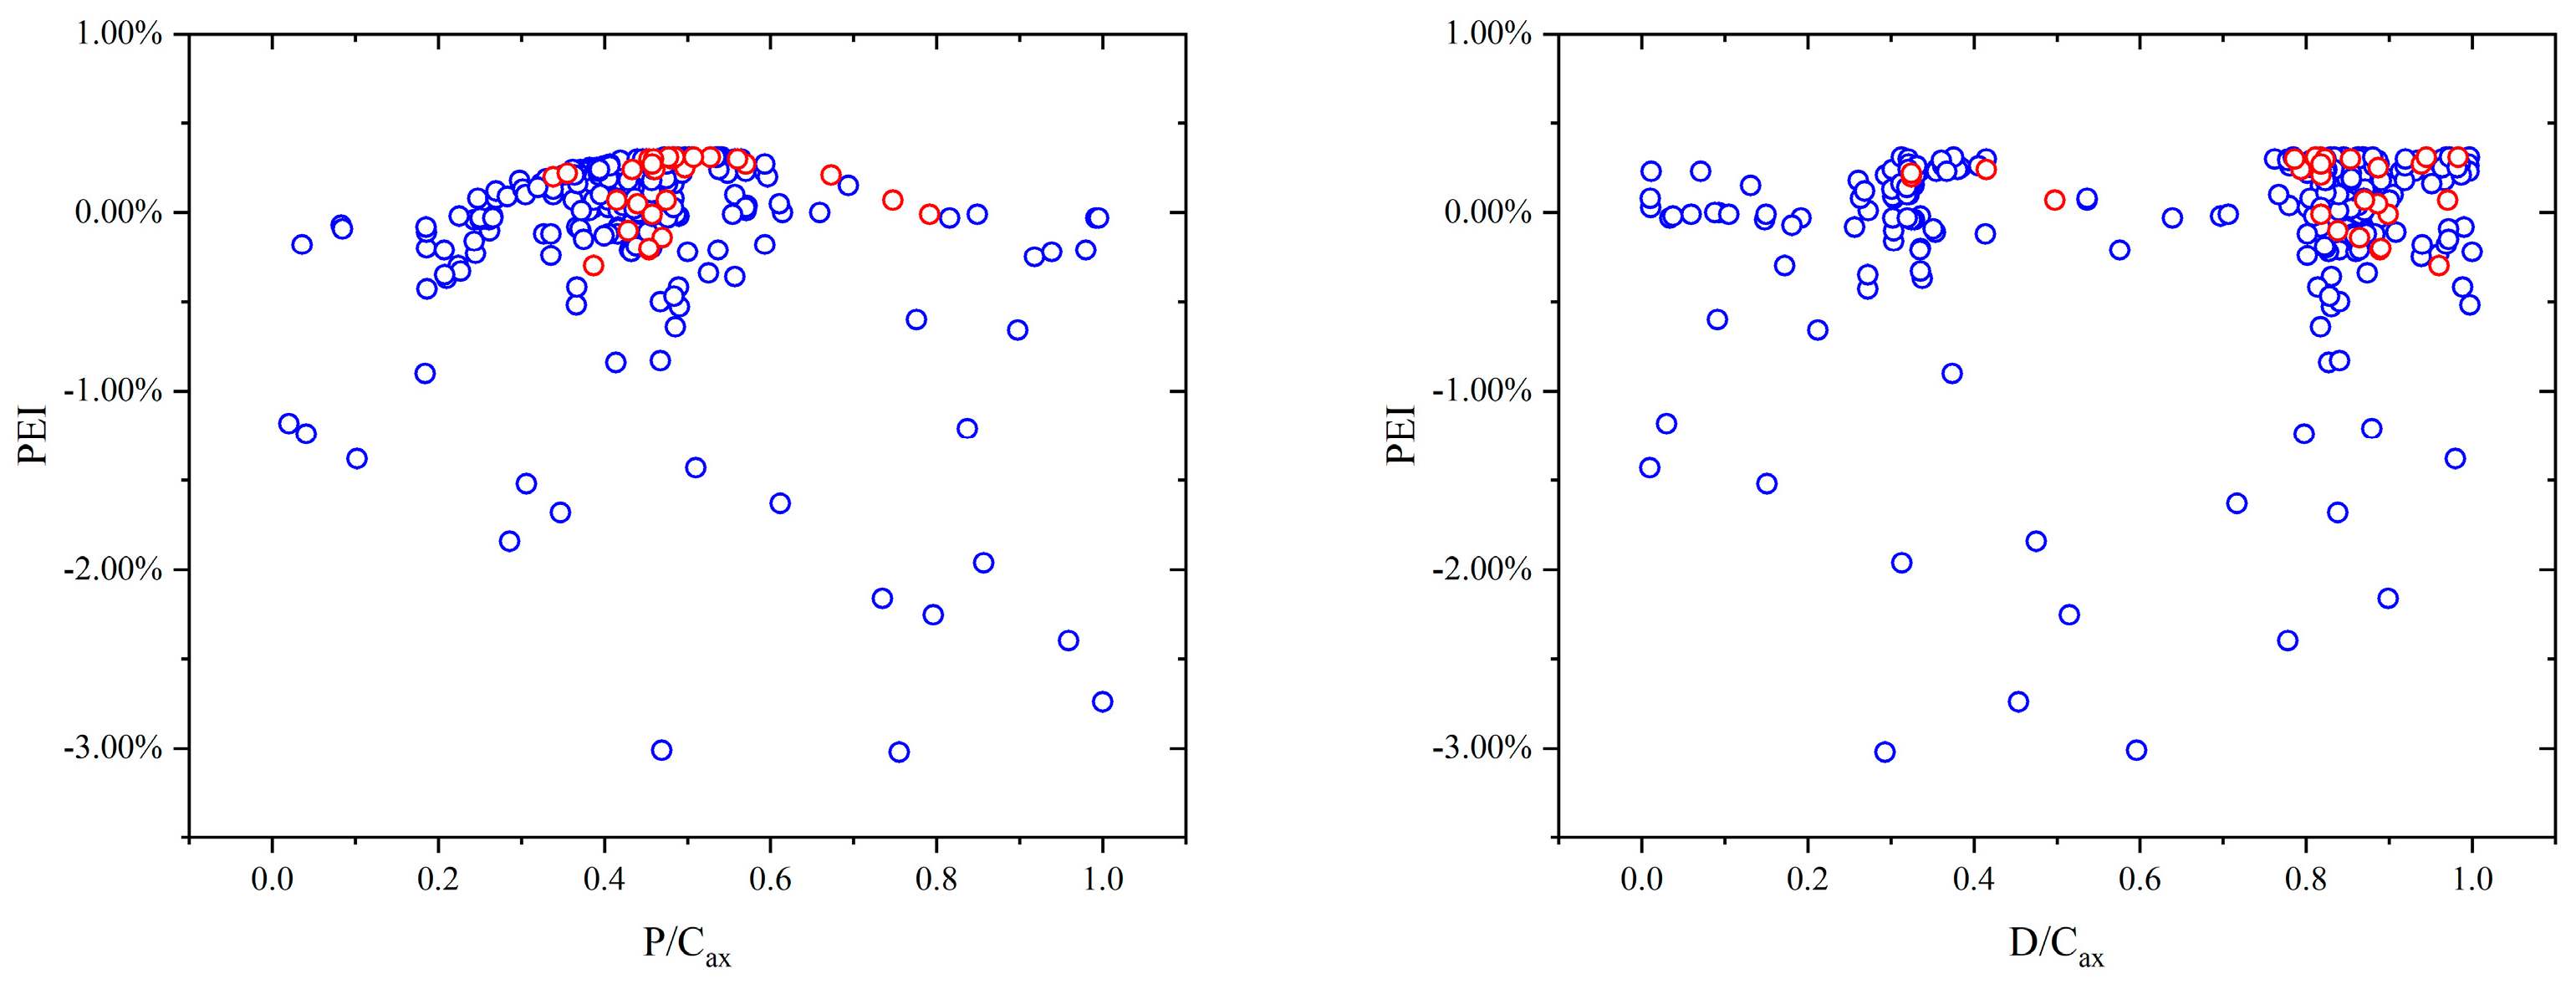
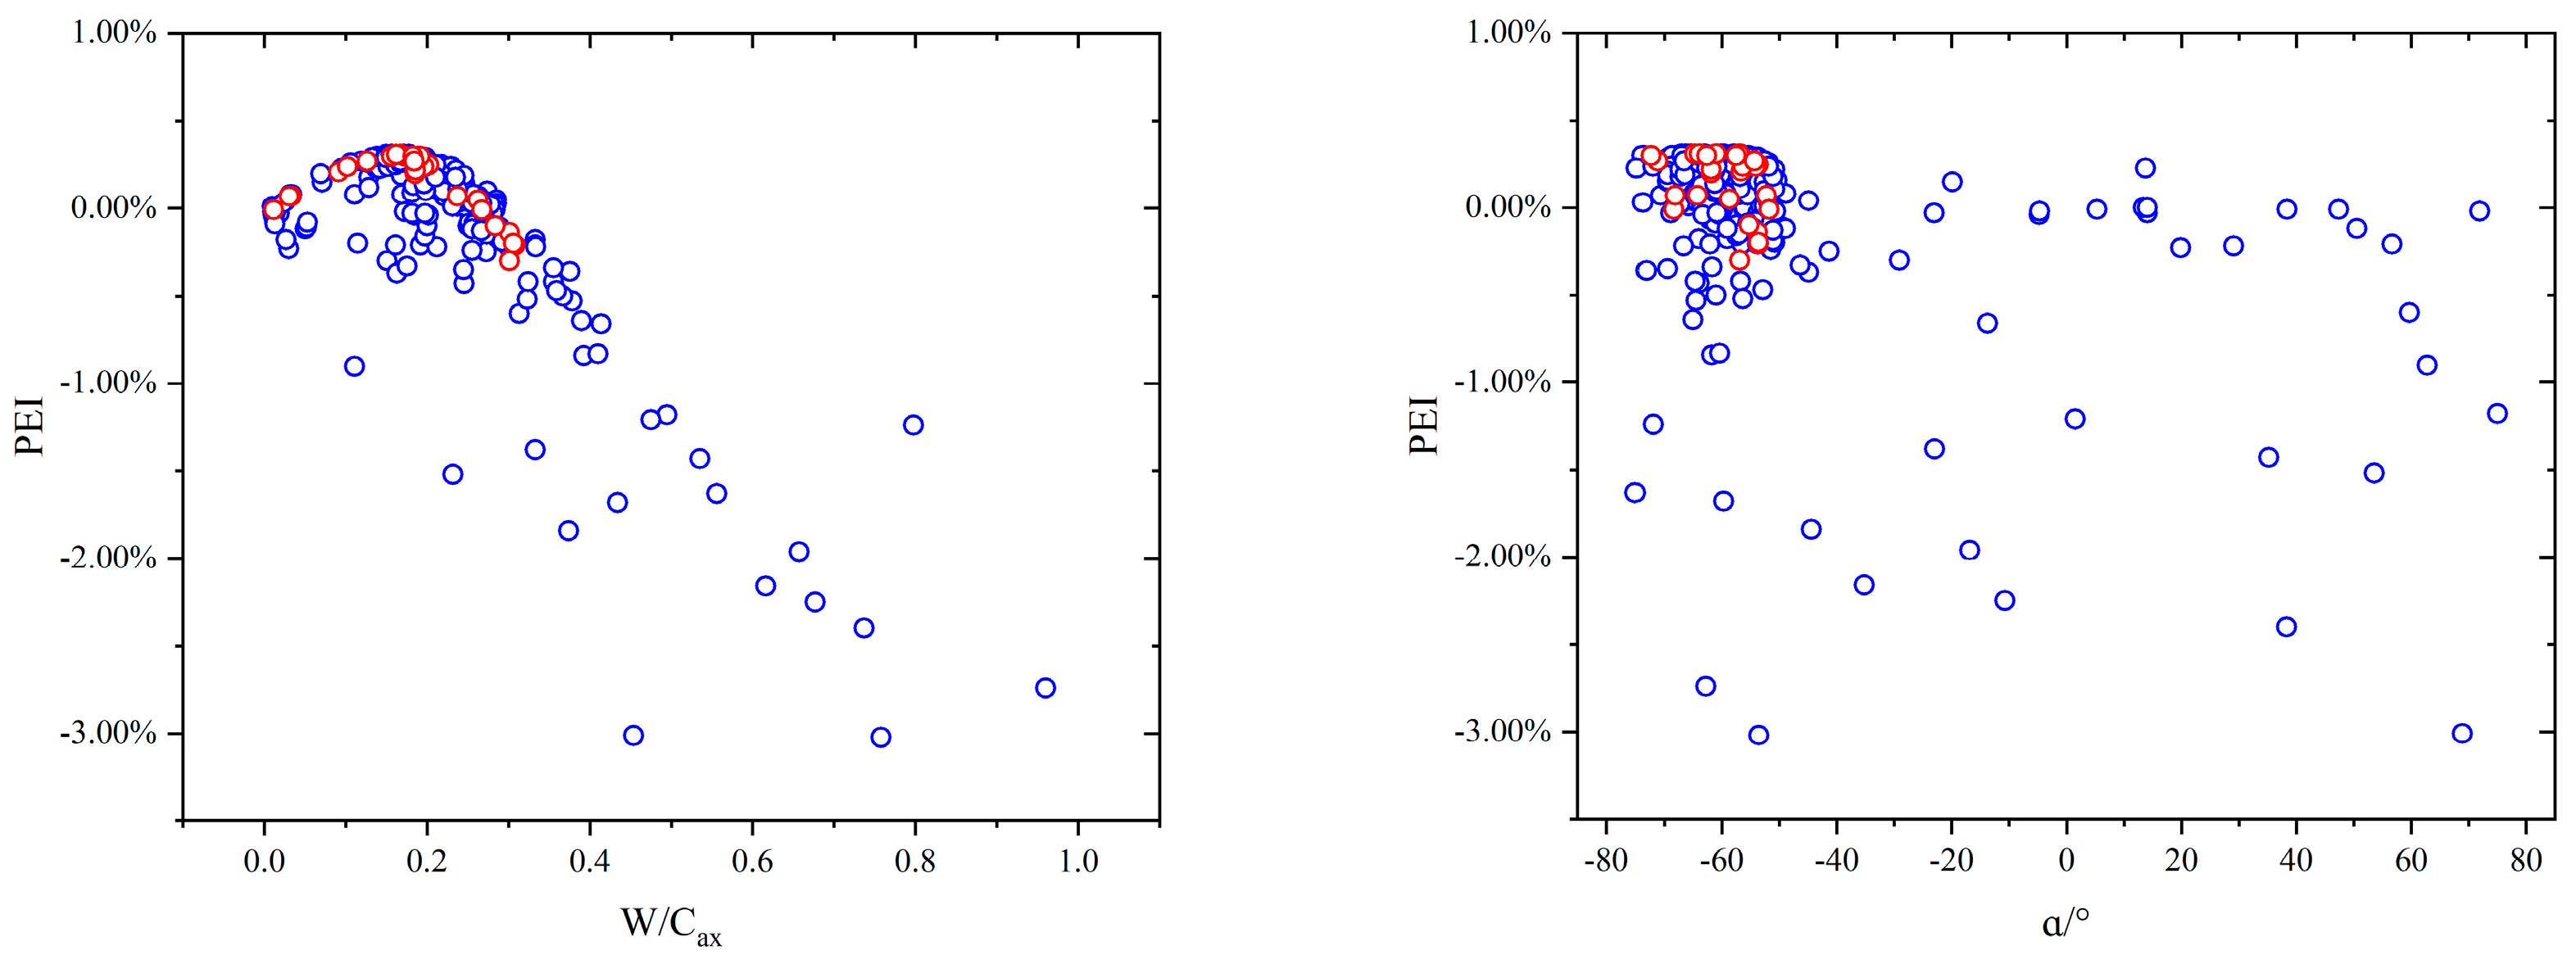
The above sensitivity analysis can only obtain the importance of the impact of design parameters on the objective function, but it cannot reveal the law of change of the objective function with the design parameters. In order to further analyze the law of change of the objective function with different design parameters, the scatter distribution of Pareto optimal solutions under the objective function SMI and PEI are first given in
Figure 11 and
Figure 12. The red bullets denote Pareto optimal solutions and the blue bullets denote all database solutions. As shown in
Figure 11 and
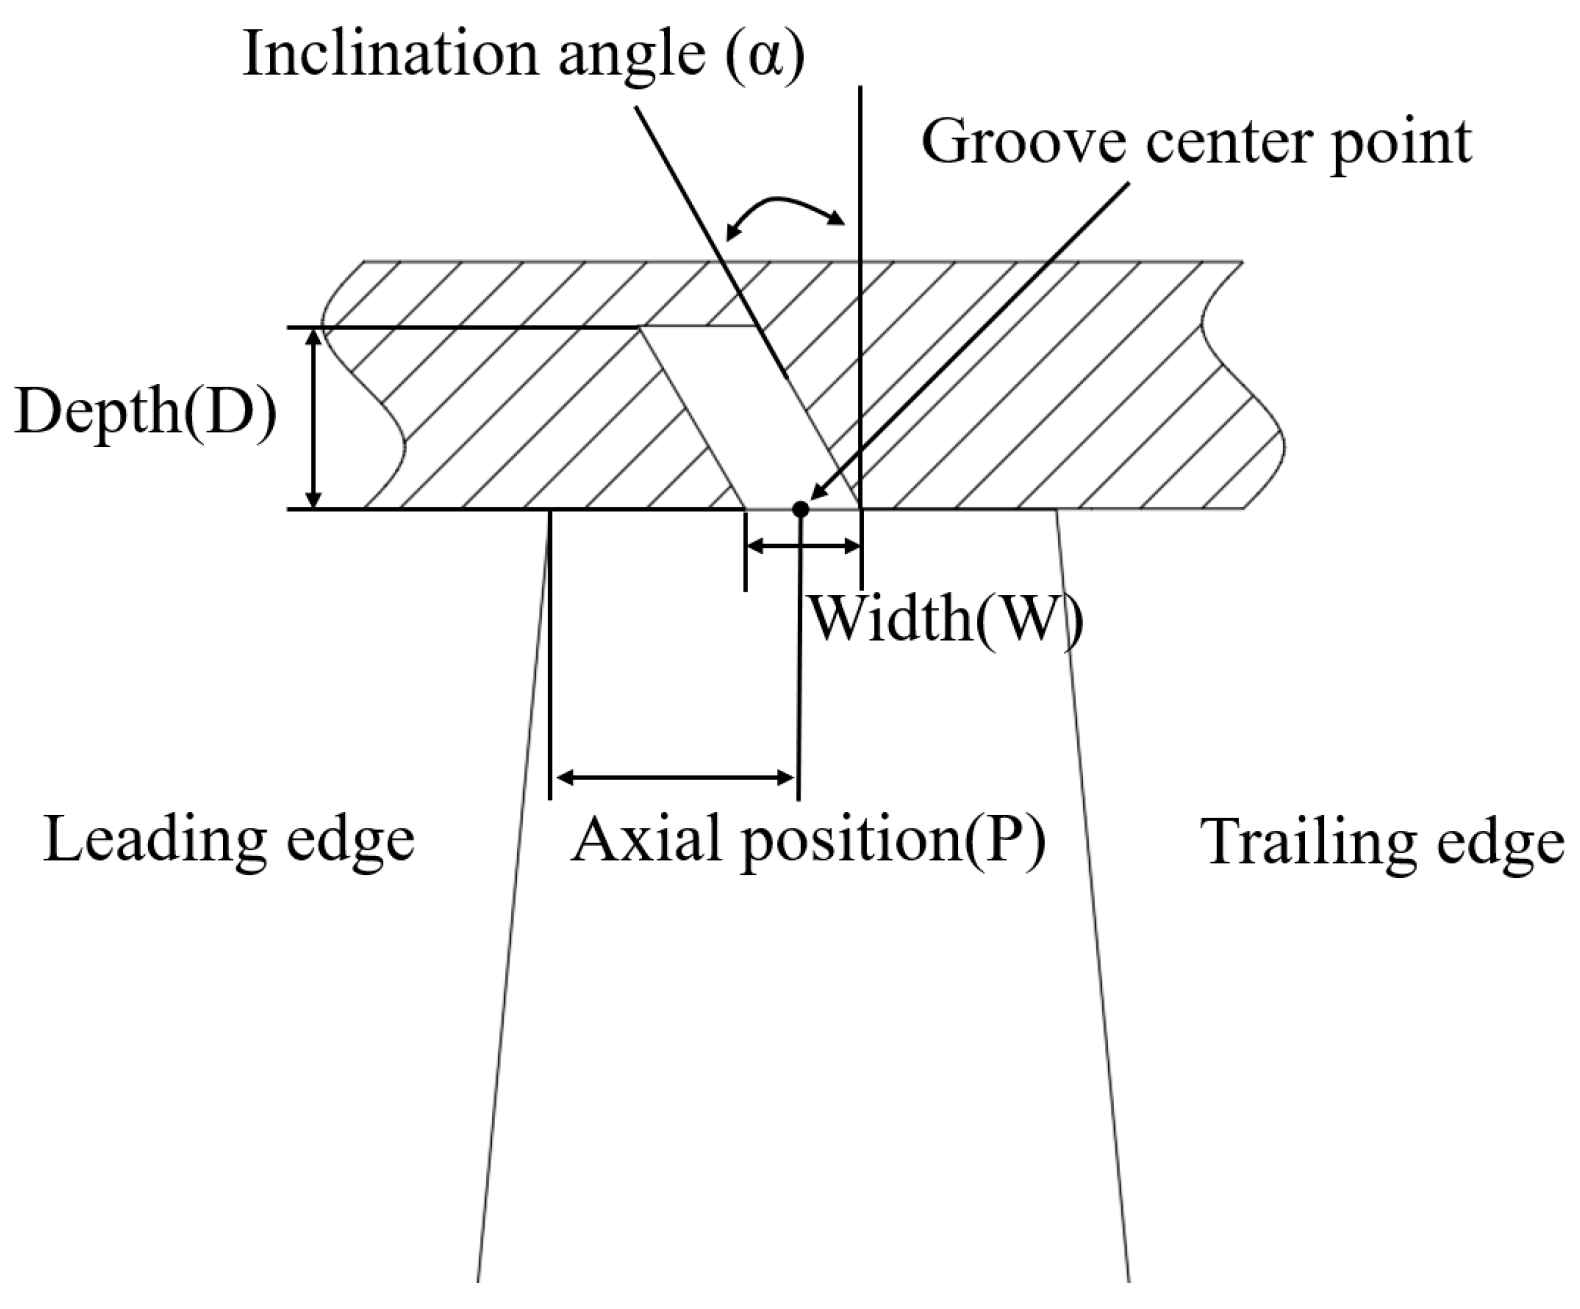
Figure 12, the red hollow circles represent the Pareto front optimal solutions, and the blue hollow circles represent all the sample points during the optimization process. Under the optimal stall margin objective function, the single circumferential groove geometry presents the following features: the groove position is close to the tip leading edge (about 0.2–0.5 C
ax), the groove is narrow (about 0.2–0.4 C
ax), the groove is inclined upstream by about −60 degrees, and the groove depth has little effect on the stall margin. Under the optimal peak efficiency objective function, the single circumferential groove geometry presents the following features: the groove position is close to about 0.4 C
ax, the groove is narrow (about 0.2 C
ax), the groove is also inclined upstream by about −60 degrees, and the groove depth also has little effect on the peak efficiency.
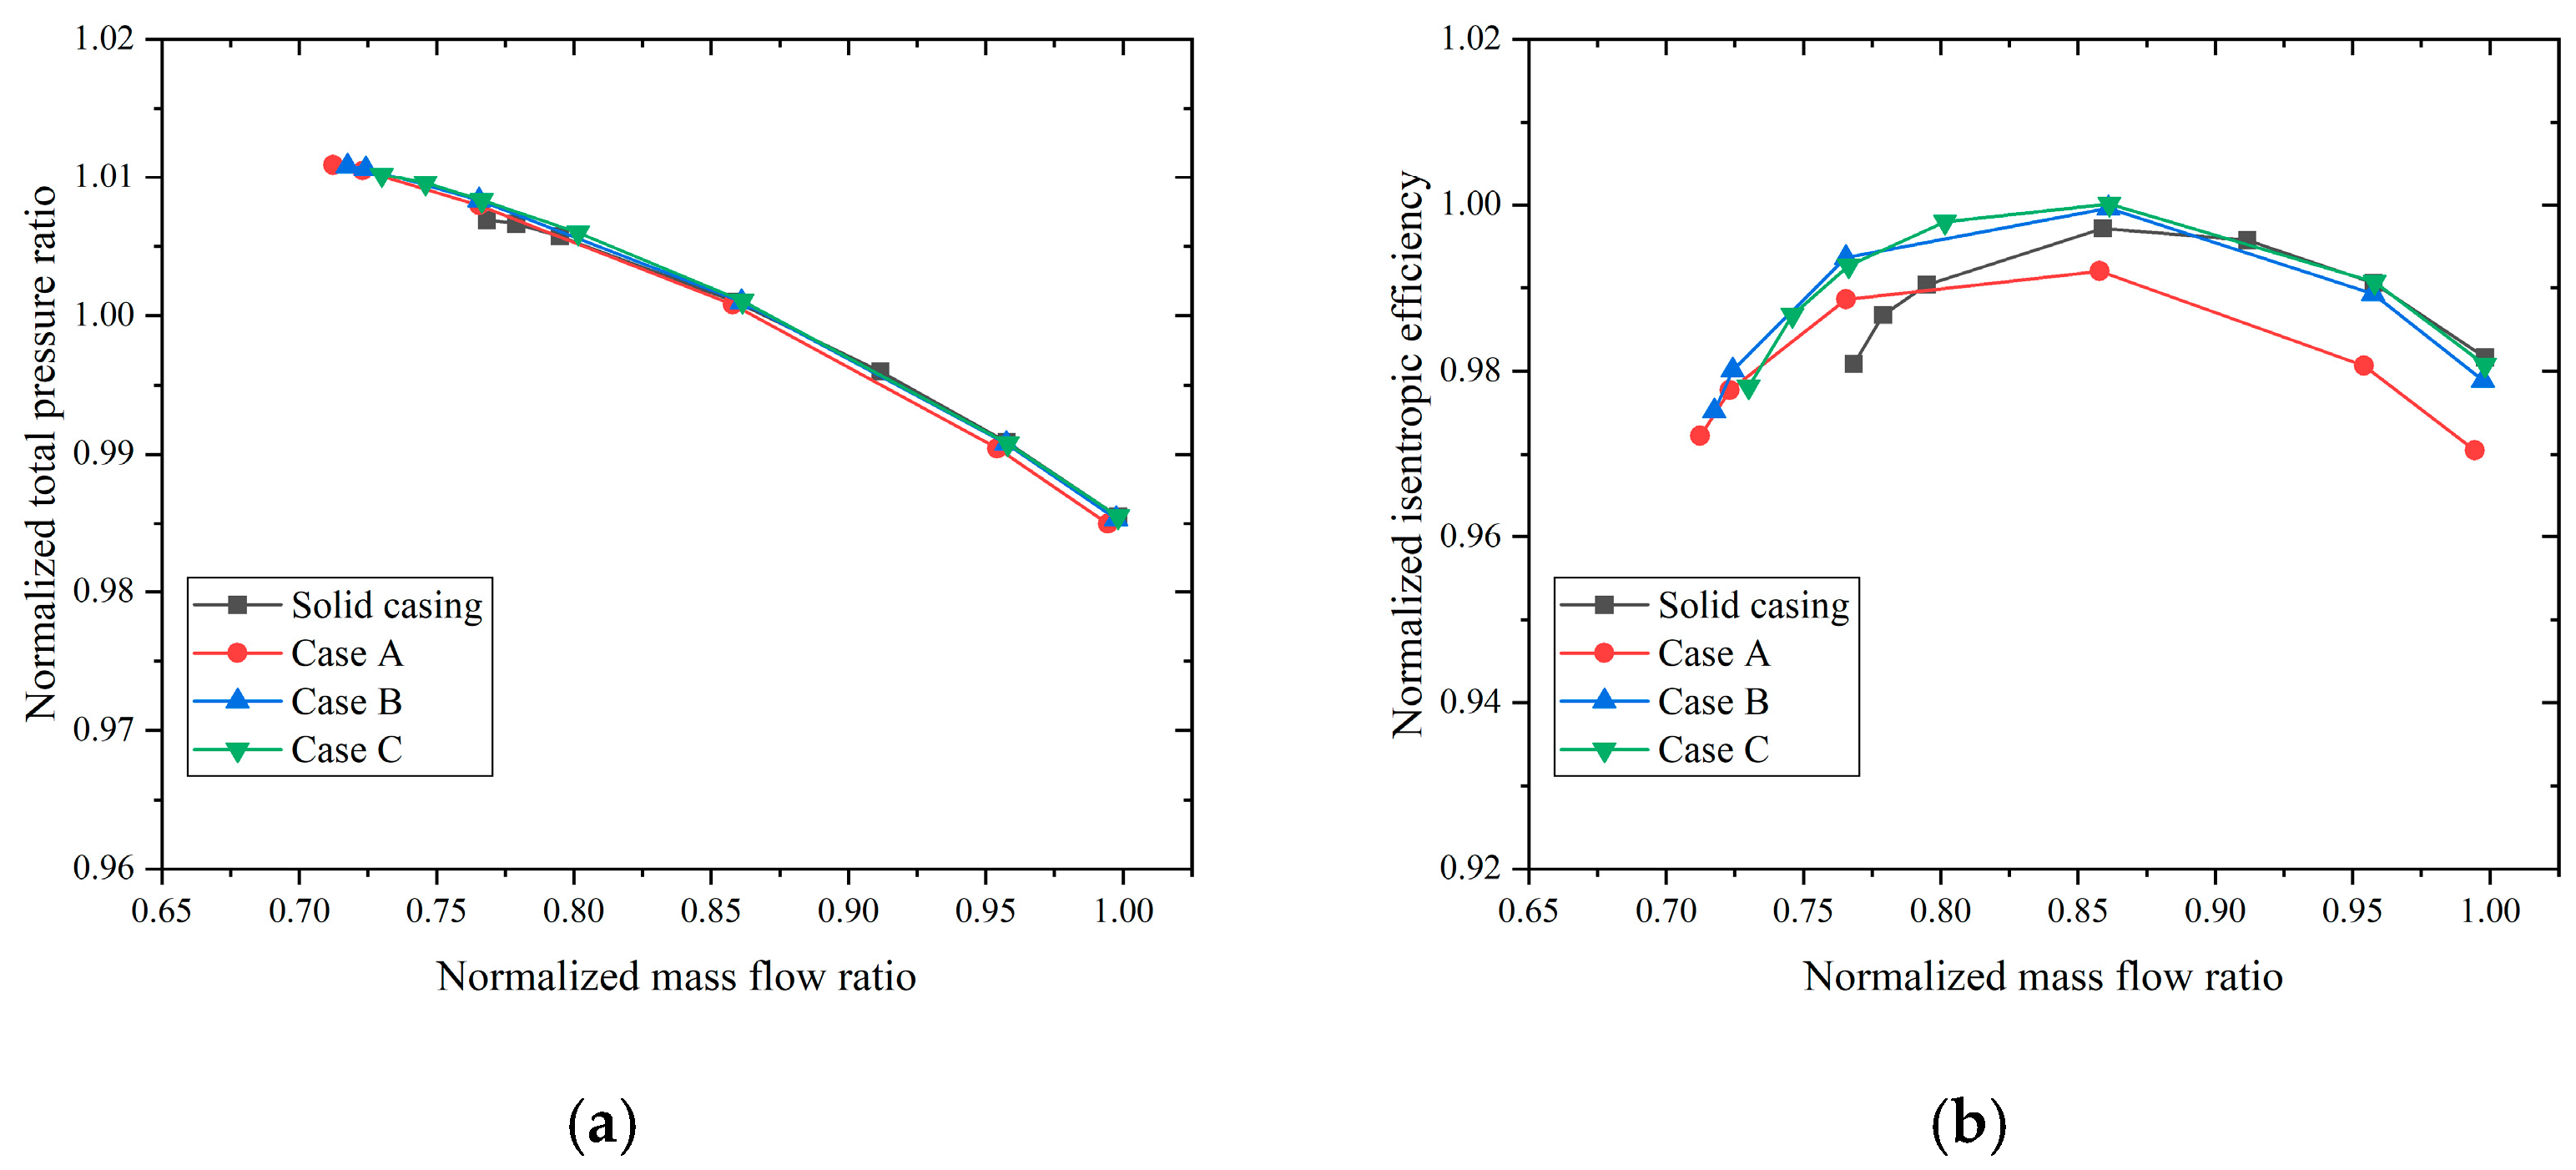
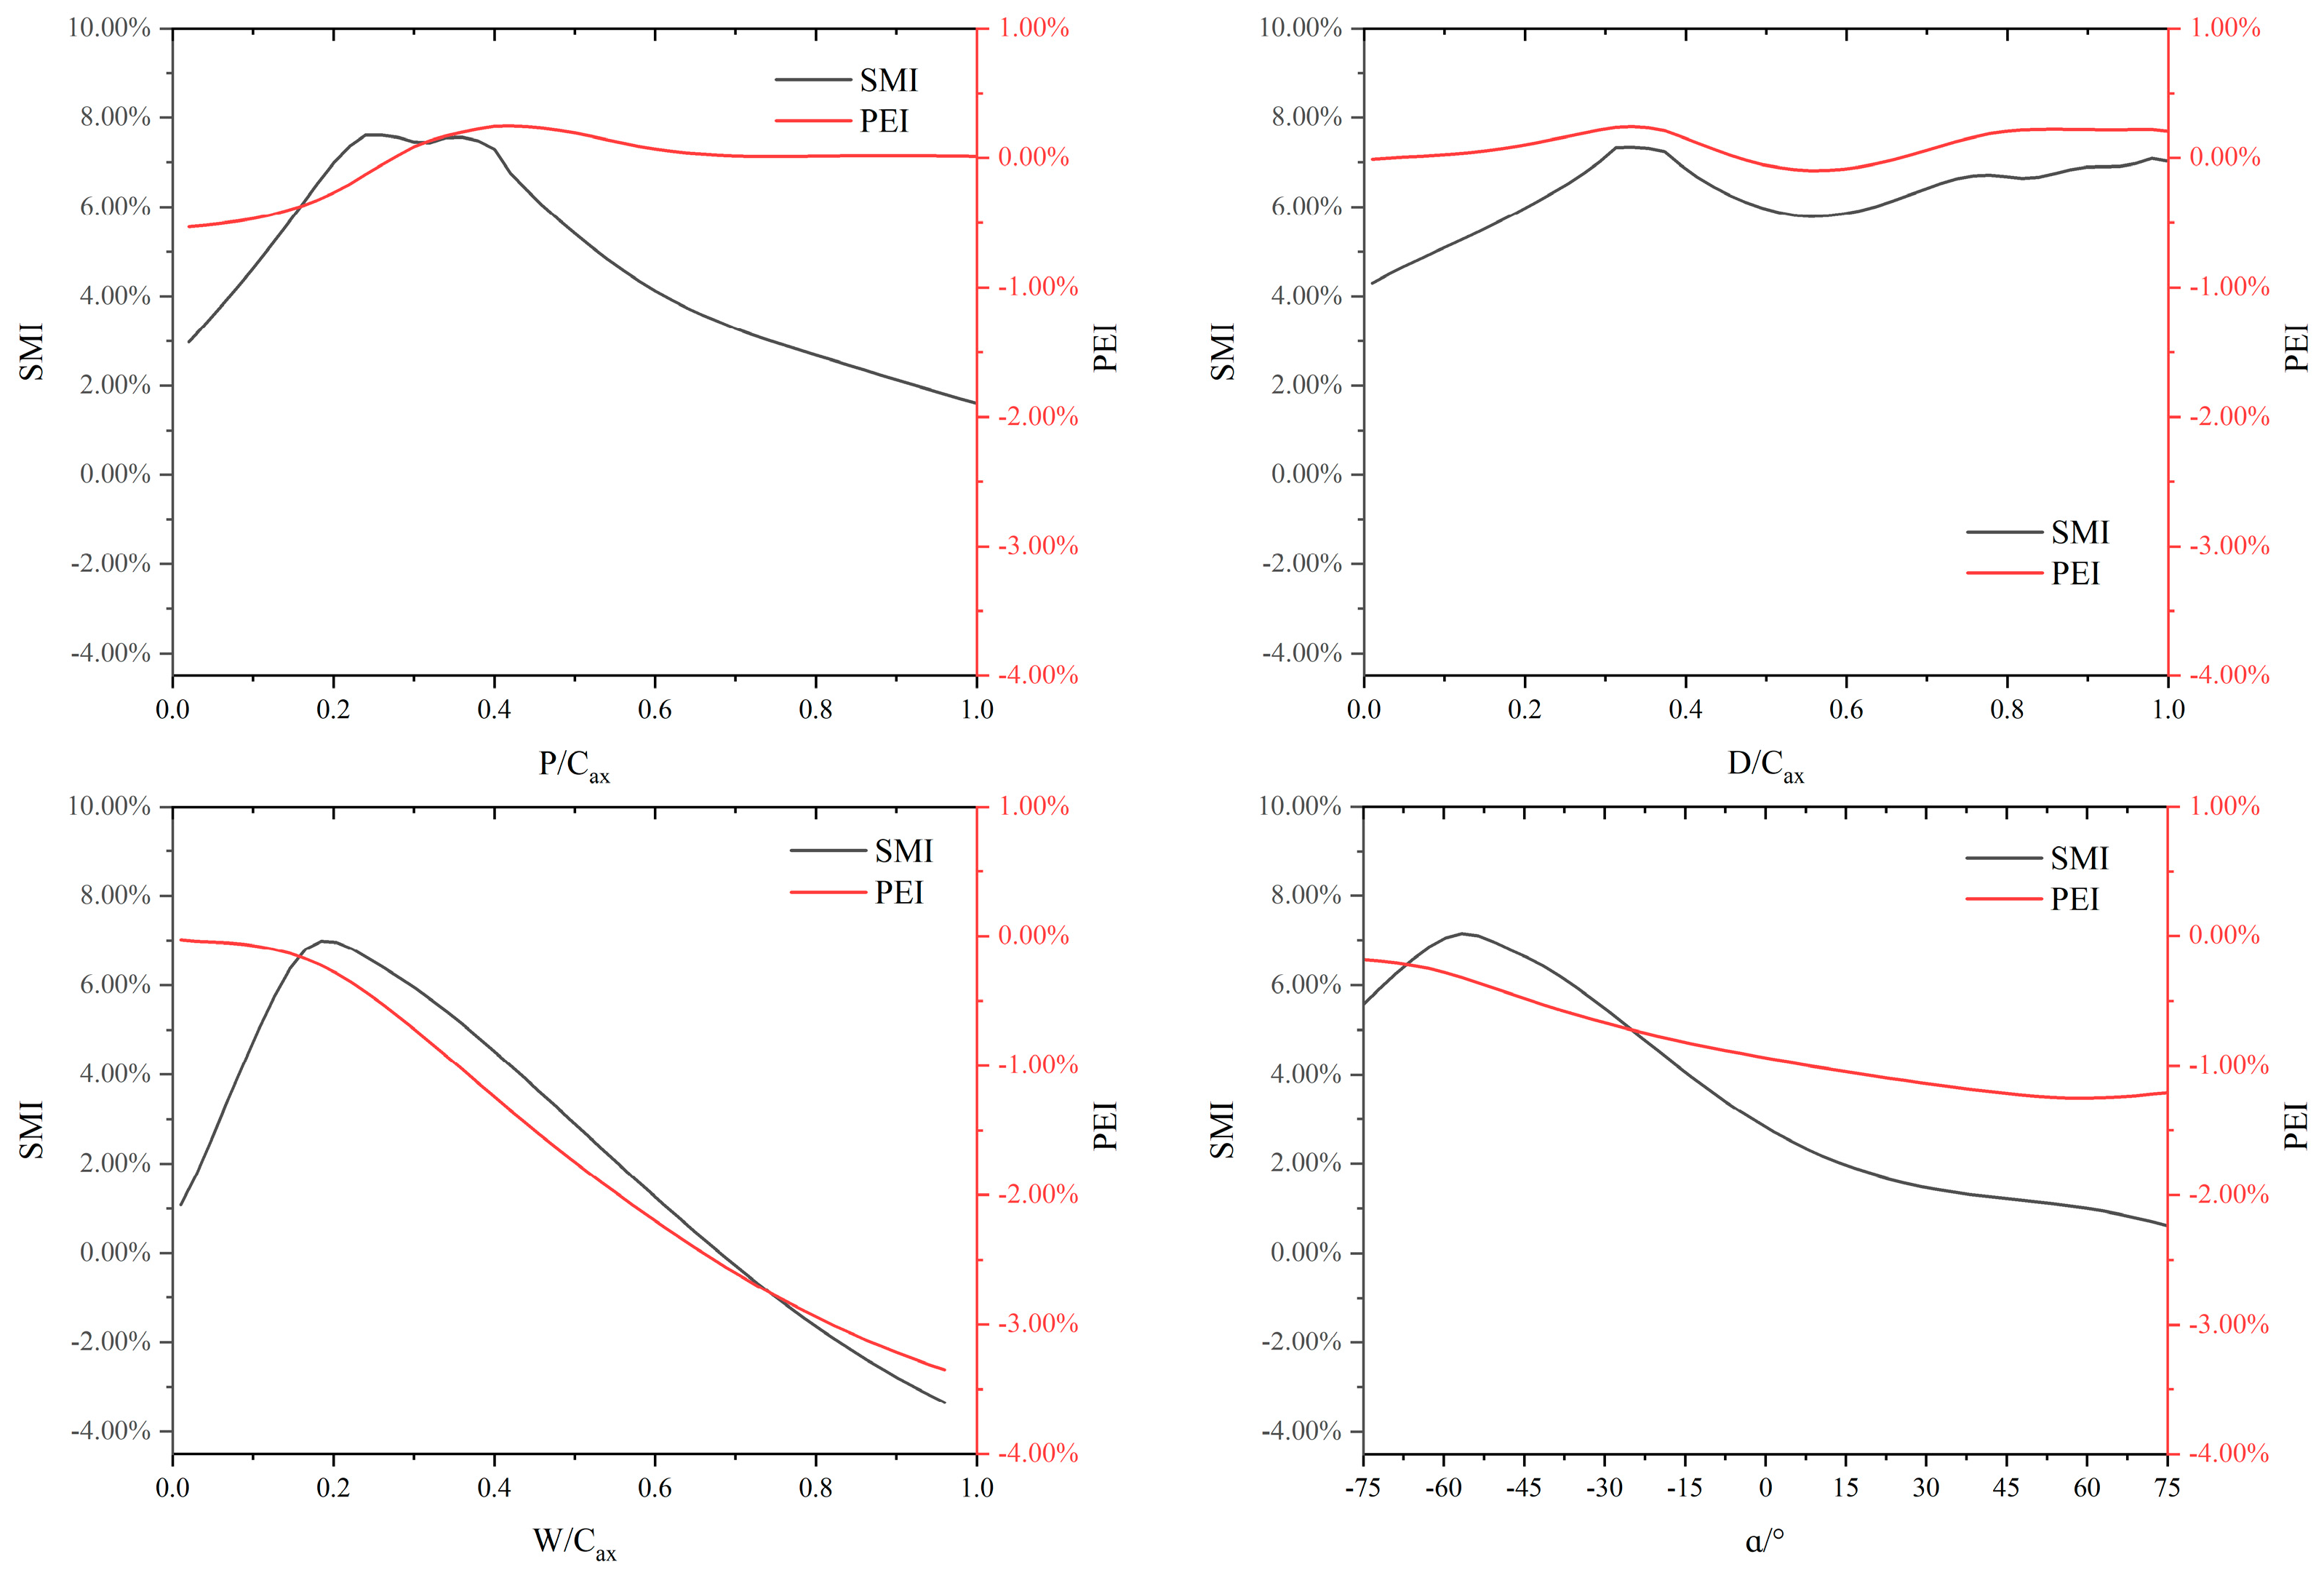
Figure 13 further shows the change curves of the predicted values of the objective function by the surrogate model when other parameters are given according to the optimal solution Case B. As shown in
Figure 13 for the groove position, its impact on SMI and PEI is not monotonic. The best stall margin improvement can be obtained when the groove position is between 0.2 and 0.4 C
ax, while the groove position has little impact on the peak efficiency. However, the best peak efficiency improvement can be obtained when the groove position is about 0.4 C
ax. For the groove depth, its impact on SMI and PEI is very small, and both shallow and deep grooves can obtain the best objective function value. For the groove width, its impact on SMI and PEI is relatively large. The best stall margin improvement can be obtained when the groove width is about 0.2 C
ax, while a smaller groove width can obtain a larger peak efficiency improvement. For the groove inclination angle, the best stall margin improvement can be obtained when the groove is inclined upstream by about 60 degrees. Additionally, a larger upstream inclination angle can lead to a larger peak efficiency improvement.
RBF neural network surrogate models are trained on a large number of samples to obtain the prediction ability of the model output. However, the predicted laws are difficult to guarantee to be completely consistent with the actual situation due to the lack of constraints on the physical mechanism and strong dependence on samples. However, based on the previous parameter analysis, the basic laws of the influence of single circumferential groove design parameters on SMI and PEI can be summarized as follows: the groove position close to the tip leading edge (0.2–0.5 Cax) can obtain a larger stall margin improvement, and the groove position is near about 0.4 Cax can obtain the best peak efficiency improvement. The groove depth has little influence on the stall margin and peak efficiency. The groove width has a greater influence on the stall margin and peak efficiency. A narrow groove (about 0.2–0.4 Cax) can obtain the best stall margin improvement and peak efficiency improvement. When the groove is inclined upstream by a certain angle (about 60 degrees), the best stall margin improvement and peak efficiency improvement can be obtained.
3.3. Analysis of Flow Mechanism
To further elucidate the inherent flow mechanism of the circumferential single-groove structures on the Pareto front, a flow mechanism analysis was conducted for three typical circumferential single-groove structures. Based on our previous research experience, the application of circumferential groove casing treatment significantly alters the flow structure in the blade tip region of compressors, particularly the flow structure of the blade tip leakage flow.
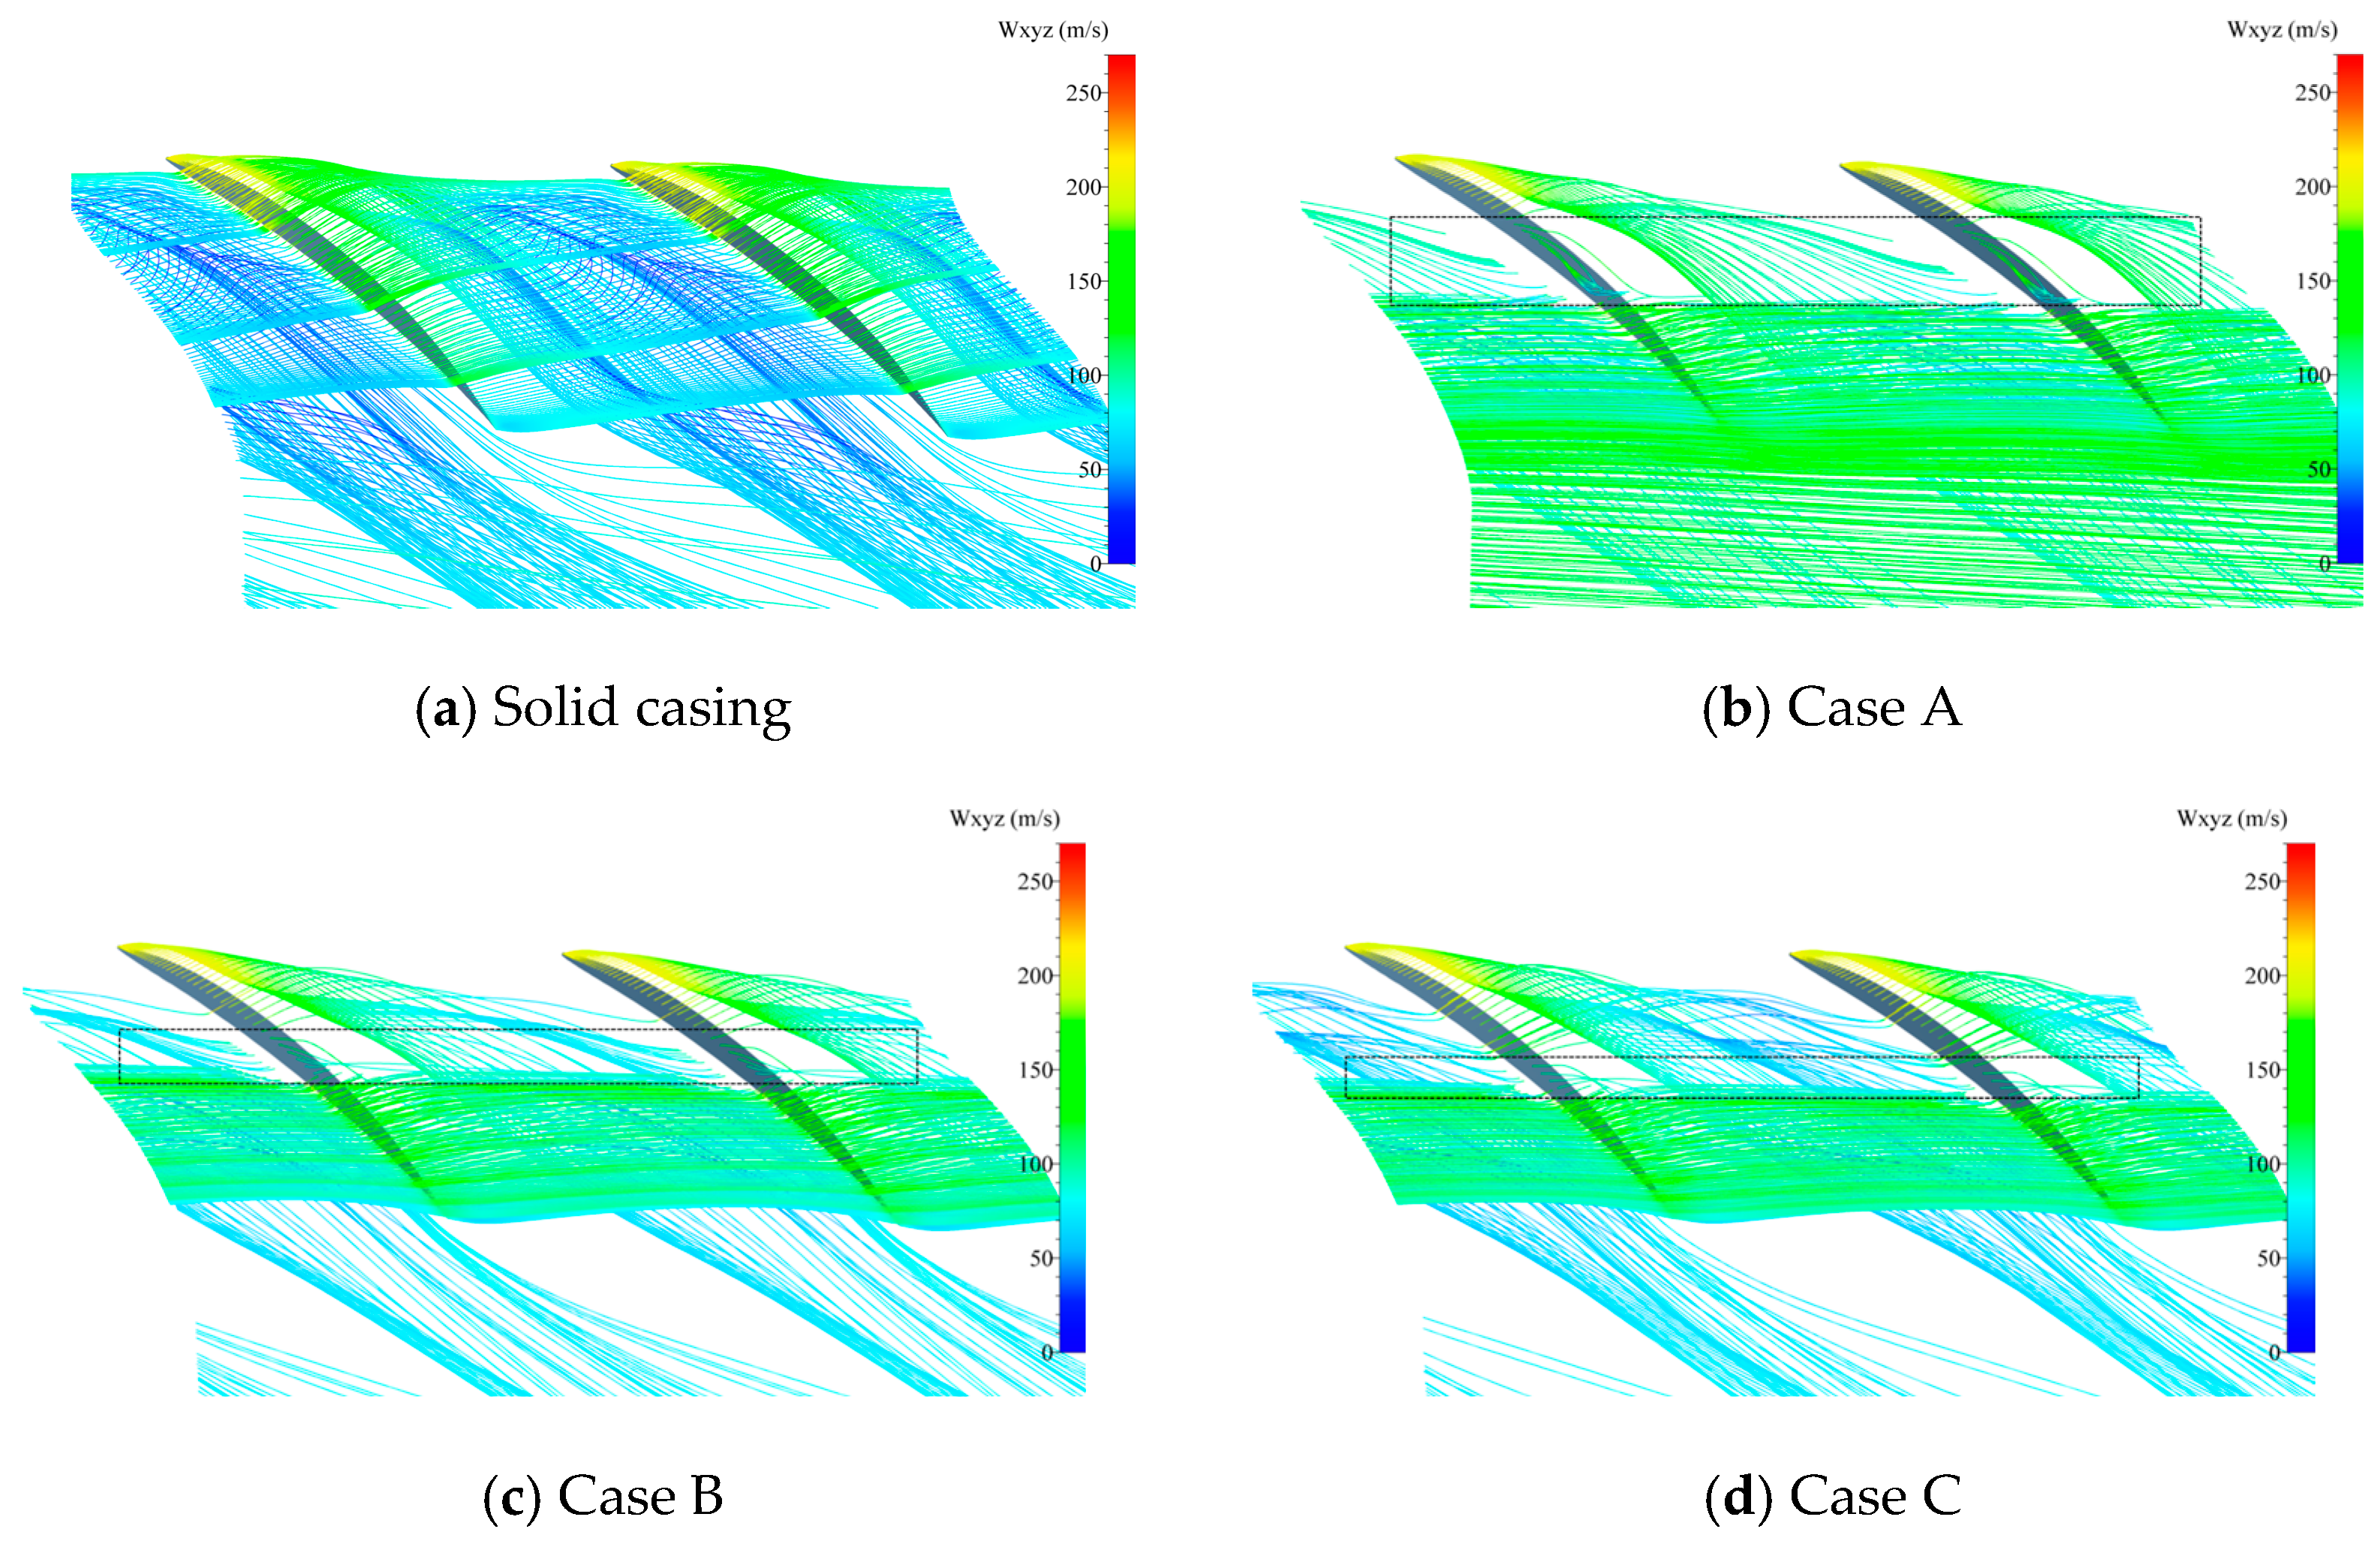
Figure 14 shows the distribution of tip leakage flow under the same near-stall condition of solid casing, with solid casing and three groove structures. And the tip leakage flow lines are rendered by the value of relative velocity. It can be seen from
Figure 14a that under the near-stall condition of the solid casing, the tip leakage flow fills the entire blade tip passage. The tip leakage flow is expanded and dispersed, and it is almost parallel to the line connecting the blade tip’s leading edge. This seriously hinders the flow of air at the blade tip passage. However, when a circumferential single groove is applied, the tip leakage flow becomes significantly more concentrated, and the tip leakage flow is significantly shifted towards the blade suction surface. The tip leakage flow is significantly removed, so the degree of blockage of the blade tip passage is significantly reduced.
Figure 14 clearly shows that the Case A solution exhibits the greatest reduction and concentration of blade tip leakage flow streamlines. This indicates that the Case A solution has the strongest suppressive effect on the leakage flow, leading to the largest improvement in stall margin.
Figure 15 further illustrates the entropy distribution of 99% span at the same near-stall condition of solid casing. The interface between the tip leakage flow and the mainstream can be easily distinguished from the interface between high entropy value and low entropy value. When the solid casing is at near-stall condition, the interface between the tip leakage flow and the mainstream is almost flush with the line connecting the blade tip leading edge. This significantly hinders the flow of mainstream, ultimately leading to the stall of the compressor. However, when a circumferential single groove is applied, it can be clearly observed that the interface between the tip leakage flow and the mainstream is shifted towards the suction surface of the adjacent blade. And the shift of the Case A solution is slightly larger than that of the other two circumferential single-groove structures. Therefore, the Case A solution has the best improvement effect on the blade tip passage of the compressor and thus obtains the largest stability margin improvement among these three groove structures.
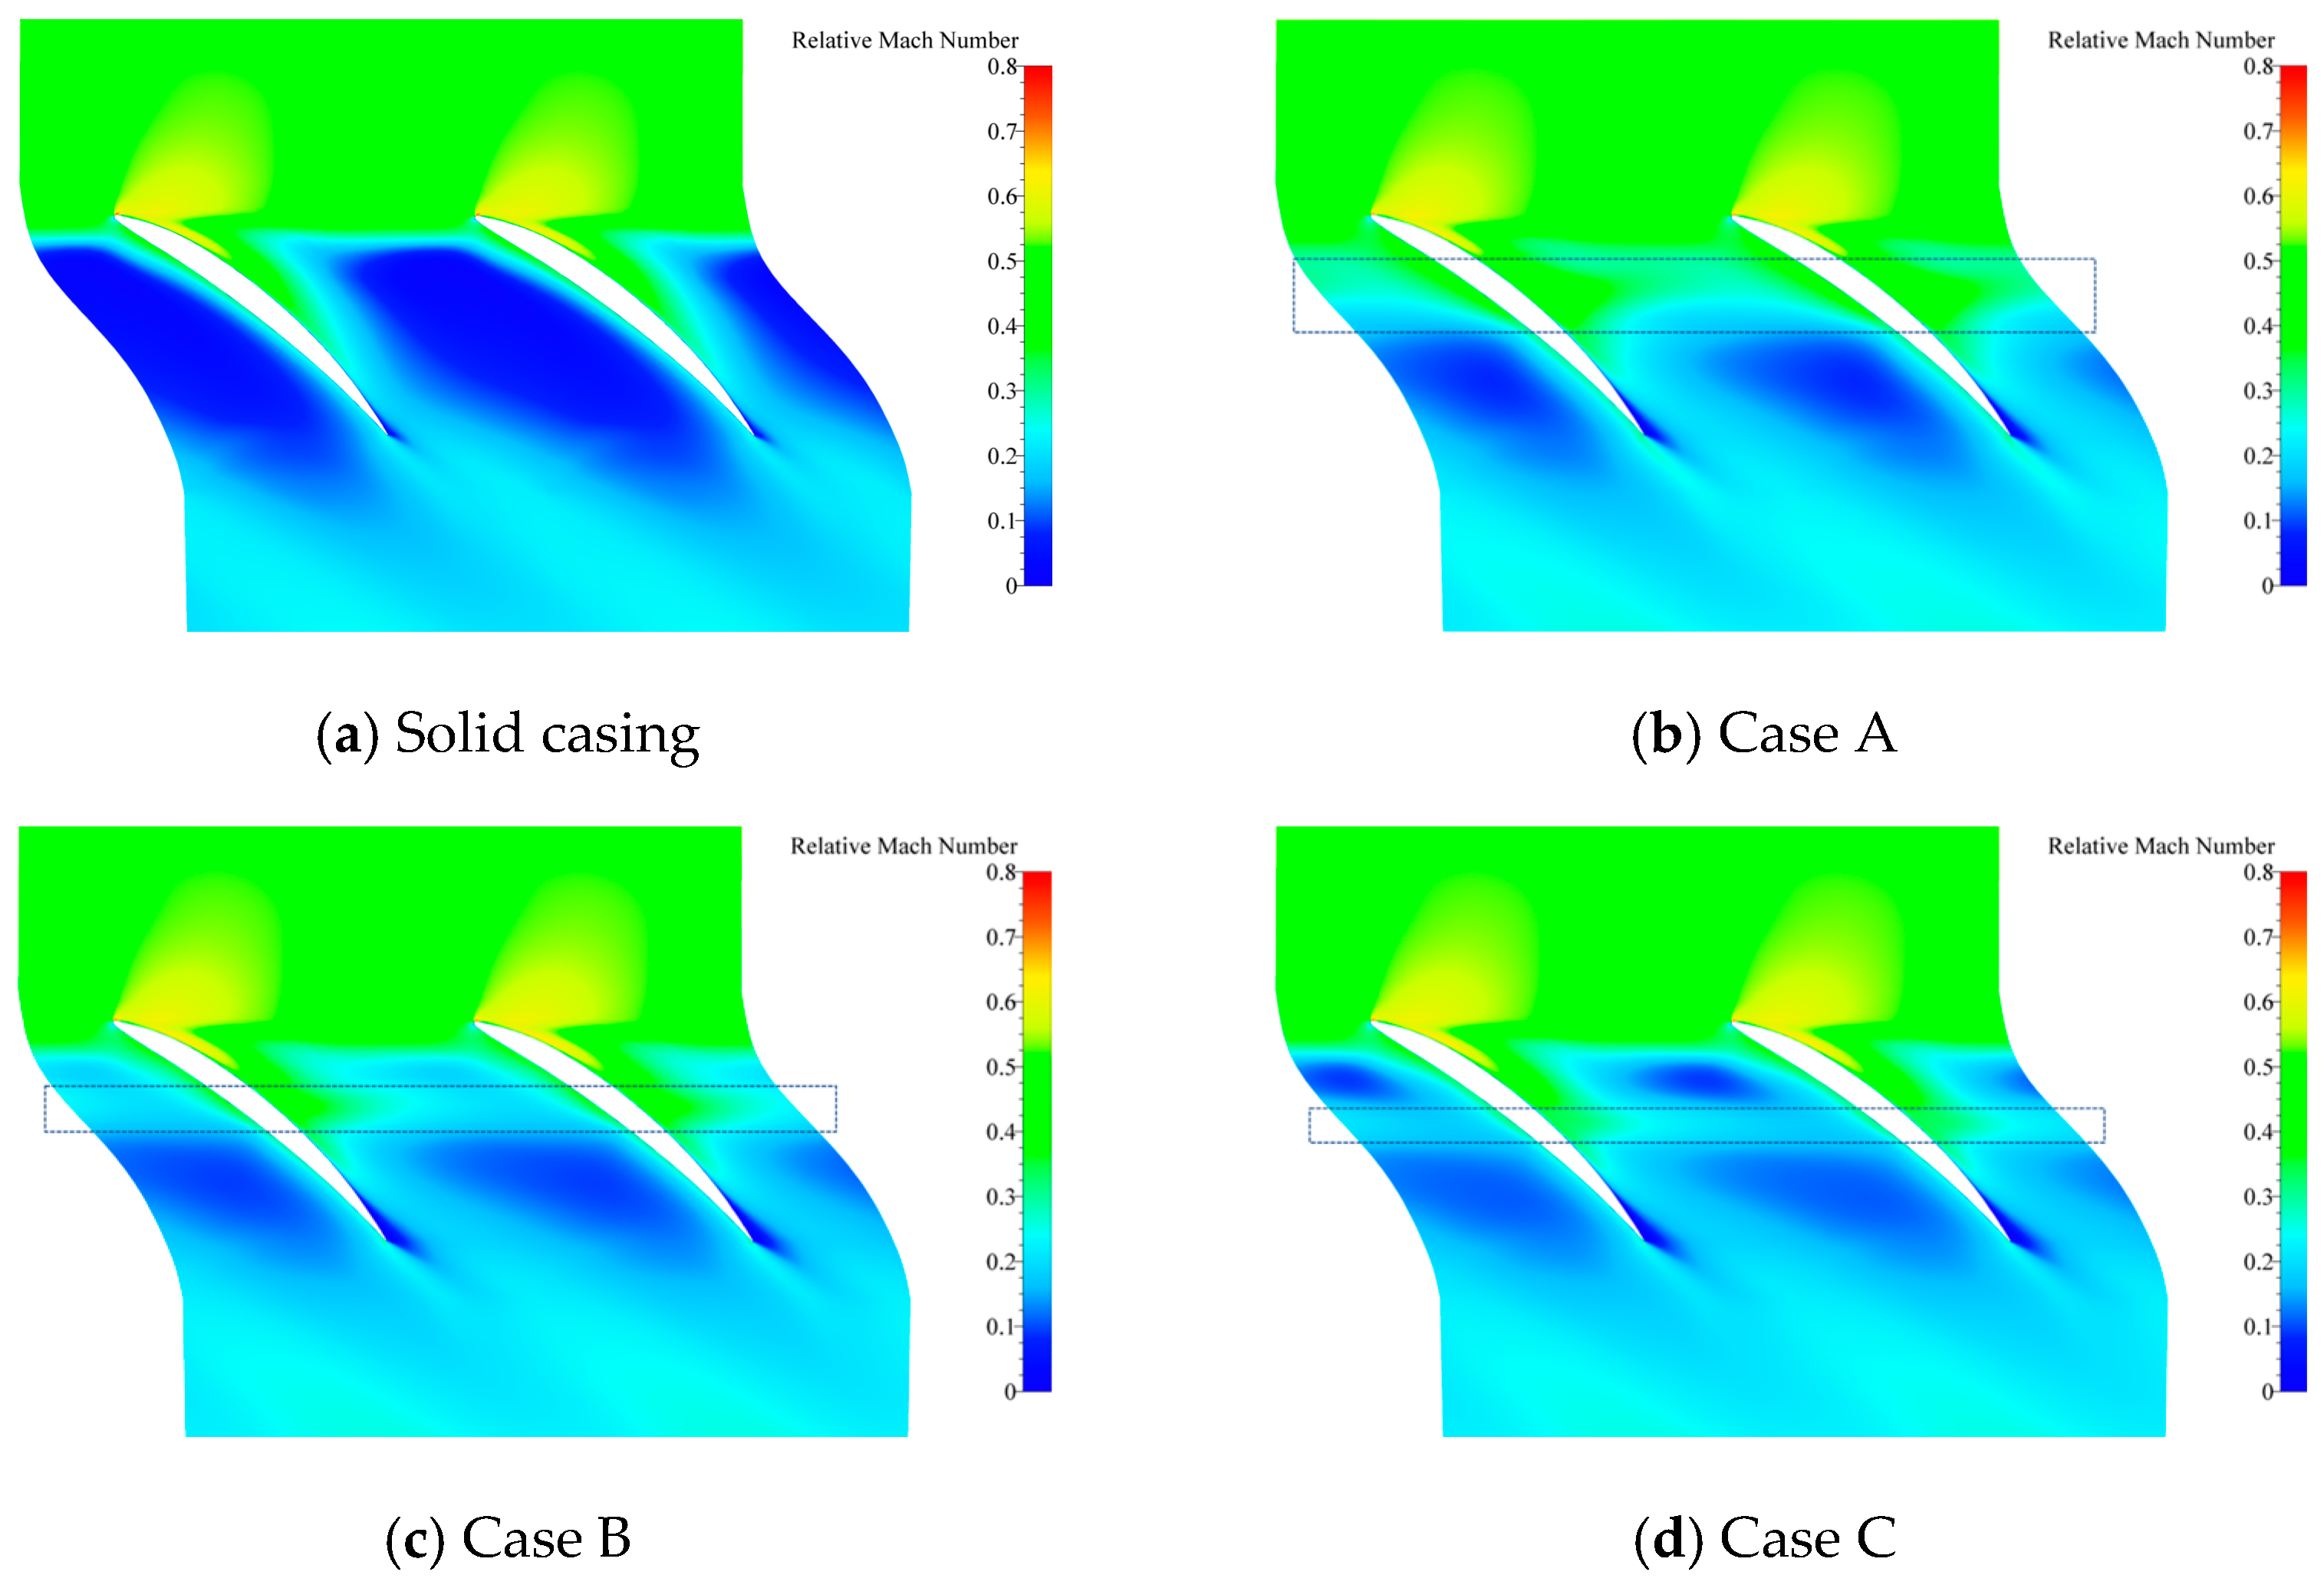
Figure 16 further shows the relative Mach number distribution cloud map at 99% span under the same near-stall conditions of solid casing. It can be seen from the solid casing that under near-stall conditions, the compressor tip passage is filled with a large number of blue low-relative Mach number regions. It almost occupies the entire blade tip passage, so the blade tip flow condition has significantly deteriorated. However, with the application of the circumferential single groove, the low-speed region at the blade tip passage is significantly reduced, particularly within the blade leading edge passage where the relative Mach number was previously very low.
Figure 16 clearly reveals significant variations in the effectiveness of different single-groove designs on the blade tip flow field. The Case A solution demonstrates the most significant improvement, particularly at the leading edge, followed by the Case B solution. The Case C solution exhibits the least improvement. The impact of all three groove designs on the blade trailing edge flow field shows generally moderate improvement.
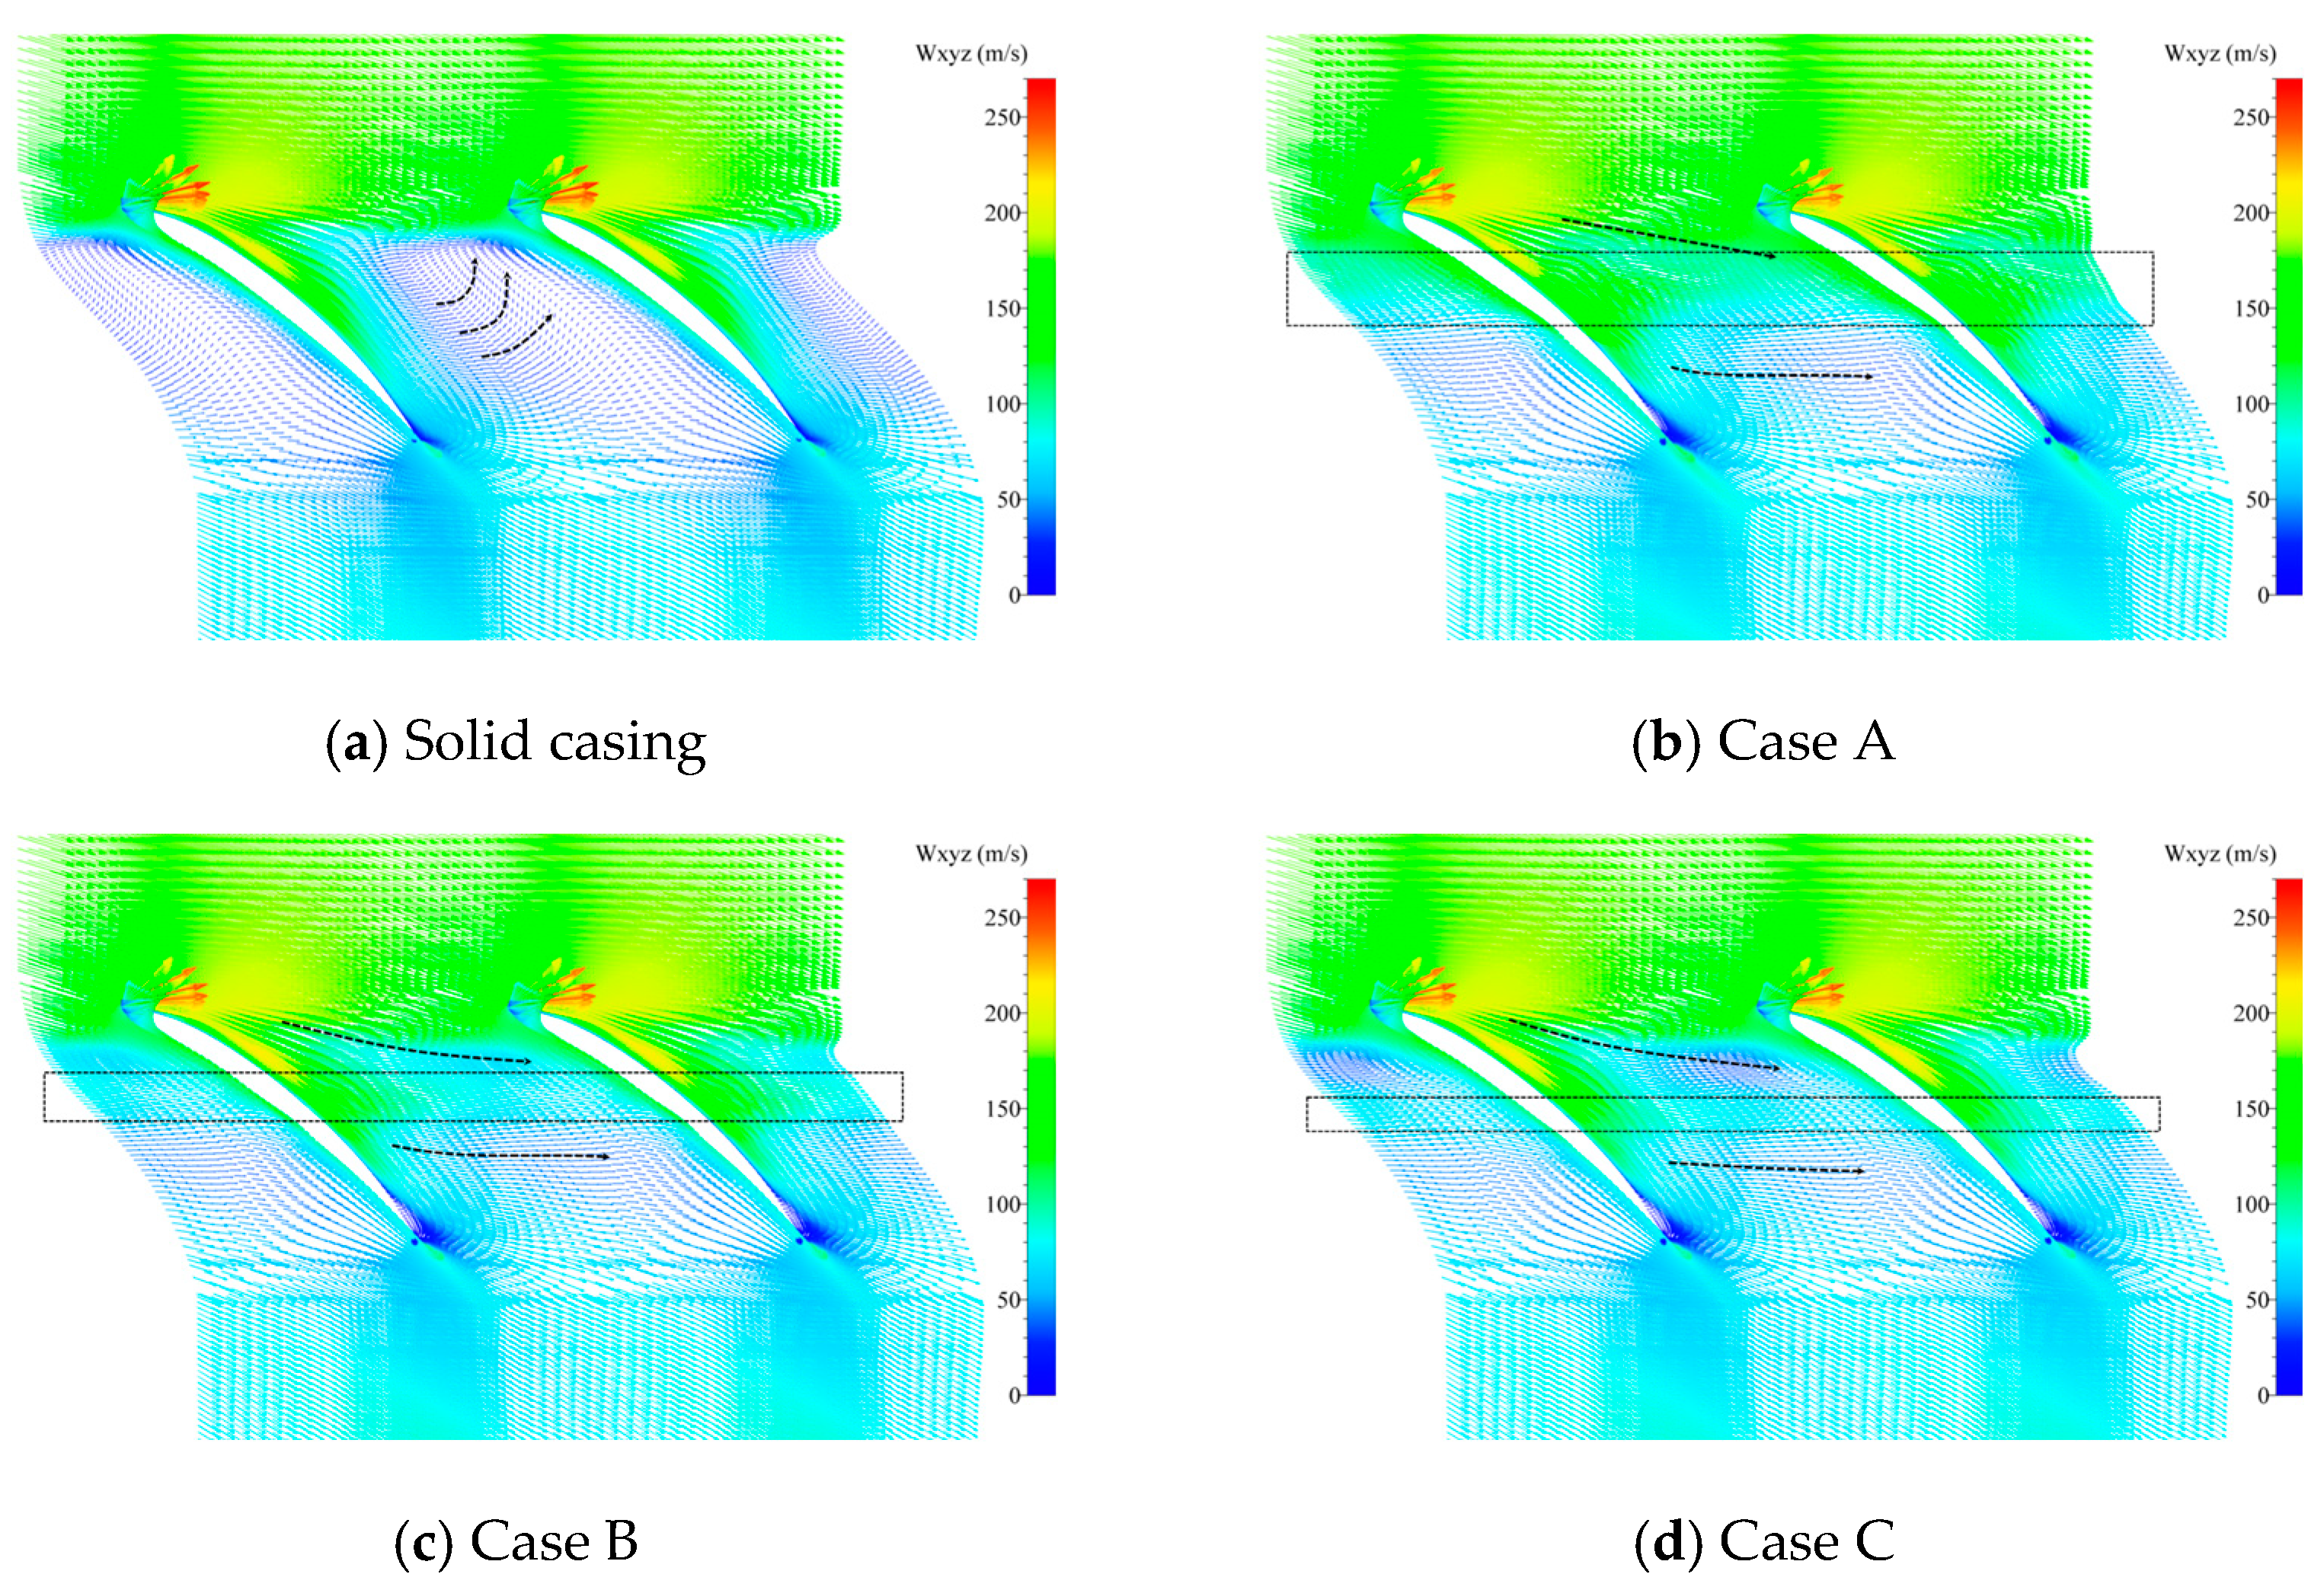
Figure 17 further shows relative velocity vector distribution at 99% span under the same near-stall condition of solid casing.
Figure 17 shows that under near-stall conditions with a solid casing, the compressor blade tip passage suffers from significant backflow. This backflow severely restricts the blade tip passage, leading to a deterioration of the flow field in that region. Consequently, compressor instability is further induced. However, after the circumferential groove is applied, the blade tip backflow is significantly eliminated. Compared with the other two single groove structures, the airflow direction near the blade tip leading edge of the Case A structure is more inclined towards the suction surface of the adjacent blade, and the airflow flow conditions are better.
The above qualitative analysis from the flow field perspective has revealed the mechanism that influence different circumferential groove geometries on the blade tip flow of the compressor. In the following, a quantitative analysis is conducted to compare the influence of different circumferential groove geometries on the stability of the compressor.
In our previous study [
17], we found that tip blockage can be used to effectively evaluate the trend of the stall margin. The tip blockage was defined as the decrease in effective flow area and was expressed as shown in Equation (11):
where
represents tip blockage,
represents the geometrical section area of blade passage along axial direction,
represents the effective core flow area of blade passage along axial direction under the effect of tip blockage, r represents the radial direction, and
represents the integral of the density–velocity deficit across the blade passage. The
represents a function of radius and is expressed as shown in Equation (12):
where
represents the number of rotor blade,
denotes the circumferential direction,
represents density,
represents relative axial velocity, and
represents the average
of the calculation section along the axial direction. The density–velocity deficit region was determined by the sum of radial and circumferential gradients of
with respect to a suitable cutoff value and is expressed as shown below:
As can be seen from
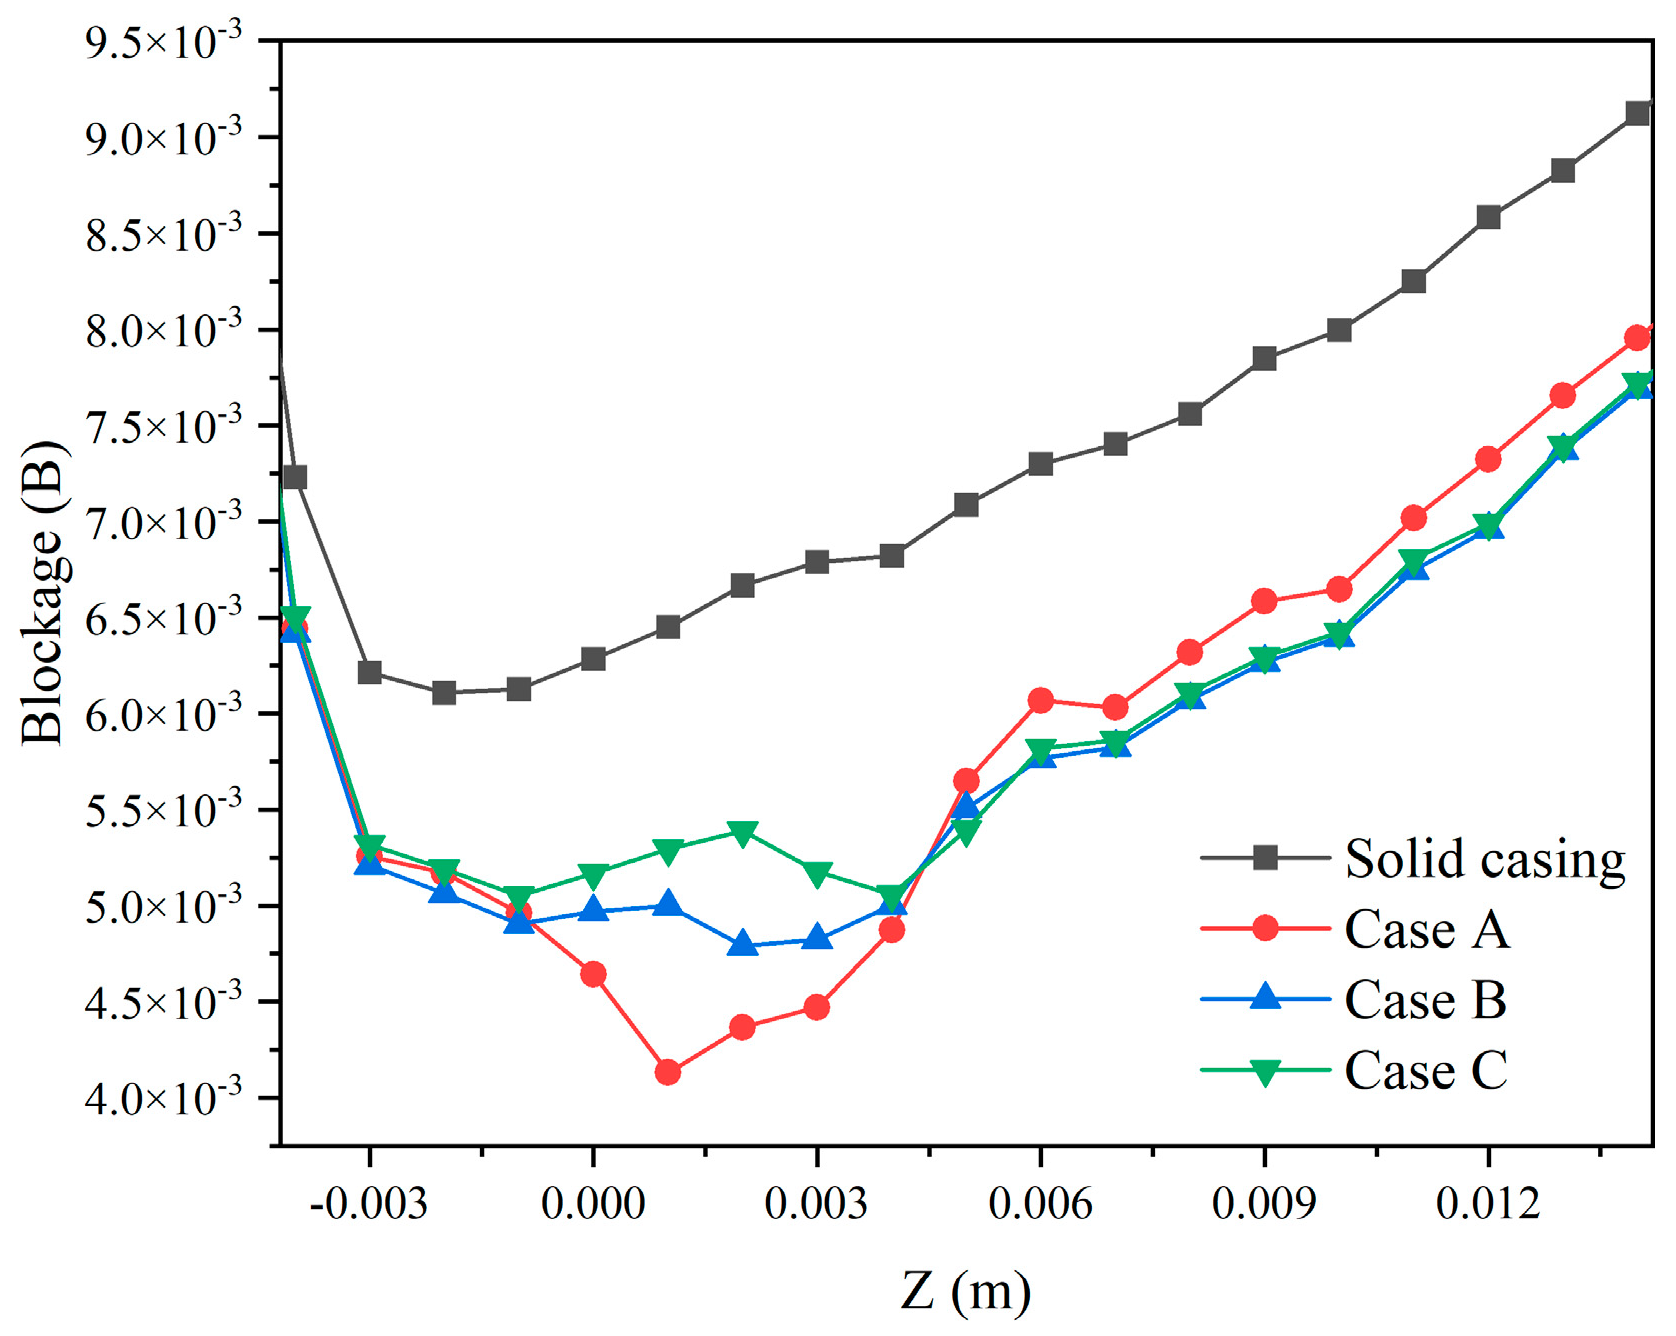
Figure 18, when a circumferential groove casing is applied, the degree of blockage in the blade tip passage is significantly reduced compared to the solid casing, and the flow conditions in the blade tip passage are significantly improved. The three single-groove structures exhibit significant variations in their effectiveness at reducing blockage near the blade tip leading edge. Notably, Case A demonstrates the greatest improvement in this critical region, which aligns with its observed increase in stability margin. The quantitative analysis of blade tip blockage shows that there is a certain correlation between the degree of blade tip blockage under the action of circumferential grooves and the stability margin of the compressor.
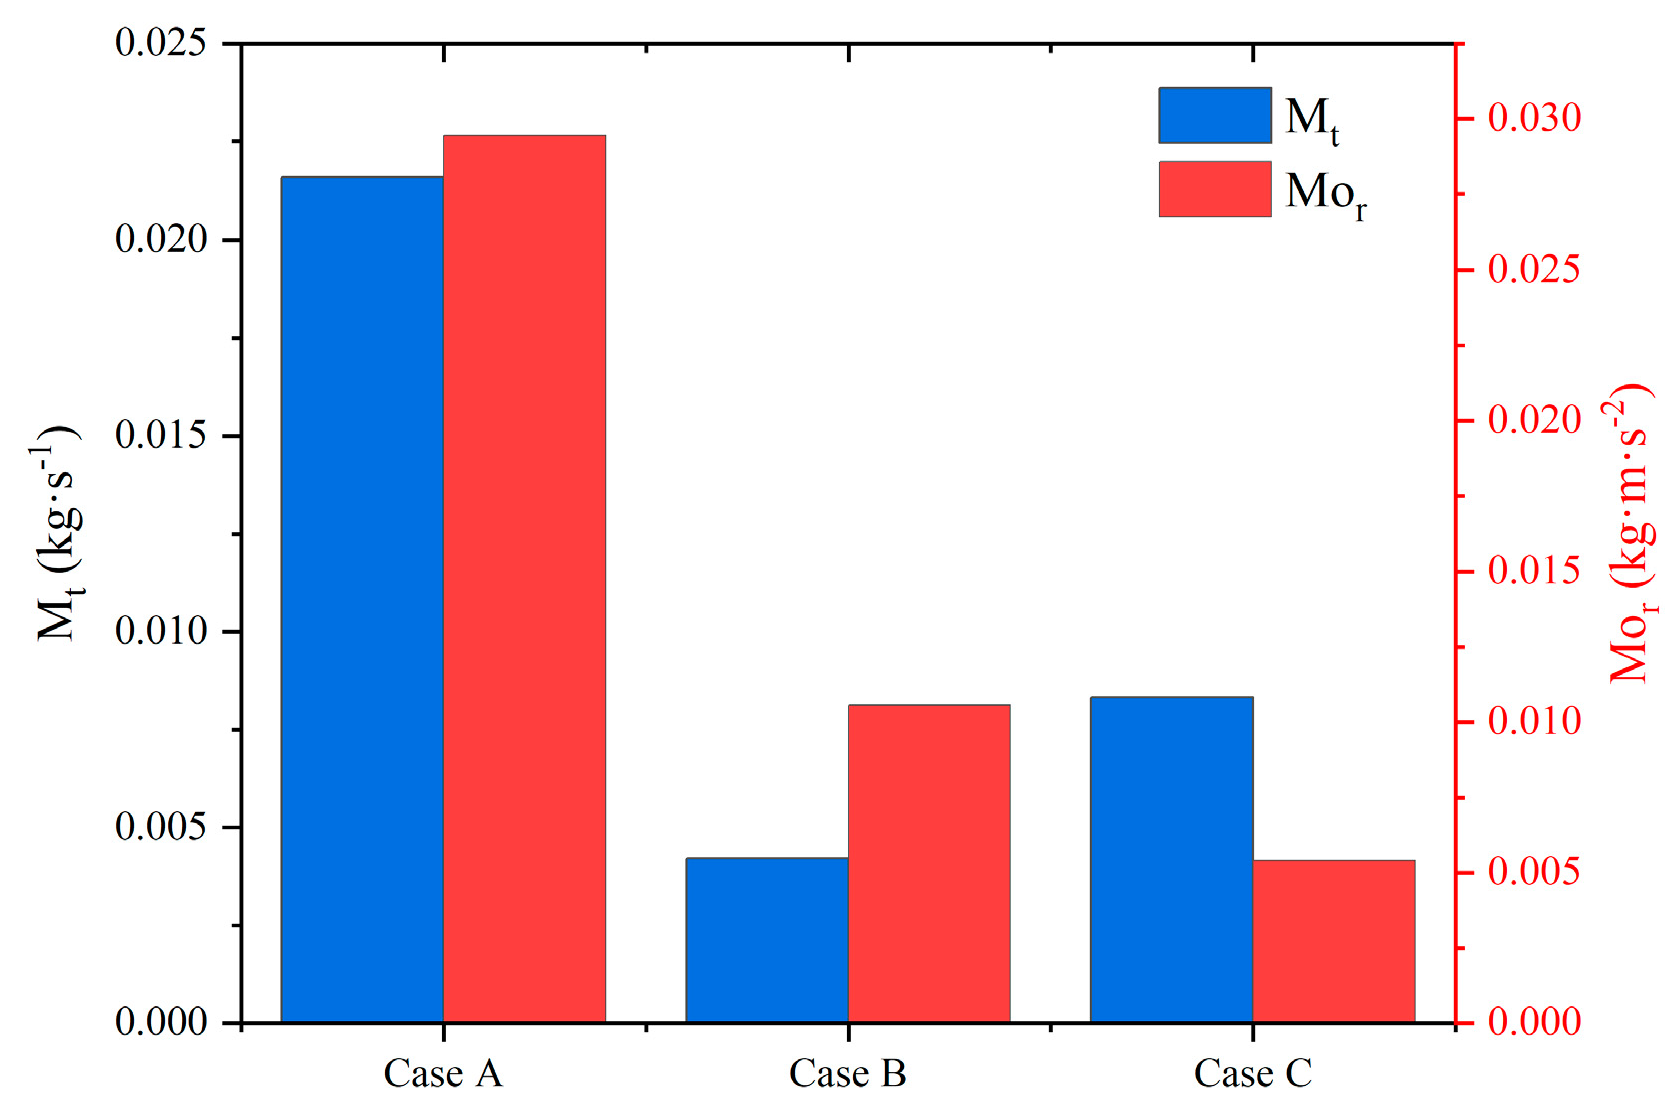
The airflow at the compressor tip enters and exits the groove, producing a momentum transport effect on the tip flow field. Two parameters, circumferential mass flow flux in the groove (
) and radial transport momentum of the circumferential transport flux (
), are introduced to evaluate the impact of the momentum transport effect caused by the groove.
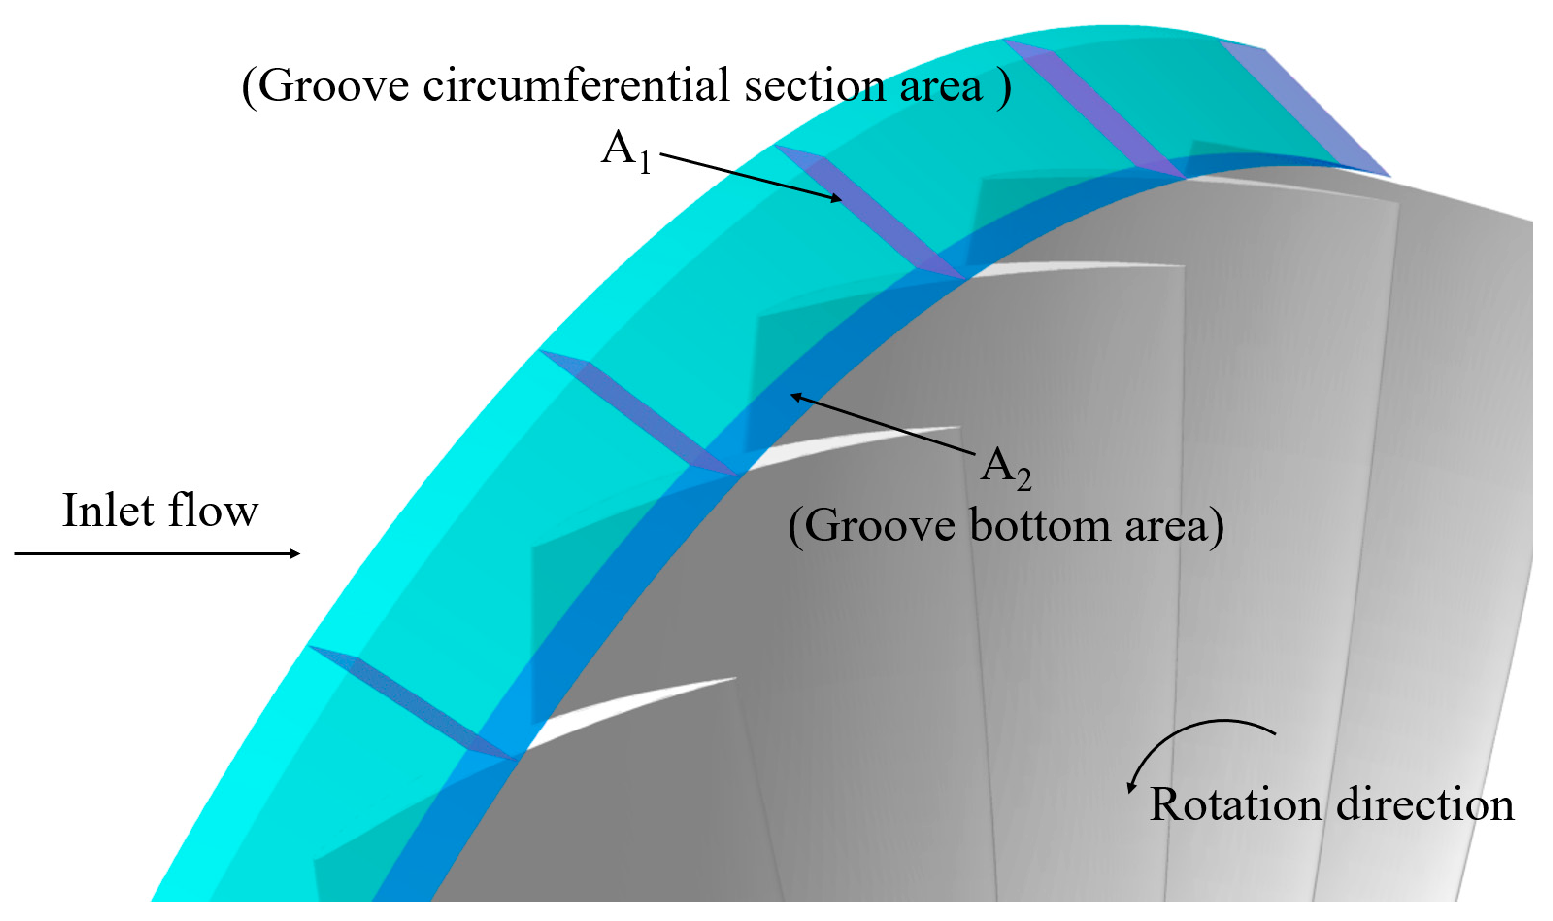
where
represents the groove section area in the circumferential direction,
represents the groove bottom area (as shown in
Figure 19),
represents the circumferential component of relative velocity, and
represents the radial component of relative velocity.
Figure 20 shows the momentum transport effect of the circumferential single groove on the blade tip flow field. It can be seen that the trend of the circumferential mass flow flux and the stability expansion ability of the circumferential single groove is not consistent. In contrast, the radial transport momentum of the circumferential single groove exhibits a strong correlation with its stability expansion ability. A higher radial transport momentum value corresponds to a greater radial transport effect on the blade tip passage and, consequently, a stronger stability expansion ability of the circumferential single groove.
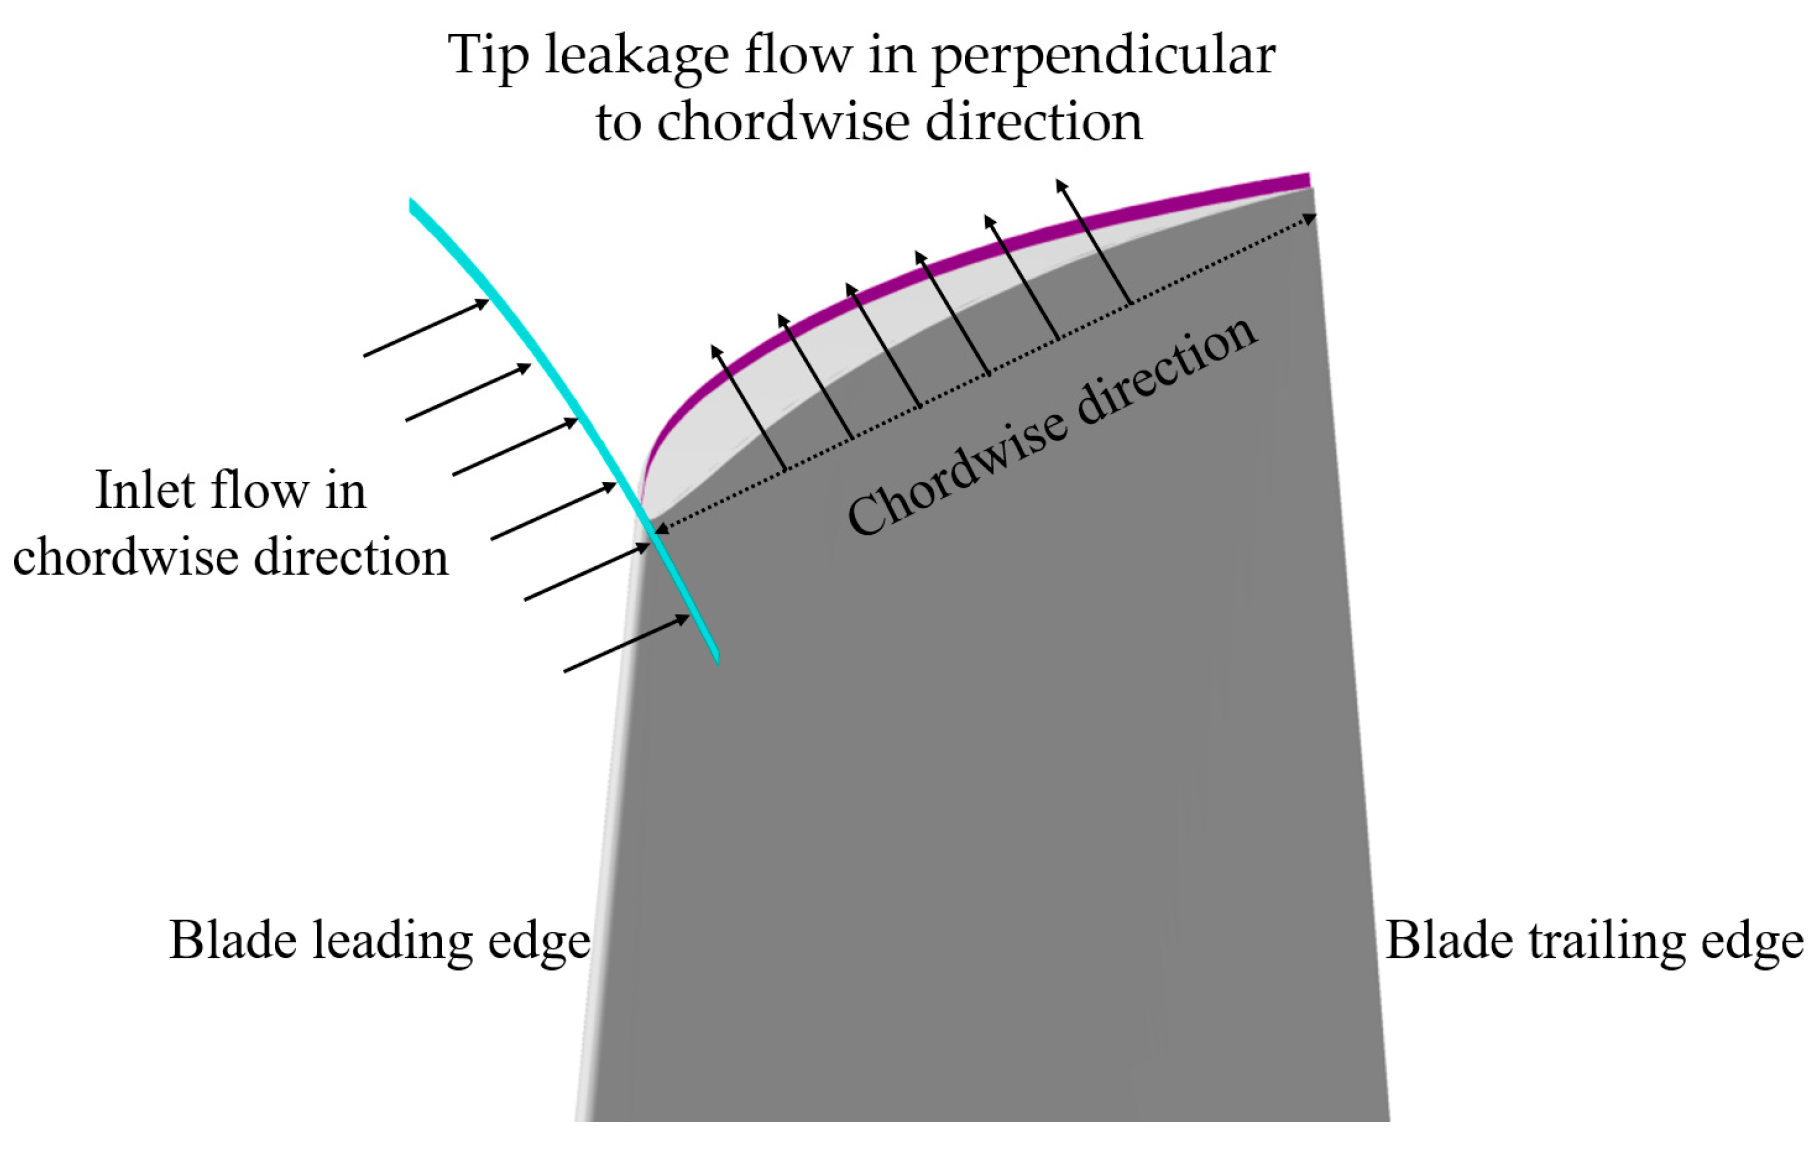
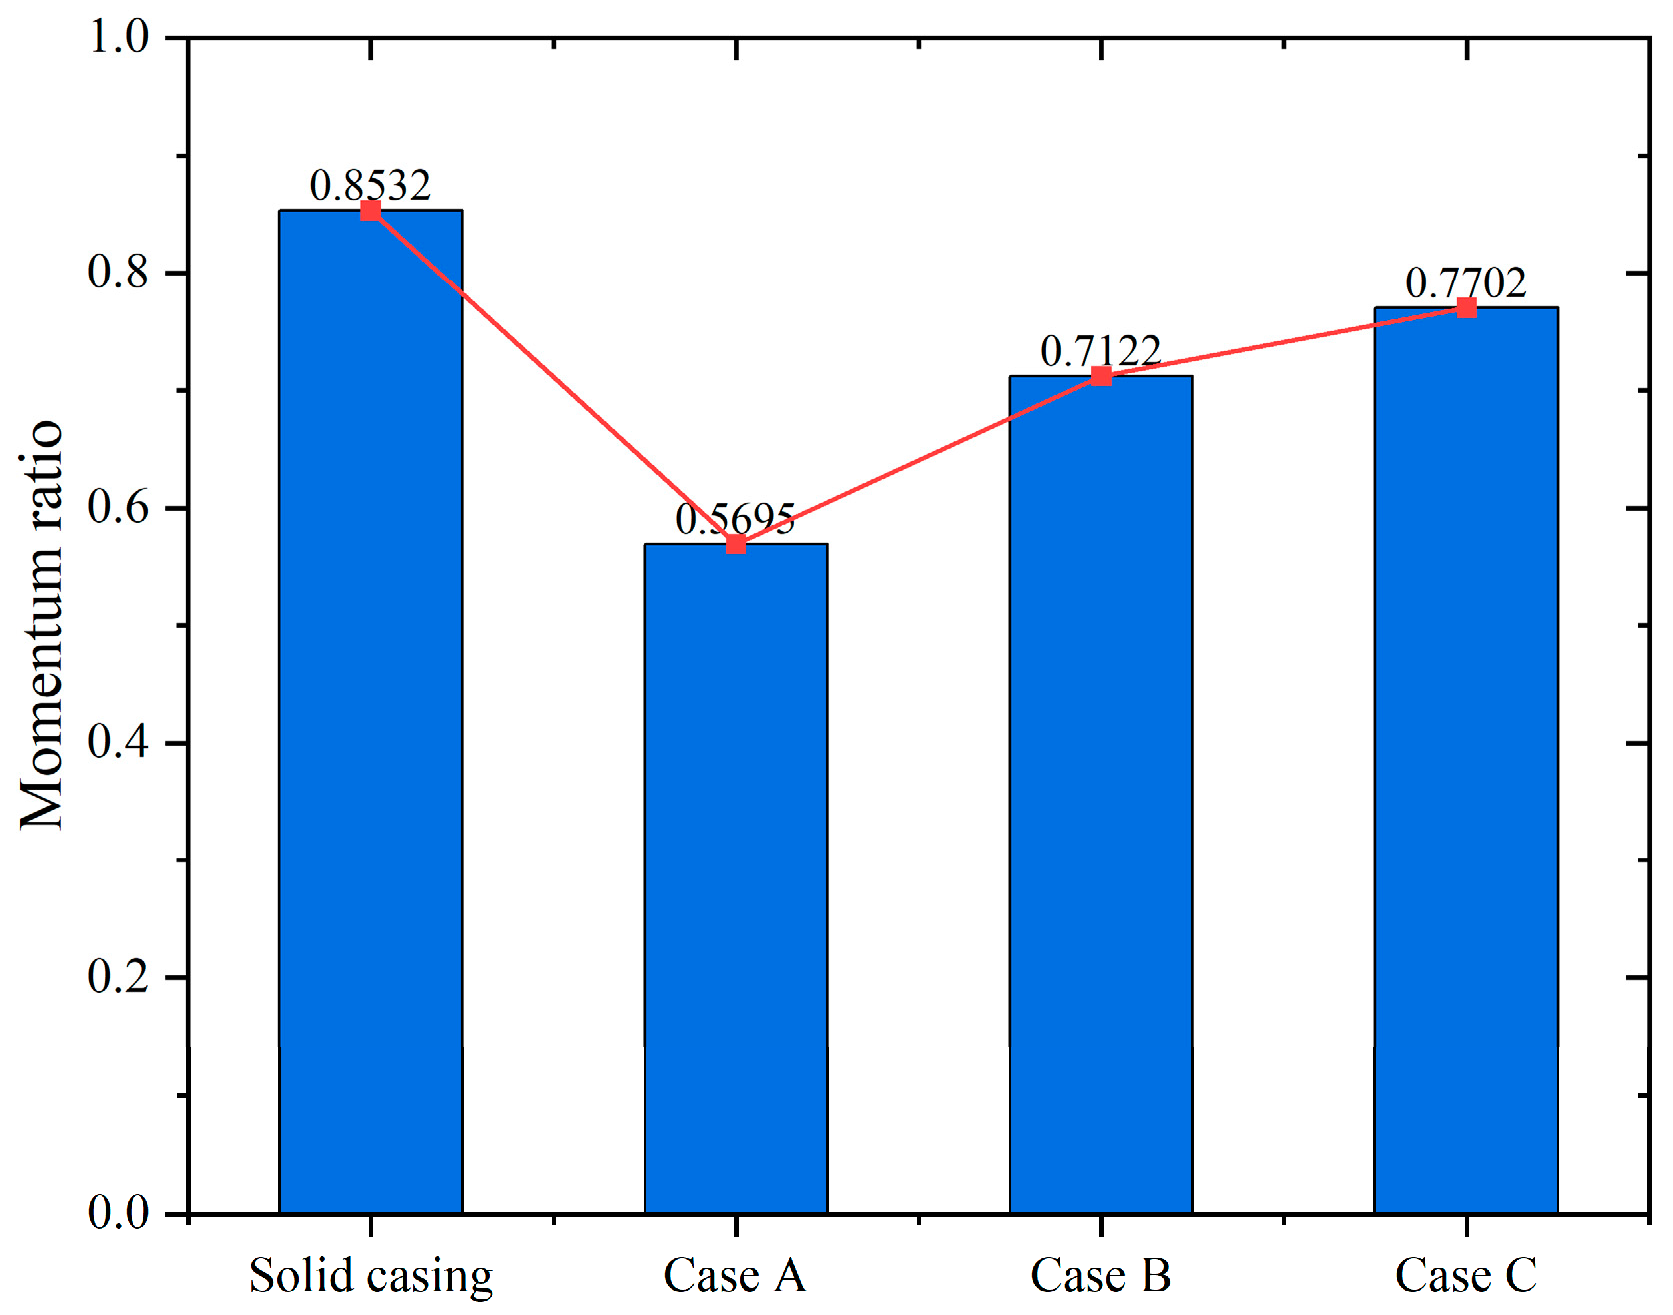
The application of a single groove changes the momentum balance state at the tip of the compressor. To quantitatively evaluate this momentum balance state, the momentum ratio (
) parameter is introduced [
19].
where
represents the momentum. The
,
,
, and
subscripts represent the inlet flow, tip leakage flow, chordwise direction, and perpendicular to chordwise direction, respectively. A schematic diagram of the surface for the calculation of the momentum ratio is shown in
Figure 21.
Figure 22 shows that after the application of the circumferential single groove, the momentum ratio is significantly reduced. The dynamic balance state of the blade tip flow field is changed, the dominant role of the tip leakage flow is significantly reduced, and the blade tip flow condition is improved. Therefore, the smaller the momentum ratio, the stronger the stability expansion ability of the circumferential single groove, and the more obvious the correlation between it and the strength of the stability expansion ability of the circumferential single groove.
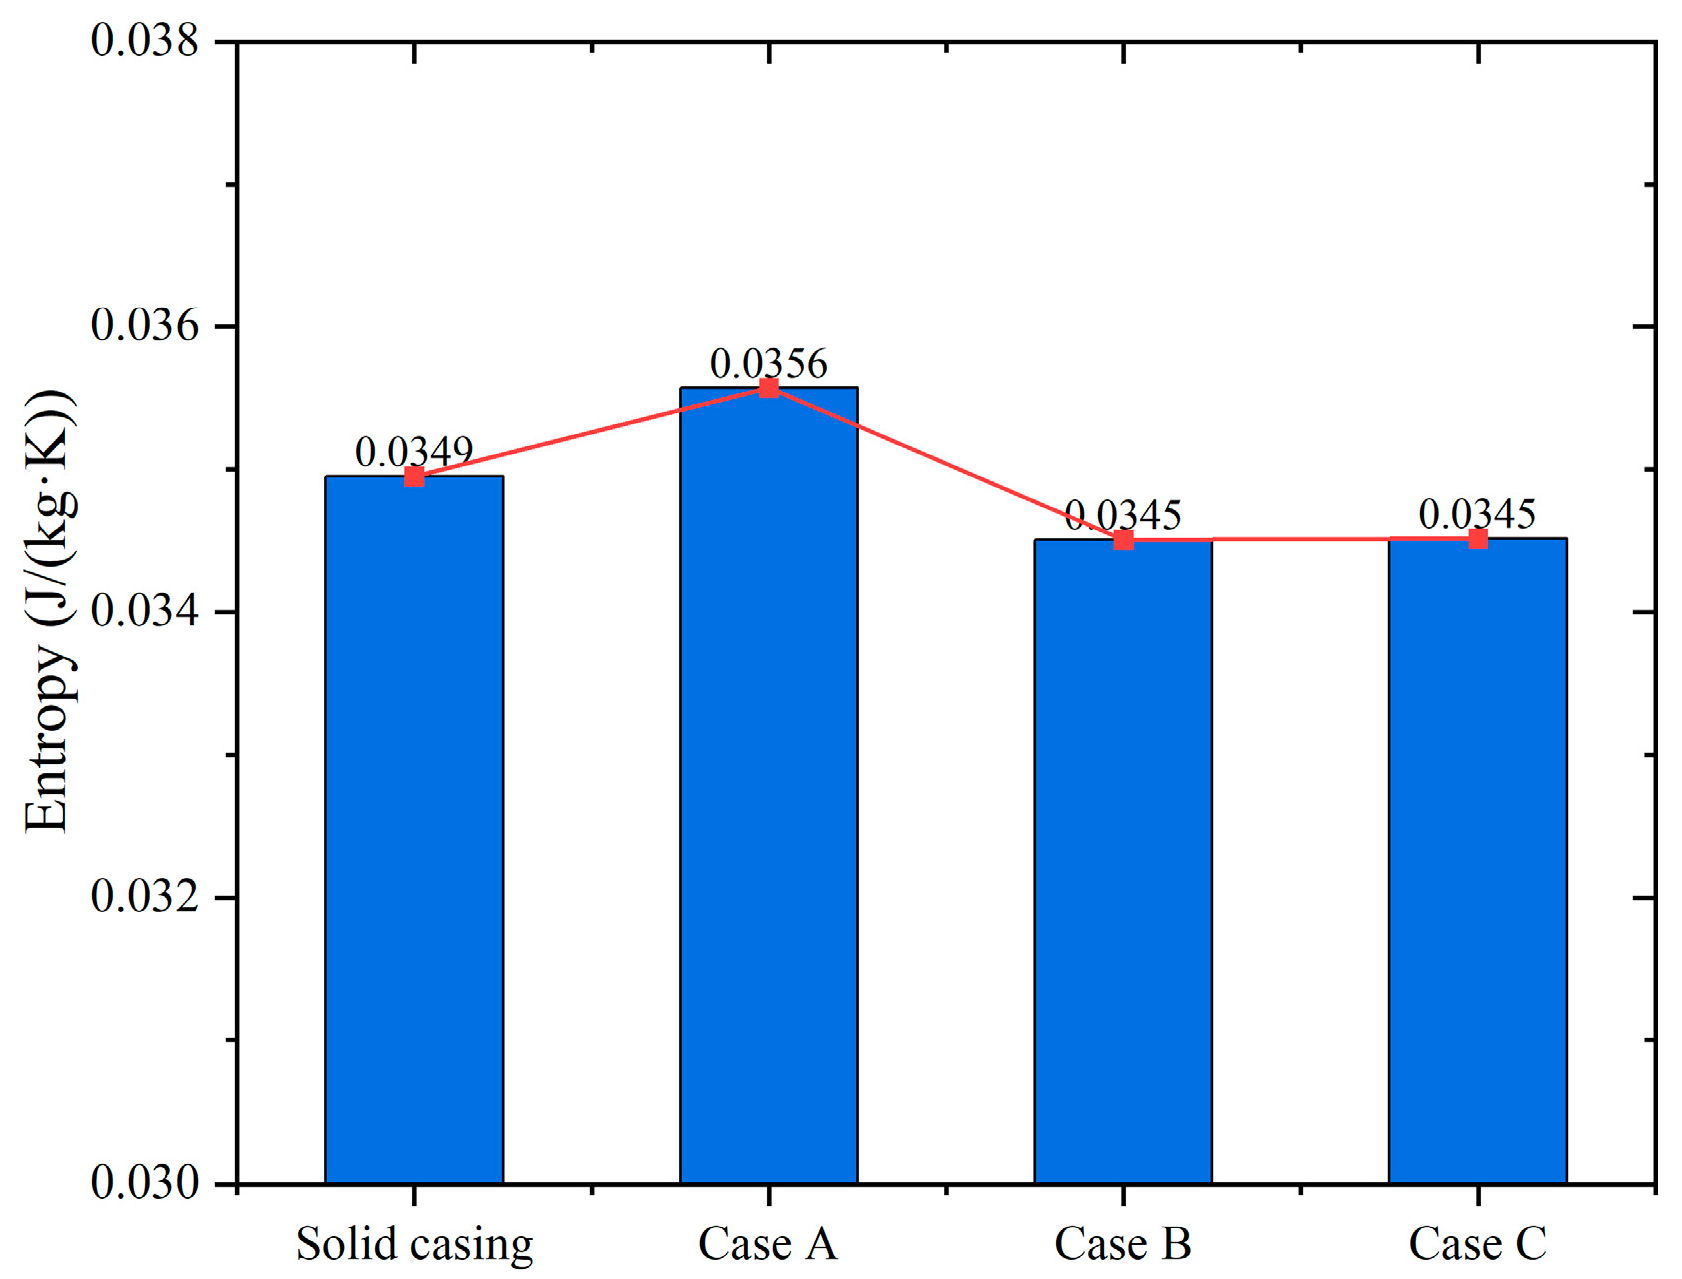
To analyze the effect of different circumferential single grooves on compressor efficiency,
Figure 23 shows the meridional entropy value integration of the solid casing and three circumferential single grooves at the same mass flow ratio. And this mass flow ratio is the same as the mass flow ratio under the peak-efficiency condition of the solid casing. It can be seen that when the Case A solution is applied, the integral entropy value is significantly increased compared to the solid casing, indicating that the loss of the compressor is significantly increased after applying the Case A solution, leading to a greater compressor efficiency loss. However, when the Case B solution and the Case C solution are applied, the integral entropy value is significantly reduced compared to the solid casing, indicating that the loss of the compressor is significantly reduced after applying the Case B and the Case C solutions, and the compressor efficiency loss is reduced.
3.4. Analysis of Stall Margin Evaluation Parameters
In the optimization process of this paper, the stall margin of each sample point is evaluated by calculating the entire overall performance line. Calculating the entire overall performance line of a compressor can provide a relatively accurate estimate of the compressor stall margin. In engineering applications, the computational cost of evaluating the stall margin by calculating the entire overall performance line is unacceptable, as the optimization process requires the calculation of a large number of sample points. Therefore, this paper evaluates a series of parameters, and the aim is to find an evaluation parameter for the stall margin under the near-stall mass flow ratio of solid casing condition to replace the calculation of the entire overall performance line.
These evaluation parameters include total pressure ratio, tip blockage, groove transport effect, and momentum ratio under the same near-stall mass flow ratio of the solid casing. In reference [
16], they found that SMI is linearly proportional to the total pressure ratio at the near-stall mass flow ratio of the solid casing condition. So, the total pressure ratio (
) at the near-stall mass flow ratio of the solid casing condition is firstly considered to evaluate the SMI. Based on the above flow mechanism analysis, it is evident that tip blockage, the transport effect of the groove, the momentum ratio, and the stability expansion ability of the circumferential single groove exhibit a degree of correlation. Consequently, these parameters were chosen to evaluate the compressor stability margin. This work simultaneously evaluates the tip blockage at different axial chord positions (0 C
ax, 0.2 C
ax, 0.4 C
ax, 0.5 C
ax, 0.6 C
ax, 0.8 C
ax, and 1.0 C
ax), respectively represented by B
1–B
7.
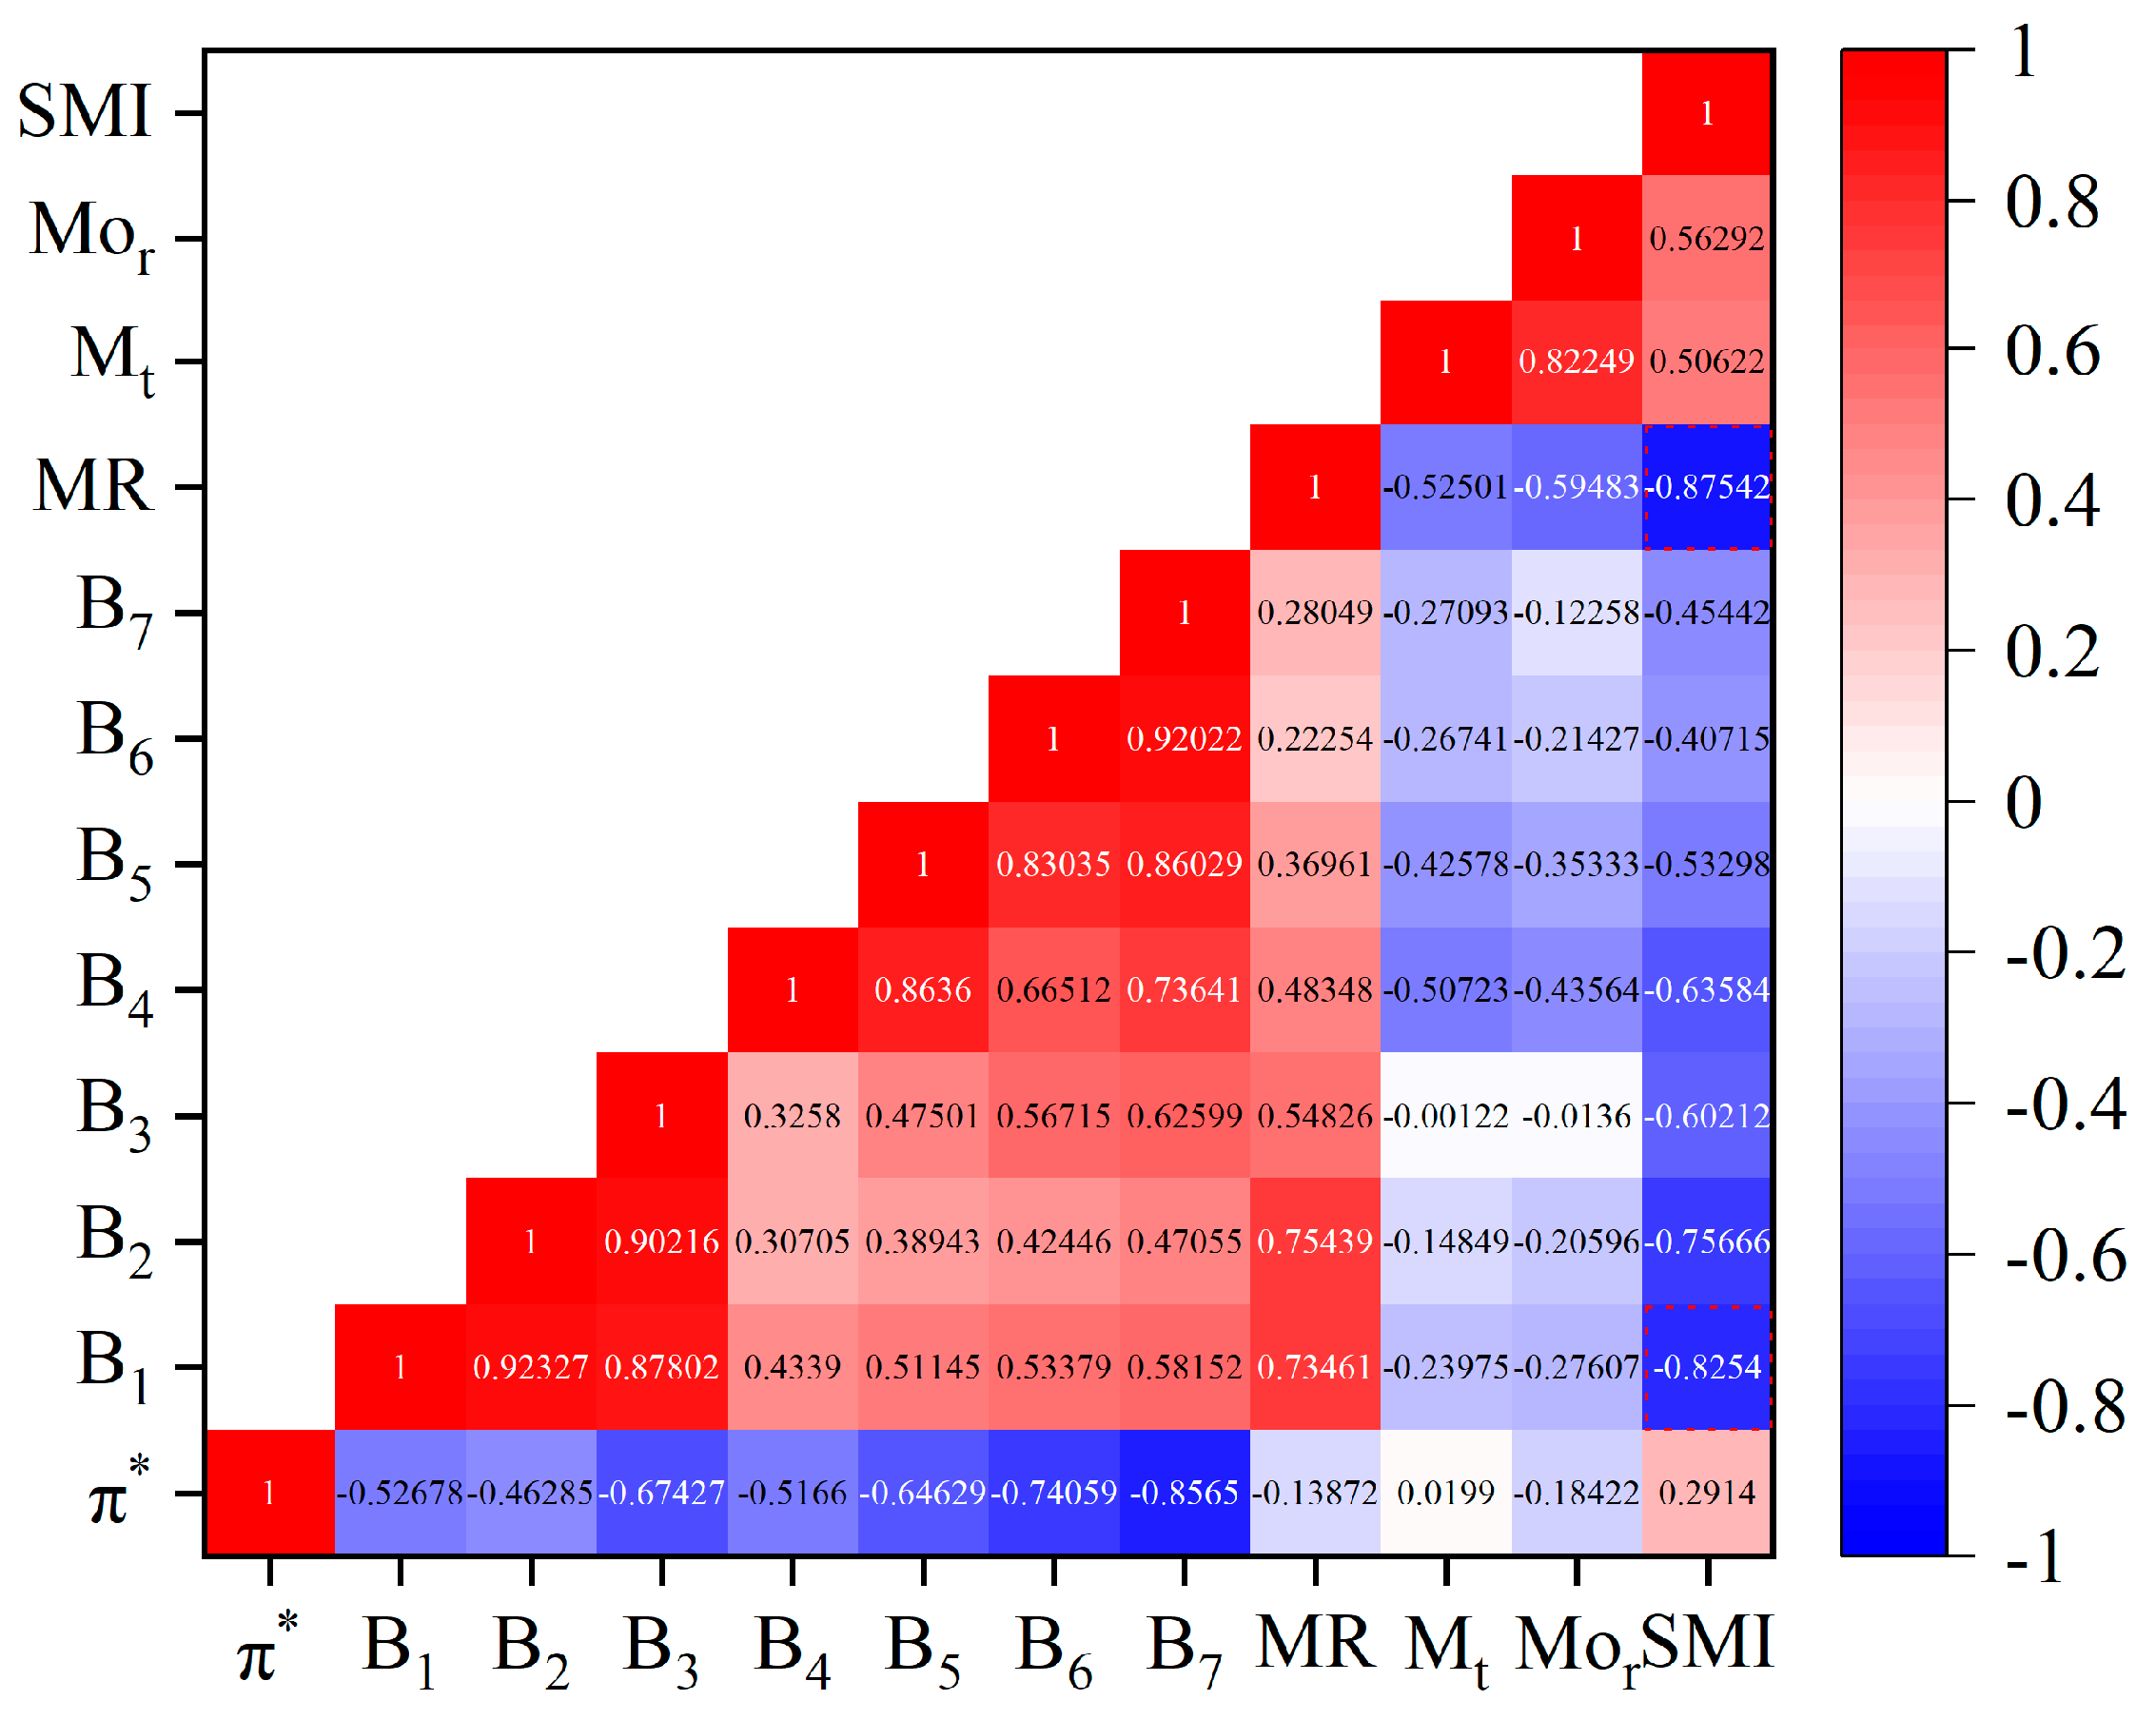
Spearman correlation analysis was used to explore the evaluation ability of various stall margin evaluation parameters for the stall margin of the compressor with different groove CTs. Based on the optimization database, Spearman correlation analysis was carried out.
Figure 24 shows the heat map distribution of the Spearman correlation coefficient. For a database, Spearman correlation analysis can provide the correlation degree and direction between variables, and it is one of the most common statistical methods for measuring multivariate correlation. When two variables are perfectly monotonically related, the Spearman correlation coefficient is +1 or −1, with a positive value representing positive correlation and a negative value representing negative correlation. When the correlation between two variables is more significant, the absolute value of the Spearman correlation coefficient approaches 1. In general, it is believed that the correlation between variables is considered to be strong when the correlation coefficient is between 0.8 and 1.0.
Figure 24 shows that B
1 and MR (shown in the red dashed rectangle) are significantly correlated with SMI, with Spearman correlation coefficients of −0.8254 and −0.8754, respectively. B1 and MR both are negatively correlated with SMI. Based on these results, in the optimization of the single circumferential groove, it is possible to use the tip blockage at the tip leading edge or momentum ratio parameters to evaluate the stall margin of different single circumferential groove structures. For each individual groove-casing treatment, this only requires the calculation of one operating condition at the near-stall flow rate of the solid casing, without the need to calculate the entire overall performance line (at least eight operating conditions), which greatly reduces the optimization calculation time. The results facilitate the application of optimization methods to engineering practice by reducing the computational cost of optimization.

