
Derivation and Flight Test Validation of Maximum Rate of Climb during Takeoff for Fixed-Wing UAV Driven by Propeller Engine

Abstract
1. Introduction
2. Derivation of Maximum Rate of Climb Using Optimization Problems
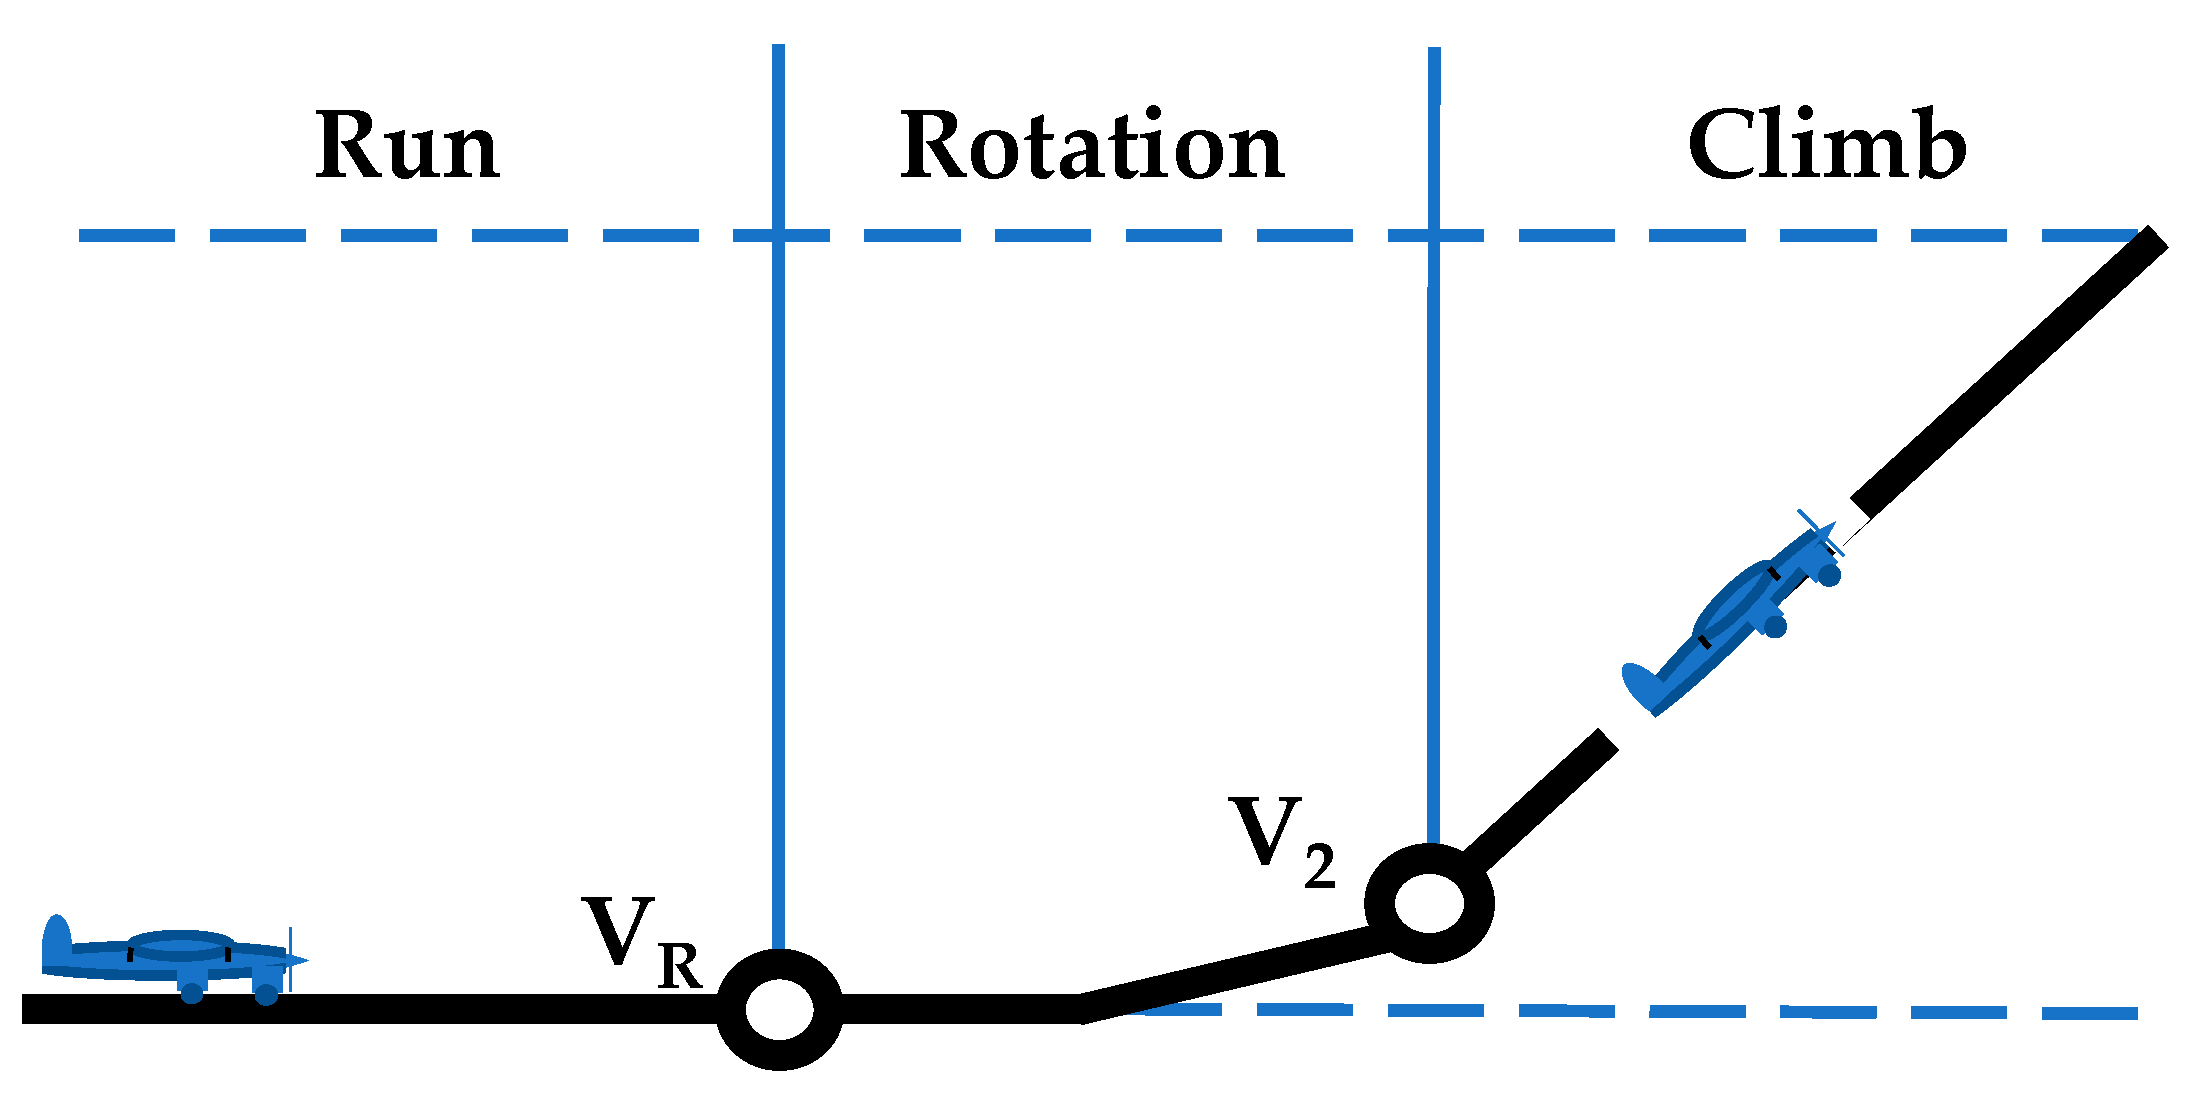
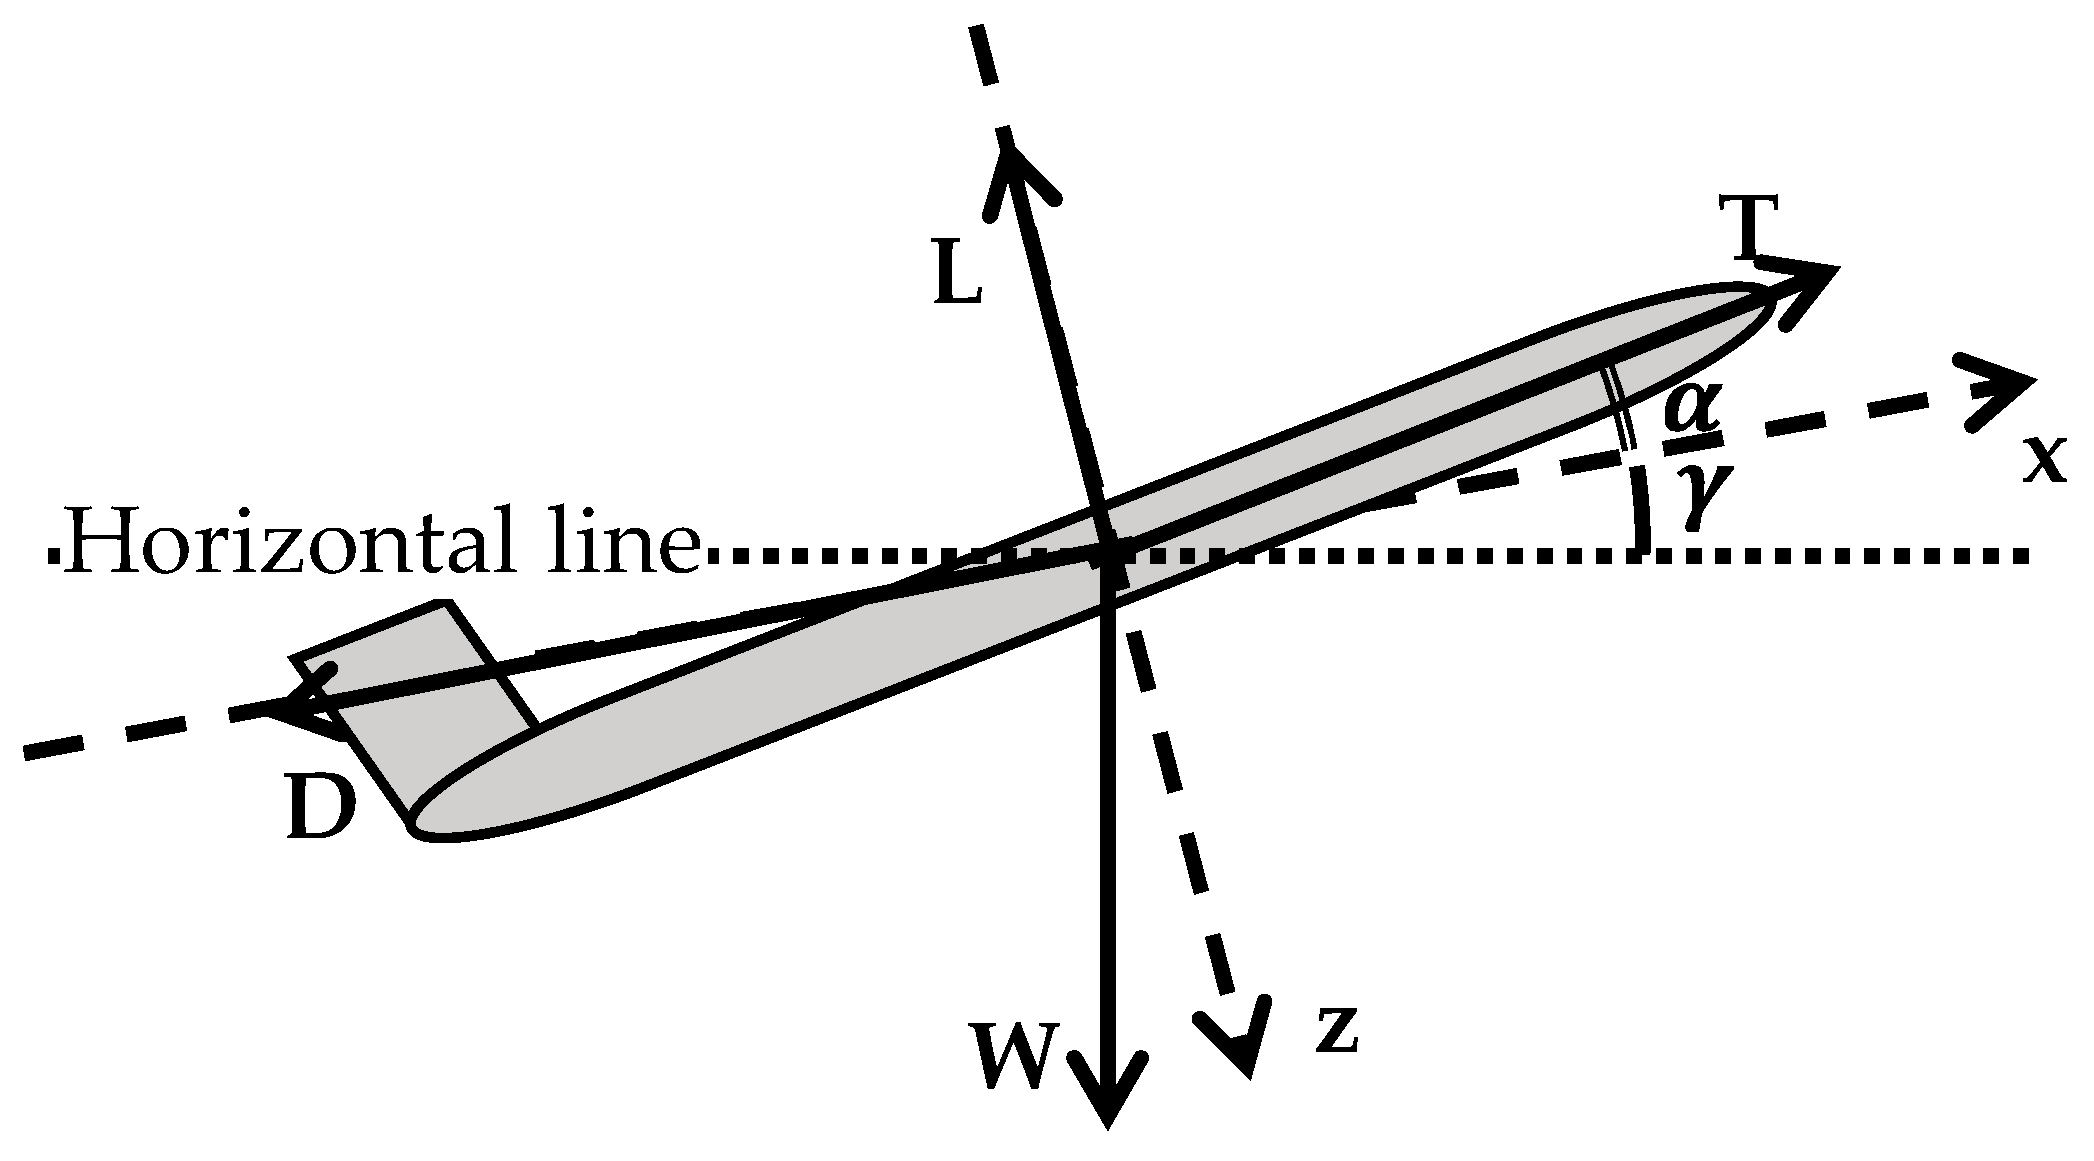
2.1. Equations of Motion during Climb
2.2. Application of Optimization Problems to Climbing Airplane
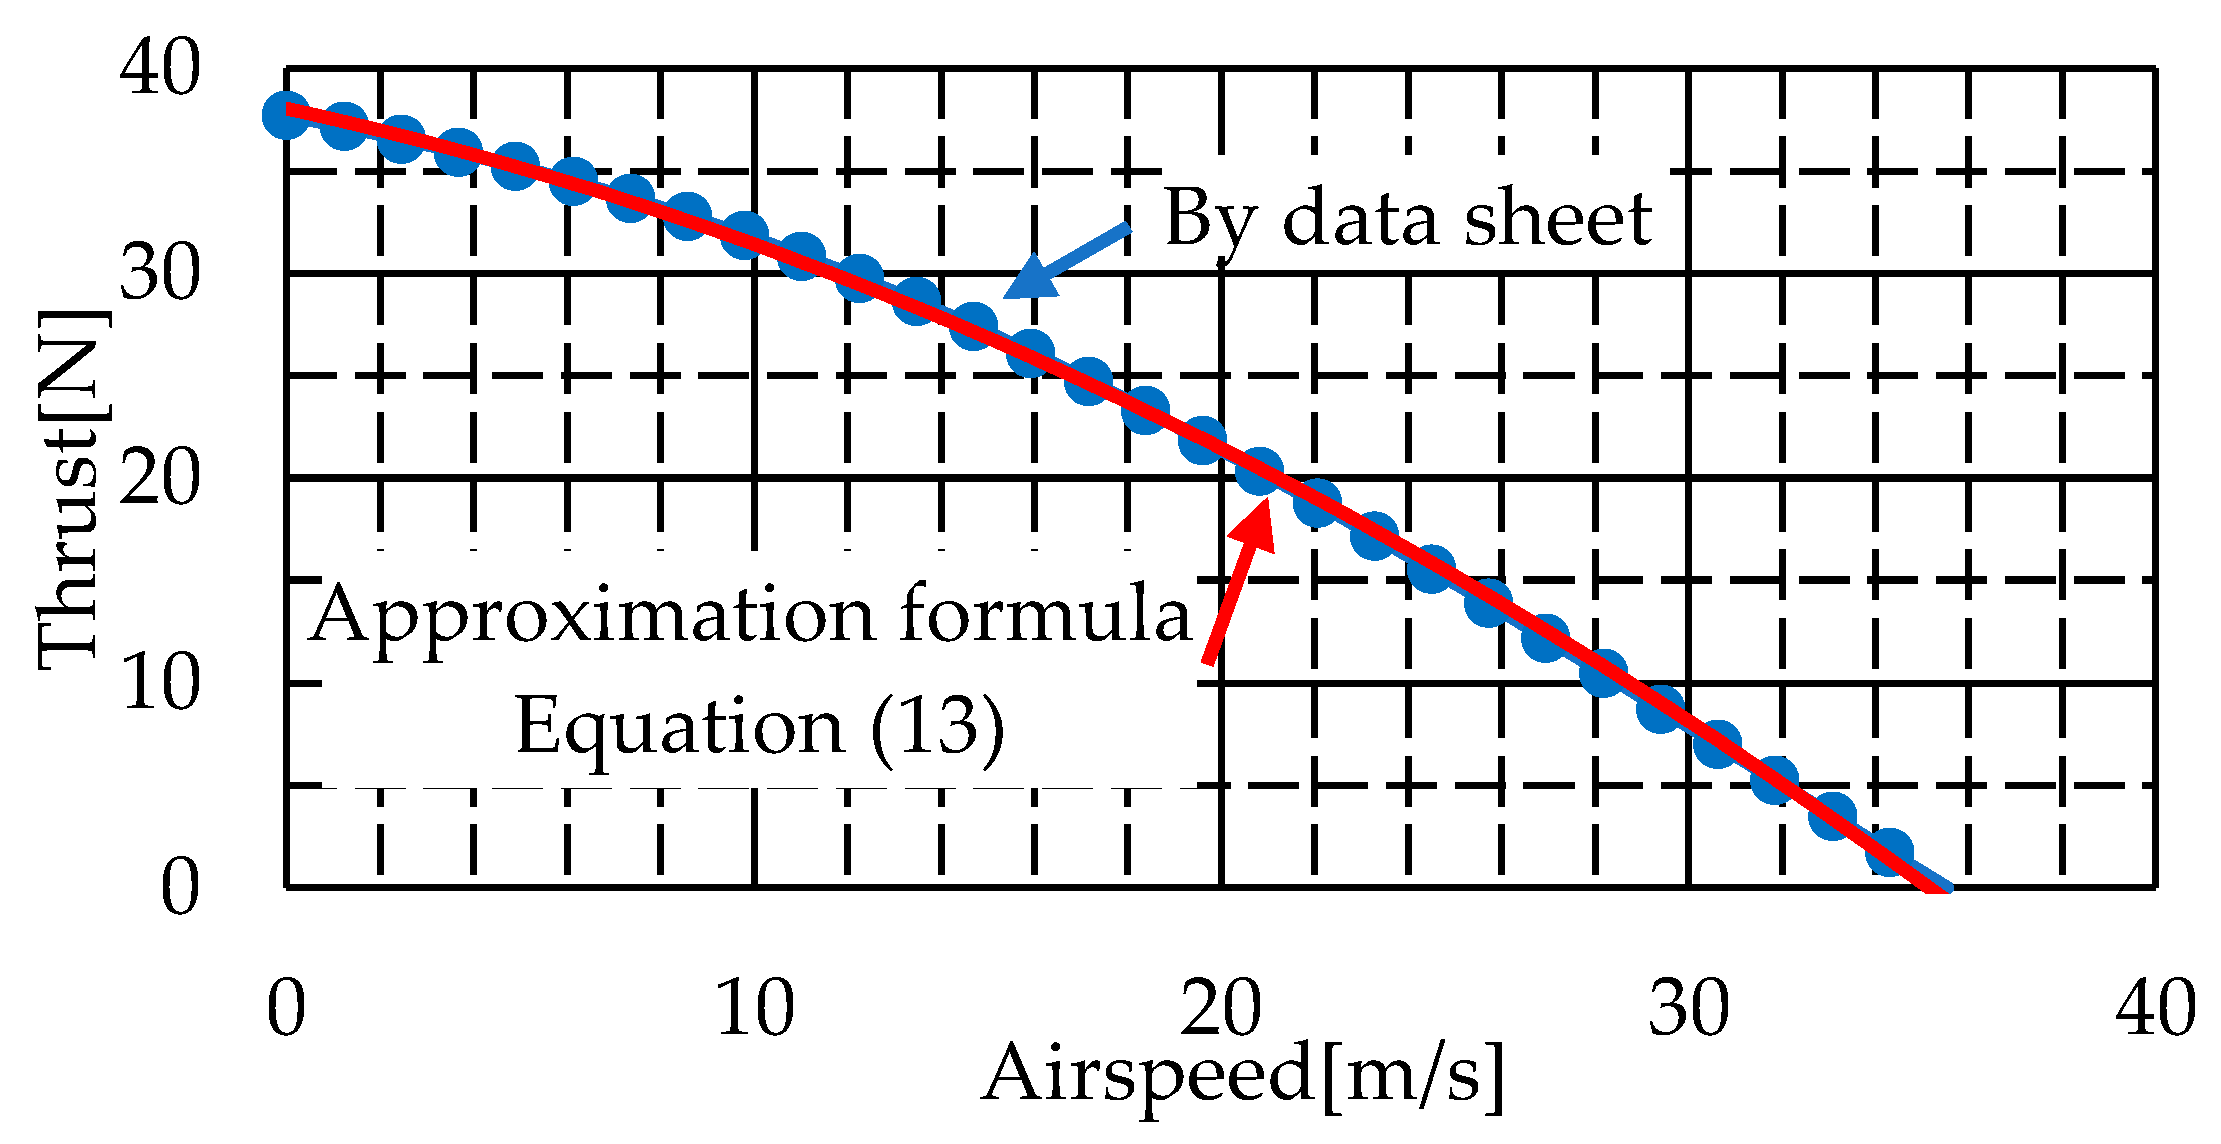
2.3. Formulation of Propeller Engine Thrust
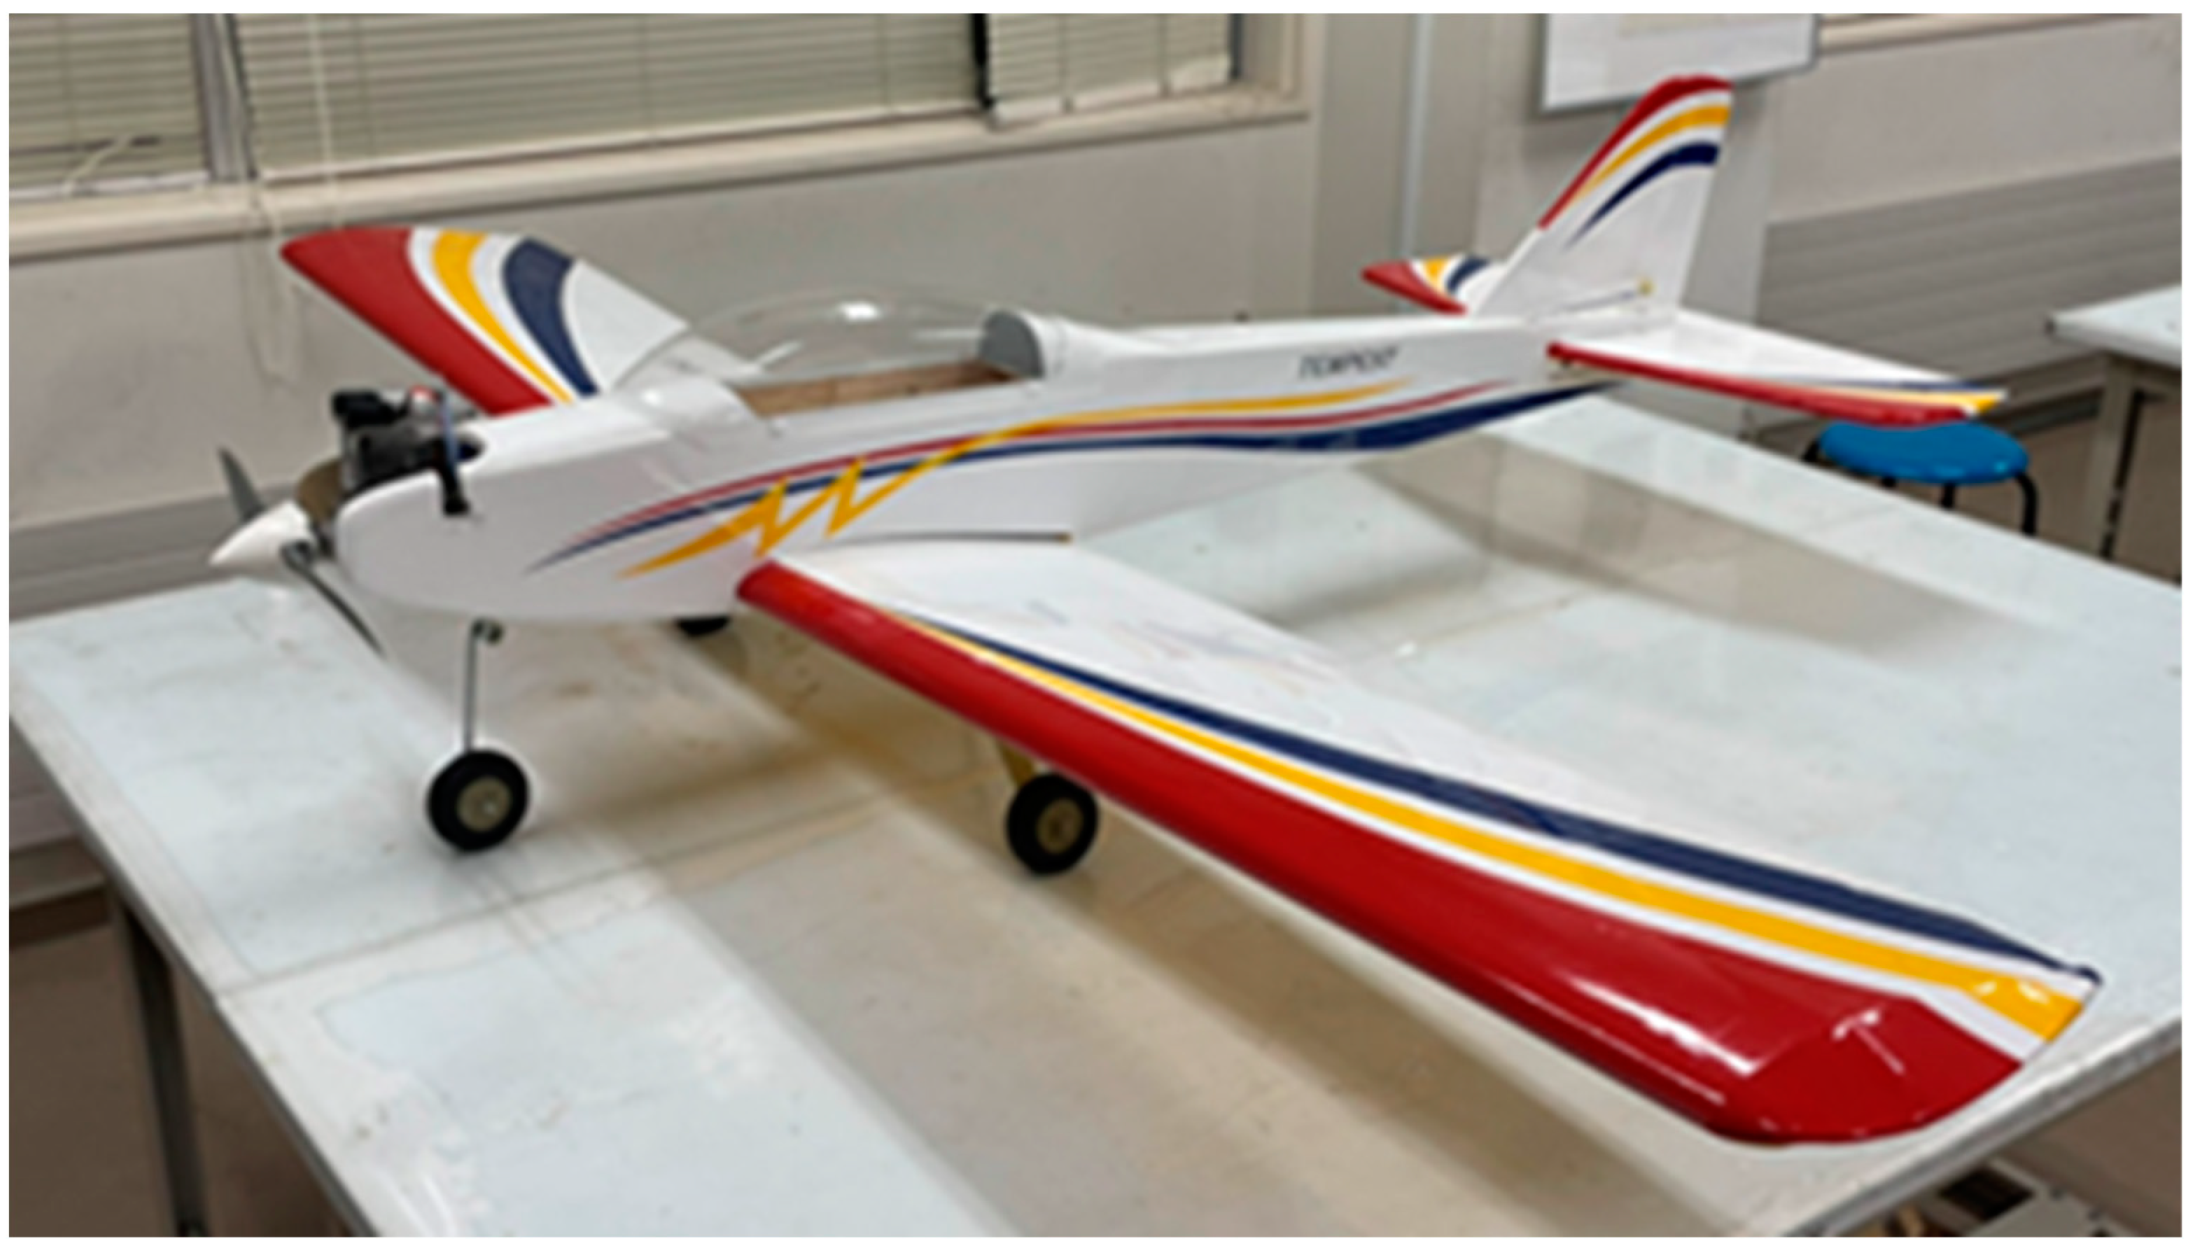
2.4. Target Airplane
2.5. Numerical Result of Maximum Rate of Climb
3. Verification by Using 6-DOF Flight Simulation
3.1. Simulation Condition
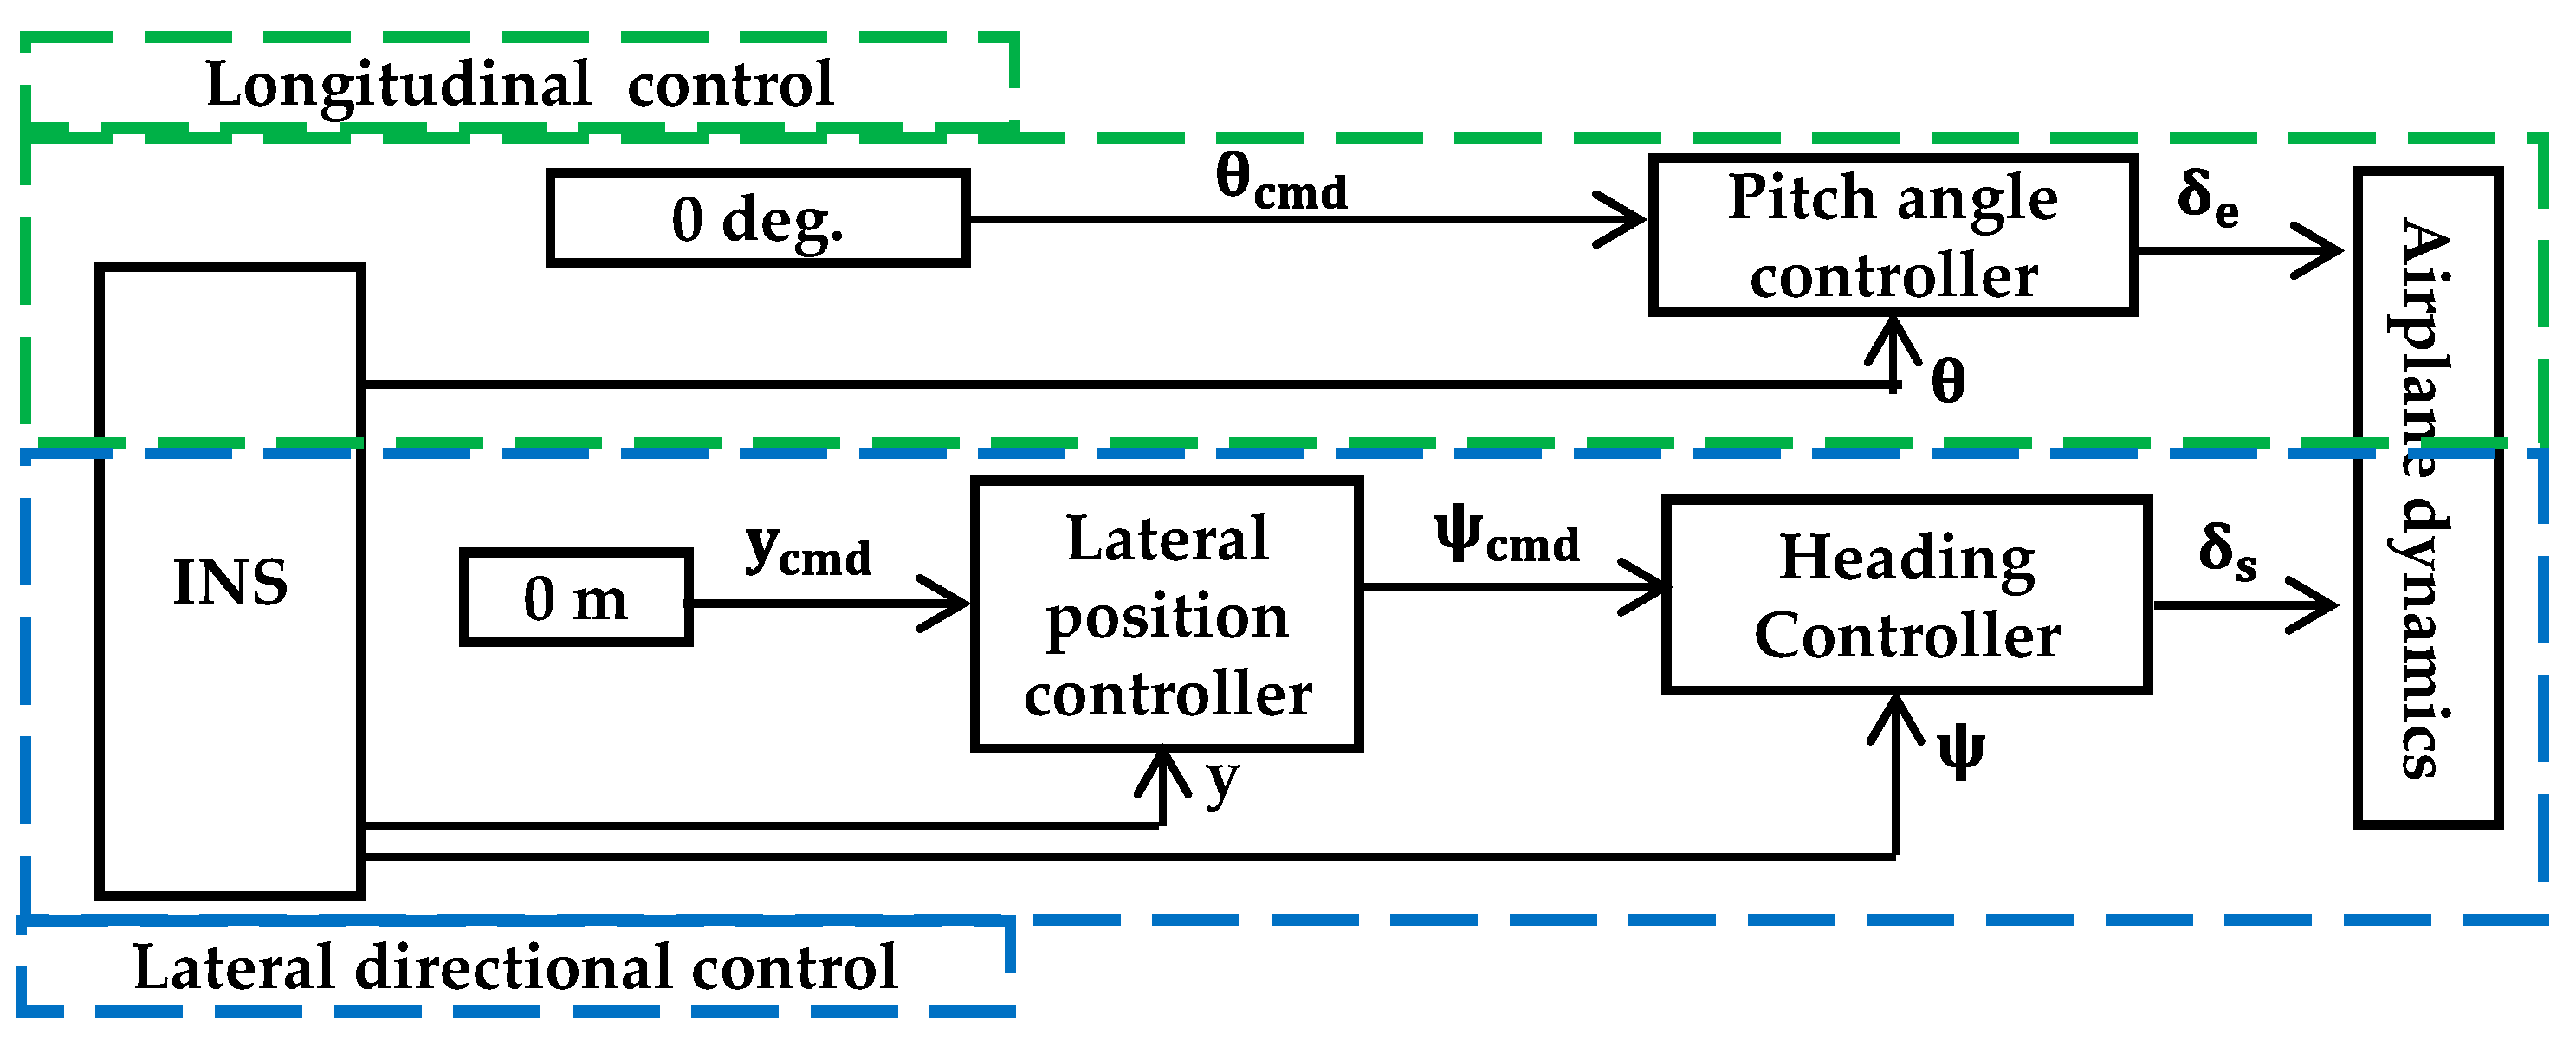
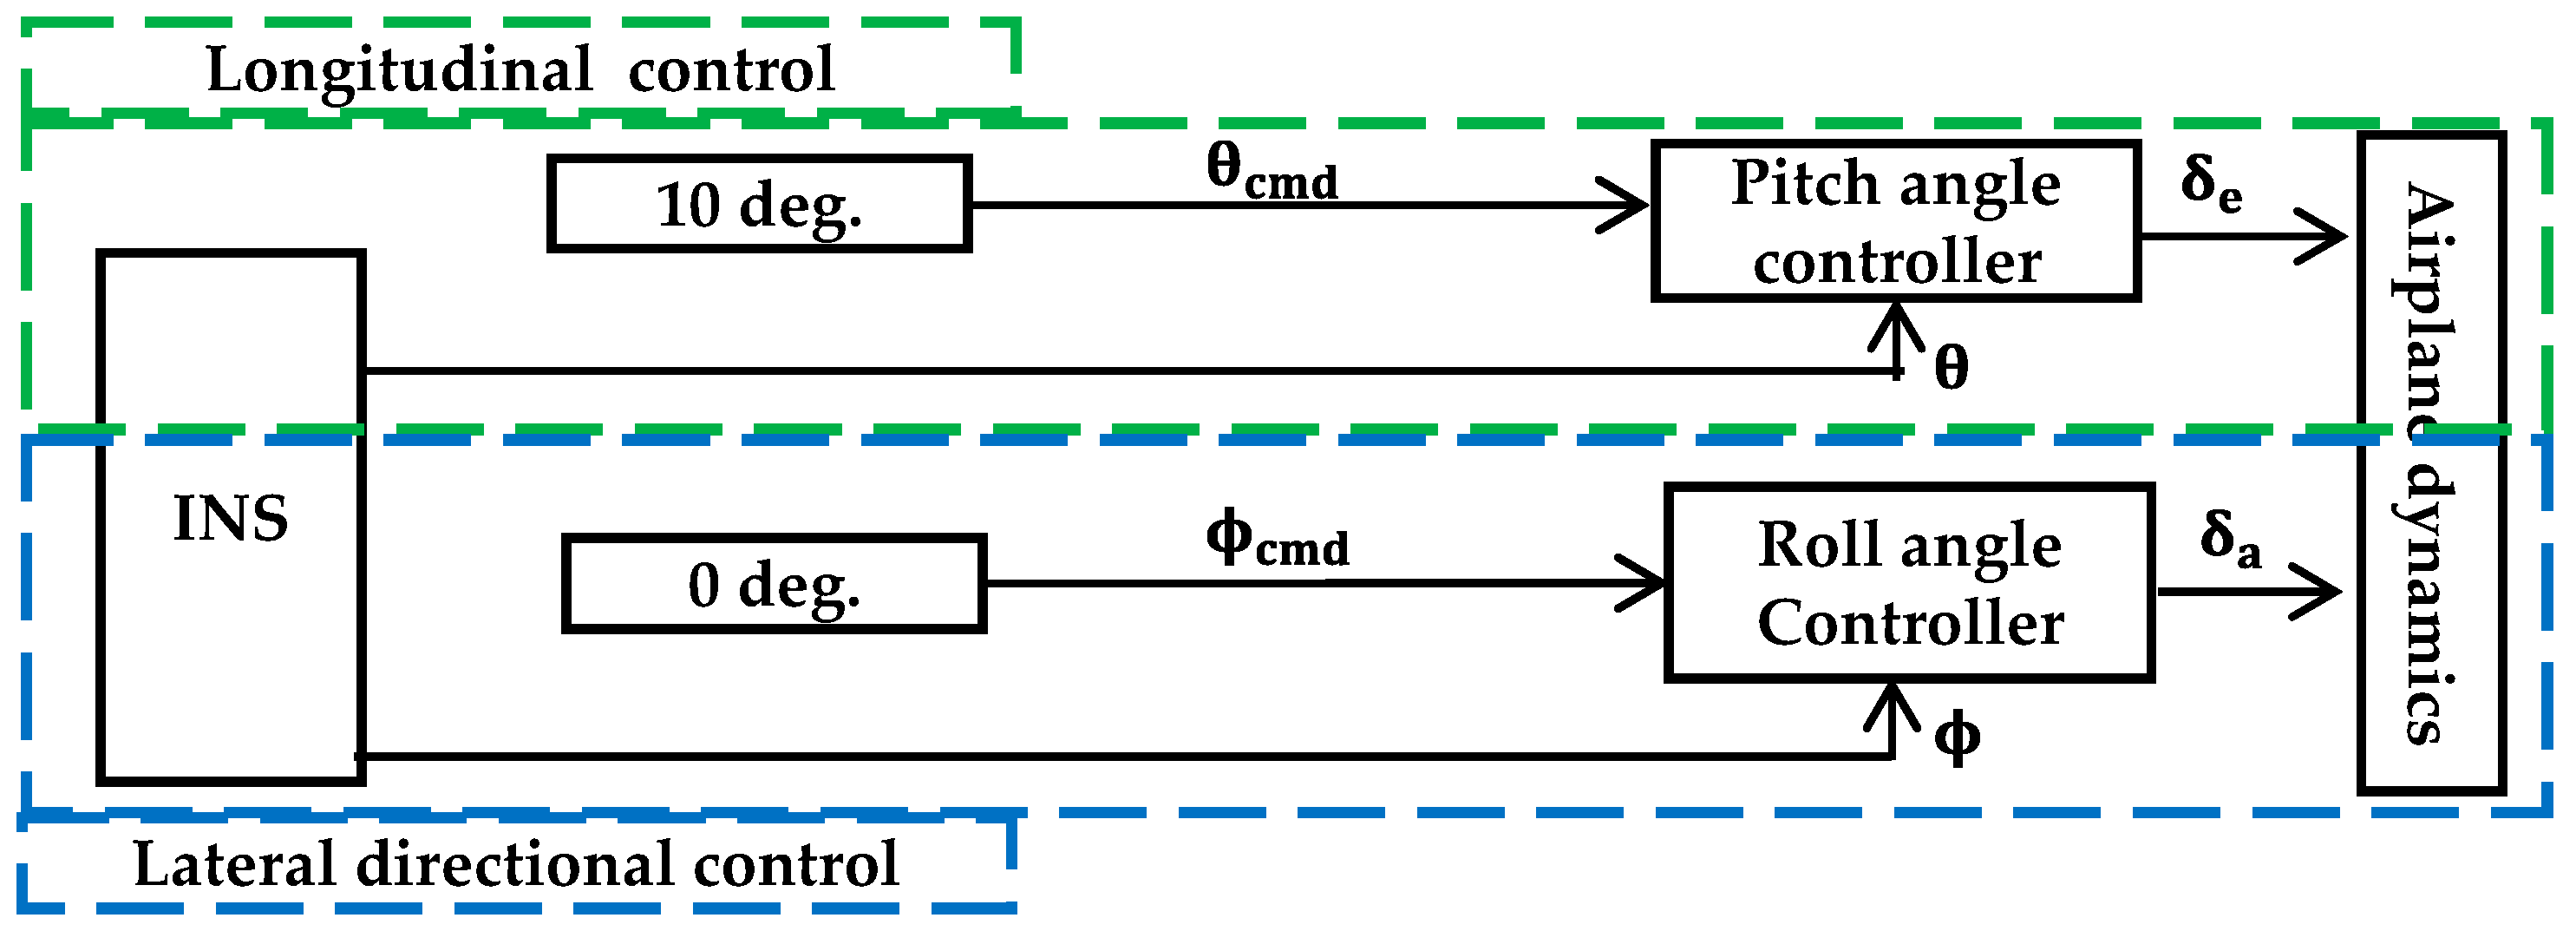
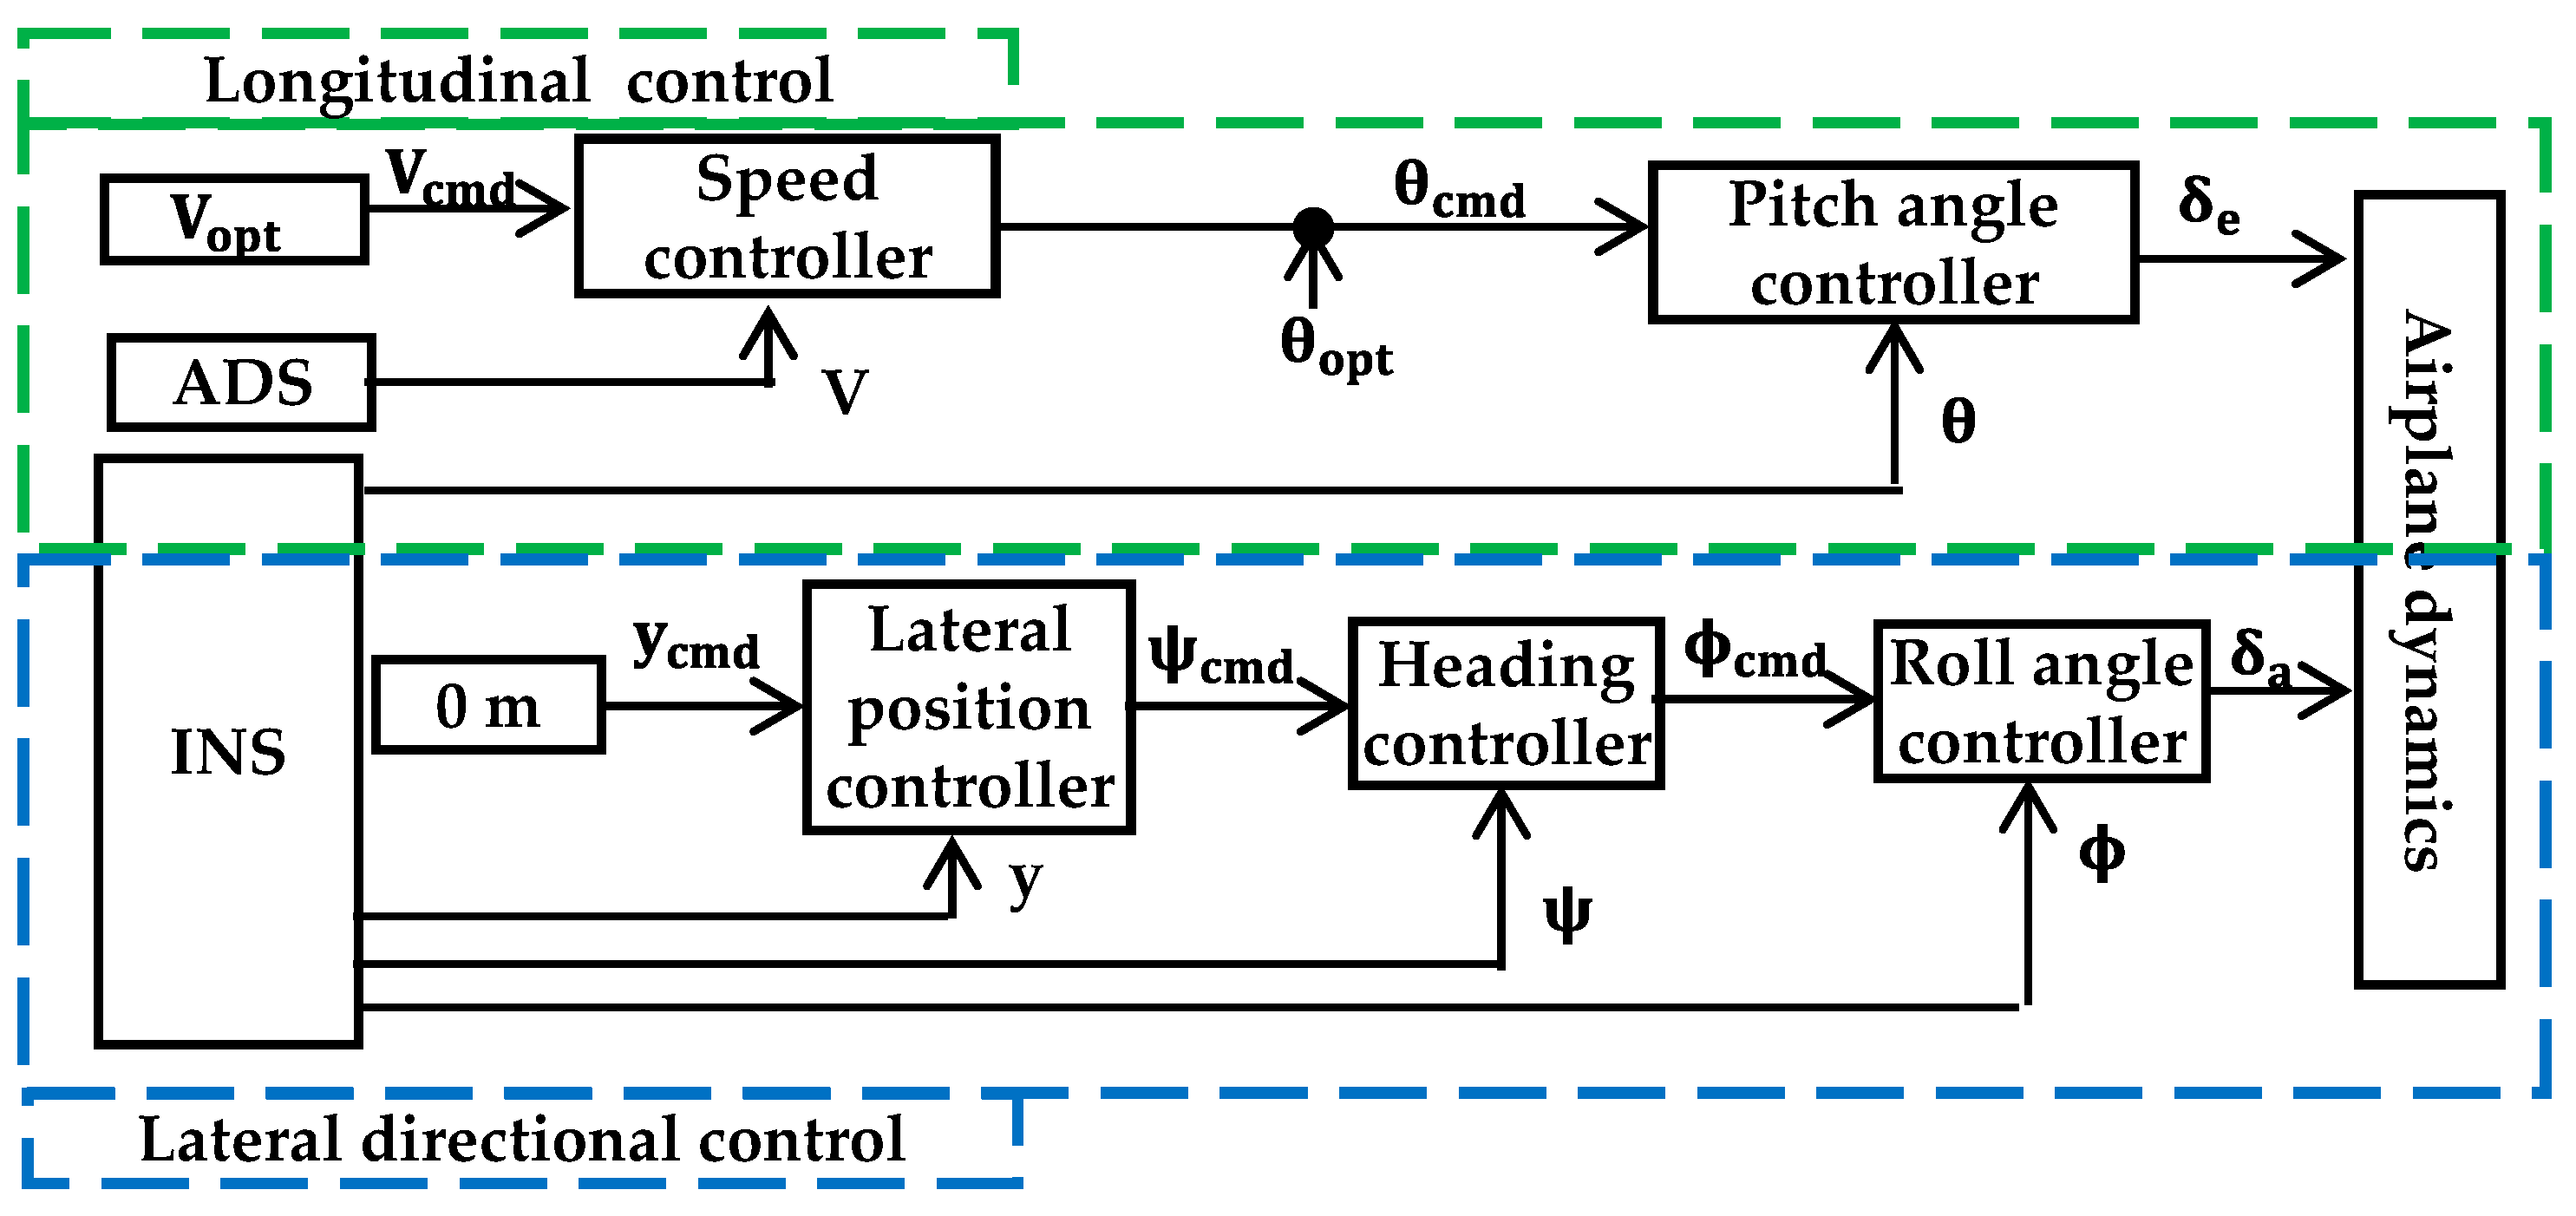
3.2. Flight Control System for Model Airplane during Takeoff
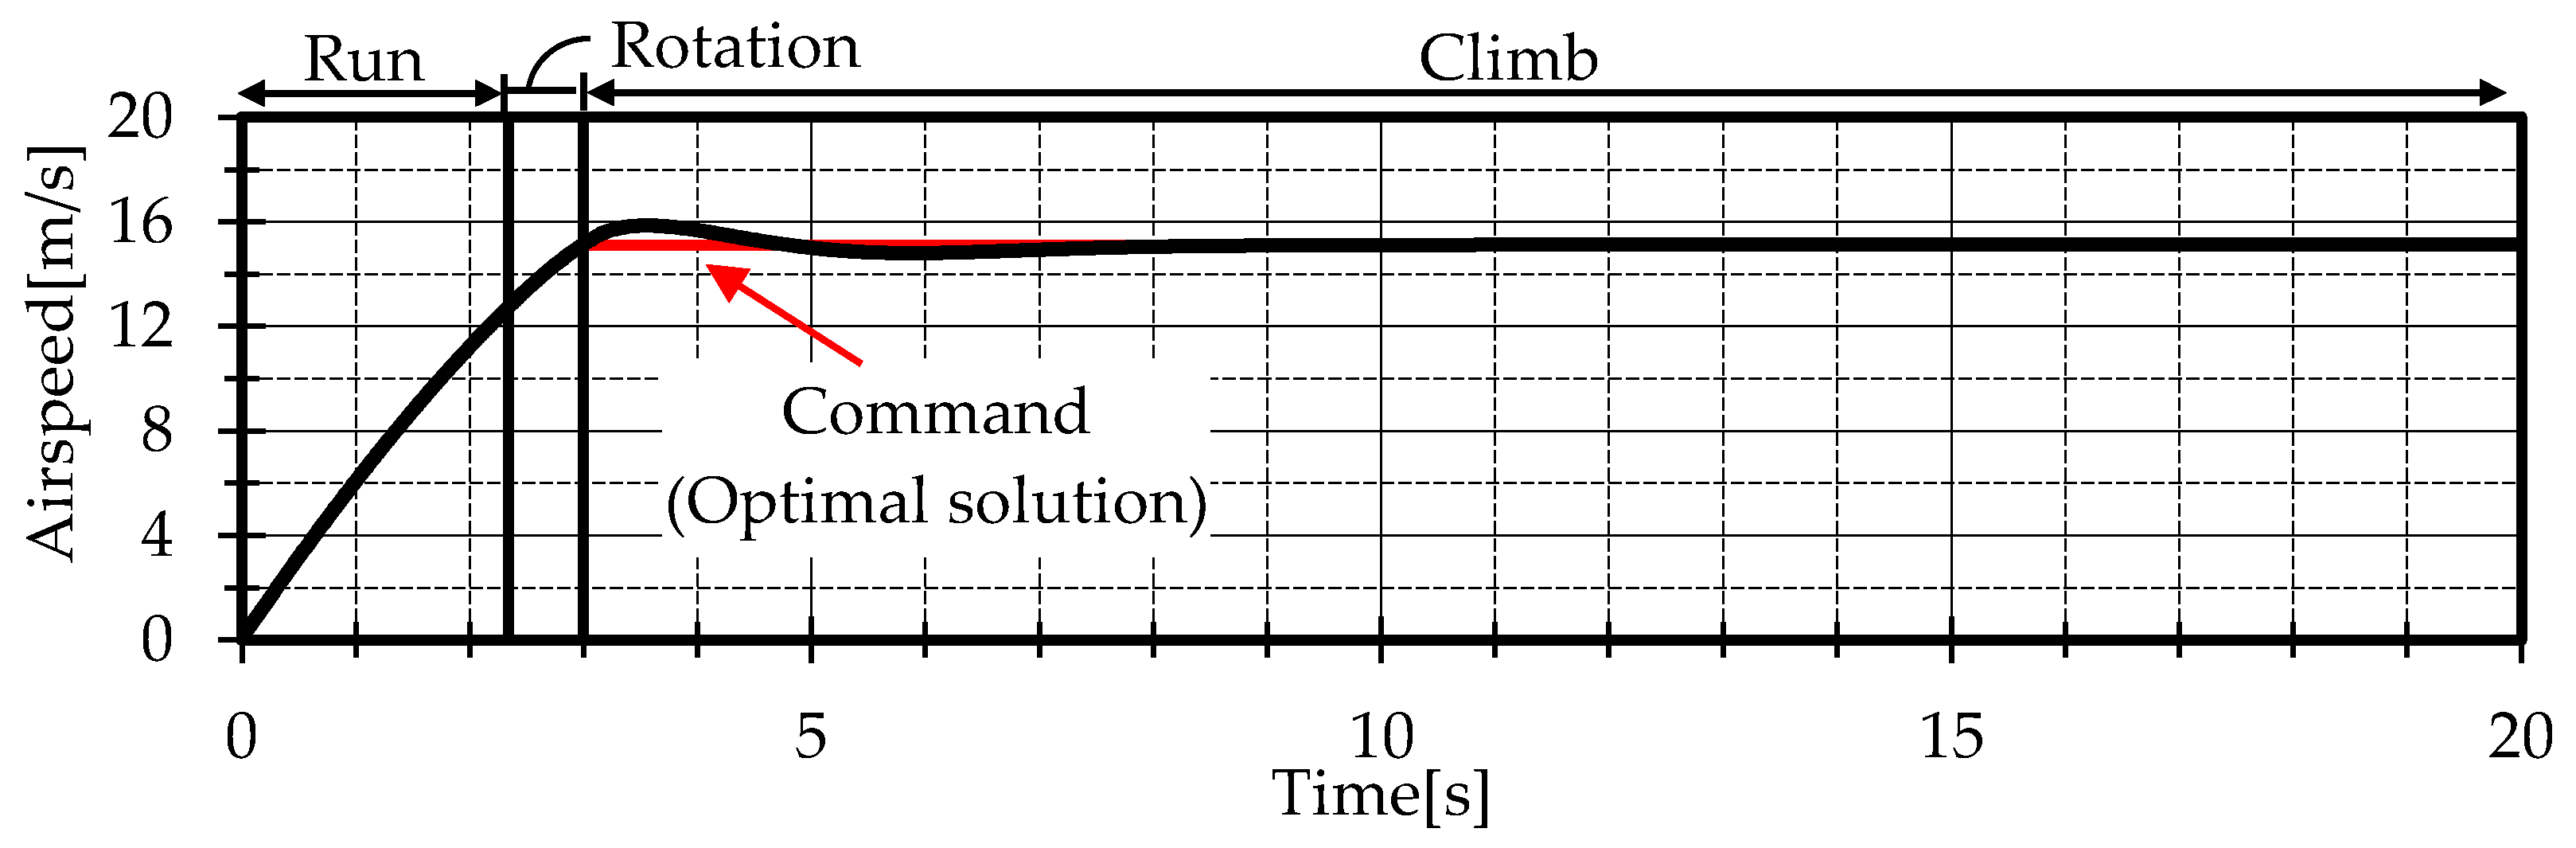
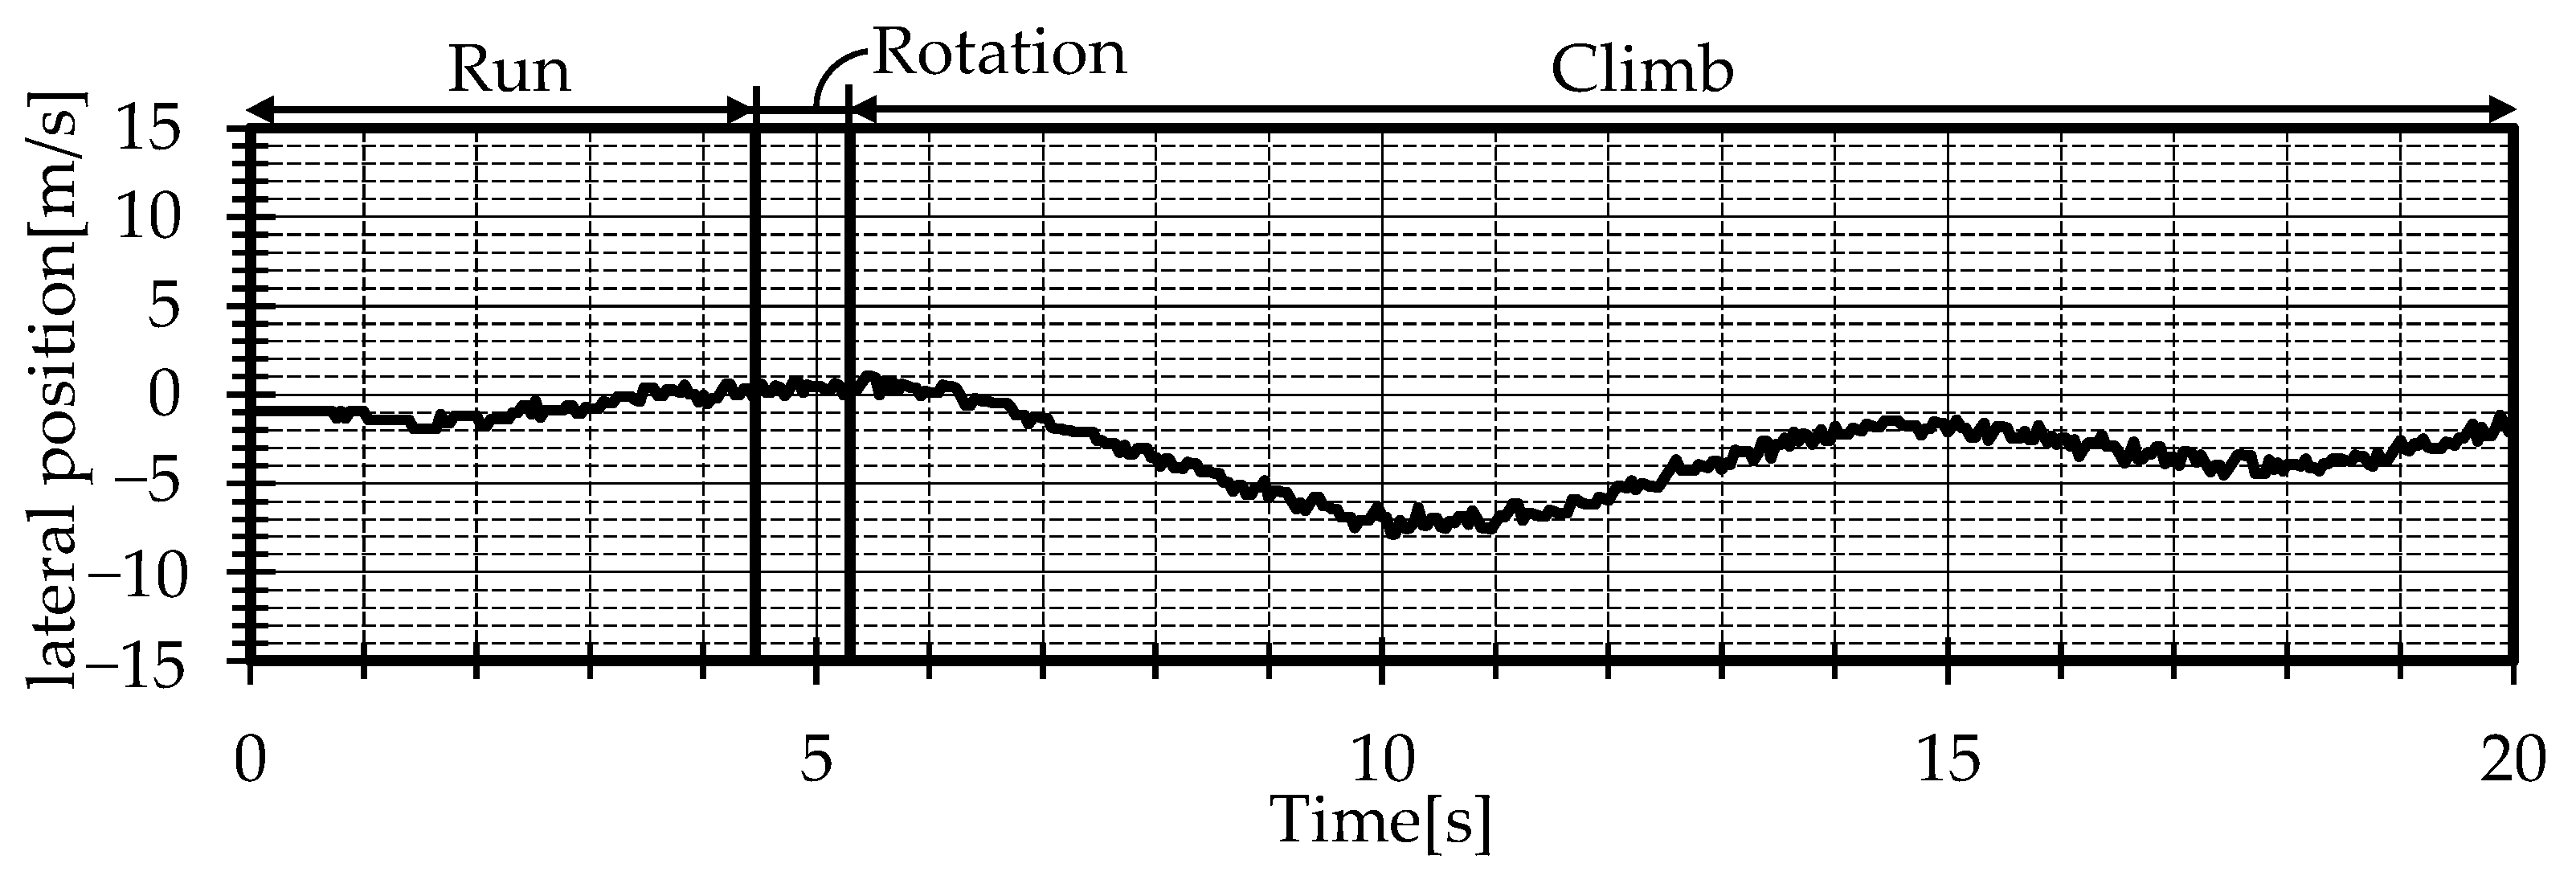
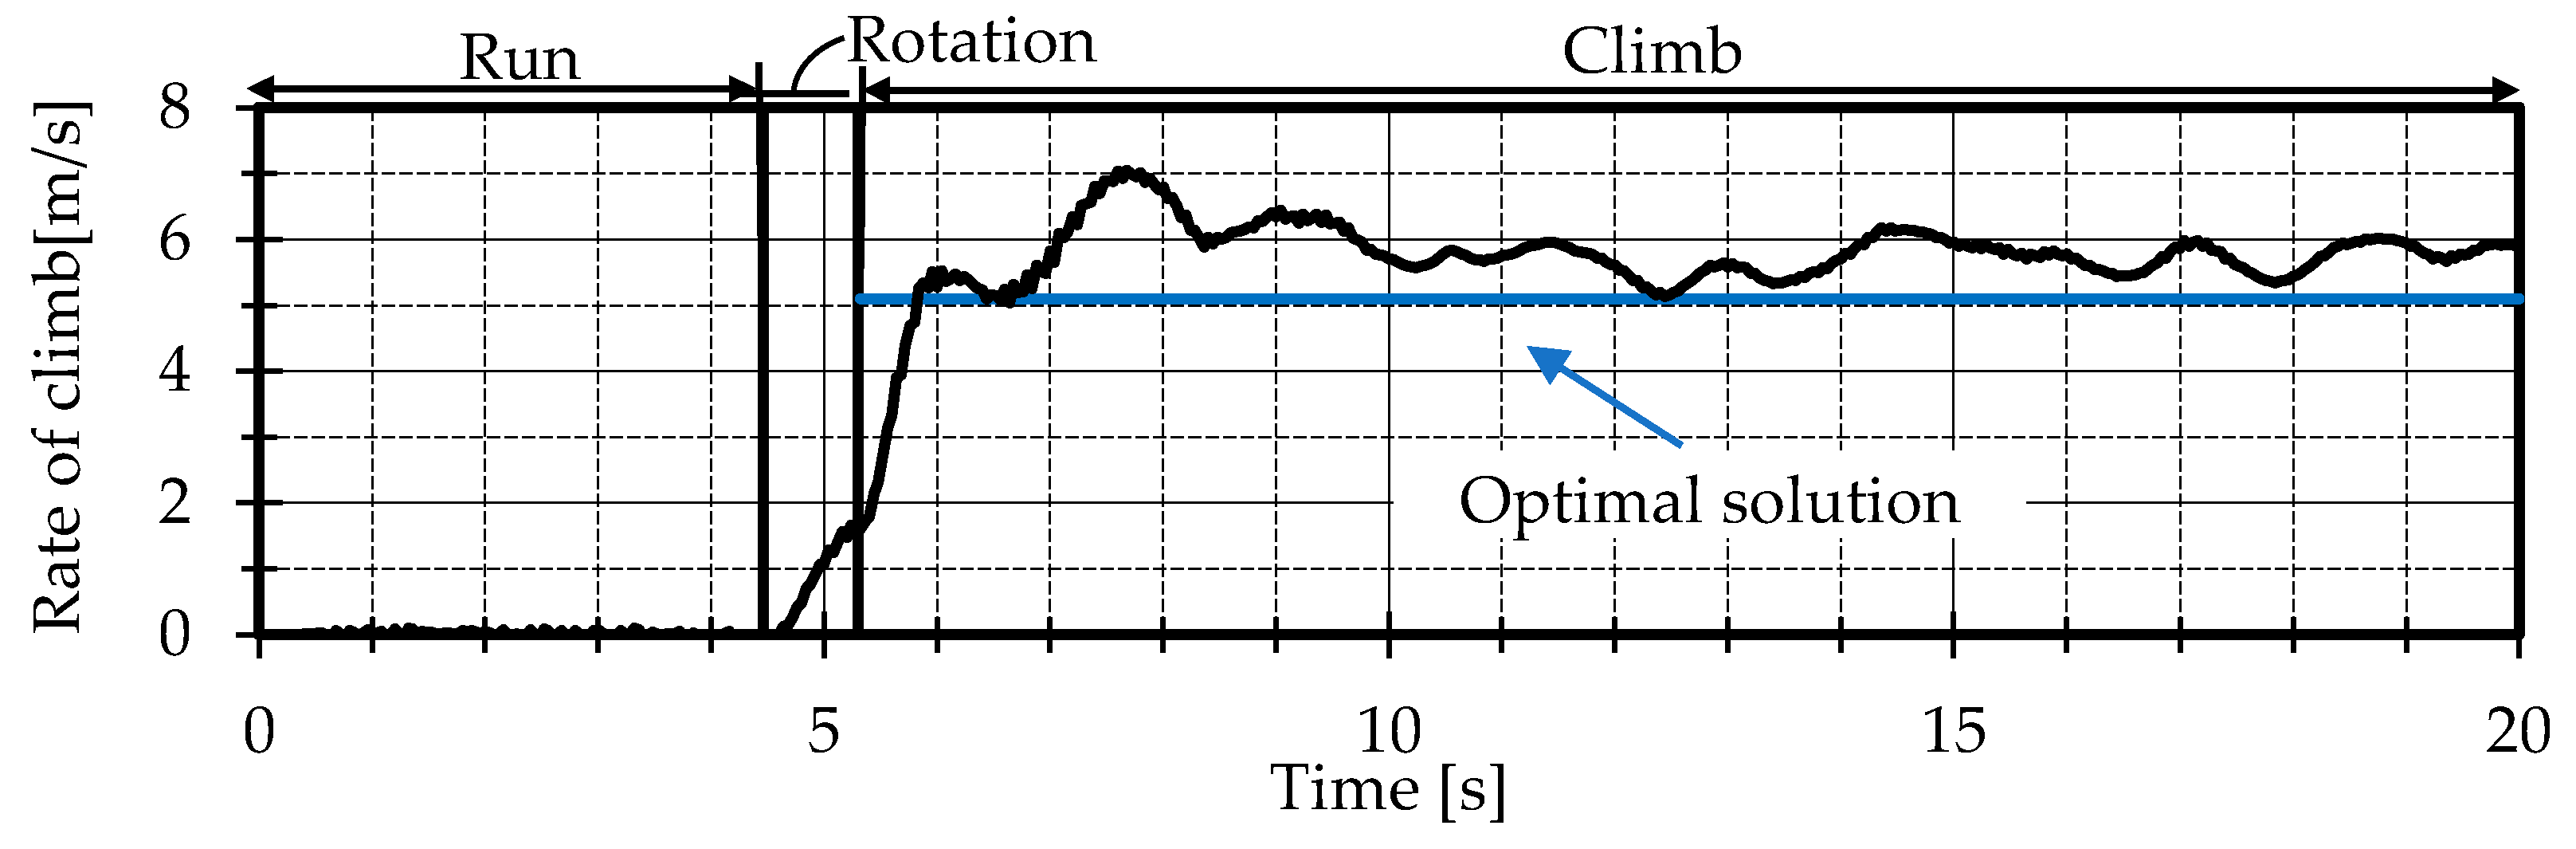
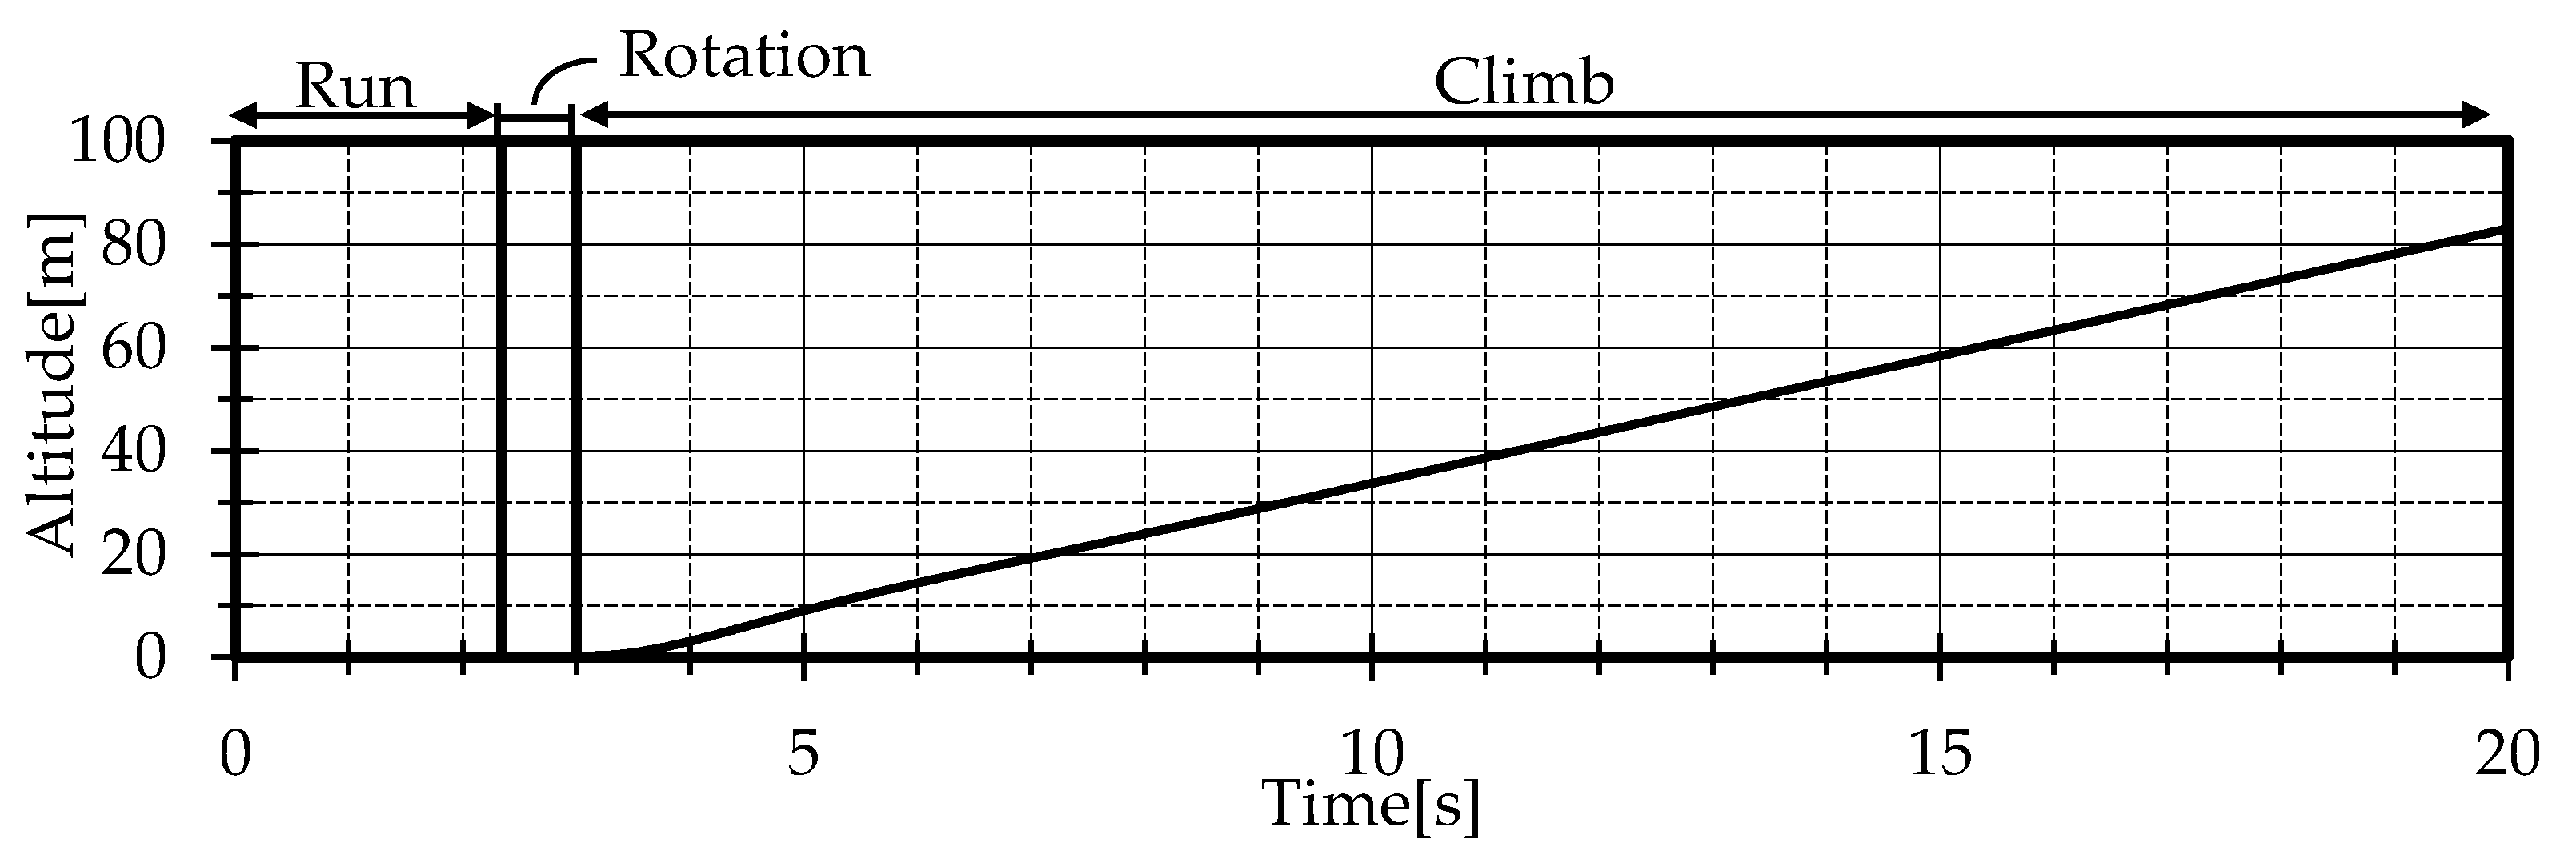
3.3. Results of 6-DOF Flight Simulation
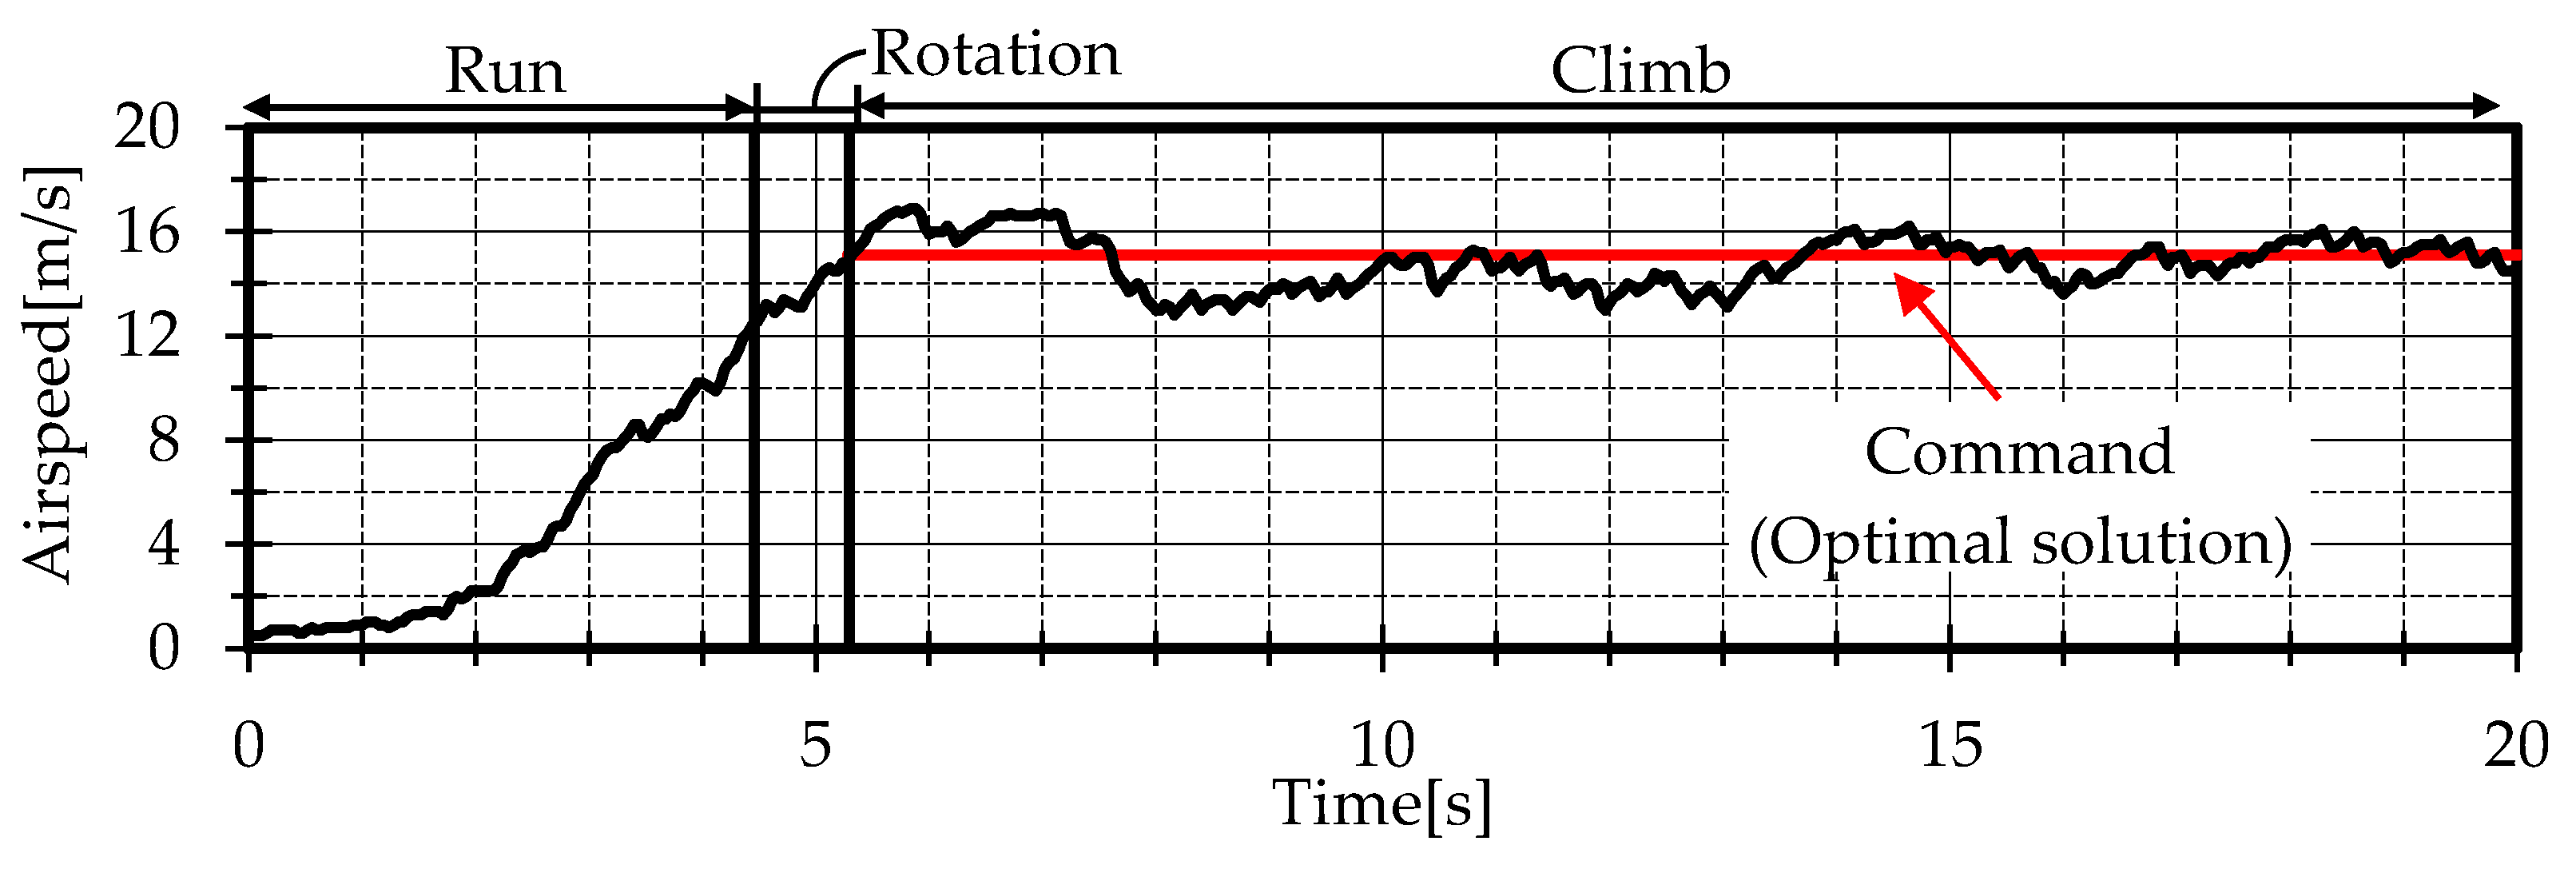
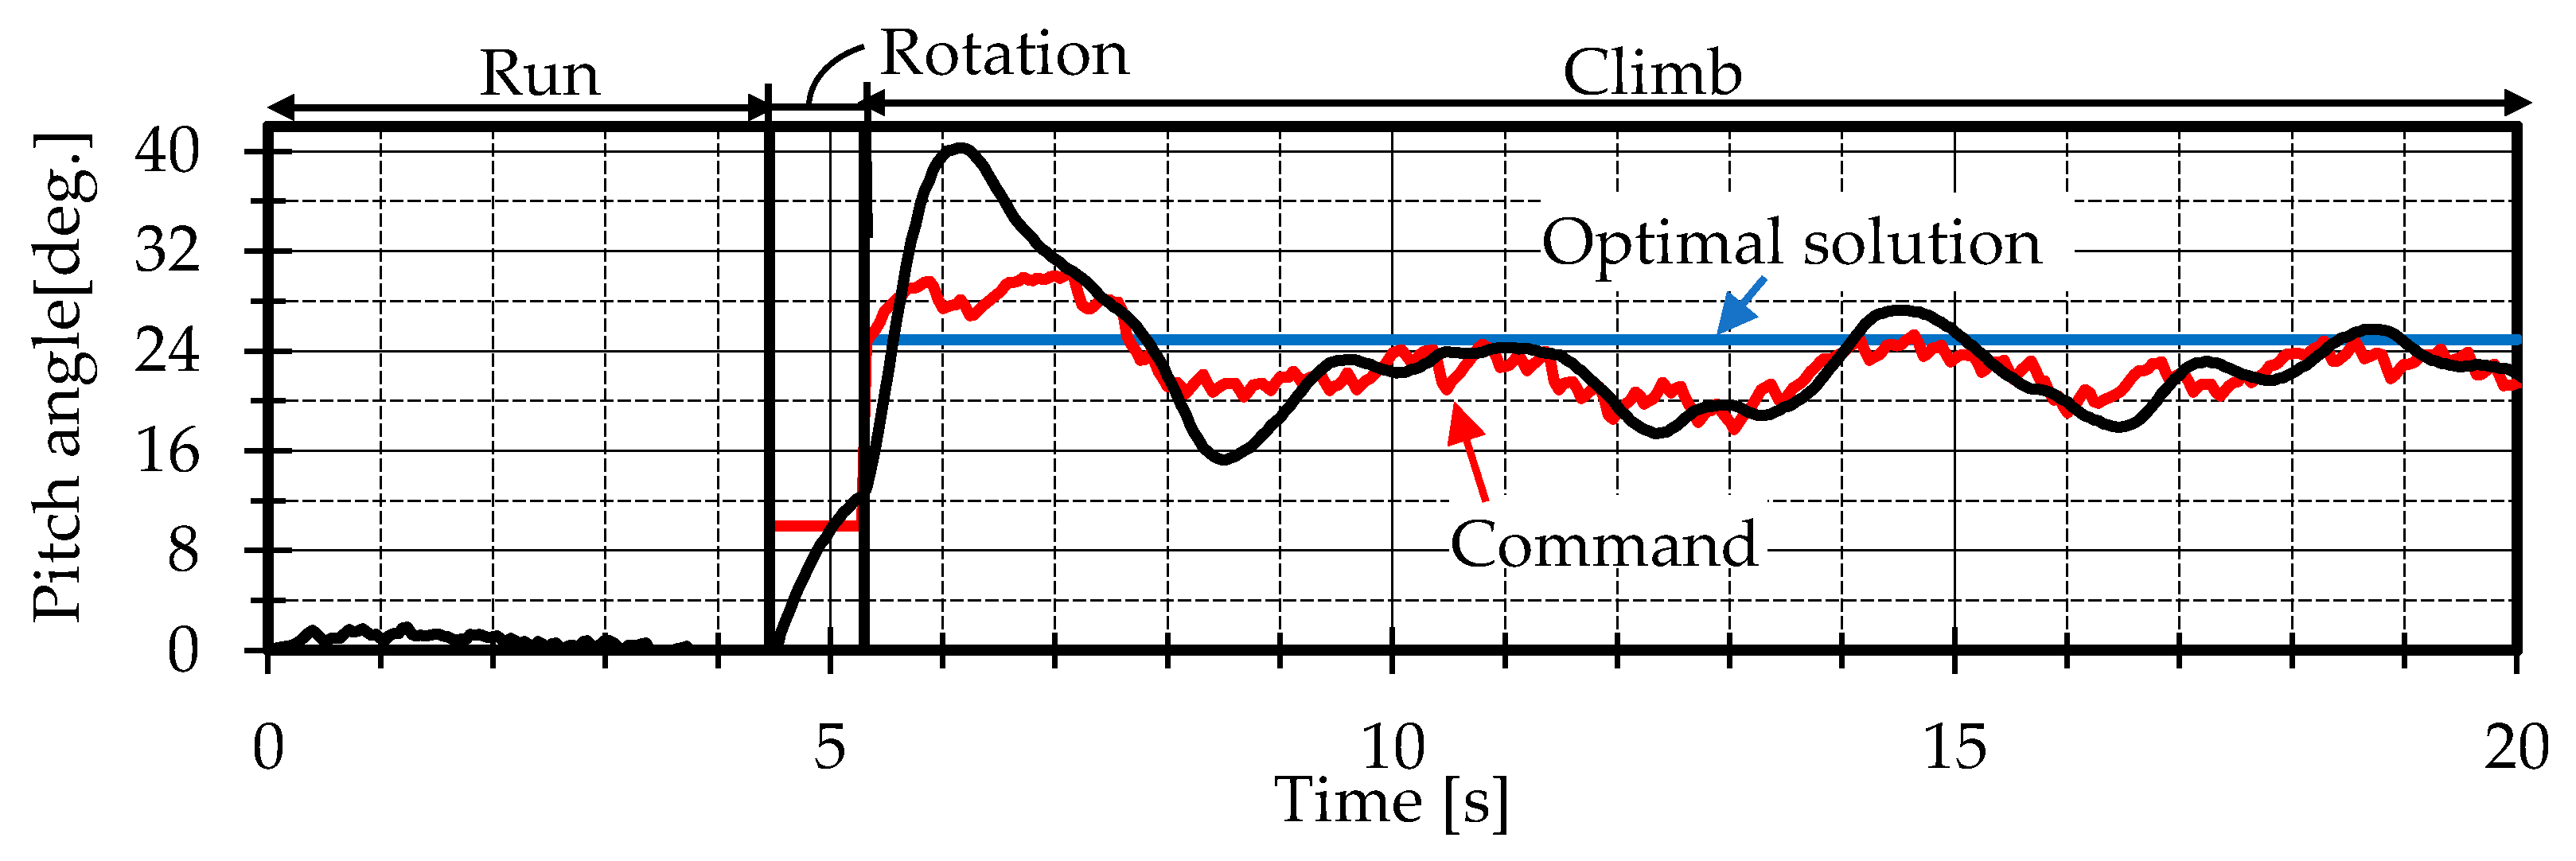
4. Flight Experiment
4.1. Judgement Conditions
4.2. Experimental Results
4.3. Comparison of Flight Experiment and 6-DOF Flight Simulation Results
5. Conclusions
Author Contributions
Funding
Data Availability Statement
Conflicts of Interest
Nomenclature
| g | gravitational acceleration, m/s2 | c | chord length, m |
| atmospheric density, kg/m3 | e | Oswald efficiency number | |
| lift, N | AR | aspect ratio | |
| drag, N | S | wing area, m2 | |
| weight, N | J | evaluation function | |
| angle of attack, rad | H | Hamiltonian | |
| path angle, rad | adjoint variable | ||
| coefficient of lift | V | airspeed, m/s | |
| lift per unit AoA, 1/rad | rotation speed, m/s | ||
| coefficient of drag | takeoff safety speed, m/s | ||
| stall angle | T | thrust, N | |
| m | mass, kg | pitch angle, rad | |
| angle of aileron, elevator, steer | roll angle, rad | ||
| azimuth angle, rad | |||
| Subscripts | |||
| e | elevator | opt | optimal solution |
| a | aileron | cmd | command |
| steer | |||
References
- Chauhan, S.S.; Martins, J.R. Tilt-Wing eVTOL Takeoff Trajectory Optimization. J. Aircr. 2019, 57, 93–112. [Google Scholar] [CrossRef]
- Kaneko, S.; Martins, J.R. Simultaneous Optimization of Conceptual Design and Takeoff Trajectory of a Lift-Plus-Cruise UAV. In Proceedings of the 10th Autonomous VTOL Technical Meeting, Mesa, AZ, USA, 24–26 January 2023. [Google Scholar]
- Gao, J.; Zhang, Q.; Chen, J.; Wang, X. Take-Off Trajectory Optimization of Tilt-rotor Aircraft Based on Direct Allocation Method. IOP Conf. Ser. Mater. Sci. Eng. 2022, 768, 042004. [Google Scholar] [CrossRef]
- Masazumi, U.; Tomohiro, K.; Sakurako, N.; Yusuke, M. Verification of Fully Autonomous Flight from Takeoff to Landing of a Low-Speed Model Airplane with Application to a Small Unmanned Supersonic Airplane. Trans. Jpn. Soc. Aeronaut. Space Sci. Aerosp. Technol. Jpn. 2021, 9, 667–675. [Google Scholar]
- Ryuichi, I.; Seiji, T. Full Automatic Randing System and Long-Distance Flight of the Fixed-Wing UAV. In Proceedings of the 50th Automatic Control Union Conference, Yokohama, Japan, 24–25 November 2007. [Google Scholar]
- Meng, X.; Xu, Z.; Chang, M.; Bai, J. Performance Analysis and Flow Mechanism of Channel Wing Considering Propeller Slipstream. Chin. J. Aeronaut. 2023, 36, 165–184. [Google Scholar] [CrossRef]
- Courtin, C.B. An Assessment of Electric STOL Aircraft. Master’s Thesis, Massachusetts Institute of Technology, Cambridge, MA, USA, 2019. [Google Scholar]
- Federal Aviation Administration. Instrument Procedures Handbook; Federal Aviation Administration: Washington, DC, USA, 2017; p. 33. [Google Scholar]
- Wing Commander; Kelly, L. Optimum Climb Technique for a Jet Propelled Aircraft; College of Aeronautics, Cranfield: Oxon, UK, 1952. [Google Scholar]
- Bryson, A.E.; Denham, W.F. A Steepest-Ascent Method for Solving Optimum Programming Problems. J. Appl. Mech. 1962, 29, 247–257. [Google Scholar] [CrossRef]
- Ong, S.Y. A Model Comparison of a Supersonic Aircraft Minimum Time-to-Climb Problem. Master’s Thesis, Iowa State University of Science and Technology, Ames, IA, USA, 1986. [Google Scholar]
- Tomoyuki, Y.; Kanichiro, K. Minimum Time Climb for Airplane [Translated from Japanese]. In Proceedings of the 20th Airplane Symposium, Tokyo, Japan, 12 November 1982. [Google Scholar]
- Bryson, E., Jr.; Ho, Y.-C. Applied Optimal Control; Taylor & Francis Group: New York, NY, USA, 1975; pp. 8–9. [Google Scholar]
- Ostler, J.N.; Bowman, W.J.; Snyder, D.O.; McLain, T.W. Performance Flight Testing of Small Electric Powered Unmanned Aerial Vehicles. Int. J. Micro Air Veh. 2009, 1, 155–171. [Google Scholar] [CrossRef]
- Masazumi, U.; Yuichi, T.; Kouhei, T.; Tomohiro, K. Design and Tests of Guidance and Control Systems for Autonomous Flight of a Low-Speed Model Airplane for Application to a Small-Scale Unmanned Supersonic Airplane. Trans. Jpn. Soc. Aeronaut. Space Sci. Aerosp. Technol. Jpn. 2019, 17, 220–226. [Google Scholar]
- Kanichiro, K.; Akio, O.; Kenji, K. Introduction to Aircraft Dynamics; Translated from Japanese; The University of Tokyo Press: Tokyo, Japan, 2012. [Google Scholar]
- MATLAB. Available online: https://jp.mathworks.com/products/matlab.html?s_tid=hp_products_matlab (accessed on 9 March 2024).
- Rankine, W.J.M. On The Mechanical Principles of the Action of Propellers; Institution of Naval Architects: London UK, 1865; Volume 6, pp. 13–39. [Google Scholar]
- Glauert, H. The Elements of Aerofoil and Airscrew Theory, 2nd ed.; Cambridge at the University Press: Cambridge, UK, 2008; pp. 208–221. [Google Scholar]
- Performance Data. Available online: https://www.apcprop.com/technical-information/performance-data/ (accessed on 26 July 2023).
- Public Domain Aeronautical Software. Available online: https://www.pdas.com/index.html (accessed on 9 March 2024).
- Takahashi, K.; Ueba, M. Flight Experiment of Take-off Control System for Small-Scale Unmanned Supersonic Experimental Airplane. In Proceedings of the 54th Airplane Symposium, Toyama, Japan, 28 October 2016. [Google Scholar]
- Simulink. Available online: https://jp.mathworks.com/products/simulink.html (accessed on 9 March 2024).
- Aircraft Safety Division, Safety Department, Civil Aviation Bureau, Ministry of Land, Infrastructure, Transport and Tourism. Airworthiness Standards; Houbunnsyorin Publishing: Tokyo, Japan, 2012; p. 53. [Google Scholar]


| Airplane Specification | Value |
|---|---|
| m | 6.0 kg |
| c | m |
| 10 deg. | |
| m2 | |
| 6.54 |
| Longitudinal | Lateral | ||
|---|---|---|---|
| 4.355 | −0.1623 | ||
| −0.03861 | |||
| 0.08116 | |||
| −0.3790 | 0.1431 | ||
| 0.06371 | −0.05330 | ||
| 0 | −0.4022 | ||
| −4.355 | 0.009653 | ||
| −0.4324 | −0.7798 | ||
| −4.881 | 0.08940 | ||
| 0 | 0.04465 | ||
| −1.359 | 0 | ||
| −1.220 | −0.03578 | ||
| −13.78 | −0.01062 | ||
| −5.111 | −0.1052 | ||
| Item | Value |
|---|---|
| 1.23 kg/m3 | |
| 9.81 m/s2 |
| Flight Variable | Optimal Solution |
|---|---|
| 15.1 m/s | |
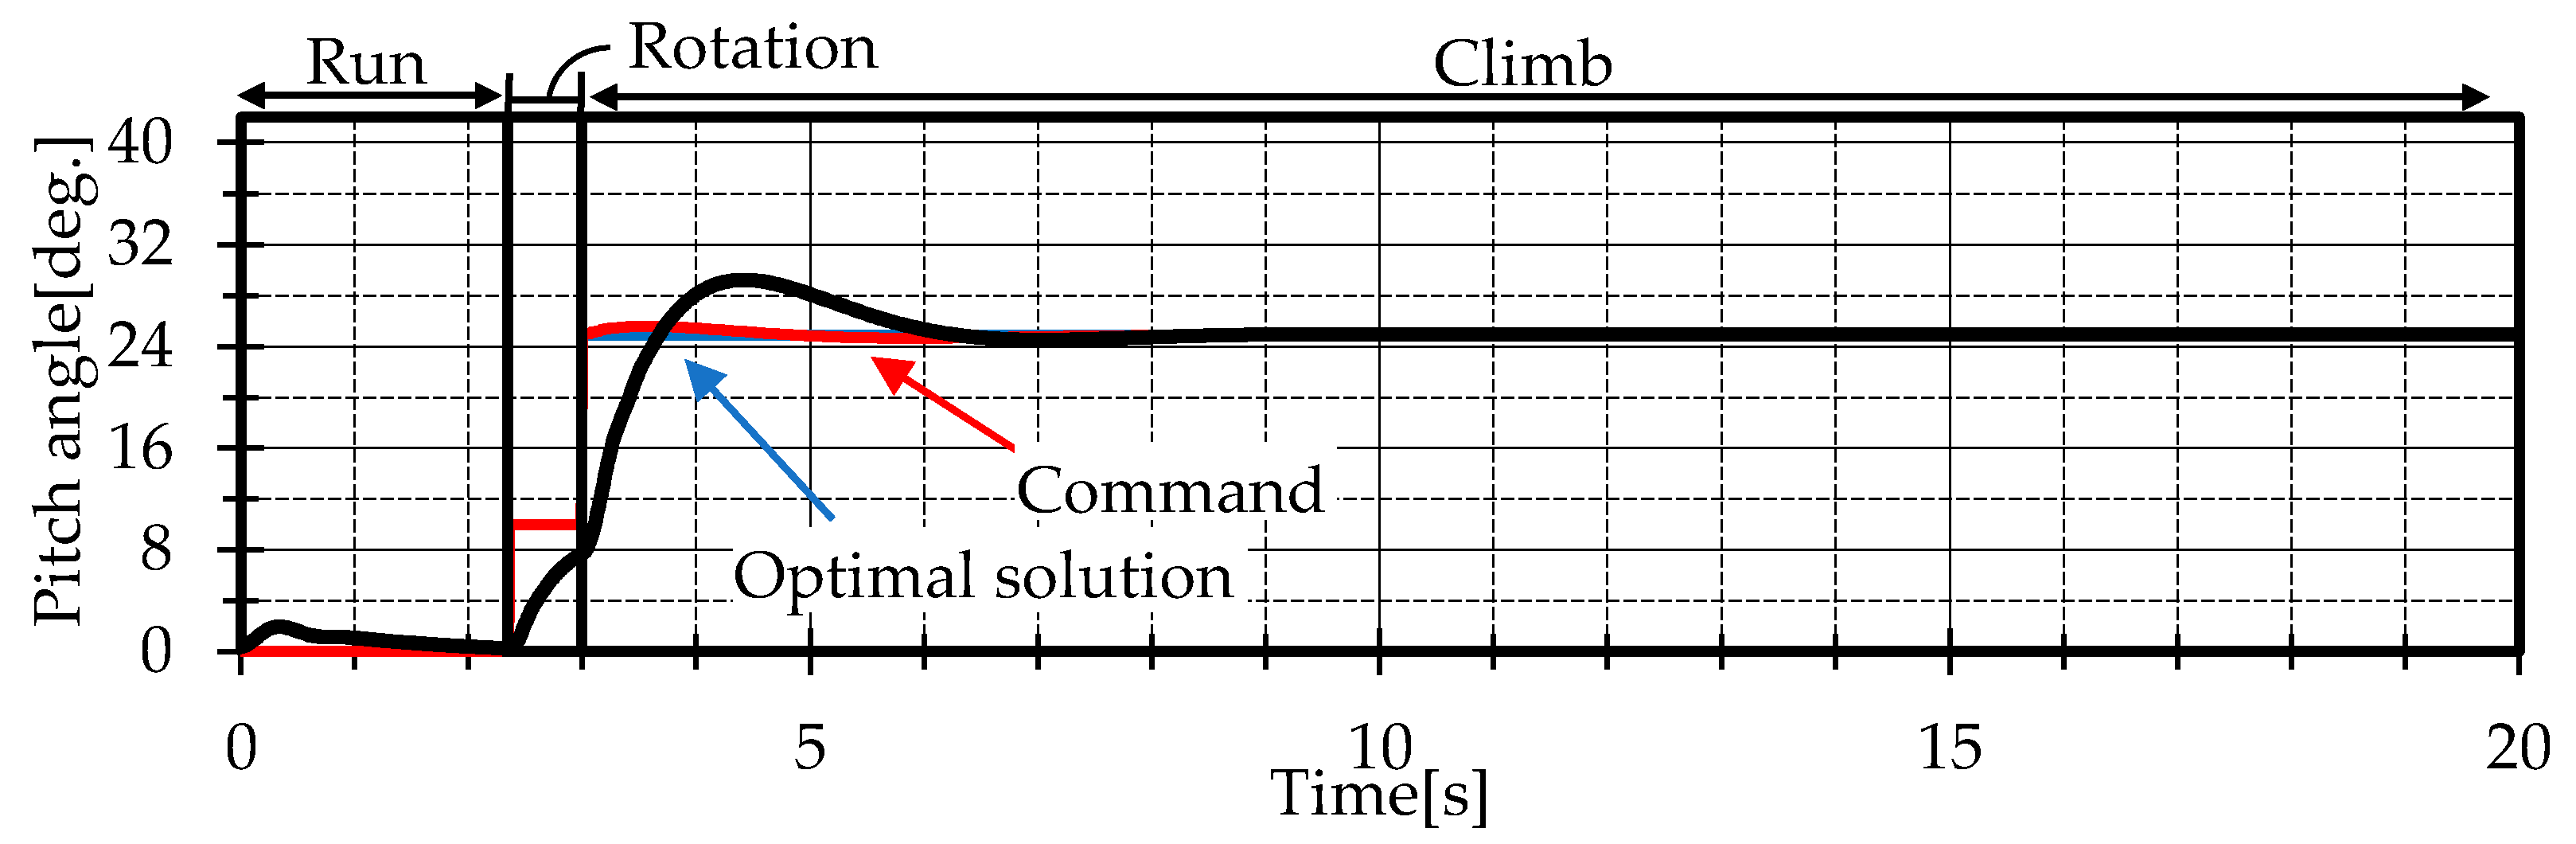
| 5.4 deg. | |
| 19.6 deg. | |
| 24.9 deg. | |
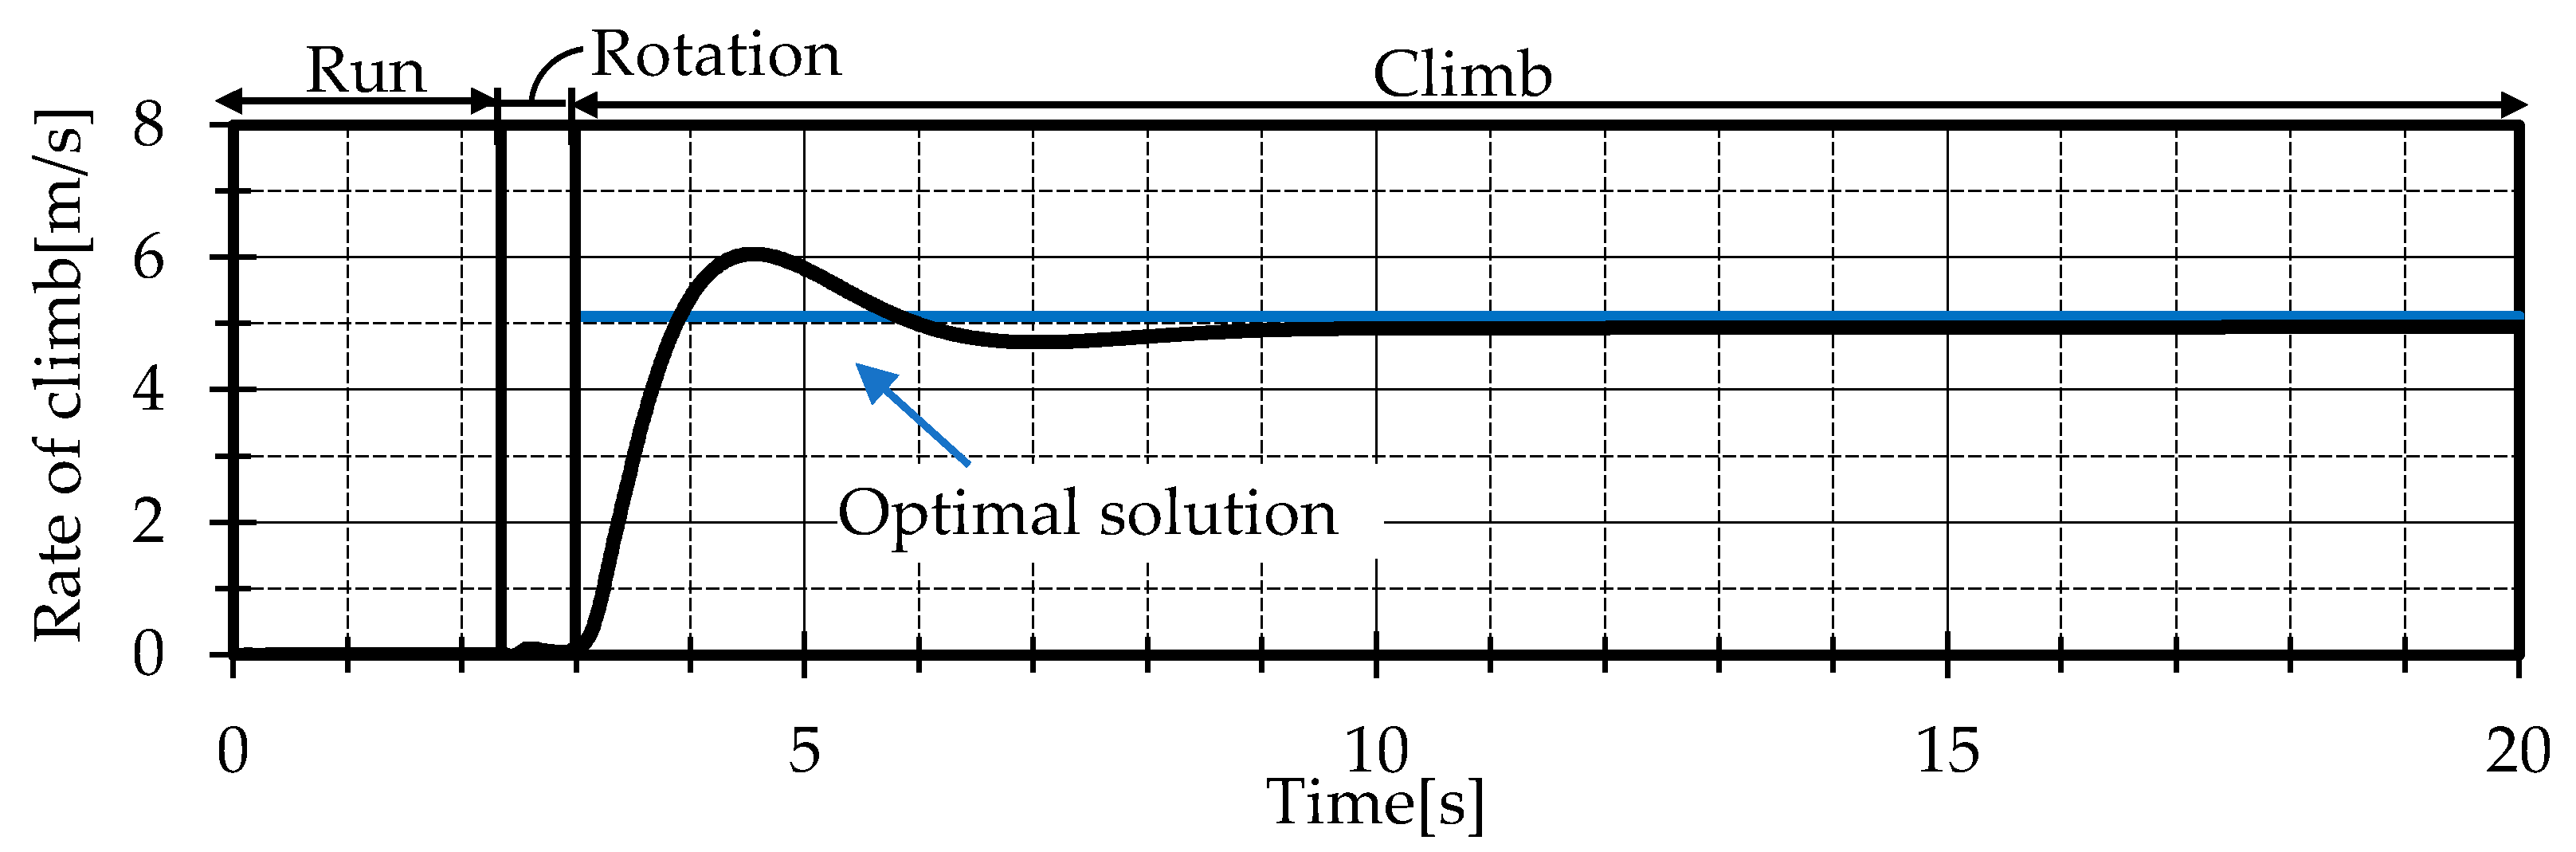
| 5.1 m/s |
| Flight Variable | Airspeed |
|---|---|
| 12.5 m/s | |
| 15.1 m/s |
| Flight Variable | Standard Deviation |
|---|---|
| Airspeed | 1.8 m/s |
| Pitch angle | 0.5 deg. |
| Flight Variable | Minimum | Nominal | Max |
|---|---|---|---|
| Airspeed discrepancy (true airspeed) | −1.8 m/s (13.3 m/s) | 0 m/s (15.1 m/s) | 1.8 m/s (16.9 m/s) |
| Pitch angle | 29.0 deg. | 24.9 deg. | 21.0 deg. |
| Flight Variable | Criteria |
|---|---|
| Airspeed | 3.6 m/s |
| Pitch angle | 8.0 deg. |
| Airspeed | Pitch Angle | Rate of Climb | |
|---|---|---|---|
| Optimal solution | 15.1 m/s | 24.9 deg. | 5.1 m/s |
| Simulation | 15.1 m/s | 24.9 deg. | 4.9 m/s |
| Experiment | 15.1 m/s | 22.0 deg. | 5.7 m/s |
Disclaimer/Publisher’s Note: The statements, opinions and data contained in all publications are solely those of the individual author(s) and contributor(s) and not of MDPI and/or the editor(s). MDPI and/or the editor(s) disclaim responsibility for any injury to people or property resulting from any ideas, methods, instructions or products referred to in the content. |
© 2024 by the authors. Licensee MDPI, Basel, Switzerland. This article is an open access article distributed under the terms and conditions of the Creative Commons Attribution (CC BY) license (https://creativecommons.org/licenses/by/4.0/).
Share and Cite
Watanabe, K.; Shibata, T.; Ueba, M. Derivation and Flight Test Validation of Maximum Rate of Climb during Takeoff for Fixed-Wing UAV Driven by Propeller Engine. Aerospace 2024, 11, 233. https://doi.org/10.3390/aerospace11030233
Watanabe K, Shibata T, Ueba M. Derivation and Flight Test Validation of Maximum Rate of Climb during Takeoff for Fixed-Wing UAV Driven by Propeller Engine. Aerospace. 2024; 11(3):233. https://doi.org/10.3390/aerospace11030233
Chicago/Turabian StyleWatanabe, Katsumi, Takuma Shibata, and Masazumi Ueba. 2024. "Derivation and Flight Test Validation of Maximum Rate of Climb during Takeoff for Fixed-Wing UAV Driven by Propeller Engine" Aerospace 11, no. 3: 233. https://doi.org/10.3390/aerospace11030233
APA StyleWatanabe, K., Shibata, T., & Ueba, M. (2024). Derivation and Flight Test Validation of Maximum Rate of Climb during Takeoff for Fixed-Wing UAV Driven by Propeller Engine. Aerospace, 11(3), 233. https://doi.org/10.3390/aerospace11030233