Abstract
Most existing studies on aerodynamic shape optimization have not considered longitudinal trim under control surface deflection, typically achieving self-trim through a constraint of zero pitching moment or adjusting the optimized configuration for longitudinal trim. However, adjustments to the optimized configuration might introduce additional drag, reducing overall optimization benefits. In this paper, a novel approach of incorporating control surface deflection for longitudinal trim in aerodynamic optimization is proposed. Firstly, an aerodynamic computation program based on the high-order panel method was developed, introducing velocity perturbations on specific mesh surfaces to simulate actual control surface deflections. Subsequently, a comprehensive optimization framework was established, encompassing parametric modeling, aerodynamic computation, and variable-fidelity control surface deflection analysis. Finally, aerodynamic optimization analysis was conducted under both subsonic and supersonic conditions. Thirty-one design variables were selected with the trimmed lift-to-drag ratio in cruising condition as the objective function and the control surface deflection angle as the constraint. The results indicated an 8.52% increase in the trimmed lift-to-drag ratio compared to the baseline model under subsonic conditions and an 8.1% increase under supersonic conditions.
1. Introduction
Aerodynamic shape optimization plays a pivotal role in enhancing the aircraft’s overall performance. As demands for aircraft performance continually escalate, optimization in the preliminary design phase of an aircraft has become increasingly critical [1]. In this process, while high aerodynamic efficiency is sought, stability remains paramount. Enhanced aerodynamic efficiency is directly linked to improved fuel efficiency, speed, range, and aircraft payload capacity. Conversely, stability forms the foundation for safe flight operations [2]. Consequently, integrating these two aspects into aerodynamic shape optimization has emerged as a significant research direction in aeronautical design. In designs focused on stability, longitudinal trim, characterized by zero pitching moment at the design point to maintain a stable pitch attitude during flight, is a critical factor. Longitudinal trim is not only central to flight stability but is also crucial in achieving precise flight control [3].
Numerous researchers have delved into the aerodynamic optimization of aircraft, considering longitudinal stability constraints. Kai Wang [4] designed two optimization strategies for the NASA Common Research Model (CRM) wing–body–tail configuration: the first optimized the configuration without considering pitch moment balance, followed by manual trimming using the horizontal tail, and the second imposed a zero-pitching moment constraint directly in the optimization model. The results indicated that the first strategy increased drag during manual trimming, making the drag reduction in the second strategy superior. Vassberg JC [5] achieved longitudinal trim by adjusting the horizontal tail’s installation angle. Chen S [6] developed a trim penalty surrogate model to incorporate a trim drag penalty proportional to the pitching moment in the configuration’s drag optimization, balancing aircraft performance and trim drag loss. Lyu, Z.J. and others [7,8,9,10,11] introduced longitudinal trim consideration into gradient-based optimization by deriving adjoint equations for solving zero-pitching moment constraints. Rubén [12] applied Prandtl’s lifting line theory to compute the lift distribution of wings and horizontal tails, optimizing the combination using genetic algorithms to achieve optimal lift distribution while considering longitudinal trim.
Current research primarily focuses on conventional aircraft configurations with horizontal tails, where longitudinal trim requirements are met by optimizing wing parameters or adjusting the angle of the horizontal tail. However, for tailless aircraft configurations [13,14], such as the widely used flying wing layout, adjusting the horizontal tail angle is not applicable. Instead, optimization is solely reliant on wing parameter adjustments to achieve self-trimming. However, self-trimming is effective only at the design speed point and has significant limitations. For optimization across multiple speed design points, deflecting control surfaces must be employed to meet longitudinal trim requirements simultaneously.
Addressing the aforementioned challenges, this paper aims to propose an aerodynamic optimization method for subsonic/supersonic aircraft, incorporating control surface deflection to achieve longitudinal trim. Initially, the paper outlines the theoretical basis for employing high-order panel methods in aerodynamic calculations and simulating control surface deflections through velocity perturbations on designated mesh surfaces, which is then substantiated by accuracy validation against wind tunnel test results. Subsequently, a comprehensive optimization framework encompassing parametric modeling, aerodynamic computation, and variable-fidelity control surface deflection analysis is constructed, detailing the implementation strategies for each module. Then, a baseline model of a low aspect ratio flying wing aircraft is established. The optimization is conducted on multiple section parameters under subsonic (M = 0.5) and supersonic (M = 1.5) conditions while maintaining the unaltered planform configuration of the aircraft. Maximizing the trimmed lift-to-drag ratio while ensuring longitudinal trim performance is the objective. Finally, an assessment and comparison of the aerodynamic performance between the baseline and optimized models are presented.
This paper continues in Section 2 by delineating the theoretical foundation of the numerical calculation methods and providing validation for their accuracy. Section 3 introduces an aerodynamic optimization framework for aircraft, considering longitudinal trim performance. In Section 4, optimization analyses under subsonic and supersonic conditions are conducted for the baseline model, accompanied by a comparison of aerodynamic performance before and after optimization. The final section summarizes the main conclusions of the research and proposes directions for future studies.
2. Theoretical Foundations and Accuracy Verification
This section presents the fundamental theory of employing the higher-order panel method for computing the aerodynamic performance of models. Based on this theory, a computational program has been developed in the PYTHON environment to conduct aerodynamic characteristic analyses of the model under subsonic and supersonic conditions. The results are then compared with wind tunnel experimental data, validating the accuracy of the program within its applicable range. Furthermore, an additional feature is implemented in the program to simulate control surface deflection by adding velocity perturbation on specified mesh surfaces. This approach enables the rapid calculation of aerodynamic performance for the deflected model while maintaining an unchanged geometric shape. Through numerical examples, the computational results of simulated control surface deflection are compared with those of actual deflection, confirming the feasibility of the method.
2.1. Method for Assessing Aerodynamic Performance
2.1.1. Theoretical Foundations of High-Order Panel Methods
The Prandtl–Glauert equation is employed as the fundamental equation for the solution of the flow field [15]. The formulation is as follows:
where denotes the freestream Mach number, while , , and represent the second-order derivatives of potential function . The derivation of Equation (1) employs assumptions about inviscid flow, isentropic conditions, irrotational flow, steady-state, and small disturbances. Furthermore, it is important to note that this equation cannot adequately describe transonic and hypersonic flow regimes. All subsequent derivations and applications are predicated upon these assumptions; hence, viscous-related forces, such as friction drag and nonlinear phenomena, will not be predicted. In cases involving thicker configurations or higher angles of attack, the perturbation velocities are often substantial, which consequently narrows the applicable range of Mach numbers even further.
To solve the potential on the model surface, two variables related to the potential function are defined on the panel: the source strength and the dipole strength :
As indicated by the definitions, sources represent the inflow and outflow of the fluid, while dipoles represent the fluid velocity distribution. To ensure the fluid flow’s physical correctness and the numerical solution’s accuracy, the source strength on the model surface follows a linear distribution, which means the fluid flow between adjacent panels is continuous without abrupt changes. The dipole strength follows a quadratic distribution, ensuring that both the velocity and its rate of change are continuous between adjacent panels. This continuity aids in simulating a smooth variation in the fluid velocity field.
The model surface can be discretized into several panels, with control points located at specified positions on each panel. Defining the source and dipole strength at these control points as unknown parameters, it is possible to express the source and dipole strength at any point on the model surface as linear combinations of these unknown parameters. Once the representation method for the source and dipole strengths on the model surface is established, the influence of all panels on the aircraft surface at the control points can be computed. This process necessitates considering the effects of compressibility in both subsonic and supersonic flows. Defining the indicator and the compressibility factor , the distance PQ from a point on a panel to the control point can be expressed as:
It is important to note that in the computation of the effects of the source and dipole distribution on the aircraft surface at the control points, the influence region of each control point in subsonic flow encompasses all panels. Still, in supersonic flow, the influence region of a control point is confined to the panel elements within its forward Mach cone.
For a conventional closed aircraft model, the following conditions must be satisfied: (1) the total normal mass flux at the model surface is constantly zero and (2) the potential function inside the configuration is constantly zero. These conditions can be represented by the following set of equations:
By applying the boundary condition of Equation (4) at each control point, a set of linear equations equal in number to the unknown parameters can be obtained. Consequently, a system of linear equations comprising parameters can be derived:
wherein is the vector representing the constraints and each row of the matrix represents the coefficients of the boundary condition equation at a specific control point.
Solving Equation (5) yields all the unknown source/dipole parameters. Substituting these into Equation (2) allows for determining the potential at any point on the model. Based on the potential, the pressure distribution on the model surface, as well as the axial forces and moments, can be calculated.
2.1.2. Verification of Accuracy in Aerodynamic Computational Programs
The subsonic computational model selected is the flying wing aircraft from the wind tunnel test report NASA TN D-7631 [16]. This model features an aspect ratio of 1.15 and a sweep angle of 74°. The axial view of the model is illustrated in Figure 1.
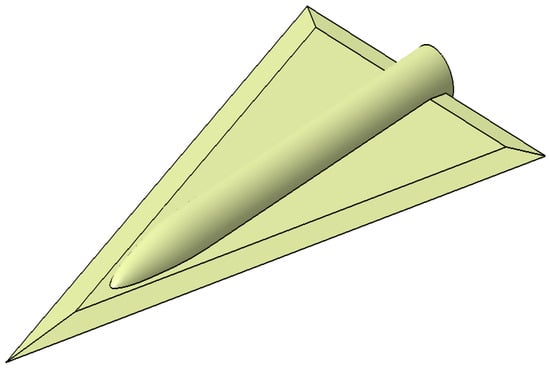
Figure 1.
The flying wing aircraft model in NASA TN D-7631.
At Mach numbers 0.6 and 0.8, the comparison between computational results and wind tunnel experimental data for the variation in the lift coefficient with the angle of attack for this model is depicted in Figure 2. The computational results align with the experimental data within the range of −5 to 6 degrees angle of attack. However, due to the large sweep angle, after the angle of attack exceeds 6 degrees, localized flow separation begins to occur on the aircraft as the angle increases. The presence of nonlinear properties in the lift curve gives rise to inconsistencies between the computational results and experimental observations.
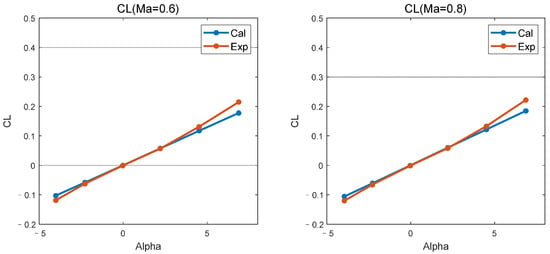
Figure 2.
Comparison of calculation and experiment for (subsonic).
At Mach number 0.6, the comparison of computational data with experimental results for the model’s roll moment derivative to sideslip angle (), yaw moment derivative to sideslip angle (), and side force coefficient derivative to sideslip angle () as functions of the angle of attack are illustrated in Figure 3. Within the calculated range of angles of attack, the computational and experimental data for are consistent. However, after the angle of attack exceeds 6 degrees, the experimental curves for and exhibit nonlinearity, resulting in slight deviations from the computational curves.

Figure 3.
Comparison of calculation and experiment for , , and .
The supersonic computational model selected is the delta wing–body combination from the wind tunnel test report NASA TP1878 [17]. This model features an aspect ratio of 1.65 and a sweep angle of 68°. The axial view of the model is shown in Figure 4.
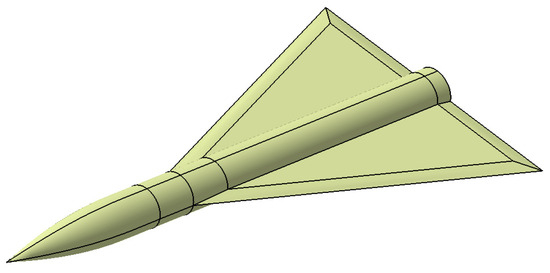
Figure 4.
The wing–body model in NASA TP1878.
At Mach numbers 1.6 and 2.0, the comparison between computational results and wind tunnel experimental data for the variation in the lift coefficient with the angle of attack for this model is depicted in Figure 5. It is necessary to clarify that the reference area used for the test data in NASA TP1878 [17] is the cross-sectional area of the fuselage, not the wing area. This accounts for the higher values of the lift coefficient. At Mach 1.6, the computational results are broadly consistent with the experimental data. However, at Mach 2.0, when the angle of attack exceeds 8 degrees, the experimental data exhibit nonlinear characteristics, leading to certain discrepancies between the computational results and the experimental data.
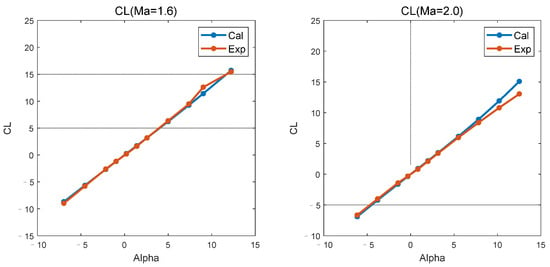
Figure 5.
Comparison of calculation and experiment for (supersonic).
2.2. Method for Simulating Control Surface Deflection
During the longitudinal pitch moment trimming calculations, to determine the deflection angle and the angle of attack for trimming, several computations with deflected control surfaces are generally required, which presents two challenges within the process of automated optimization. Firstly, regenerating the grid model after each control surface deflection significantly increases computation time. Secondly, the deflection of the control surfaces, along with their corresponding positions on the aircraft body, creates a pair of minor end faces. These end portions result in narrow triangular meshes, which can lead to ambiguities in the linear equation system during computations, thus, causing numerical stability issues. The problem becomes particularly severe when the inflow is supersonic.
Throughout the automated optimization process, performing a large number of calculations with deflected control surface models may lead to optimization deviating from the correct direction due to frequent occurrences of numerical stability issues. To circumvent such problems, it is necessary to adopt alternative approaches to simulate the actual deflection of the control surfaces.
In the program, control surface deflection is manifested as a rotation of the panel of the control surface relative to the direction of the oncoming flow. Suppose the panel of the control surface is kept stationary. A velocity perturbation superimposed on the original velocity direction is then added to the discretized mesh. In such circumstances, the direction of the oncoming flow can be altered, which deflects the flow direction by a corresponding angle relative to the panels. Therefore, without altering the geometric configuration, the approach can simulate the state of the control surface deflection, allowing for the calculation of the aerodynamic forces and moments on aircraft with deflected control surfaces.
2.2.1. Principles of Simulating Control Surface Deflection via Velocity Perturbations
After adding velocity perturbation to the control surface panel, as illustrated in Figure 6, the oncoming flow velocity at control point can be divided into two parts:
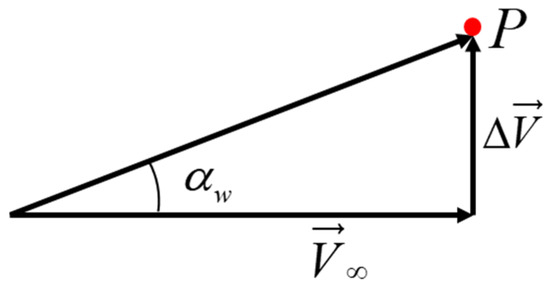
Figure 6.
Schematic diagram of adding velocity perturbation.
The equivalent deflection angle generated by perturbation velocity is as follows:
In the computation of the panel’s influence at the control points, the additional velocity perturbation of the control surface panel is integrated into the boundary condition equation. After completing the cycle calculations of the influence coefficients for all panels at all control points, the data is compiled into a linear equation system in the form of Equation (4). Solving the equation yields the distribution of source/dipole strengths on the model surface, while considering the deflection of the oncoming flow velocity due to the control surface.
2.2.2. Correction of Pressure Coefficients
When simulating the actual deflection of control surfaces using local velocity perturbations, the method for calculating the pressure on the configuration surface must also be appropriately modified to account for the added velocity. As known from the reference [18], for an ideal gas, the integral form of the Bernoulli equation can be written as:
wherein represents the ratio of specific heats (1.4 for a diatomic gas), term denotes kinetic energy, and term signifies potential energy.
When considering the actual flow conditions, Equation (8) implies that the total energy per unit mass remains constant at any point along a streamline. After adding an additional velocity at a point on the configuration surface, the corresponding additional energy should also be added to the right side of Equation (8), ensuring the equation remains valid. The modified Bernoulli equation can then be expressed as:
Assuming that the additional energy results in an increase of in the oncoming flow velocity, then:
When the control point affected by the additional velocity is sufficiently distant from the source of added energy in the inflow, it is reasonable to assume that and Equation (10) can be simplified as:
Combining the definition of the pressure coefficient with the modified Bernoulli equation (9), and neglecting the cubic and higher-order terms in the formula, we can obtain the modified second-order pressure coefficient equation:
where represents the component of the additional velocity in the direction x. By substituting Equation (11) into Equation (12), it can be concluded that:
where represents the component of the perturbation velocity in direction .
2.2.3. Validation of Accuracy in Simulating Control Surface Deflection Methods
The wing model used in this part is selected from the wind tunnel test report NACA TN No.1581 [19], and features an aspect ratio of 1.34, a sweep angle of 60°, and employs the NACA 0012 airfoil. The model’s axial view is illustrated in Figure 7. The model is divided spanwise into three wing sections, with the rear part of the middle section designated as the control surface, as shown in Figure 8. With the control surface deflected downward by 10 degrees, the aerodynamic forces resulting from both the unchanged geometric configuration with added local velocity perturbations to simulate control surface deflection and the actual geometric deflection of the control surface were calculated. The comparison of lift, drag, and pitching moment for both scenarios is depicted in Figure 9. It is evident from Figure 9 that the lift and pitching moment obtained by simulating control surface deflection through the addition of velocity perturbations are consistent with the results of actual deflection, making this approach suitable for rapid assessment of an aircraft’s longitudinal trim capabilities and for a rough estimation of trim angles. However, since the integration for aerodynamic force calculation is conducted on the panels without actual panel deflection, the integral result in the x direction is slightly reduced. Furthermore, given that the drag coefficient is small, the relative difference in drag values between the two methods is somewhat more significant, rendering this simplified method unsuitable for calculating drag.
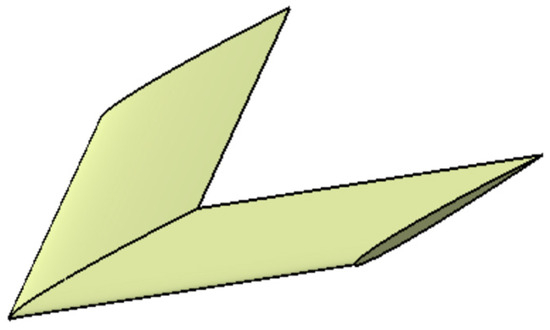
Figure 7.
The wing model in NACA TN No.1581.
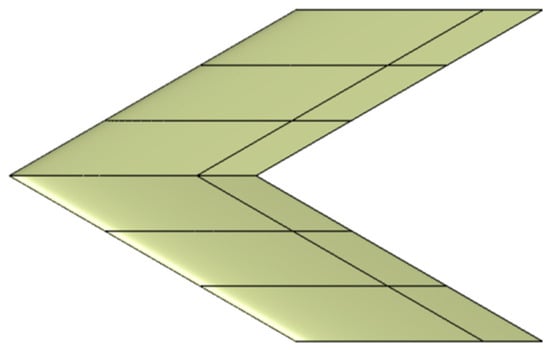
Figure 8.
Division of sections on the model.
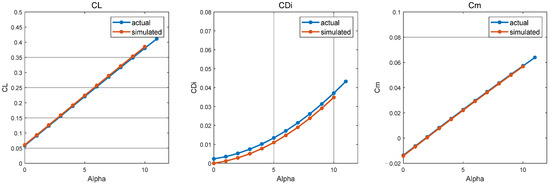
Figure 9.
Comparison of calculation results between simulated and actual deflection model.
The geometric model after a 10-degree deflection of the control surface is shown in Figure 10, with the corresponding semi-model panel mesh depicted as well. Following the deflection of the control surface, it is observable that a pair of narrow end faces emerge at the positions marked by black circles, causing the end portion of the mesh to deform into narrow triangular grids, as shown in Figure 11. The airfoil used in the model is the NACA 0012, which is characterized by its lack of camber and relatively larger thickness. During the optimization process, the airfoil will continuously change, and airfoils associated with supersonic performance are generally thinner. When the airfoil has a smaller thickness and is cambered, the deformation of the grid at this location becomes more pronounced, thereby affecting the numerical stability during calculations.
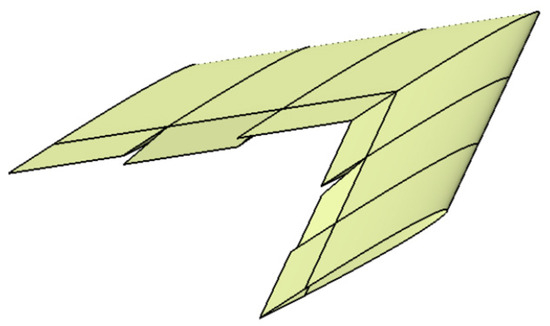
Figure 10.
Model of 10-degree deflection of control surface.
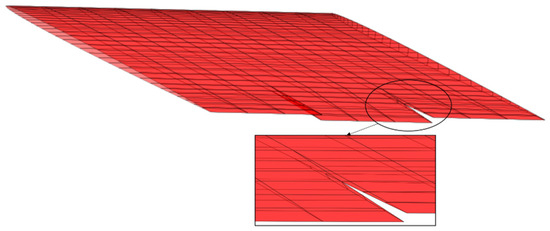
Figure 11.
Deformable mesh generated by deflection.
3. Optimization Framework Description
This section delineates the numerical methods employed in the aerodynamic optimization study, considering longitudinal trimming. These methods encompass parametric modeling, aerodynamic performance computation, variable-fidelity longitudinal control surface trim deflection angle analysis, and a hybrid optimization algorithm that integrates genetic algorithms (GA) with sequential least squares programming (SLSQP) [20]. The optimization design flow chart illustrated in Figure 12 demonstrates the interconnection of the aforementioned methods, with the operational process described as follows.
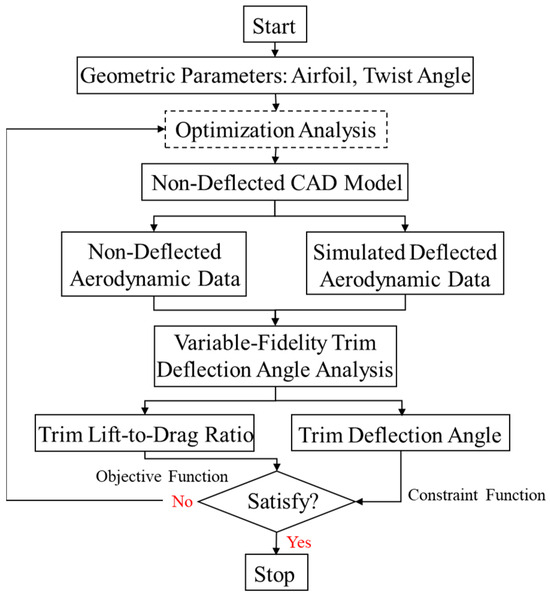
Figure 12.
Flowchart of aerodynamic optimization.
Initially, a parametric modeling method was established to generate three-dimensional models automatically based on input design variables. Concurrently, surface mesh points were generated on the model, outputting a mesh information data package directly applicable to aerodynamic computations. Subsequently, the high-order panel method, integrated with the velocity perturbation technique, was employed to assess the aerodynamic forces and moments on the model across specified angles of attack and control surface deflection angles. Following that, a variable-fidelity method for longitudinal control surface trim deflection angle analysis was utilized to ascertain the model’s precise trim deflection angles while reducing computational load and complexity. Lastly, a hybrid optimization strategy combining GA with SLSQP was chosen. The trimming lift-to-drag ratio during cruising conditions was designated as the optimization objective function, with the control surface trim deflection angle being included as a constraint in the optimization process. The optimizer evaluates the computational results derived from the current design variables, generating new design variables and initiating subsequent iterative cycles. This process continues until the predetermined convergence criteria are satisfied.
3.1. Geometric Parametrization
In this part, focusing on the unique configuration of the tailless flying wing aircraft, the spanwise direction is divided into several sections. By defining the airfoil, twist angle, and dihedral angle between sections, a parametric mathematical model of the aircraft’s geometry can be established. Input parameters, once processed through MATLAB to determine the data points of each section, are then used to generate the computational model and the surface mesh points automatically via CATIA secondary development technology. The output mesh points can be read to produce the corresponding aerodynamic computation data package. This process eliminates manual intervention and can be incorporated into the optimization framework. Both twist and dihedral angles are physically meaningful and intuitive parameters that do not require additional parameters for representation. However, a suitable method for airfoil parameterization that fits within the optimization framework of this paper still needs to be selected.
Utilizing certain mathematical functions to control the profile curve of an airfoil with a limited number of parameters is a common method of airfoil parameterization. Based on construction approaches, these algorithms can be categorized into two main types: descriptive parameterization methods and geometric transformation parameterization methods. Among them, the descriptive parameterization method is more widely used due to its broad applicability. This approach fits the airfoil curve using mathematical equations that include several undetermined parameters, with adjustments to these parameters altering the airfoil curve. Typically, this method does not require an initial airfoil profile; the coordinates of the airfoil curve are directly obtained from the equations once all the undetermined parameters are defined. Notable examples of descriptive parameterization methods include Sobieczky’s PARSEC method [21], Kulfan’s CST method [22], and the airfoil description methods based on B-splines or Bezier curves [23], as well as parameterization methods based on orthogonal polynomials [24]. Considering that too many airfoil parameters can exponentially increase the number of design variables, thereby complicating the optimization process, the IGP airfoil parameterization method proposed by Lu X in 2018 was chosen [25]. This method features a clear physical significance and strong continuity in the parameter domain. It fits the airfoil curve using eight control parameters, as detailed in Table 1.

Table 1.
Physical significance of control parameters.
3.2. Aerodynamic Calculation
In the optimization framework, the aerodynamic computation method employs the high-order panel method aerodynamic calculation program introduced in Section 2. As the optimization process requires extensive computations and iterations, the multiprocessing library in Python is used to write parallel computing functionalities for enhanced computational efficiency. When employing optimization algorithms involving population computing, all samples generated in each generation can be simultaneously read and processed by the aerodynamic calculation program. Given the use of the simulated deflection method of the control surface, as described in Section 2.2, the geometric configuration remains unchanged during computations. A single calculation can output aerodynamic data for several angles of attack and control surface deflection angles, significantly increasing computational efficiency in the optimization process.
3.3. Calculation of Control Surface Trim Deflection Angles
For a given model, after the aerodynamic calculation program provides the aerodynamic forces and moments for several angles of attack and control surface deflection angles, the model’s angle of attack for the cruise phase and the control surface trim deflection angle can be determined through interpolation methods. However, since the aerodynamic forces with deflection are not calculated based on the actual deflection of the control surfaces, using this trim deflection angle as the final result may introduce a slight deviation. Considering that satisfying the trimming constraint is a decisive factor for the usability of the model in optimization, a variable-fidelity framework for calculating control surface trim deflection angles has been established to ensure accuracy. The trim deflection angle derived from the simulated deflection method, a low-fidelity approach, is used as an initial value. Subsequently, the actual control surface deflection method, a high-fidelity approach, is employed to search near the initial value for the precise angle that strictly satisfies both level flight and trim requirements. This approach, thus, ensures the accuracy of trim deflection angle calculations while reducing the computational iterations of the deflection model.
The specific computational process for the variable-fidelity control surface deflection framework is detailed in Section 3.3.2. Prior to this, the method for automatic deflection mesh generation using adaptive mesh refinement employed in this framework is introduced in Section 3.3.1.
3.3.1. Adaptive Mesh Refinement for Automated Deflection Mesh Generation Method
In the case presented in Section 2.2.3, it has been demonstrated that numerical stability issues may arise for models with actual control surface deflection due to the elongated meshes on the added end surfaces. To ensure the reliability of the computational results, it is necessary to refine the mesh in this area locally. During the optimization process, as the range of control surface deflection angles changes significantly with the increase in generations, it is not feasible to determine a unified rule for mesh point offset and refinement. Therefore, an adaptive mesh refinement program for the control surface deflection model has been developed in response to the actual computational needs. This program dynamically adjusts the mesh based on the current deflection requirements, thereby ensuring the aerodynamic calculations’ accuracy and stability throughout the optimization process.
The program, based on the mesh point information of the original configuration without control surface deflection, automatically calculates the positions of the mesh points after deflection, as well as the intersection points between the deflected control surface end face and the corresponding wing end face, as represented by point X in Figure 13. It recalculates the mesh points of each wing section’s rear surface and the newly added end face according to the position of the intersection points, aiming to minimize mesh distortion. Since the mesh points shift based on the position of the intersection points, significant variations in adjacent mesh sizes may occur when the control surface deflection angles are either very large or very small. To avoid numerical issues, the program automatically calculates the sizes of the shifted meshes. In cases where the size exceeds a threshold or where there is a rapid change in adjacent mesh sizes, the mesh in that area is automatically refined, as illustrated in Figure 14 and Figure 15.
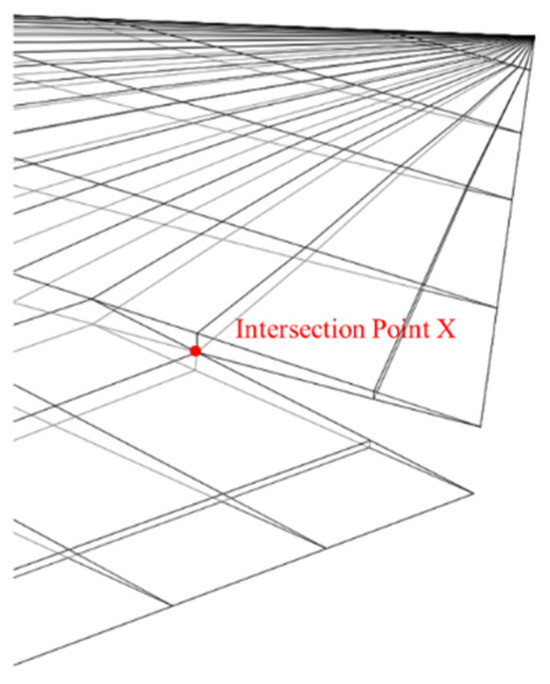
Figure 13.
Schematic diagram of the intersection point after deflection.
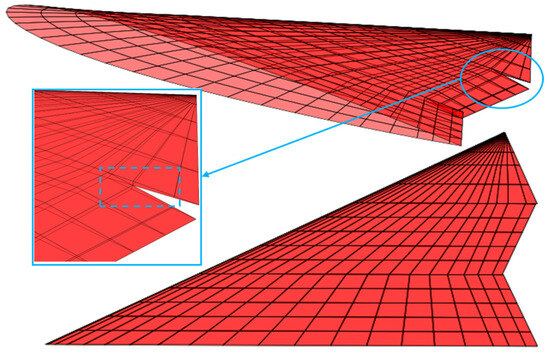
Figure 14.
Mesh before automatic refinement.
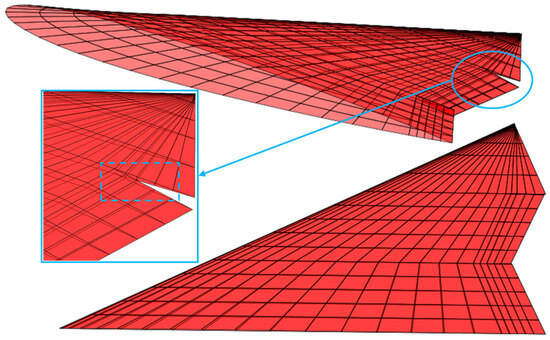
Figure 15.
Mesh after automatic refinement.
Practical applications in optimization have demonstrated that the adaptive mesh refinement method for the deflection model effectively avoids numerical stability issues during computations, particularly in cases where the incoming flow is supersonic.
3.3.2. Framework for Calculating Control Surface Trim Deflection Angles
The variable-fidelity framework for calculating the trim deflection angle is illustrated in Figure 16. Using the velocity perturbation method to simulate control surface deflection, the aerodynamic data of the model are computed within a specified range of angles of attack with control surface deflection angles of −10, 0, and 10 degrees, respectively.
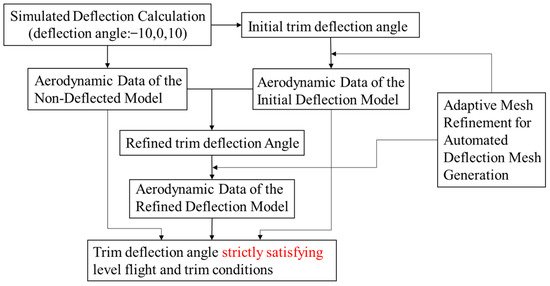
Figure 16.
Flowchart for calculating the trim deflection angle.
The initial trim deflection angle corresponding to the case and Cm = 0 can be obtained through interpolation methods. Utilizing the automatic generation program described in Section 3.3.1, computational files for the deflected model corresponding to the initial trim deflection angle are generated, and the aerodynamic performance of the model with actual control surface deflection is calculated. Combined with the aerodynamic data of the clean configuration, the refined trim deflection angle under level flight conditions is calculated through interpolation methods, and the corresponding aerodynamic data for the actual deflection model is calculated. Since the pitching moment coefficient obtained from the discrete panel calculation generally does not strictly equal zero, the angle of attack and control surface deflection angle that strictly satisfy the level flight and trimming conditions are determined through a small range search based on the existing aerodynamic data of the three actual deflection models.
3.4. Optimization Algorithm
This study employed a hybrid optimization approach, integrating the characteristics of GA [26] and SLSQP. Genetic optimization algorithms, grounded in the principles of natural selection and genetics, are capable of exploring the entire search space, thereby reducing the risk of converging to local optima. The population-based nature of this algorithm can be utilized in tandem with the parallel computational algorithm of the aerodynamic program described in Section 3.2. Individuals within the population can simultaneously evaluate objective and constraint functions, thus, enhancing computational efficiency. However, as the GA approaches the optimal solution, its convergence speed may decrease, potentially requiring extensive computational resources. On the other hand, SLSQP is a gradient optimization algorithm equipped with constraint-handling capabilities. This method utilizes gradient information about the objective and constraint functions to guide the search process, thereby rapidly finding the optimal solution that satisfies constraints. However, the performance of SLSQP can be influenced by the choice of initial values; inappropriate initial values might lead to convergence on local optima or non-convergence. Therefore, we have opted to combine these two methods, initially employing the global search capabilities of the GA to locate a point near the optimal solution in the design space. This point is then used as the initial value in SLSQP optimization for the local search. By leveraging the exploratory strength of GA and the fine-tuning ability of SLSQP, the limitations of each method are mitigated, enabling more efficient discovery of the global optimum or a solution close to it.
3.5. Optimization Problem Formulation
The Innovative Control Effectors (ICE) program configuration 101 [27] was selected as the baseline for optimization, as illustrated in Figure 17. This model represents a typical tailless flying wing aircraft with a large sweep angle and a low aspect ratio. The root chord length of the baseline model is 13.14 m, with the chord lengths at two transition positions being 8.169 m and 4.968 m, respectively. The wingspan is 11.42 m, with a reference area of 75.26 m2 and an average aerodynamic chord of 8.51 m. The leading-edge sweep angle is 65 degrees, and the aspect ratio is 1.73. Each section of the baseline model utilizes the same symmetrical airfoil, as depicted in Figure 18. The root airfoil parameters are represented using the IGP method, as detailed in Table 2.
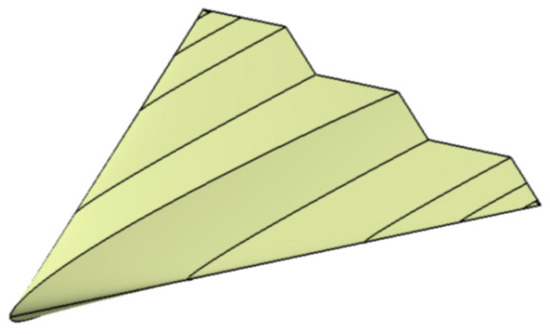
Figure 17.
The baseline aircraft model.
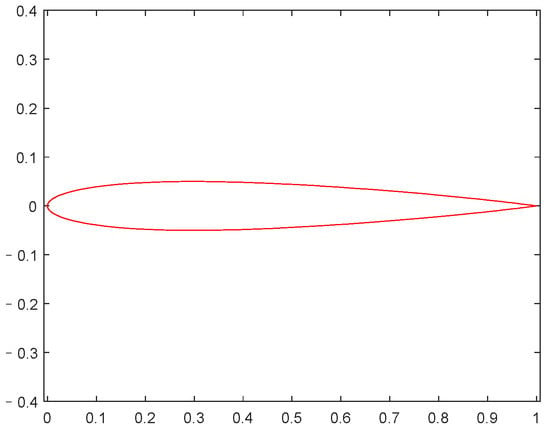
Figure 18.
The airfoil of baseline model.

Table 2.
Airfoil parameters of root section.
The semi-span planform layout of the baseline model is illustrated in Figure 19. The spanwise direction is divided into five sections, forming four wing segments. The airfoil parameters, twist angles, and dihedral angles of each wing segment can be independently defined, while the platform layout remains constant during the optimization process. The trailing edge section of segment two is chosen as the control surface. The control surface’s leading edge is located at 87% of the chord on the section CD and 78% on the section EF. The control surface’s projected area is 2.053 m2, accounting for 5.47% of the total wing’s projected area.
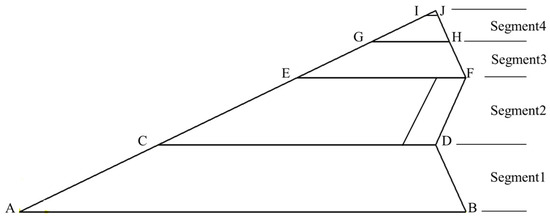
Figure 19.
The platform of baseline model.
The objective function for the optimization is the lift-to-drag ratio of the aircraft in a longitudinally trimmed state during the cruise phase. Since the optimization objective tends to minimize the drag coefficient, the process will inherently aim to reduce the maximum thickness of each section as much as possible. To ensure the aircraft’s payload requirements, the maximum relative thickness parameters (T) of each section’s airfoil are fixed during the optimization process. Additionally, considering the aircraft’s stability and controllability, the optimization process should impose constraints to limit the excessive deflection of the trimming control surfaces.
Based on the aforementioned analysis, the optimization problem for the ICE101 model can be defined as follows:
where and represent the lift coefficient and drag coefficient in the trimmed state, respectively. represents the lift coefficient in level flight, while denotes the deflection angle of the control surface in the trimmed state, and the downward deflection is defined as positive.
Referring to the sectional setup in the figure, a total of 31 design variables were selected, with specific parameters as detailed in Table 3.

Table 3.
Design variables of aerodynamic optimization.
4. Optimization Results
This section focuses on the baseline model described in Section 3.5. Initially, an analysis of its aerodynamic characteristics under both subsonic and supersonic conditions was conducted to determine the initial model’s trimmed lift-to-drag ratio, which serves as a benchmark for evaluating subsequent optimization results. Maintaining the same planform configuration, 31 design variables were selected in the optimization process (as shown in Table 3). The trimmed lift-to-drag ratio in the cruising state was used as the objective function, with the control surface trim deflection angle as the constraint function. An optimization analysis of the aerodynamic characteristics considering longitudinal trimming under both subsonic and supersonic conditions was then performed.
4.1. Baseline Model Analysis
Using the computational methods outlined in Section 3.2 and Section 3.3, the aerodynamic characteristics and control surface trim deflection angles for the baseline model were analyzed under subsonic and supersonic conditions. For the subsonic conditions, a Mach number of 0.5 and an altitude of 0 m were assumed, while for the supersonic conditions, a Mach number of 1.5 and an altitude of 10,000 m were considered. The results of the baseline model are presented in Table 4, where represents the trimmed angle of attack in cruising condition, denotes the control surface trim deflection angle, is the trimmed lift coefficient, is the trimmed drag coefficient, represents the zero-lift drag coefficient derived from engineering estimation methods, indicates the lift-to-drag ratio in untrimmed level flight, and signifies the lift-to-drag ratio in trimmed level flight. Under both subsonic and supersonic conditions, the baseline model satisfies the constraint of the control surface trim deflection angles being less than ±5 degrees. The trimmed lift-to-drag ratios in cruising conditions are 15.7877 and 2.8253, respectively.

Table 4.
Aerodynamic calculation results of baseline model.
4.2. Aerodynamic Optimization in Subsonic Conditions
Utilizing the optimization framework outlined in Section 3, a subsonic optimization analysis was conducted for the problem defined in Section 3.5. The incoming flow Mach number was set to 0.5, with an altitude of 0 m. The optimal values obtained after 40 generations using the GA method were used as initial values for the SLSQP optimization algorithm. The optimal solution generated after the hybrid optimization design, in comparison to the baseline model, is shown in Table 5. The variation curve of the objective function’s optimal value over generations is depicted in Figure 20. The optimized model’s trimmed lift-to-drag ratio was 17.13, an improvement of 8.52% compared to the baseline model, and the control surface trim deflection angle was 1.36 degrees, satisfying the constraint of being less than 5 degrees.

Table 5.
Comparison of aerodynamic performance before and after optimization (subsonic).
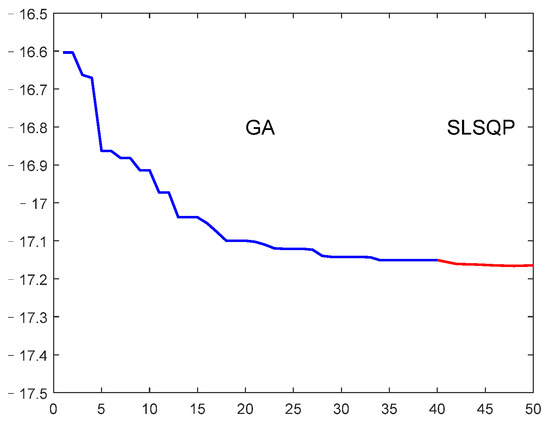
Figure 20.
The variation in optimal value with generations (subsonic).
The comparison between the airfoil profiles of each section of the optimized model and the baseline model is illustrated in Figure 21. As can be observed, the camber of the airfoils in each section of the optimized model has significantly increased. This increase in camber enhances the pressure difference between the upper and lower surfaces of the airfoil, thereby augmenting lift, improving the aircraft’s longitudinal stability, and enhancing the lift-to-drag ratio. Furthermore, the negative twist in the airfoil profiles of each section progressively increases along the span, resulting in smaller angles of attack at the wingtips relative to the wing roots. This optimization in the lift distribution over the wing leads to a distribution that more closely resembles an elliptical shape. Such a design effectively delays or reduces wingtip stalls and minimizes drag caused by uneven lift distribution, thereby optimizing the lift-to-drag ratio.
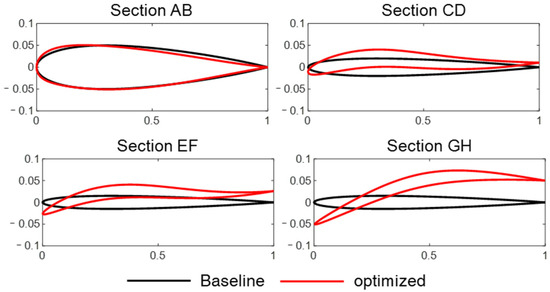
Figure 21.
Comparison of section airfoils and twist angle before and after optimization (subsonic).
4.3. Aerodynamic Optimization in Supersonic Conditions
Utilizing the optimization framework outlined in Section 3, a supersonic optimization analysis was conducted for the problem defined in Section 3.5. The incoming flow Mach number was set to 1.5 at an altitude of 10,000 m. The optimal values obtained after 40 generations using the GA method were used as initial values for the SLSQP optimization algorithm. The optimal solution generated from the hybrid optimization design, in comparison to the baseline model, is presented in Table 6. The variation curve of the objective function’s optimal value over generations is depicted in Figure 22. The optimized model’s trimmed lift-to-drag ratio was 3.05, an improvement of 8.1% compared to the baseline model, and the control surface trim deflection angle was −0.72 degrees, satisfying the constraint of being less than 5 degrees.

Table 6.
Comparison of aerodynamic performance before and after optimization (supersonic).
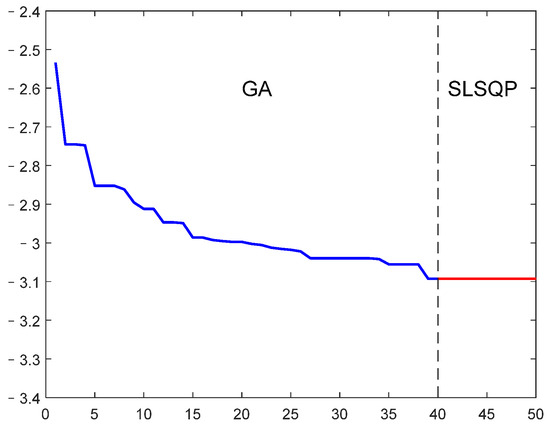
Figure 22.
The variation in optimal value with generations (supersonic).
The comparison between the airfoil profiles of each section of the optimized model and the baseline model is illustrated in Figure 23. In contrast to the subsonic optimization results, the change in camber for each section’s airfoil is less pronounced under supersonic conditions. In supersonic flight, an increase in airfoil camber typically leads to a rapid increase in drag. Consequently, supersonic aircraft airfoil designs tend to be flatter and thinner to reduce drag and improve the overall lift-to-drag ratio. Similarly, the twist angles in the supersonic optimization results are significantly smaller than those recorded under the subsonic conditions. In supersonic flight, lift is mainly generated by the airfoil’s thickness and sweep angle rather than the angle of attack, as it is in subsonic flight. The contribution of twist to lift generation is relatively minor in supersonic flight, and excessive wing twists can lead to increased drag, thereby reducing the aircraft’s lift-to-drag ratio. Therefore, smaller twist angles are typically adopted under supersonic flight conditions.
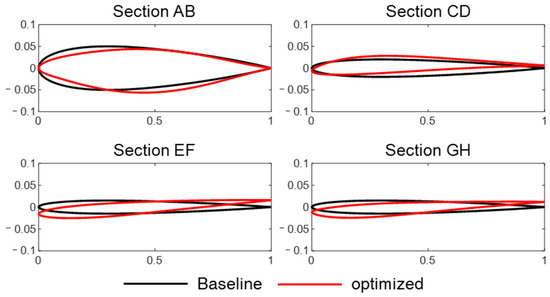
Figure 23.
Comparison of section airfoils and twist angle before and after optimization (supersonic).
5. Conclusions
This paper establishes a subsonic/supersonic aircraft aerodynamic optimization method that considers longitudinal trim achieved through control surface deflection. Initially, a method for simulating the actual deflection of the control surface through velocity perturbation was proposed, and based on this method, a variable-fidelity control surface deflection analysis model was developed. Subsequently, an optimization framework was constructed, encompassing parametric modeling, aerodynamic computation, and variable-fidelity longitudinal trim control surface angle analysis. Finally, utilizing this framework, a hybrid optimization algorithm integrating GA and SLSQP was employed to optimize the aerodynamic characteristics of the ICE101 baseline model under both subsonic and supersonic conditions, considering longitudinal trim. The primary conclusions are as follows:
- Based on the theory of high-order panel methods, an aerodynamic computational program was developed using Python. The accuracy of the program was validated by comparing the subsonic/supersonic computational results with wind tunnel experimental data. Additionally, the study employed the novel approach of introducing velocity perturbations on specified mesh surfaces to simulate control surface deflection. The effectiveness of this technique is substantiated by comparing these computational results with models with actual deflections.
- A variable-fidelity framework for calculating longitudinal control surface trim deflection angles was established. The framework employs a simulation-based deflection method to identify initial control surface trim angles. Subsequently, a precise deflection method was applied to determine control surface angles that strictly satisfy level flight and trim constraints. This approach ensures the accuracy of the trim deflection angle calculations while conservatively utilizing computational resources.
- For the baseline model, 31 design variables were selected, with the trimmed lift-to-drag ratio in the cruising condition set as the objective function and the control surface trim deflection angle as the constraint function. The aerodynamic characteristic optimization analysis considering longitudinal trim was facilitated under both subsonic and supersonic conditions. Results show that under subsonic conditions, the model’s trimmed lift-to-drag ratio was 17.13, marking an 8.52% improvement compared to the baseline model. Accordingly, under supersonic conditions, the optimized model’s trimmed lift-to-drag ratio reached 3.05, representing an 8.1% enhancement from the baseline model.
The study in this paper primarily focuses on aerodynamic design optimization, considering longitudinal trim. The selection of design variables is chiefly confined to multiple airfoil section parameters and twist angles. Future studies could contemplate incorporating additional design variables, such as anhedral angles and the planform geometry of the wing. This enhancement would enable the model to analyze longitudinal and lateral dynamic stability, further improving aircraft flight quality and safety.
Author Contributions
Conceptualization, Y.W. and B.J.; methodology, Y.W. and B.J.; software, Y.W.; validation, Y.W. and L.S.; formal analysis, Y.W.; investigation, L.S.; resources, B.J.; data curation, Y.W.; writing—original draft preparation, Y.W.; writing—review and editing, Y.W. and B.J.; visualization, Y.W.; supervision, J.H.; project administration, J.H.; funding acquisition, J.H. All authors have read and agreed to the published version of the manuscript.
Funding
This research received no external funding.
Data Availability Statement
Data is contained within the article.
Conflicts of Interest
The authors declare no conflict of interest.
References
- Martins, J.R.R.A. Aerodynamic design optimization: Challenges and perspectives. Comput. Fluids 2022, 239, 105391. [Google Scholar] [CrossRef]
- Tomac, M.; Stenfelt, G. Predictions of stability and control for a flying wing. Aerosp. Sci. Technol. 2014, 39, 179–186. [Google Scholar] [CrossRef]
- Tuna, M.; Inel, S.; Ozdemir, S. Longitudinal stability analysis of aircrafts. J. Sci. Eng. Res. 2020, 7, 45–51. [Google Scholar]
- Wang, K.; Han, Z.; Zhang, K.; Song, W. Efficient Global Aerodynamic Shape Optimization of a Full Aircraft Configuration Considering Trimming. Aerospace 2023, 10, 734. [Google Scholar] [CrossRef]
- Vassberg, J.C.; DeHaan, M.A.; Rivers, M.S.; Wahls, R.A. Retrospective on the common research model for computational fluid dynamics validation studies. J. Aircr. 2018, 55, 1325–1337. [Google Scholar] [CrossRef]
- Chen, S.; Lyu, Z.; Kenway, G.K.; Martins, J.R. Aerodynamic shape optimization of common research model wing–body–tail configuration. J. Aircr. 2016, 53, 276–293. [Google Scholar] [CrossRef]
- Lyu, Z.J.; Martins, J.R.R.A. Aerodynamic design optimization studies of a blended-wing-body aircraft. J. Aircr. 2014, 51, 1604–1617. [Google Scholar] [CrossRef]
- Koo, D.; Zingg, D.W. Progress in Aerodynamic Shape Optimization Based on the Reynolds-Averaged Navier-Stokes Equations. In Proceedings of the 54th AIAA Aerospace Sciences Meeting, San Diego, CA, USA, 4–8 January 2016. [Google Scholar]
- Merle, A.; Stück, D.W.; Rempke, A. An Adjoint-based Aerodynamic Shape Optimization Strategy for Trimmed Aircraft with Active Engines. In Proceedings of the 35th AIAA Applied Aerodynamics Conference, Denver, CO, USA, 5–9 June 2017. [Google Scholar]
- Kenway, G.K.W.; Secco, N.; Martins, J.R.R.A.; Mishra, A.; Duraisamy, K. An Efficient Parallel Overset Method for Aerodynamic Shape Optimization. In Proceedings of the 58th AIAA/ASCE/AHS/ASC Structures, Structural Dynamics, and Materials Conference, Grapevine, TX, USA, 9–13 January 2017. [Google Scholar]
- Lei, R.W.; Bai, J.Q.; Xu, D.Y. Aerodynamic optimization of civil aircraft with wing-mounted engine jet based on adjoint method. Aerosp. Sci. Tech. 2019, 93, 105285. [Google Scholar]
- Ferrero-Guillén, R.; Díez-González, J.; Alija, J.M.; Martínez-Gutiérrez, A.; Verde, P.; Perez, H. Optimal Wing and Horizontal Tail plane design for maximizing the aircraft performance in cruise flight. Cybern. Syst. 2023, 54, 355–371. [Google Scholar] [CrossRef]
- Paranjape, A.A.; Chung, S.J.; Selig, M.S. Flight mechanics of a tailless articulated wing aircraft. Bioinspiration Biomim. 2011, 6, 026005. [Google Scholar] [CrossRef] [PubMed]
- Bowlus, J.; Multhopp, D.; Banda, S.; Bowlus, J.; Multhopp, D.; Banda, S. Challenges and opportunities in tailless aircraft stability and control. In Proceedings of the Guidance, Navigation, and Control Conference, New Orleans, LA, USA, 11–13 August 1997; p. 3830. [Google Scholar]
- Magnus, A.; Epton, M. A Computer Program for Predicting Subsonic or Supersonic Linear Potential Flows about Arbitrary Configurations Using a Higher Order Panel Method, vol. i. Theory Document; NASA Contract Report; No. NASA-TN-D-3251; NASA: Washington, DC, USA, 1980; p. 18. [Google Scholar]
- Davenport, E.E. Aerodynamic Characteristics of Three Slender Sharp-Edge 74 Degrees Swept Wings at Subsonic, Transonic, and Supersonic Mach Numbers; NASA Contract Report, No. NASA-TN-D-7631; NASA: Washington, DC, USA, 1974. [Google Scholar]
- Lamb, M.; Sawyer, W.C.; Thomas, J.L. Experimental and Theoretical Supersonic Lateral-Directional Stability Characteristics of a Simplified Wing-Body Configuration with a Series of Vertical-Tail Arrangements; NASA Contract Report; No. NASA-TP-1878; NASA: Washington, DC, USA, 1981. [Google Scholar]
- Liepmann, H.W.; Roshko, A. Elements of Gas Dynamics; Courier Corporation: Chelmsford, MA, USA, 2001; p. 55. [Google Scholar]
- Goodman, A.; Brewer, J.D. Investigation at Low Speeds of the Effect of Aspect Ratio and Sweep on Static and Yawing Stability Derivatives of Untapered Wings; NASA Contract Report, No. NACA-TN-1669; NASA: Washington, DC, USA, 1948. [Google Scholar]
- Al-Salt, J. A Comparsion between Genetic Algorithms and Sequential Quadratic Programming in Solving Constrained Optimization Problems. AIML J. 2006, 6, 67–74. [Google Scholar]
- Sobieczky, H. Parametric Airfoils and Wings. Notes Numer. Fluid Mech. 1998, 68, 71–88. [Google Scholar]
- Kulfan, B.M.; Bussoletti, J.E. “Fundamental” Parametric Geometry Representations for Aircraft Component Shapes. In Proceedings of the 11th AIAA/ISSMO Multidisciplinary Analysis and Optimization Conference, Portsmouth, VA, USA, 6–8 September 2006; AIAA-2006-6948. American Institute of Aeronautics and Astronautics: Reston, VA, USA, 2006. [Google Scholar]
- Silisteanu, P.D.; Botez, R.M. Two-dimensional airfoil shape optimization for airfoils at low speeds. In Proceedings of the AIAA Modeling and Simulation Technologies Conference, Minneapolis, MN, USA, 13–16 August 2012; AIAA-2012-4790. American Institute of Aeronautics and Astronautics: Reston, VA, USA, 2012. [Google Scholar]
- Robinson, G.M.; Keane, A.J. Concise Orthogonal Representation of Supercritical Airfoils. J. Aircr. 2001, 38, 580–583. [Google Scholar] [CrossRef]
- Lu, X.; Huang, J.; Song, L.; Li, J. An improved geometric parameter airfoil parameterization method. Aerosp. Sci. Technol. 2018, 78, 241–247. [Google Scholar] [CrossRef]
- Blank, J.; Deb, K. pymoo: Multi-Objective Optimization in Python. IEEE Access 2020, 8, 89497–89509. [Google Scholar] [CrossRef]
- Dorsett, K.M.; Mehl, D.R. Innovative Control Effectors (ICE); Lockheed Martin Tactical Aircraft Systems: Bethesda, MD, USA, 1996. [Google Scholar]
Disclaimer/Publisher’s Note: The statements, opinions and data contained in all publications are solely those of the individual author(s) and contributor(s) and not of MDPI and/or the editor(s). MDPI and/or the editor(s) disclaim responsibility for any injury to people or property resulting from any ideas, methods, instructions or products referred to in the content. |
© 2024 by the authors. Licensee MDPI, Basel, Switzerland. This article is an open access article distributed under the terms and conditions of the Creative Commons Attribution (CC BY) license (https://creativecommons.org/licenses/by/4.0/).