Article

Validating Flow-Based Arrival Management for En Route Airspace: Human-In-The-Loop Simulation Experiment with ESCAPE Light Simulator

by
Katsuhiro Sekine
1,*,
Daiki Iwata
2,
Philippe Bouchaudon
3,
Tomoaki Tatsukawa
1,
Kozo Fujii
1,
Koji Tominaga
4 and
Eri Itoh
2,4,5
1
Department of Information and Computer Technology, Tokyo University of Science, Tokyo 125-8585, Japan
2
Department of Aeronautics and Astronautics, The University of Tokyo, 4-6-1 Komaba, Meguro-ku, Tokyo 153-8904, Japan
3
EUROCONTROL Innovation Hub, Centre du Bois des Bordes CS 41005, 91222 Brétigny-sur-Orge, France
4
Research Center for Advanced Science and Technology, The University of Tokyo, 4-6-1 Komaba, Meguro-ku, Tokyo 153-8904, Japan
5
Air Traffic Management Department, Electronic Navigation Research Institute, Tokyo 182-0012, Japan
*
Author to whom correspondence should be addressed.
Aerospace 2024, 11(11), 866; https://doi.org/10.3390/aerospace11110866
Submission received: 6 September 2024 / Revised: 10 October 2024 / Accepted: 19 October 2024 / Published: 22 October 2024
(This article belongs to the Special Issue Future Airspace and Air Traffic Management Design)

Abstract

:
The advancement of Arrival MANager (AMAN) is crucial for addressing the increasing complexity and demand of modern airspace. This study evaluates the operational feasibility and effectiveness of an innovative AMAN designed for en route airspace, the so-called En Route AMAN. The En Route AMAN functions as a controller support system, facilitating the sharing of information between en route air traffic controllers (ATCos), approach controllers (current AMAN), and airport controllers (Departure Managers) in airports with multiple runways. The En Route AMAN aims to support upstream ATCos by sequencing and spacing of incoming streams via speed control and runway assignment, thereby enhancing overall air traffic efficiency. Human-In-The-Loop simulations involving rated ATCos are performed under scenarios that replicate real-world traffic and weather conditions. These simulations focus on upstream airspace to assess the impact of En Route AMAN on delay mitigation and ATCos’ performance. Unlike previous studies that solely relied on theoretical models and fast-time simulation for operational feasibility evaluation, this approach incorporates ATCos’ real-time decision-making, situational awareness, and task management, addressing critical operationalization challenges. The results demonstrated that the En Route AMAN could reduce the average flight duration by up to 25.6 s and decrease the total number of ATCo instructions by up to 20% during peak traffic volume. These findings support that the En Route AMAN is both operationally viable and effective in mitigating arrival delays, highlighting the importance of Human-In-The-Loop for practical validation.

1. Introduction

Following a significant decline during the COVID-19 pandemic, air traffic demand is expected to rebound to 2019 levels by 2024, with further growth anticipated thereafter [1]. This increase in demand is likely to lead to congestion, particularly in the Terminal Maneuvering Area (TMA) of major airports, as well as across various airspace sectors, including both terminal and en route phases of flight. One of the current tools that aid air traffic controllers (ATCos) is the Arrival MANager (AMAN) [2], which assists in the sequencing and spacing of arrivals to ensure safe and efficient landings at destination airports. However, given the scale of the anticipated growth in traffic, advances in AMAN alone may not be sufficient. According to 2024 reports [3], 44% of air traffic flow management (ATFM)-related delays in the EU and 17.2% in the U.S. were attributed to en route facilities such as air traffic control (ATC) capacity and staffing limitation, while 29% in the EU and 76% in the U.S. were related to airport issues such as adverse weather. This highlights the need for AMAN to incorporate flow management strategies that balance demand and capacity between en route airspace and airports based on weather conditions.
Strategies such as Extended AMAN (E-AMAN) and En Route AMAN have been developed to optimize arrival management. E-AMAN manages sequencing and spacing from the terminal area (TMA) to en route airspace, while En Route AMAN focuses on speed control and runway assignment to reduce congestion before aircraft enter the TMA. Recent studies have explored methods such as Initial Approach Fix (IAF) assignments [4], dynamic speed control [5], route adjustments and runway adjustments [6], the integration of continuous descend operation [7,8], and severe weather situational support [9]. However, uncertainties in the Estimated Time of Arrival (ETA), especially due to weather, continue to challenge delay management and increase the task volume for air traffic controllers (ATCos). For instance, unpredictable delays or changes in aircraft arrival times require ATCos to constantly adjust and optimize their sequencing strategies, leading to an increased volume of radar and tactical planning tasks. To address these issues from a theoretical and practical perspective, queuing theory models [10,11,12,13,14,15] and data-exploration [16] have been proposed to reduce airspace congestion and optimize inter-arrival control for En Route AMAN. Another most recent study optimized arrival scheduling under uncertainty by introducing quantile regression to ETA [17].
Although En Route AMAN systems show promise in reducing delays within the TMA, there remains a gap in orchestrating congestion data between airport, terminal, and en route airspaces. Departure Manager (DMAN) and Surface Manager (SMAN) primarily optimize runway sequencing and taxi schedules, respectively, but without adequately addressing en route bottlenecks [18,19]. For example, integrating DMAN and AMAN has improved runway efficiency [20], but additional measures are required to regulate traffic flows earlier in the en route phase. Specifically, by coordinating en route airspace demand with downstream conditions at the terminal and airport, traffic can be more evenly distributed, thus reducing the risk of bottlenecks that typically build closer to the destination. This underscores the importance of holistic approaches such as En Route AMAN, which aim to bridge the operational divide between terminal and en route airspaces, improving overall traffic management by sharing critical congestion information across airspace sectors.
While theoretical models and fast-time simulations have provided valuable insights, they often lack the real-time human input necessary to fully evaluate the system’s performance in complex, high-stress operational environments. This is particularly true in managing the dynamic and unpredictable nature of air traffic, where human factors such as situational awareness, task management, and decision-making play a critical role. As argued by Bin Jumad et al. [21], the complexity of diverse traffic patterns and potential conflicts can further exacerbate ATCos’ task volume, highlighting the need for extensive real-world evaluations. These evaluations are essential to validate the practical applicability and effectiveness of advanced En Route AMAN approaches. A feasibility study aims to develop and explore elements of a concept until they become operational. According to the European Operational Concept Validation Methodology (E-OCVM) released by EUROCONTROL, “Feasibility [V2/V0-V7]” is positioned as a crucial part of the new system development, aimed at identifying operational needs and solutions [22]. Evaluating operational feasibility requires two key steps: clarifying the concept and planning the exercises. Exercise plan development entails outlining the scenario, assumptions, procedures, tools, and indicators. Choosing an appropriate validation method is a critical component of this process. Real-time simulation techniques, including human-in-the-loop (HITL) exercises, can be used to test the proposed concept in a controlled, replicable environment, with data collected from simulator logs, observer notes, questionnaires, and debriefings. Such assessments should focus on understanding their impact on ATCos’ workload and the overall efficiency and safety of air traffic management (ATM). Addressing these critical aspects ensures that innovative methods are both theoretically sound and practically viable in diverse and complex air traffic scenarios.
In recent feasibility studies, HITL simulations with ATCos and pseudo-pilots have been performed to validate novel operational concepts. Thipphavong et al. [23] conducted HITL simulations to test the operational feasibility of Flight-deck Interval Management, which integrates time-based scheduling with precise spacing for controllers and flight decks. Samardžić et al. [24] and Schrefl et al. [25] validated an AI-supported SA system for ATCos using a Knowledge Graph (KG), improving operational performance and Team SA. Ahrenhold et al. [26] validated dynamic sectorization in ATC, balancing workload distribution and improving efficiency by adapting to traffic patterns and incorporating climate-sensitive areas. Furthermore, significant research has been conducted that involves HITL simulations specifically targeting AMAN-related concepts. Robinson et al. [27] introduced the Terminal Sequencing and Spacing (TSS) system, which integrates performance-based navigation (PBN) with terminal metering and controller spacing tools. Simulation tests targeting several airports in the United States showed an increase in the PBN success rate from 42% to 92% and a 25 to 35% improvement in the spacing error between arrivals. Ahrenhold et al. [28] optimized the coordination between Flight Management Systems (FMS) and AMAN, extending the scheduling horizon to 125 NM. The redesigned TMA at Munich Airport improved direct routes and fuel efficiency but highlighted the need for tools to manage increased complexity and maintain ATCos’ workload and situational awareness.
The current study validates the operational feasibility and effectiveness of a novel operational concept of En Route AMAN. The En Route AMAN concept controls short-term runway flow and relative time spacing in the upstream en route airspace [16] instead of Scheduled Time of Arrival (STA) at the entry to the TMA entry. Previous research on AMAN, which was used in en route airspace [27,28] based evaluation, used a relatively predictable traffic situation and environment, i.e., almost only arrival streams. To fill this knowledge gap, our study hypothesizes that even in en route airspace with complex topologies and situations, the removal of STA constraints will allow the AMAN to effectively support ATCos. The original contribution of our paper is to provide a novel and practical example of how a more comprehensive design and evaluation of En Route AMAN can improve its operational feasibility and airspace utilization. By integrating the past works of data theoretical modeling [11,12,13,14], and simulation-based evaluation [15,16], our study presents a scientific and systematic approach to designing a future ATM systems. The methodological framework allows for the identification and resolution of practical implementation challenges, offering insights into how ATM systems can be optimized to meet growing air traffic demands while maintaining safety and efficiency. The results presented in this paper contribute to the broader effort of establishing a more effective and scalable framework for future ATM.
To test the above hypothesis, we first explore the operational concept of En Route AMAN, outlining its potential to streamline the arrival process under complex airspace conditions (see Section 2). We then analyze the characteristics of traffic and weather in the target airspace, which are critical factors that influence the performance of the proposed operational concept (detailed in Appendix A). To evaluate the operational feasibility of En Route AMAN, we employ a HITL simulation environment with an originally designed stand-alone Human–Machine Interface (HMI) to display changes in speed and runway assignments (Section 3), under carefully defined experimental conditions (explained in Section 4). The effectiveness of En Route AMAN is subsequently evaluated through both qualitative and quantitative analyses (Section 5). Finally, we discuss the operational enhancements and insights gained from the HITL simulation experiments (discussed in Section 6) before concluding with remarks on the implications of our findings (Section 7).

2. Operational Concept of En Route AMAN

This study builds on state-of-the-art AMANs, incorporating techniques such as speed control and runway assignment to manage traffic flow efficiently. Previous research highlights the effectiveness of these methods in different contexts, but this study specifically aims to validate their application in en route airspace. This section briefly describes the En Route AMAN methodology. More details can be found in [16,29].
Figure 1 shows the schematic diagram of Flow-based En Route Arrival Management. En Route AMAN [16] is analogous to Multi-Stage Arrival Management [29], which is a concept developed to improve the efficiency and safety of managing arriving aircraft in airports, especially those with high traffic volumes. This multi-stage approach helps to manage the complexities of modern air traffic by tailoring the management strategies to specific phases of flight, characteristics of arrival flows, and the operational environment, ultimately aiming for a safer, more efficient, and environmentally friendly arrival process. This system divides the arrival management process into several distinct stages, each optimized for specific tasks and conditions of the arrival stream. The focus of this study is STAGE 3, which represents the transition from air traffic flow control to time-based management (spacing of arriving aircraft). In this stage, metering is performed for the purpose of maintaining the spacing between the arriving aircraft during their cruise phase to ensure safety. In relation to the other stages, STAGE 3 serves as a bridge between STAGE 4 (where air traffic flow management is implemented) and STAGE 2/1 (where time-based management is conducted), preparing for more accurate interval adjustments. In addition, STAGE 3 ensures coordination with DMAN to share airport congestion information, facilitating smoother runway assignment and more effective traffic flow management as aircraft approach TMA. Two methodological components are sequentially applied to serve the STAGE 3 requirements: (1) Runway assignment based on short-term runway flow; (2) Speed control instruction to achieve required longitudinal time spacing. Past studies [11,12,13,14,15] have theoretically shown through queuing models that, in particular, smoothing the arrival rate and minimizing the variance in relative arrival intervals can effectively reduce arrival delays and mitigate congestion, supporting the effectiveness of introducing En Route AMAN equipped with these two functions in STAGE 3. The following subsections briefly describe the two methods with references to the theoretical basis and related applications.

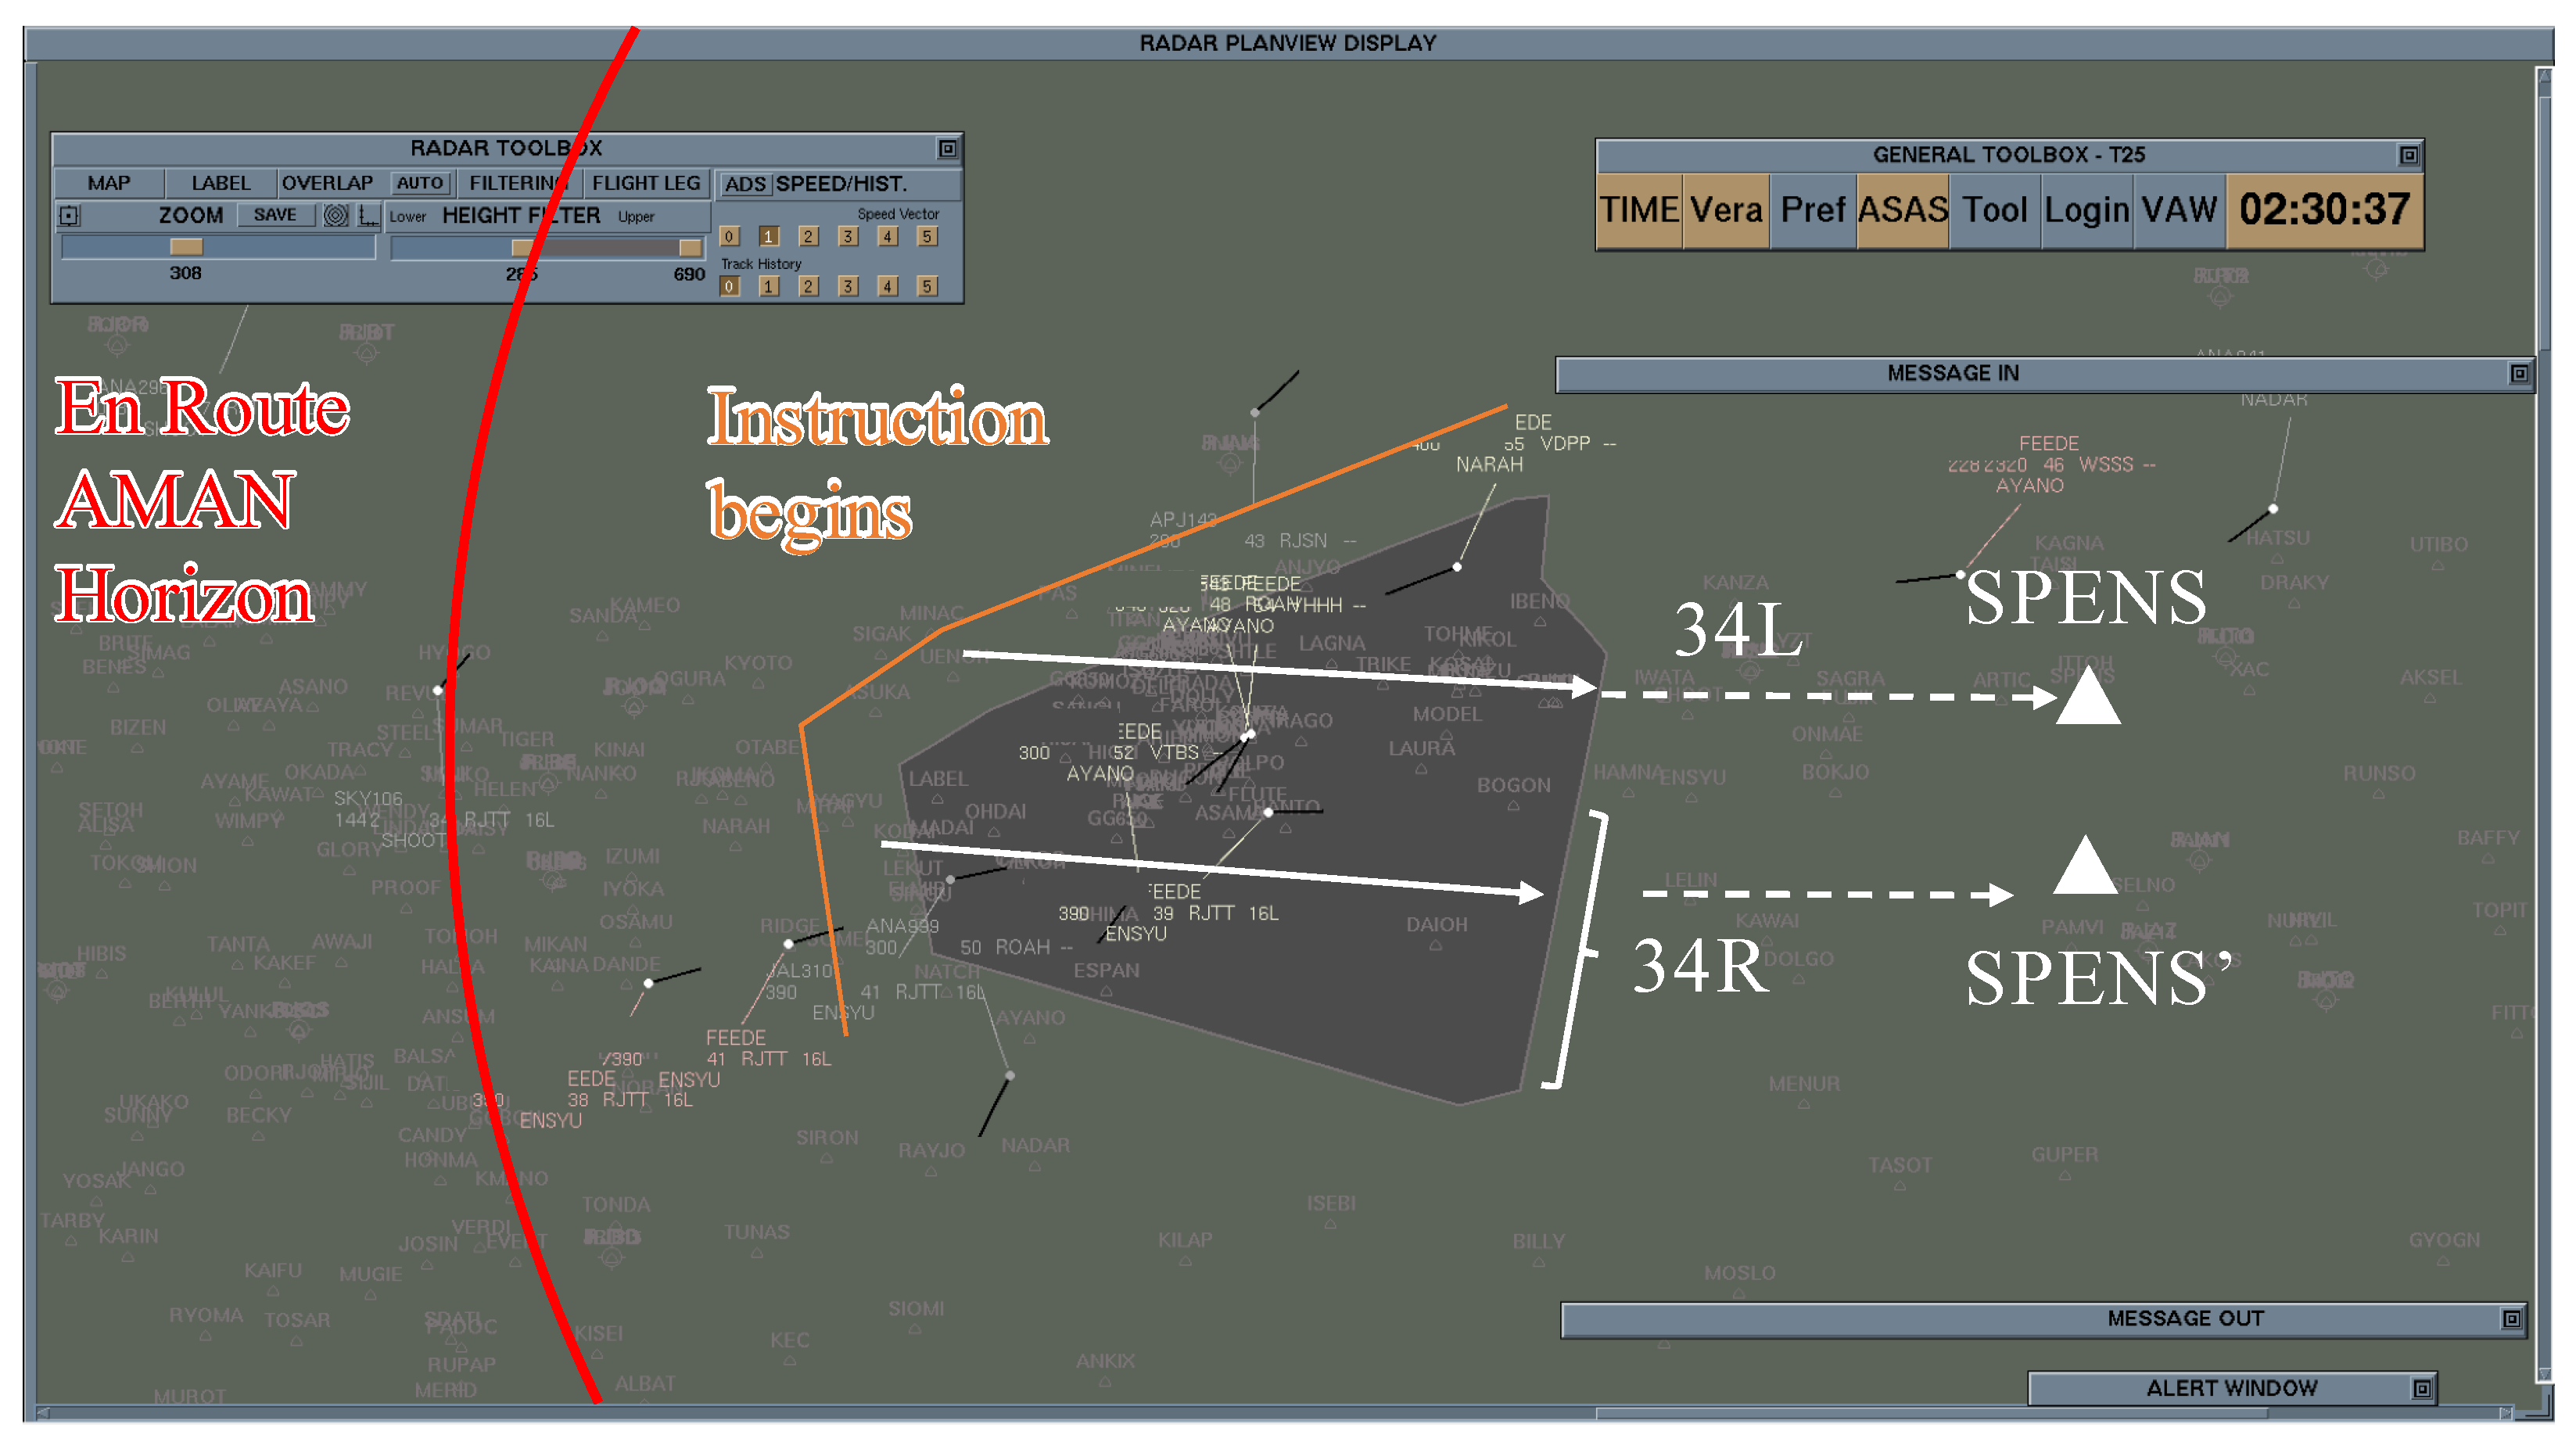
2.1. Runway Assignment

The runway assignment method is designed by combining stochastic estimation and data-driven analysis to suitably assign runways for arriving aircraft. The primary objective is to create a time-efficient flow of aircraft on the runway, particularly in large-scale airports with multiple runways. This ensures that the “short-term” runway capacity is not exceeded, even during periods of high arrival demand. First, the algorithm predicts short-term runway throughput, aiming to smooth out any potential spikes in traffic over a short period (e.g., 10 min), ensuring that the flow remains within the runway’s capacity. For example, at RJTT, the theoretical capacity might be 36 landings per hour on runway 34L [30], but in practice, short-term variations in arrival flow need to be managed to prevent congestion. Then, the algorithm calculates the arrival and departure throughput based on the Predicted Takeoff Time (PTOT) from Departure MANager (DMAN) and the ETA. For arrivals, the ETA is determined at a specific distance from the airport (e.g., 150 to 200 NM), considering both the estimated time to reach the gate and the time from the gate to the runway for departures. The PTOT is typically calculated 30 to 40 min before departure, corresponding to flight duration from en route airspace to TMA for arrivals. When the predicted runway flow exceeds the maximum number of thresholds, arrival flights are re-assigned to the other runway to balance the load. This re-assignment process helps to mitigate congestion and optimize runway utilization. The key parameters used in this process include the time frame ( ξ ), the maximum number of arrivals ( N m a x / ξ ), and the maximum number of runway re-assignments allowed per hour ( N c h g / h ). These parameters ensure that runway assignments are made systematically and within acceptable limits. An algorithm is used to decide whether to re-assign an arriving aircraft based on the current runway load. The algorithm considers factors such as the target group’s taxiing time and the number of permitted re-assignments per hour. These parameters are set based on the maximum arrival numbers estimated through the minimum time separation, the inter-aircraft time sigma [31], and the runway occupancy time constraints [16,30].
Figure 2 provides the runway configuration overview of the north wind operations at RJTT. Under north wind operations, runways 34L and 34R are used for parallel and independent arrivals, while runways 34R and 05 are used for departures. RJTT arrivals from the south or east are guided to land on runway 34L. In contrast, RJTT arrivals from the north are guided to land on runway 34R. The number of arrivals using runway 34L is more than three times that of arrivals using runway 34R. In the current ATC in Tokyo Approach Control Area (TACA) corresponding to TMA for RJTT, some flights are occasionally diverted to runway 34R, depending on the situation. First, En Route AMAN calculates the arrival flow rate ( ξ ) at runway 34L ( N ξ , 34 L ) and compares it to the maximum allowable rate ( N m a x / ξ , 34 L ) based on the ETA list for runway 34L ( t E T A @ 34 L , a c i ) in a time horizon of 30 to 40 min to look ahead. When the calculated arrival flow rate ( N ξ , 34 L ) exceeds the maximum threshold ( N m a x / ξ , 34 L ), the system proactively reassigns the target aircraft to runway 34R, prioritizing those that minimize taxiing time. This reassignment strategy, which is based on the flow at runway 34L, ensures effective utilization of the runway. To avoid excessive delays in departure and northbound traffic at runway 34R, a third parameter, N c h g / h , is introduced to cap the maximum number of runway reassignments. Therefore, when En Route AMAN is applied, available capacity at an additional runway (34R) is proactively used to balance the 34L load. In our experimental context, En Route AMAN is expected to reduce vectoring (flown distance) and the number of speed control instructions.

2.2. Speed Control

The speed control method is designed to manage the longitudinal time variance in the arrival sequence by controlling the inter-aircraft spacing on the time axis. This is achieved through a combination of simulation-based optimization and data exploration techniques. First, a database of ideal traffic flows is created using simulation-based multi-objective optimization. This database is essential for identifying conducive speed control strategies that correspond to the required amount of delay. Next, decision tree analysis is employed to extract knowledge and rules from the optimized traffic flow database. These rules are then translated into operational guidelines that ATCos can apply in real-time scenarios. The decision tree helps organize the data by breaking down complex traffic situations into manageable rule-based actions. Then, ATCos use these guidelines to implement speed control at specific points, effectively managing the arrival sequence. By systematically applying the rules derived from the database, ATCos actively manage inter-aircraft spacing, ensuring that it remains within the desired parameters. The goal is to minimize terminal congestion by transferring sequencing delays from the TMA to the en route airspace. The speed control rules are designed to ensure conducive inter-aircraft coordination by adjusting the speed of aircraft in the en route airspace, thereby reducing delays.
Figure 3 illustrates the flight paths of RJTT arrivals and the relevant airspace layout on a day when north wind operations were in effect. RJTT arrivals from the west eventually reach the Tokyo Approach Control Area (TACA) via the waypoint SPENS, landing on runway 34L. At this point, a longitudinal spacing of 10 NM is required for entry into TACA at SPENS, which is typically achieved when exiting T25 under nominal conditions. En Route AMAN back-calculates and predicts the necessary speed changes to efficiently use each runway. The speed control function manages and maintains the required time intervals at SPENS ( τ 1 @ and τ 2 @ ), using the ETA of the target arrival ( t E T A @ S P E N S , a c n ) and the previous two aircraft ( t E T A @ S P E N S , a c n 2 ) based on the ETA list at SPENS ( t E T A @ S P E N S , a c i , for all i in 1 , n ). If τ 1 @ is less than the threshold parameter τ 1 c l 1 and τ 2 @ is less than τ 2 c l 1 , the ATCos are advised to reduce the speed of the target arrival aircraft. The parameters τ 1 c l 1 and τ 2 c l 1 are designed to minimize spacing variance between aircraft, including popup arrivals. In our experimental context, En Route AMAN is expected to reduce vectoring (flown distance).

3. Simulation Environment

3.1. ESCAPE Light Simulator
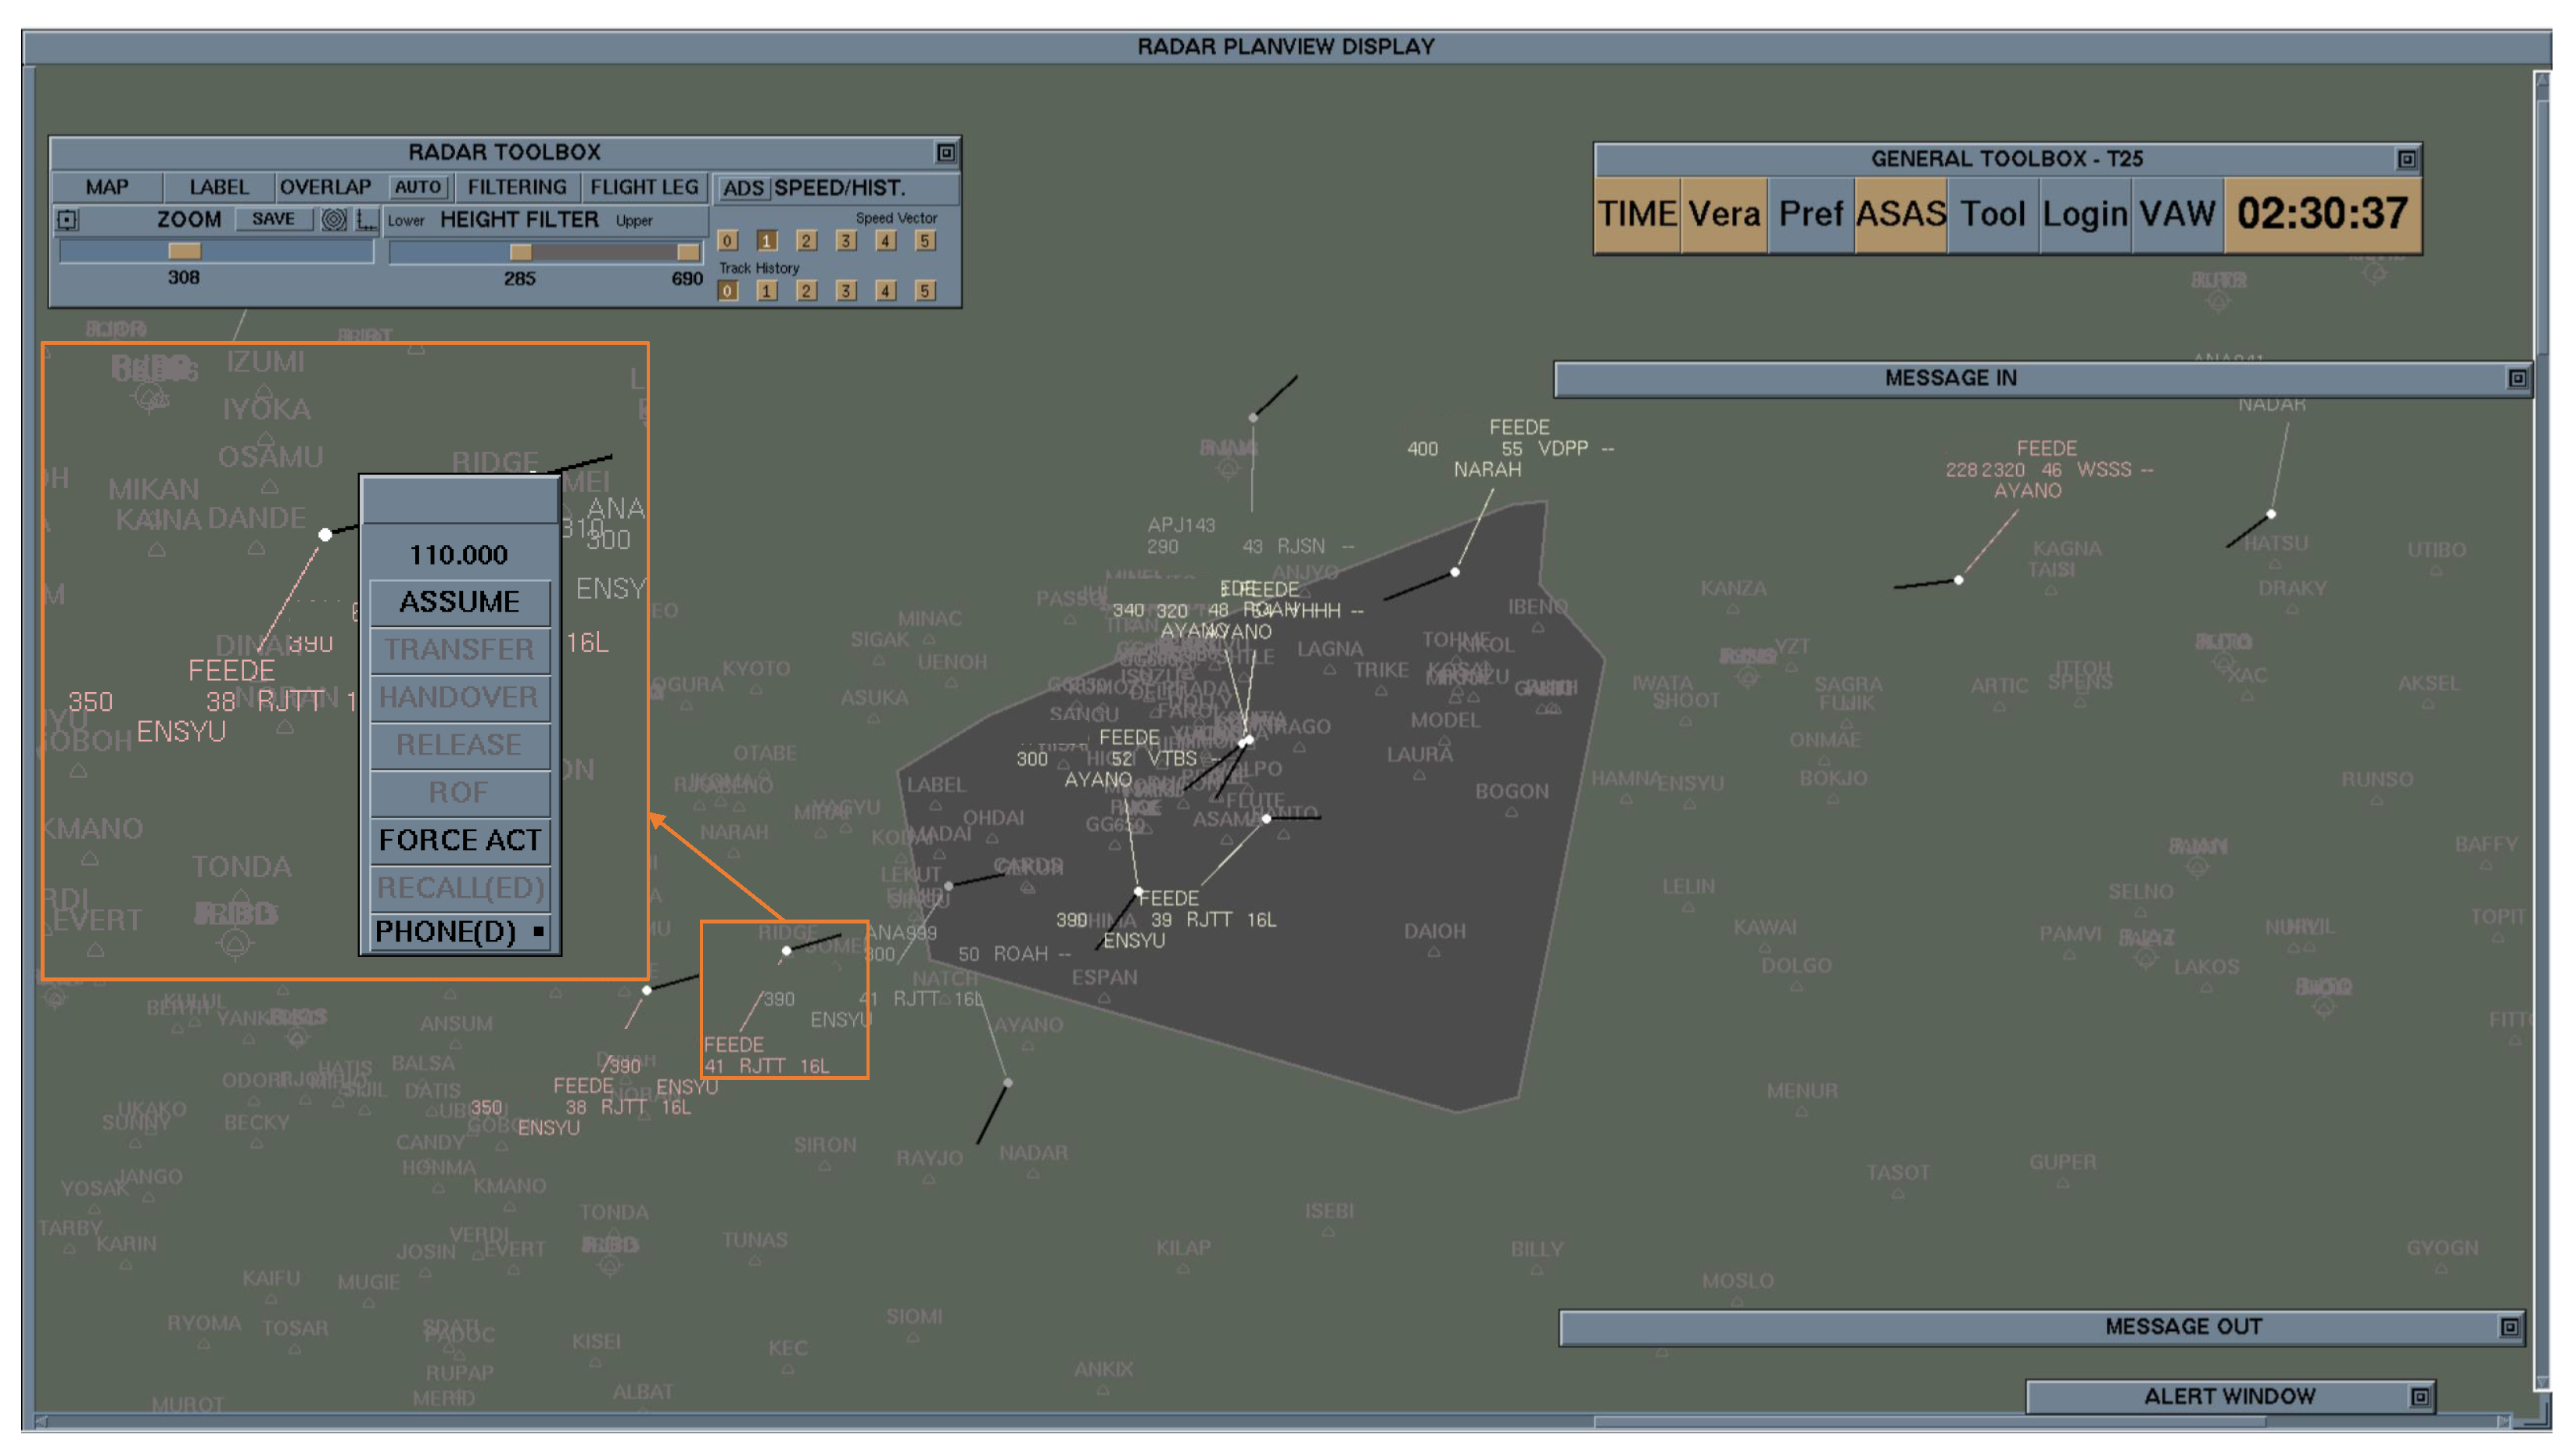
ESCAPE-Light [32] is a lightweight version of the ESCAPE (EUROCONTROL simulation capabilities and platform for experimentation) software [33] with high performance features, suitable for basic ATC training and research projects in universities. The simulator can be used not only for smaller real-time simulations, training, and research [34], but also for airspace improvements such as conflict resolution [35], artificial SA [24,25]. In ESCAPE Light, the aircraft performance is modeled using Base of Aircraft Data (BADA) [36]. Furthermore, a significant amount of data was recorded every 5 s, including controller-pilot interactions and safety alerts, for post-exercise processing. The current research focuses on the development of a simulation environment in and around T25.
ESCAPE Light runs on Linux’s CentOS (Operating System) and has specific hardware requirements. EUROCONTROL offers a solution using Virtual Machines (VMs) to reduce hardware requirements. This allows platform designers to choose from a wide variety of hardware parts. In order to accommodate user familiarizing, Microsoft Windows is used as the host OS and the required Linux (host) system is provided as a virtual machine image. Virtualization allows ESCAPE Light to be simulated even on computers with less stringent hardware requirements.
Figure 4 shows the configuration of simulation environment. All computers are on the same local network with static IP (Internet Protocol) addresses. At Tokyo Area Control Center (Tokyo ACC), the room for ESCAPE Light simulation platform is equipped with three PCs (Personal Computer) and three large 27-inch QHD (Quad high definition 2560 × 1440) screens. The first PC (Laptop1) is for the ATCo (CWP01) and the second PC (Laptop2) is for the pseudo pilot (PIL01) and the adjacent sector ATCo (CWP02). The same person is responsible for both PIL01 and CWP02, with an additional support person assigned to assist him/her. This support person provides double-checking by recording the controller’s instructions on paper and performing callbacks for the instructions. Communication takes place verbally without a headset, following the phraseology defined by ICAO [37] (International Civil Aviation Organization). In this study, humans in charge of Laptop1 will be test subjects. This study measures the instruction from the person in charge of Laptop1, which mimic the traffic environment of T25. On Laptop1, AMAN HMI specifically designed to this study is displayed next to the T25 sector polygon. The third PC (Laptop3) is in charge of creating and transferring simulation input data (IPAS01, Integrated data Preparation and Analysis System) and managing and post-processing the simulation (GRD01). IPAS01 is a data preparation tool, which plays the role of transferring information necessary for simulation to GRD01 before starting the experiment. Specific usage of IPAS01 is summarized in the Antolović’s work [38], which created the scenario for air traffic in Zagreb FIR. The data include airspace, traffic scenario, constraint configuration, meteorological environment. Coordinate data for the sectors, fixes, and runways in the FIR are extracted from the Aeronautical Information Publication (AIP) published by JCAB [39]. Each aircraft will emerge from fix at approximately 100 NM radius from T25 in time, assigned altitude, and assigned speed according to the FP.
The radar display and input methods used in the experiment differed from those at Tokyo ACC. While the actual system allows for keyboard numerical input, the simulation relied on mouse-click inputs due to technical limitations. To address this, ATCos participated in a one-hour pre-experiment training session to familiarize themselves with the simulation environment, including the En Route AMAN system, radar screen interface, and pseudo-pilot communications. During the training, ATCos practiced conflict resolution, speed control, and runway assignment instructions, ensuring they were well-prepared to manage traffic flow and provide relevant real-time feedback during the main simulation runs.
The following subsections describe each role of CWP01/CWP02/PIL01 in detail.

3.1.1. CWP01

Figure 5 illustrates the HMI for the CWP01 operator, who serves as the main participant in this study. This individual is responsible for giving instructions to the aircraft entering T25. CWP01 visualizes the following information: call sign (CS), current flying sector, flight level (FL), ground speed, and waypoint to which one is heading. The person who plays the role of the ATCos handovers the aircraft by clicking the “ASSUME” button. Then, the person gives instructions to the aircraft from the moment it enters T25. The instructions given are completed by clicking on and selecting the information corresponding to the aircraft on the screen. After completing all instructions in T25 for an aircraft, the person hands over the aircraft to the adjacent sector by clicking the “TRANSFER” button.

3.1.2. CWP02

Figure 6 shows the HMI for CWP02 operator, who plays an auxiliary role in the study. CWP02 visualizes the following information: call sign, currently flying sector, FL, ground speed, and waypoint to which one is heading. The person in charge of CWP02 handovers the aircraft by clicking the “TRANSFER” button. When CWP02 initiates the transfer of an aircraft by pressing the “TRANSFER” button, the CWP01 operator completes the process by assuming control of the aircraft, ensuring a smooth transition between sectors. Conversely, when the aircraft is handed over from T25, the person responsible for CWP02 presses the “ASSUME” button to perform handover.

3.1.3. PIL01

Figure 7 depicts the HMI for PIL01. The subject in charge of PIL01 operates CWP02 at the same time and reflects the instructions from the subject of CWP01 to the aircraft. As shown in Figure 7, which shows the screen when an aircraft is selected, the blocks on the screen are categorized according to the instructions. For example, when an instruction is made to change the speed, pressing the “SPEED” button displays the Mach number that can be changed at the bottom right of the screen. By clicking on the indicated Mach number and pressing the “EXECUTE” button, the instruction is reflected in the aircraft. Finally, when leaving T25, the aircraft changes frequency.

3.2. Stand-Alone Human–Machine Interface (HMI)

Figure 8 shows the Human–Machine Interface (HMI) for speed control and runway assignment. The definition of each column is as follows:
  • “CS” is the call sign.
  • “TIME” is when the target aircraft enters the En Route AMAN horizon and will appear according to this column.
  • “SPD” is the deceleration speed range with the Mach number recommended by En Route AMAN.
  • “RWY” is the assigned runway recommended by En Route AMAN.
  • “ETA” is the estimated arrival time at SPENS, which is the terminal gate for the traffic flow through T25.
This HMI is placed next to the T25 HMI (CWP01). While watching two screens, including this HMI, the T25 controller instructs the speed and assigns the runway following En Route AMAN advisory. The “CHK” button allows the user to remove the aircraft from the display 5 s after it is pressed. During the experiment, controllers were instructed to press the “CHK” button only for aircraft under speed control, leaving those assigned a runway to remain on display to prevent forgetting them. Since this HMI works independently of ESCAPE Light, a simulation administrator matches the time on the bottom left with the simulation start time of ESCAPE Light and presses the “START” button on the bottom right at the same time for syncronization.
Figure 8. Human Machine Interface (HMI) for speed control and runway assignment by En Route AMAN. The call sign is kept secret because the actual regularly scheduled flights are used in the experiment.
Aerospace 11 00866 g008

4. Experimental Conditions

4.1. Experimental Resource

Table 1 shows the example of the simulation schedule for an ATCo. Prior to the actual experiment day, a separate preparation day was conducted where ATCos were introduced to the simulation environment through detailed briefings and training sessions (a training session) for 1 h (see Section 3.1).
During a period of 9 days, the simulations were conducted in two consecutive 30-min sessions (one with En Route AMAN, one without) without breaks due to scheduling constraints. Originally, individual feedback was planned after each session, but practical limitations required feedback to be collected after both runs using the Post-Run Questionnaire (PRQ). This limitation in timing may have impacted the depth of feedback provided immediately after the simulations. The Post-Exercise Questionnaire (PEQ), which gathered insights on the overall system performance and usability, was administered only once after all simulation scenarios were completed.
Data collection errors occurred on 3 separate days for one participant, leading to insufficient data and re-experiments. In addition, there were 3 days when both participants conducted simulations on the same day, split between morning and afternoon sessions. As a result, the overall experimental period extended over 5 months from October 2023, with a total of 21 days of experiments being carried out, excluding the briefings and training session.

4.2. Experimental Design

Table 2 shows the list of 34 HITL simulation trials. These simulations were designed using a full factorial approach, combining three traffic scenarios, three wind conditions, and two En Route AMAN scenarios (with and without) across two controller participants. This gives a total of 3 × 3 × 2 × 2 = 36 , but two trials (NOM#S1_T2_W2 and AMAN#S1_T2_W2) were excluded due to equipment malfunctions, resulting in 34 trials. Although this may introduce unintentional bias in statistics, the collected data were deemed sufficient for reliability and relevance of the results.
The traffic flow was divided into three volume levels (TF1, TF2, and TF3) based on the volume and composition of arriving flights at RJTT. TF1 represented the highest volume of RJTT arrivals, TF2 included both RJTT arrivals and east-to-west bound traffic excluding RJTT, and TF3 focused exclusively on RJTT arrivals and east-to-west bound traffic. This graduation allowed for realistic variations in air traffic density and complexity during each trial.The details of these traffic scenarios are provided in Appendix A, Appendix A.1.
For wind direction and wind speed, the data extracted from Meso-Scale Model Grid Point Value (MSMGPV) [40] were implemented by converting the pressure levels to FLs, resulting in a constant wind blowing at each of these flight level. Based on the data, the knowledge and experience of the ATCos in charge of T25 who participated in this study, and the opinions of other stakeholders, we identified a need to categorize wind speeds for the experiment. To streamline the experiment design, wind conditions were classified into three levels: “low wind”, “average wind”, and “strong wind”. Simulation tests were then conducted under these three conditions.
The wind conditions are described in more detail in Appendix A, Appendix A.2.
Two scenarios were prepared for the study: one without En Route AMAN (baseline) and one with En Route AMAN. For the baseline scenario without En Route AMAN, the statistical data were used to calculate the metrics required for the speed control and the runway assignment rule following [16]. As a result, En Route AMAN identified the “runway assignment target” and the “speed control target” as shown in the column of N R W Y and N S P D in Table 2. En Route AMAN is capable of adapting in response to traffic forecasts in real time (see Section 2 and [16]), but precalculated runway assignment and speed control targets were chosen for HITL testing to ensure reproducible conditions.
All design combinations were repeated for two different ATCos to account for variability in human performance. This allowed for the assessment of how different controllers interact with the En Route AMAN under the same conditions.

4.3. Controller Operational Procedures

Figure 9 illustrates the condition of controller instructions. The takeover from the adjacent sectors to T25 occurs at points approximately 10–20 NM from T25 (orange line), from which the instructions from the T25 controller begin. Although this auxiliary line is not drawn on the HMI of ESCAPE Light, the subject was able to follow this arrangement. For the baseline scenario without En Route AMAN, T25 controllers perform radar guidance targeting 10 NM in-trail separation at SPENS. En Route AMAN operates when each aircraft passes 170 NM (red line) from SPENS (almost the same as 180 NM from XAC as illustrated in Figure 3) and determines speed control targets and runway assignment targets. The speed control target of En Route AMAN is instructed to decelerate with a fixed deceleration magnitude (−M.03 in this study estimated from the frequently used speed reduction magnitude in [41]) to simplify the speed calculation process for ATCos. The instructions for flights with runway re-assignment to 34R as stipulated by En Route AMAN are solely given assuming guidance to laterally divert from the 34L sequence to enter TACA at a new gate 10 NM south of SPENS (SPENS’ in Figure 9).

4.4. Measurements and Observations

Data collection process consists of three parts: (1) A Likert-scale questionnaire, which is processed as a number (described in the second paragraph); (2) Qualitative and subjective comments from participating ATCos; (3) Quantitatively measured indicators such as flow duration and numbers of instruction as recorded in the simulator.
A questionnaire listed in Table 3 is used to gather an ATCo’s qualitative feedback on the principles of En Route AMAN and the developed controller assistance system after completing the simulations without and with AMAN. At the same time, qualitative and subjective feedback with open questions from tested ATCos are also obtained. The questionnaire’s metrics are followed by Ahrenhold’s past work [26]. The questions are mainly about the operational feasibility and safety of the concept and are answered on a 5-point Likert scale, as shown in Table 4. The responses from the PRQ and the PEQ were quantified by assigning numerical values to the responses and then summing them for analysis and evaluation purposes.
Meanwhile, quantitative metrics are meticulously recorded to ensure a comprehensive evaluation of both the efficiency and the effectiveness of the En Route AMAN. These metrics include flight duration, which helps assess how the AMAN influences the overall traffic management, and the number of instructions issued by the ATCos, reflecting the task volume and decision-making processes.
Data collected from the simulation runs are cross-checked with the qualitative feedback and the quantitative metrics. This analysis aims to determine the impact of the En Route AMAN on ATCo performance and overall safety. In addition, any discrepancies or patterns observed in the data will be addressed to further refine and enhance the AMAN.

5. Validation Results

5.1. PRQ and PEQ

Figure 10a illustrates the results of the PRQ administered after both nominal and AMAN simulation trials under various traffic and wind conditions to capture the immediate reactions of the involved ATCos. ATCos generally rated the experience positively, as the values for all the questions, excluding Q4/5, are greater than 3, while Q4/5 are less than 3, as shown in Figure 10a. This indicates that the AMAN provided tangible benefits in managing the arrival flow. In addition, two key observations emerge from this questionnaire. First, as hypothesized, ATCos observed an additional task volume when managing heterogeneous traffic, as evidenced by lower scores for Q2/9 and higher scores for Q4 with TF2 compared to TF1/3. This aligns with the findings in Bin Jumad’s previous work [21]. Despite this, they found the AMAN manageable and beneficial for maintaining an organized traffic flow. Second, the scores for Q6/7 with TF1 are lower than those with TF2/3, indicating more difficulty in managing traffic flow under these conditions. A significant proportion of the controllers indicated that the high volume of traffic arriving at RJTT obscured the temporal evolution of the traffic flow. Controllers noted that this could obfuscate their ability to predict and manage traffic efficiently over time.
Figure 10b shows the result of the PEQ, which was designed to gather comprehensive feedback from each subject after completing all simulation runs. The radar chart shows that most controllers rated the AMAN positively, with higher values in the “good” category. This suggests that the subjects generally agreed that while the En Route AMAN added additional instructions and responsibilities, it contributed to significant improvements in traffic management. Furthermore, highlights from this feedback include another outcome as Subject1 marked 2 in Q15/17 less than 3. Subject 2 emphasized the necessity of specific training to guide arriving aircraft to the multiple gates, particularly when redirecting aircraft to gate 34R. This training would ensure that controllers are equipped with the skills to handle rerouting efficiently without compromising safety.
Again, these results underscore the critical role that HITL simulations play in evaluating a novel operational concept. In particular, PRQ results indicated a different reaction in perceived task volumes and complexity according to traffic density and complexity when using En Route AMAN. This detailed feedback is integral in understanding how the system might function in real-world conditions, with ATCos offering valuable insights into its operational feasibility and impact on their workflow.

5.2. Qualitative Feedback from ATCos

Positive feedback from ATCos is described below.
  • Early identification of RWY34R usage is greatly appreciated, allowing quick sequence comprehension and smoother operations.
  • Distribution to different runways significantly reduces the volume of tasks associated with having access to additional metering queues, making operations easier.
  • Having a way to easily check the instructions on the Mach is a key to sequence management.
Subjective evaluations from ATCos stated that the aircraft subject to speed control instructions stipulated by En Route AMAN made it easier to determine the sequence of approach to the TMA. They also commented that changing arrival runways as instructed by the En Route AMAN reduced the effort to establish the required separations between arriving aircraft.
In contrast, the main concerns of ATCos collected through the questionnaire are summarized in five items.
  • The levels of cooperation of pilots in speed control would vary in real operations, making it difficult to issue speed control instructions with expected and conforming results.
  • Lowering the speed without lowering the altitude is challenging in strong wind conditions and often requires additional adjustments.
  • Constant attention to Mach and RWY34R lists is required, increasing visual load, particularly during duration periods.
  • When AMAN instructions do not match real-time conditions, changing the sequence can be difficult.
  • Handling the situation where the spacing is widened due to congestion and re-distributing to RWY34R requires additional training.
It was commented that the proposed operation was sometimes perceived as cumbersome because it required extra work from the controllers to understand the arrival sequence to the TMA. In this study, the runway assignment and speed change lists were displayed on a separate HMI; however, this still led to increased visual load. This suggests that in highly complex airspace, using ETA and STA lists (as in conventional AMAN [2]) or managing time with STA as a constraint, which has been applied in previous research, may be difficult. Incorporating this feedback is crucial to further refine the En Route AMAN, ensuring that it meets practical operational needs and improves ATC services.

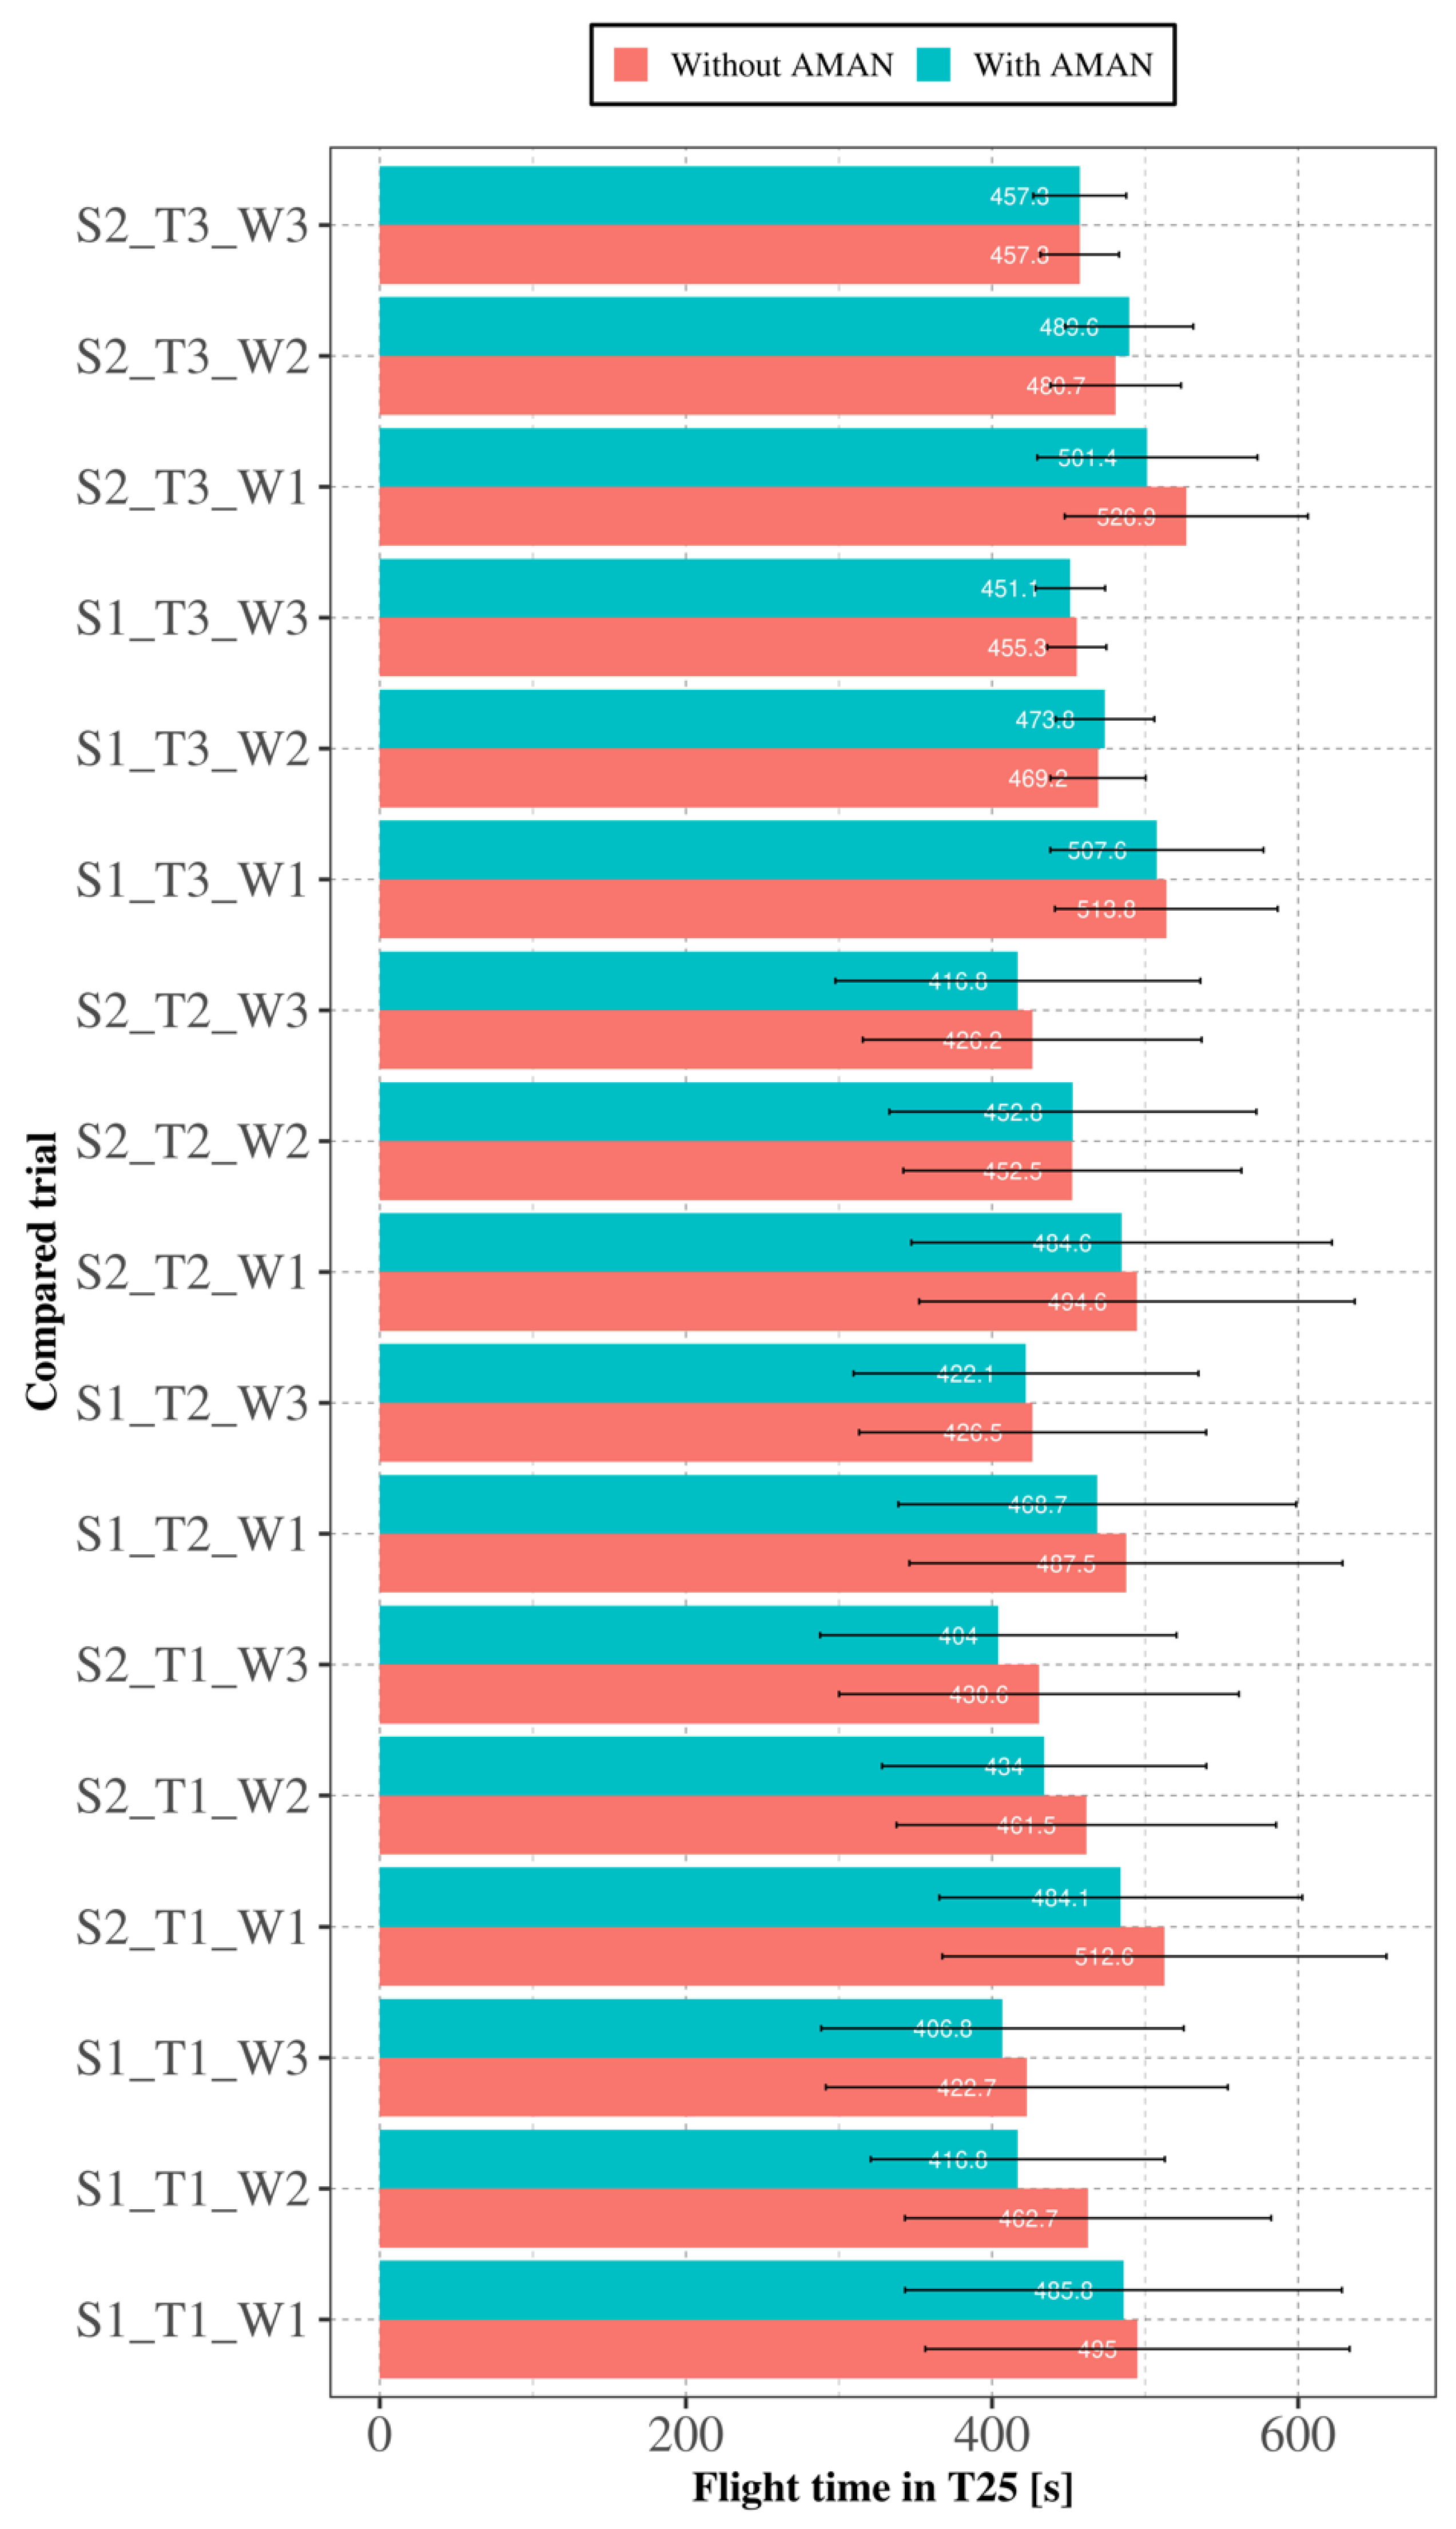
5.3. Flight Duration in T25

The analysis of the variation in average flight duration provides critical insights into the impact of the En Route AMAN on the reduction in flight duration. The study compared the average flight duration of the AMAN-managed flights with those without it, revealing significant variations that highlight the effectiveness of the AMAN in optimizing flight operations. Figure 11 shows the average flight duration variation by flight category: nominal flight (NOM), speed-controlled flight (SPD), and runway re-assigned flight (RWY). The results were segmented into three types of traffic (T1, T2, T3) and evaluated in different scenarios. The single most striking observation to emerge from the data comparison was that the flight duration is reduced by about 100 to 200 s in the case with TF1 ( Δ S*_T1_W*) and the flight category of RWY, as shown in Figure 11. This reduction is attributed to the ability of these flights to avoid metering traffic to runway 34L, resulting in reduced flight duration for nominal flights. Regarding speed control, T1 originally had a high traffic volume, which contributed to a decrease in the amount of time extension, especially when combined with the runway assignment instructions. This suggests that in congested scenarios such as T1, the influence of runway assignment by En Route AMAN is more pronounced than the effects of time extension through speed control. In contrast, T2 and T3, which are less congested, generally resulted in longer flight duration with En Route AMAN. As illustrated in the figure, AMAN has a dual effect on flight-time variation.
Figure 12 shows the average flight duration with AMAN and without AMAN in different scenarios. The implementation of the AMAN resulted in a notable reduction in average flight duration. The data showed that flights managed with the AMAN experienced a decrease in flight duration by an average of 25.6 s with T1 (S*_T1_W* in Figure 12) compared to those managed without the AMAN. This reduction underscores the AMAN’s ability to streamline arrival processes, leading to more efficient ATC services and less time spent in holding patterns or adjusting flight paths. Furthermore, the positive impact on flight duration was consistent in various scenarios, including different traffic densities and weather conditions. The data demonstrated a clear trend: The flights managed with the AMAN not only had reduced average flight duration but also exhibited less variability, indicating more predictable and efficient traffic flow. This consistency indicates the robustness of the AMAN in maintaining high performance under diverse operational circumstances. Finally, the analysis revealed that wind conditions, particularly strong tailwinds, had a noticeable effect on flight duration. Flights experiencing tailwinds benefited from reduced flight duration regardless of nominal and AMAN conditions. Therefore, the mitigation in flight duration due to AMAN is slightly smaller in the average/strong wind cases (W2/3) compared to the case with light wind case (W1). Despite these variations, the AMAN effectively mitigated the adverse effects of the wind on flight duration.

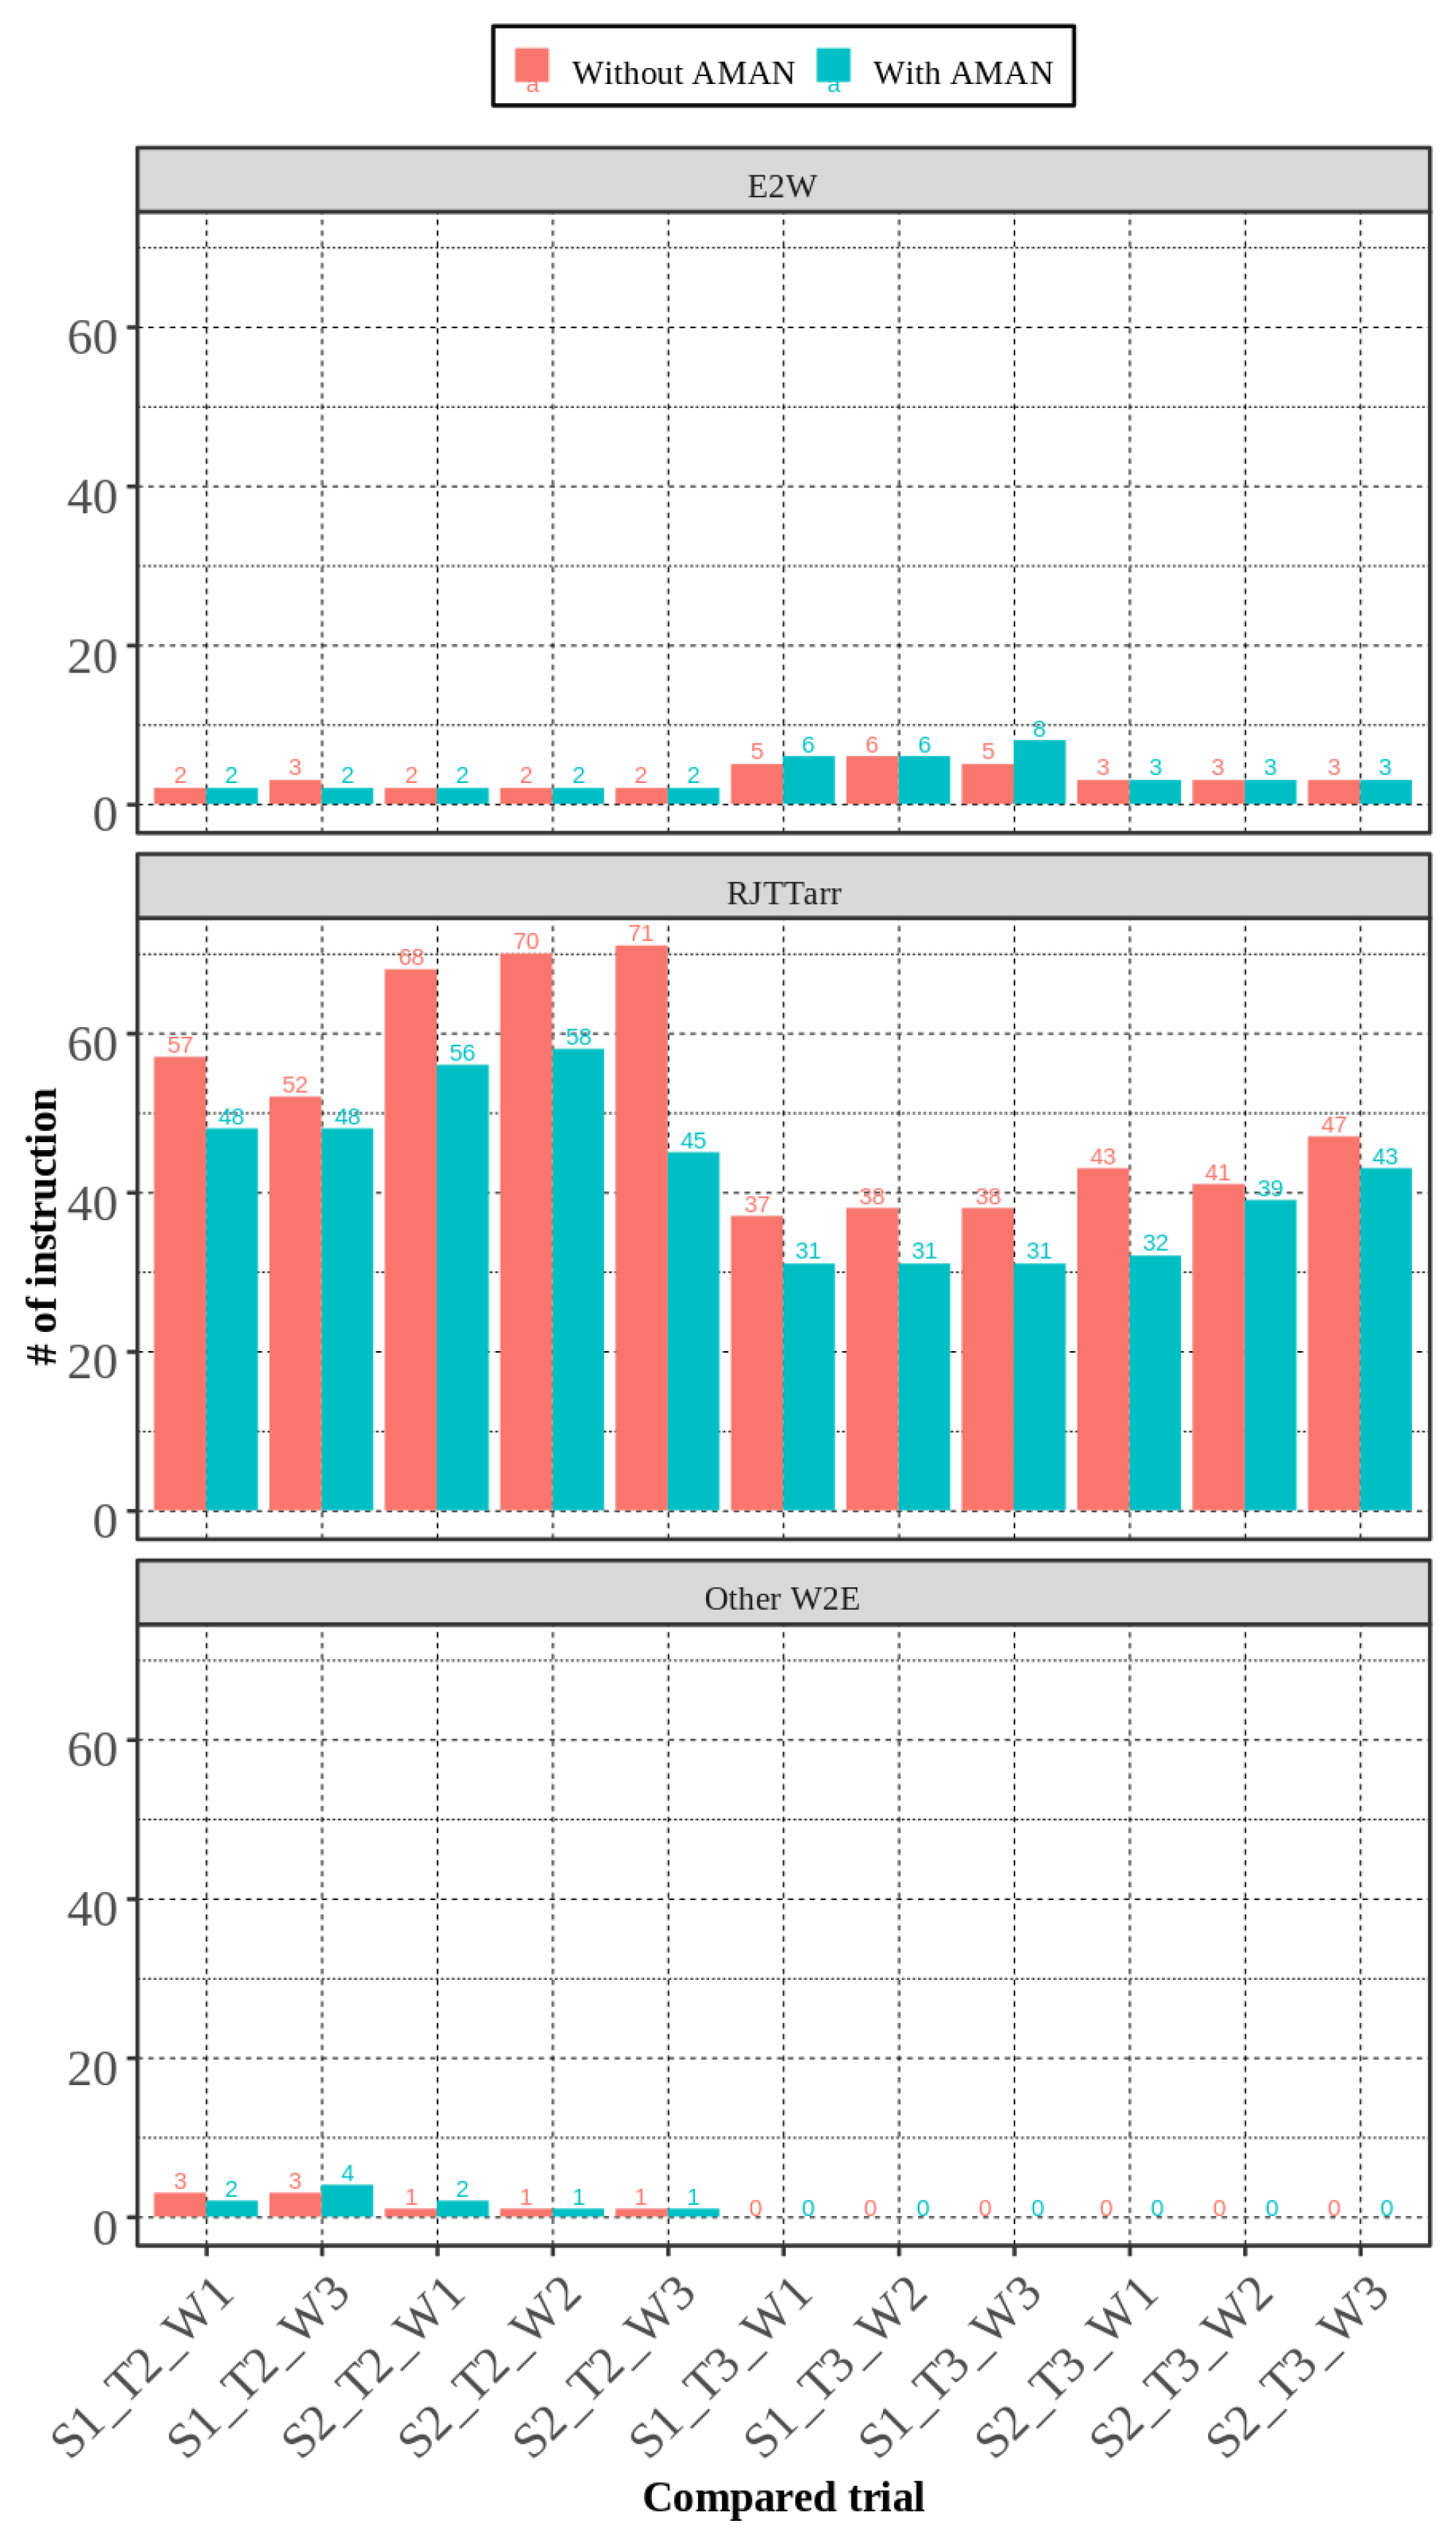
5.4. Number of Instructions

As for communication efficiency, Figure 13 shows the number of ATCo instruction with AMAN and without AMAN (Nominal operation) in different scenarios. The implementation of the AMAN led to a notable reduction in the number of instructions, especially in FL (Flight Level) and HDG (Heading). On average, the frequency of the instructions decreased by approximately 20% in T1 (S*_T1_W* in Figure 13), when it is the highest in RJTT arrivals. This suggests that AMAN may reduce the task volume in metering operations due to runway assignment and speed control. While the metering workload appears to decrease, this must be ensured without a potential increase in other workload categories or downstream controller workloads. Moreover, evaluating workload changes solely based on the count of instructions might not provide a comprehensive view. Importantly, the reduction in HDG and FL instructions was prevalent for most scenarios with various traffic densities and operational conditions, as shown in Figure 13, highlighting the robustness of the AMAN. This means that, whether in normal or peak traffic conditions on RJTT arrivals, the AMAN maintained its ability to reduce the ATCo’s task volume, ensuring efficient and safe air traffic operations. In fact, the ATCos who participated in the HITL simulations reported a reduction in perceived task volumes due to the decrease in the need to issue these instructions. Therefore, this reduction not only improves operational performance but also contributes to improved job satisfaction and reduced stress among the controllers perceived in Figure 10a,b. Another finding was that SPD (speed control instructions) were sometimes reduced by AMAN, especially in windy conditions (W2, W3). Curiously, this result was unexpected, but it is important to consider that runway assignment and speed control are confounding factors in this context. During the experimental design, wind conditions were predetermined, but it became evident that these conditions interact with each other. According to the feedback from ATCos, strong tailwinds often necessitate issuing speed control instructions for most RJTT arrivals during peak hours to maintain proper separation in downstream airspace. Incidentally, during some scenarios with AMAN, speed control instructions were less frequent. This reduction is attributed to the fact that AMAN not only assigns runways but also achieves necessary longitudinal spacing with fewer instructions, thereby reducing the need for additional speed control instructions. In some cases, this dual effect—combining runway assignment with AMAN—resulted in a noticeable decrease in speed control directives. This decrease in instruction frequency suggests that AMAN streamlines the arrival process, allowing ATCos to focus on more critical tasks such as conflict resolution. Thus, this reduction is particularly beneficial in high-traffic situations where reducing the communication load can significantly improve the overall performance of ATC services. This finding highlights a key aspect that has not been sufficiently addressed in previous studies due to the lack of HITL elements. In earlier research, the interaction between runway assignment and speed control under varying wind conditions was often overlooked. The reduction in speed control instructions, especially under strong tailwinds, underscores the potential of En Route AMAN to optimize ATM by dynamically adjusting both runway assignments and spacing requirements in real time.
Figure 14 describes the total number of instructions across three traffic layers: E2W (East-to-West bound traffic), RJTTarr (RJTT Arrivals), and Other W2E (Other West-to-East bound traffic), under various scenarios. Remarkably, RJTTarr traffic exhibited a significant decrease in instructions, with reductions of up to 45% in scenarios ranging from S1_T2_W1 to S2_T3_W3, demonstrating the effectiveness of runway assignment and speed control. In the E2W and W2E traffic, the instruction count remained consistently low with minor variations across all scenarios, indicating that the AMAN’s impact was minimal. However, it is intriguing to note that the feedback from participant ATCos highlights distinct characteristics and challenges associated with E2W and W2E traffic flows. E2W traffic often involves frequent shortcut and flight-level requests from pilots, which were not considered in our experiments, and can increase the number of instructions. Although the communication load tends to be high with dense climbing E2W traffic, they commented that distributing to different runways for RJTTarr can mitigate the task volumes overall. In contrast, W2E traffic is typically managed with maximum shortcuts, but maintaining clear sight of RJTTarr traffic in congested airspace can become an issue, leading to the HITL simulation without shortcuts. Furthermore, ATCos face challenges in instructing W2E aircraft to climb to the final altitude by T25, but they commonly request RJTTarr traffic to descend to RJTT in the early phase, especially in strong tailwind conditions, to maintain the separation. These two kinds of traffic use the same odd FLs, thus increasing the number of instructions. However, the participants gave positive feedback for the split into two flows because the runway assignment did not make the meeting of the T25 exit FL requirement any more difficult. Overall, the AMAN significantly reduced transit time in T25 for the RJTTarr traffic, while its impact on E2W and W2E traffic was minimal, as participant ATCos highlighted challenges, which increased the total number of instructions regardless of runway assignment and speed control measures.

6. Discussion

6.1. Operational Enhancements in En Route AMAN: Procedures, HMI, and Coordination Strategies

Feedback from ATCos has highlighted that the current ATM operations indeed fall short in integrating the fundamental principles of En Route Arrival Management. Specifically, these operations often lack the desirable coordination and information sharing between en route airspace, TMA, and airport operations, which are essential to effectively manage arrivals from an earlier phase of flight. This lack of integration contrasts with some experimental studies that have explored arrival management through speed control and runway assignment within en route airspace. Although these investigations provided generic insights, they often operated under idealized conditions that may not reflect the realities of actual operations. For instance, many studies assumed that all real-time information from different airspaces and airports was seamlessly shared through System Wide Information Management (SWIM) and that en route controllers had unrestricted access to these data at all times. However, in practice, there is no clear selection process to determine which pieces of information are essential or superfluous, leading to a potential overload of information. Moreover, these past studies presupposed that all en route controllers would consistently affect directives as per En Route AMAN, and that pilots would invariably comply with these instructions. They also often assumed that coordination mechanisms with airspace and airports were already well established, overlooking the challenges of implementing such protocols in a dynamic and complex air traffic environment. Our study aims to bridge these gaps using operational strategies that enhance coordination and optimize arrival flows in line with the principles of En Route AMAN.
Our human-in-the-loop (HITL) simulation experiment, especially the comments from ATCos, provided several hints and insights into how to adapt regulations to new situations. Specifically, the experiment identified the need for explicit assignment of responsibilities to ATCos involved in new operations and provided recommendations on handling aircraft in scenarios involving speed control and runway assignment.

6.1.1. Speed Control Procedure

The issuance of speed control instructions often elicits various reactions from pilots, with some being cooperative and others not. From the viewpoint of navigation, speed control can be difficult due to aircraft performance and weather conditions, leading to instances where pilots respond with “Unable” when asked to decelerate without descending. If pilots do not accept deceleration instructions, issuing commands based on a fixed deceleration amount, as demonstrated in our experiment, can reduce unnecessary communication. This approach ensures that the instructions are feasible in most cases.
There are two primary reasons why deceleration might be refused: physical difficulty and airline operational policies. To address physical constraints, we propose to establish a process for estimating the minimum required deceleration amount considering aircraft performance when issuing speed control instructions. If SWIM is employed to calculate the physically possible deceleration amount instead of relying on a fixed amount, it increases the possibility of pilot acceptance, making the instructions more meaningful and tailored to each flight’s specific constraints. This involves referring to the aircraft operating manual and aircraft performance data to check the indicators such as cruise speed (both normal and minimum), current flight altitude weather conditions (wind speed, wind direction, temperature), aircraft weight, air density, lift coefficient, and drag coefficient. During winter, strong tailwinds and lower temperatures reduce the deceleration effect of the Mach number compared to summer. Therefore, combining altitude changes with speed control can be a promising solution to secure the necessary time adjustment if deceleration is insufficient. If a fixed Mach number (e.g., −M.03) was used for deceleration, this operation could be effective only if the estimated deceleration were to exceed that of the fixed Mach number, simplifying mechanical calculation for controllers.
To address difficulties arising from airline policies, we propose establishing rules for deceleration that pilots must follow. Currently, non-cooperative pilots may prioritize adherence to the airline’s cost index (considering timeliness and fuel efficiency) over deceleration. The En Route AMAN has been shown to be overall effective, even if not for individual aircraft in the cruising phase. By sharing these results with airlines, seek their cooperation for deceleration. For example, instructing “Reduce speed to Mach point 77 or less” provides a range (“minimum required deceleration + buffer”) and gives pilots flexible options, promoting smoother operations without rejection.
By implementing these proposals, controllers can more effectively issue speed control instructions, ensuring smoother and more efficient operations in the en route phase.

6.1.2. Runway Re-Assignment Procedure

Notifying ATCos of runway re-assignment early in the en route phase is crucial for optimizing arrival sequencing and maintaining smooth operations. However, it has been found that in certain situations, it is easier to plan and determine the sequence by “swapping” the runway assignment of the re-assigned aircraft with another aircraft in the same short-term flow calculated in En Route AMAN. In this study, we propose that improving the methods for selecting which aircraft should be re-assigned to a different runway can significantly improve the overall process. Specifically, we explore the following three strategies and their respective patterns and benefits:
  • Prioritizing the Aircraft with the Shortest Relative Separation for Runway Re-assignment: For example, within a 10 min flow, choosing the aircraft with the shortest time interval minimizes the variation in intervals between aircraft and maximizes the time adjustment effect of speed control aircraft. This strategy aligns with the concept of flow-based Arrival Management.
  • Prioritizing the Aircraft with the Highest or Lowest Altitude for Runway Re-assignment: This strategy minimizes altitude-based interference, optimizing the process from a complexity management perspective.
  • Prioritizing an Aircraft Approaching from the Southwest for Runway Re-assignment: This minimizes the horizontal flight distance, optimizing fuel consumption and delay for aircraft re-assigned to a different runway.
Currently, there is no established clear phraseology for runway assignment in distant en route airspace, especially before entering the TMA in some regions such as Japan. Runway operations, such as whether the airport is using north or south wind operations, are continuously broadcast via Automatic Terminal Information Service (ATIS). As a result, pilots are generally aware of the expected arrival runway based on operational direction, so explicit communication is often deemed unnecessary. In the experiments, “Fly heading…” was used, but the pilots could not determine if the deviation from the assigned route was due to runway assignment. In today’s operation, communicating the confirmed runway assignment just before STAR entry serves to clarify the pilot’s understanding. However, since STARs are determined by TMA controllers, en route controllers do not have the authority to communicate STAR assignments. Therefore, a new phraseology is likely needed. For example, in our case, using “Expect runway 34R. Fly heading 120. Vector for SPENS”’. Here, the term “Vector” is used to indicate the purpose of the heading, with an accompanying destination (“To”) or reason (“For”). SPENS’ refers to the entry point to TACA for aircraft landing on a runway different from the nominal operation. Alternatively, “Direct to SPENS”’ can be a possible phraseology, especially in situations where it is already known that SPENS’ is the designated gate for runway 34R. By refining the methods for runway assignment and introducing a specific phraseology, controllers can achieve better planning and sequencing, leading to more efficient and coordinated operations in en route airspace. Obviously, these phraseologies assume that information is being shared effectively between en route, TMA, and airport ATCos.

6.1.3. Human–Machine Interface (HMI)

In the past trial of Cross-border Arrival Management (X-MAN) [42], which is similar to E-AMAN, the 4ME HMI, developed by DSNA, supported ATCos by providing a dedicated interface for displaying arrival management information. Displayed information was as follows: (1) Callsign with destination; (2) Total delay at runway; (3) Current FL; (4) Target waypoint and passing time; (5) Speed advisory; (6) Applied sector. This information facilitated efficient coordination of arrival flows across different ATC sectors, which resulted in maintaining manageable workloads for ATCos. However, our HITL simulation results demonstrated that additional information with another display may reduce situational awareness in the complex en route sector due to shifting ATCo’s gaze frequently. Therefore, AMAN target aircraft should be clearly displayed with tags and color coding, making them always intuitively visible on the display. In addition, the list of AMAN target aircraft should be provided in an easy-to-manage format, strengthening cooperation with other sectors and controllers. Based on the feedback from ATCos, we have proposed the following designs for the Human–Machine Interface (HMI), specifically the radar tags used in the control room. The current radar tag designs [43] are as follows:
  • First Line: Flight number (Call sign)/Memo box
  • Second Line: Altitude/Climb (↑) or Descent (↓)/Assigned altitude
  • Third Line: Ground speed + Wake turbulence category/Destination/Remaining distance
  • Fourth Line: Assigned heading/Assigned speed
The deceleration range is indicated by different colors to the right of the speed indicator for the aircraft selected for deceleration, as shown in Figure 15a. The tag of the aircraft subject to runway re-assignment shows the changed runway in a different color. When ATCos confirms and clicks on the runway display, it maintains the different color (the display does not disappear), as shown in Figure 15b. The ATC instructs the aircraft to reduce speed and clicks on the deceleration indicator, which remains to prevent from forgetting the target. During busy times, the required spacing may not be fully established before handing over the flow of arrival aircraft to the downstream feeder sector. It is important that the downstream controller does not confuse the aircraft with the nominal runway and different runway.

6.1.4. Operational Procedures and Guidelines for Coordinating with Adjacent Sectors

To ensure smooth adaptation to the new system, it is essential to provide simplified guidelines for the new operational procedures. Furthermore, conducting simulations that reflect real-world operational scenarios using a training simulator, following the same evaluation and training methods used in the field, is crucial. This approach helps ATCos to quickly adapt to the new system. In addition, improving information sharing with other sectors and establishing operational procedures for smooth communication among ATCos are crucial.
When operations fall under the same jurisdiction (e.g., within Tokyo ACC), it is necessary to create documents outlining the procedures. For operations involving different jurisdictions, establishing Letters of Agreement (LoA) is essential. For example, the transfer from the downstream airspace in the route (for example, T09) to the TMA (for example, TACA) involves two separate waypoints (for example, SPENS and SPENS’), altering the approach routes. Although such handovers are currently rare for the same destination (e.g., RJTT arrival), establishing an LoA is necessary.
During the transfer from the upstream sector (e.g., T25) to the downstream sector (e.g., T09), a specific separation (e.g., 10 NM at SPENS) must be ensured. However, during peak times, maintaining this spacing with only speed control or vectoring by the downstream sector (e.g., T09) can be challenging. Therefore, it is essential to address how to handle altitude for aircraft assigned to different runways (e.g., 34L/R) when the spacing cannot be maintained.
By implementing these guidelines and simplifying coordination procedures, controllers can ensure more efficient and effective operations, particularly in managing handover and spacing during duration periods.

6.2. Insights from HITL Simulations of En Route AMAN: ATCo Task and Delay Mitigation Perspectives

As stated in the Introduction, our main objective is to validate the operational feasibility and the effectiveness of an innovative AMAN for en route airspace, the so-called En Route Arrival MANager (En Route AMAN), using the ESCAPE Light Simulator provided by EUROCONTROL. The research focused on optimizing the arrival stream through runway assignment based on short-term runway flow and speed control based on relative time separation issued in en route airspace to mitigate delays at TMA and airports. In this context, two key research questions arise: (i) Is it possible for ATCos in en route airspace to perform additional tasks due to En Route AMAN? (ii) Can En Route AMAN mitigate arrival delay? The following gives insight into these questions.
To address the first question, Human-In-The-Loop (HITL) simulations involving rated ATCos yielded promising results: reducing ATCo instructions by up to 20%, suggesting a significant reduction in task volumes. Additionally, as indicated by positive feedback from ATCos, it has become evident that speed control instructions can assist with sequencing decisions, and assigning arrival runways can reduce the effort required to maintain spacing between aircraft. This reduction in ATCo’s task volume, especially regarding the metering task, is particularly relevant, as it implies that controllers can manage heterogeneous traffic with fewer resources, potentially improving safety and operational performance. Regarding traffic flow from different directions, no significant differences were observed with or without En Route AMAN (see Figure 14) under the condition that pseudo pilots did not request shortcuts or altitude changes. This is primarily due to the fact that the FLs are divided into odd and even for east and west directions. On the other hand, traffic flows from the same direction but to different destinations overlap in FL, increasing the task volume for altitude processing. This can correspond to the distinct result in Q2/4/9 related to traffic complexity in PRQ, as shown in Figure 10a. However, these conditions were not exacerbated by En Route AMAN splitting traffic into two flows, 34L and 34R; rather, the reduced metering task created more room for altitude processing work, as ATCos commented in Section 5.4. In fact, there was almost no change in the number of instructions other than for the aircraft excluding RJTT arrivals, as shown in Figure 14. Therefore, En Route AMAN can provide speed control and runway assignment for an acceptable amount of task volume.
The second question addresses the mechanisms of delay mitigation through speed control and runway assignment. Based on the reduction in flight duration (see Figure 12), we identified that this delay mitigation is achieved primarily by distributing arrivals across different runways, as illustrated in Figure 11. Runway assignment provides new opportunities to reduce the separation between en route traffic flows that are scheduled to land on the same runway in the baseline flight plan. Currently, a 10-NM in-trail separation is implemented in T25, assuming that all arrivals at T25 are bound for runway 34L. This occurs even though downstream approach controllers may redirect some flights to runway 34R if the option is available. This standard, yet uninformed, operational protocol can lead to extensive vectoring beyond what is required. In contrast, the operation with En Route AMAN enables ATCos to bypass unnecessary 10 NM separation for aircraft arriving at a different runway. This approach is particularly advantageous in situations of high congestion, as removing unnecessary vectoring is more appropriate. Reducing the number of aircraft in the main traffic flow (arrivals from T25 to runway 34L) decreases the need for heading and flight-level instructions (see Figure 13). These findings effectively highlight the potential of En Route AMAN to re-assign arriving flights to runway 34R, facilitating earlier sequencing and spacing of arrival streams for each runway. Consequently, combined speed control plays a crucial role in minimizing longitudinal spacing variations, yielding a synergistic effect. Therefore, en route arrival management through speed control and runway assignment is essential to reduce overall arrival delays.
The primary strength of this study lies in its application of Human-In-The-Loop (HITL) simulations, providing a more grounded and operationally realistic evaluation of the En Route AMAN, particularly in areas where HITL studies remain underrepresented. Although some research has applied HITL in other ATM contexts [21,24,25,26], the global body of HITL studies specific to en route airspace remains limited. This study contributes to that growing field by offering empirical evidence from a less explored area, showcasing the advantages of involving ATCos in dynamic, real-time evaluations.
By deploying HITL, this study was able to assess how ATCos handle dynamic traffic conditions, weather uncertainties, and task overload, providing a more veracious evaluation of the system’s performance. Past studies on AMAN [4,5,6,7,8,9,10,11,12,13,14,15,16] primarily relied on theoretical models or fast-time simulations, which, while useful for understanding broad operational patterns, lacked the real-time input from ATCos necessary to fully capture the complexity of ATM operations. The ability to gather real-time feedback on situational awareness, task management, and decision-making allowed for the identification of operational challenges that were not apparent in earlier models. For example, the impact of runway assignment on upstream speed control under varying wind conditions has been overlooked in previous studies.
In terms of the airspace scope of an AMAN application, the novelty of the study is underscored by its focus on en route airspace, a less explored area compared to arrival-focused research [27,28]. Previous studies have concentrated predominantly on AMANs within extended TMAs and airports, highlighting the need for efficient arrival sequencing and runway assignment to reduce delays and improve performance. The theoretical background of this study [11,12,13,14,15,16] extends these principles to complex en route airspace, demonstrating that similar benefits can be achieved earlier in the flight phase. In particular, the absence of STA constraints allows for greater flexibility in managing dynamic and complex en route airspace scenarios, which can lead to more adaptive and efficient ATC operations, as evidenced by the positive outcomes observed in our HITL simulations.
Although the study presents promising answers to the two key questions, it is plausible that three limitations may have influenced the results obtained. First, HITL simulations were conducted in a controlled environment with a specific focus on the T25 airspace sector. Effective coordination among stakeholders is essential since Jun et al. [5] emphasize the need for improved collaboration among different ANSPs to achieve successful dynamic management. The coordination occurs within the same ANSP in our case, but more research is needed to validate the system’s performance across different and larger airspace, especially T09, T14, and TACA. Further primary limitation is the evaluation of ATCos’ workload based solely on the frequency of verbal instructions and subjective workload assessment. These metrics, while indicative of one dimension of workload, do not fully encapsulate the mental and physical demands placed on ATCos. Future research should incorporate a more comprehensive approach to evaluating ATCos’ mental workload, potentially including measurements of cognitive load, task complexity, and stress levels. Lastly, the study relied on simulations that, despite their realism, cannot fully replicate the complexity of real-world operations such as the HMI, pilot requests, and Voice over Internet Protocol (VoIP) connection with a headset. Future studies should aim to address these limitations by incorporating more realistic HITL simulation with improved HMI and communication tools.

7. Concluding Remarks

We have validated the operational feasibility and the effectiveness of an innovative AMAN for en route airspace, the so-called En Route AMAN, using the ESCAPE Light simulator. Our research aimed to address persistent delays in TMA by controlling the cruising speed and assigning arrival runways in en route airspace without STA calculation. Through the 21-day experiment of HITL simulations in the T25 sector in Fukuoka FIR with rated ATCos, we tested the impact of the system on flight duration and the number of instructions. The results showed that En Route AMAN successfully reduced the average flight duration by up to 25.6 s and decreased the number of ATCo instructions by up to 20%. The findings of this study suggest that En Route AMAN is not only operationally feasible but also effective in mitigating arrival delays. This is a significant step toward the real-world implementation of the En Route AMAN. The use of HITL simulations provides a novel and realistic assessment of the operational feasibility of the En Route AMAN, delivering important information for improving the performance of ATC services and optimizing airspace utilization. In addition, our work demonstrates a more comprehensive design and evaluation process that can be adapted to similar airspace environments, thus offering a practical example of how localized concepts, which closely coordinate with the airport and TMA, can effectively mitigate arrival delays. This study represents a significant milestone toward designing operationally relevant concepts for future ATM. By soliciting human feedback through HITL simulations, we address the previous gap between advancements in theoretical science and practical operations.
By continuing this research, we aim to further refine the En Route AMAN and extend its application as a locally viable solution to address specific challenges in arrival congestion. In line with this, further research is already underway to solve the limitations described in the present study. Following the proposed operational enhancements, we are currently expanding the scope of our research to include additional airspace sectors, such as T09 and T14, with a VoIP connection to further validate the AMAN’s performance across different environments. In addition, we are now in the process of integrating fast-time simulations with tools to assess the efficacy of AMAN in larger airspace sectors, especially TACA. This expansion will help confirm the robustness of the system and refine its algorithms for broader application. Finally, we will develop an HMI tagged with speed control and runway assignment and investigate its impact on the mental workload of ATCos.

Author Contributions

Conceptualization, K.S. and E.I.; methodology, K.S.; software, K.S. and P.B.; validation, K.S., D.I. and E.I.; formal analysis, K.S.; investigation, K.S., D.I. and E.I.; resources, P.B.; data curation, K.S., P.B. and E.I.; writing—original draft preparation, K.S.; writing—review and editing, D.I., P.B., T.T., K.T. and E.I.; visualization, K.S.; supervision, T.T., K.F. and E.I.; project administration, E.I.; funding acquisition, K.S. and E.I. All authors have read and agreed to the published version of the manuscript.

Funding

This research was supported by JSPS KAKENHI Grant Numbers 20H04237, 22KJ2817.

Institutional Review Board Statement

Not applicable.

Informed Consent Statement

Informed consent was obtained from all subjects involved in the study.

Data Availability Statement

Data are contained within the article.

Acknowledgments

This study was partially supported by the Collaborative Actions for Renovation of Air Traffic Systems (CARATS) initiative, facilitated by the Japan Civil Aviation Bureau (JCAB) under the Japanese Ministry of Land, Infrastructure, Transport, and Tourism. The authors extend their gratitude to JCAB for their provision of data and technical support. Our thanks also go to NTT Data for their contributions to data adaptation and the development of AMAN HMI and pre- and post-processing tools. The authors thank the Tokyo Area Control Center for their participation in the Human-In-The-Loop simulation as controllers. Lastly, we thank the members of the Itoh Laboratory at The University of Tokyo for acting as pseudo-pilots during the experiment.

Conflicts of Interest

The funders had no role in the design of the study, in the collection, analyses, or interpretation of data, in the writing of the manuscript, or in the decision to publish the results.

Abbreviations

The following abbreviations are used in this manuscript:
AIPAeronautical Information Publication
AMANArrival MANager
ATCoAir Traffic Controller
ATCAir Traffic Control
ATFMAir Traffic Flow Management
ATISAutomatic Terminal Information Service
ATMAir Traffic Management
BADABase of Aircraft DAta
CARATSCollaborative Actions for Renovation of Air Traffic Systems
CDOContinuous Descend Operation
CSRelated to Flight: Flight Callsign
CWPController Working Position
DMANDeparture MANager
DIRRelated to Flight: Direct To
EIHEUROCONTROL Innovation Hub
E-OCVMEuropean Operational Concept Validation Methodology
ESCAPEEUROCONTROL simulation capabilities and platform for experimentation
ETAEstimated Time of Arrival
FIRFlight Information Region
FLRelated to Flight: Flight Level
FMSFlight Management System
FPFlight Plan
HDGRelated to Flight: Heading
HITLHuman-In-The-Loop
HMIHuman–Machine Interface
IAFInitial Approach Fix
ICAOInternational Civil Aviation Organization
IPInternet Protocol
IPASIntegrated data Preparation and Analysis System
JCABJapan Civil Aviation Bureau
KGKnowledge Graph
LoALetter of Agreement
MSMGPVMeso-Scale Model Grid Point Value
OSOperating System
PBNPerformance-Based Navigation
PCPersonal Computer
PCAPrincipal Component Analysis
PEQPost Exercise Questionnaire
PRQPost Run Questionnaire
PWP or PILPilot Working Position
QHDQuad high definition 2560 × 1440
PTOTPossible Takeoff Time
RJTTTokyo International Airport
SASituational Awareness
SESARSingle European Sky ATM Research
SPDRelated to Flight: Speed
STAScheduled Time of Arrival
SWIMSystem Wide Information Management
TACATokyo Approach Control Area
TMATerminal Maneuvering Area
TSSTerminal Sequencing and Spacing
VMVirtual Machine
VoIPVoice over Internet Protocol
X-MANCross-border Arrival Management

Appendix A. Data Analysis for Simulation Scenario

Appendix A.1. Traffic Flow Analysis

Flight plans (FPs) between 9 December 2019 and 15 December 2019 are analyzed to capture traffic flow characteristics. FPs are provided by the Japan Civil Aviation Bureau (JCAB) for research purposes. FPs include call signs, routing structures, scheduled times of passing waypoint, and cruising altitudes. This study analyzed the routing structures and the number of aircraft per 30 min to create traffic scenarios adopted in the simulation model.
Figure A1 illustrates the layout of T25 sector and the routing configuration and aircraft numbers in T25. T25 sector primarily handles RJTT arrivals from the west and RJTT departures heading west. In this sector, controllers start sequencing RJTT arrivals and ensure and maintain the required spacing for RJTT arrivals through vectoring and speed control before sending them to downstream airspace, specifically the feeding sectors and TACA. As the result of the analysis, Figure A1 marks Peaks(TF) 1 to 3, each of which is a time period where a maximum of 20 aircraft are handled per 30 min. This study reproduces these three peaks as an experimental scenarios. At TF 1, approximately 15 aircraft arriving at RJTT (RJTTarr) pass T25 between 07:00 and 07:30, which is the largest number throughout all time slots. At 14:30 of TF 2, all three types of traffic flow (East-to-West, West-to-East, RJTTarr) are mixed. As for TF 3, the traffic flow to the west (East-to-West) is the largest at 19:00, which implies the highest possibility of interference with the RJTTarr.
Figure A1. Routing configuration and numbers of aircraft entering T25 (red polygon in each left-side subplot) per 30 min counted in T25. RJTTarr (green lines and bars) indicates aircraft arriving at RJTT, and East-to-West (orange lines and bars) and Other West-to-East (blue lines and bars) indicate relevant traffic other than RJTTarr.
Aerospace 11 00866 g0a1

Appendix A.2. Weather Condition Analysis

Wind conditions in the HITL simulations are set based on data from the mesoscale model (MSM) provided by the Japan Meteorological Agency. A total of 8760 instances of meteorological data were analyzed using the MSM grid point value (MSMGPV) [40] from 1 April 2020 to 31 March 2023, which were recorded every 3 h. The grid coordinates refer to the latitude and longitude closest to T25, and the altitudes refer to the pressure altitudes of FL300, 350, 400, 450.
Figure A2 shows the wind conditions at the nearest point of T25. As shown in Figure A2, the result shows the difference in wind speed and direction in different seasons. Especially in summer (June–August) and winter (December–February), the strength of the east–west wind component is significantly different. The strength of this east–west wind component is considered to affect the spacing of aircraft arriving at RJTT (east-bound traffic). Based on the data, the knowledge and experience of the ATCos in charge of T25 who participated in this study, and the opinions of other stakeholders, we identified a need to categorize wind speeds for the experiment. To streamline the experiment design, wind conditions were classified into three levels: “low wind”, “average wind”, and “strong wind”. Simulation tests were then conducted under these three conditions.
Figure A2. Wind conditions in each season at the nearest point of T25.
Aerospace 11 00866 g0a2
To define these three types of wind, dimension reduction using principal component analysis (PCA) are performed. This analysis approach is applied to the data of summer (June–August) and that of winter (December–February), respectively. Figure A3 shows the result of PCA on MSMGPV, including the east–west and north–south components of wind velocity and temperature at pressure altitudes of FL300, 350, 400, and 450. The first principal component represents approximately 66.6% of the variance in the data for summer and 51.1% for winter. This variance is closely related to the magnitude of variance in the average u-direction wind (“uw_ave_kt”) across these altitudes. This indicates that the strength of the east–west wind speed is dominant, even when combining the three types of features at each of the four altitudes. This suggests that the strength of the east–west wind speed is dominant, even when the three types of features at each of the four altitudes are combined. Therefore, we selected “barycenter” of summer and winter data, and “extremum” of winter data for “low wind”, “average wind”, and “strong wind”.
Figure A3. Scatter plot of 1st and 2nd principle component of PCA. “uw_ave_kt” represents the average east–west wind value between FL300 and 450.
Aerospace 11 00866 g0a3
The MSMGPV stores 16 levels of air pressure, of which 11 levels were used: 850 hPa, 800 hPa, 700 hPa, 600 hPa, 500 hPa, 400 hPa, 300 hPa, 250 hPa, 200 hPa, 150 hPa, and 100 hPa. These were converted to FL050, 070, 090, 130, 190, 230, 290, 330, 390, 430, and 450, respectively, and the corresponding wind direction and speed were given as input. Therefore, a constant wind continued to blow in each of these FLs.

References

  1. International Air Transport Association (IATA). Global Outlook for Air Transport; International Air Transport Association (IATA): Montréal, QC, Canada, 2020. [Google Scholar]
  2. EUROCONTROL. Arrival Manager—Implementation Guidelines and Lessons Learned; Edition 0.1; EUROCONTROL: Brussels, Belgium, 2010; p. 14. [Google Scholar]
  3. EUROCONTROL; FAA. Comparison of Air Traffic Management Related Operational and Economic Performance: U.S.—Europe. Available online: https://transport.ec.europa.eu/document/download/31ad10d4-51e3-43cf-8592-edbfb69f7ff0_en?filename=2024-01-US_Europe-comparison-ANS_performance.pdf (accessed on 1 August 2024).
  4. Khassiba, A.; Cafieri, S.; Bastin, F.; Mongeau, M.; Gendron, B. Two-stage stochastic programming models for the extended aircraft arrival management problem with multiple pre-scheduling points. Transp. Res. Part C Emerg. Technol. 2022, 142, 103769. [Google Scholar] [CrossRef]
  5. Zhi Jun, L.; Alam, S.; Dhief, I.; Schultz, M. Towards a greener Extended-Arrival Manager in air traffic control: A heuristic approach for dynamic speed control using machine-learned delay prediction model. J. Air Transp. Manag. 2022, 103, 102250. [Google Scholar] [CrossRef]
  6. Huo, Y.; Delahaye, D.; Sbihi, M. A dynamic control method for extended arrival management using enroute speed adjustment and route change strategy. Transp. Res. Part C Emerg. Technol. 2023, 149, 104064. [Google Scholar] [CrossRef]
  7. Sáez, R.; Polishchuk, T.; Schmidt, C.; Hardell, H.; Smetanová, L.; Polishchuk, V.; Prats, X. Automated sequencing and merging with dynamic aircraft arrival routes and speed management for continuous descent operations. Transp. Res. Part C Emerg. Technol. 2021, 132, 103402. [Google Scholar] [CrossRef]
  8. Kamo, S.; Rosenow, J.; Fricke, H.; Soler, M. Robust optimization integrating aircraft trajectory and sequence under weather forecast uncertainty. Transp. Res. Part C Emerg. Technol. 2023, 152, 104187. [Google Scholar] [CrossRef]
  9. Temme, M.M.; Gluchshenko, O.; Nöhren, L.; Kleinert, M.; Ohneiser, O.; Muth, K.; Ehr, H.; Groß, N.; Temme, A.; Lagasio, M.; et al. Innovative Integration of Severe Weather Forecasts into an Extended Arrival Manager. Aerospace 2023, 10, 210. [Google Scholar] [CrossRef]
  10. Andreatta, G.; Odoni, A.R. Analysis of Market-Based Demand Management Strategies for Airports and en Route Airspace. In Operations Research in Space and Air; Springer US: Boston, MA, USA, 2003; pp. 257–278. [Google Scholar] [CrossRef]
  11. Itoh, E.; Mitici, M. Queue-based Modeling of the Aircraft Arrival Process at a Single Airport. Aerospace 2019, 6, 103. [Google Scholar] [CrossRef]
  12. Itoh, E.; Mitici, M. Evaluating the Impact of New Aircraft Separation Minima on Available Airspace Capacity and Arrival Time Delay. Aeronaut. J. 2020, 124, 447–471. [Google Scholar] [CrossRef]
  13. Itoh, E.; Mitici, M. Analyzing tactical control strategies for aircraft arrivals at an airport using a queuing model. J. Air Transp. Manag. 2020, 89, 101938. [Google Scholar] [CrossRef]
  14. Higasa, K.; Itoh, E. Controlling Aircraft Inter-Arrival Time to Reduce Arrival Traffic Delay via a Queue-Based Integer Programming Approach. Aerospace 2022, 9, 663. [Google Scholar] [CrossRef]
  15. Higasa, K.; Sekine, K.; Itoh, E. Effectiveness of Aircraft Inter-Arrival Control in Upstream Traffic Flow via a Combined Tandem Fluid Queue Model and Integer Programming Approach. IEEE Access 2023, 11, 15252–15270. [Google Scholar] [CrossRef]
  16. Sekine, K.; Kato, F.; Tatsukawa, T.; Fujii, K.; Itoh, E. Rule Design for Interpretable En Route Arrival Management via Runway-Flow and Inter-Aircraft Control. IEEE Access 2023, 11, 75093–75111. [Google Scholar] [CrossRef]
  17. Pang, Y.; Zhao, P.; Hu, J.; Liu, Y. Machine learning-enhanced aircraft landing scheduling under uncertainties. Transp. Res. Part C Emerg. Technol. 2024, 158, 104444. [Google Scholar] [CrossRef]
  18. Gerdes, I.; Schaper, M. Management of time based taxi trajectories coupling departure and surface management systems. In Proceedings of the 11th ATM Seminar, Lisbon, Portugal, 23–26 June 2015. [Google Scholar]
  19. Ali, H.; Delair, R.; Pham, D.T.; Alam, S.; Schultz, M. Dynamic hot spot prediction by learning spatial-temporal utilization of taxiway intersections. In Proceedings of the 2020 International Conference on Artificial Intelligence and Data Analytics for Air Transportation (AIDA-AT), Singapore, 3–4 February 2020; pp. 1–10. [Google Scholar]
  20. Di Mascio, P.; Cervelli, D.; Correra, A.C.; Frasacco, L.; Luciano, E.; Moretti, L. Effects of departure manager and arrival manager systems on airport capacity. J. Airpt. Manag. 2021, 15, 204–218. [Google Scholar] [CrossRef]
  21. Bin Jumad, A.S.; Tominaga, K.; Yi, C.X.; Duong, V.N.; Itoh, E.; Schultz, M. Flow-Centric Air Traffic Control: Human in the Loop Simulation Experiment. In Proceedings of the 2023 IEEE/AIAA 42nd Digital Avionics Systems Conference (DASC), Barcelona, Spain, 1–5 October 2023; pp. 1–8. [Google Scholar] [CrossRef]
  22. EUROCONTROL. European Operational Concept Validation Methodology; Version 3; EUROCONTROL: Brussels, Belgium, 2010; Volume I. [Google Scholar]
  23. Thipphavong, J.; Jung, J.; Swenson, H.N.; Witzberger, K.E.; Martin, L.; Lin, M.I.; Nguyen, J.; Downs, M.B.; Smith, T.A. Evaluation of the controller-managed spacing tools, flight-deck Interval management and terminal area metering capabilities for the ATM Technology Demonstration# 1. In Proceedings of the USA/Europe Air Traffic Management Research and Development Seminar (ATM Seminar), Lisbon, Portugal, 23–26 June 2013. [Google Scholar]
  24. Samardžić, K.; Radišić, T.; Tukarić, I.; Hermann, R.E.H. Novel Artificial Situational Awareness System is Comparable with Human Situational Awareness in the En-route Air Traffic Control Domain. Transp. Res. Procedia 2022, 64, 316–327. [Google Scholar] [CrossRef]
  25. Schrefl, M.; Neumayr, B.; Gruber, S.; Hartmann, M.; Tukarić, I.; Radišić, T. Creating an ATC knowledge graph in support of the artificial situational awareness system. Transp. Res. Procedia 2022, 64, 328–336. [Google Scholar] [CrossRef]
  26. Ahrenhold, N.; Gerdes, I.; Mühlhausen, T.; Temme, A. Validating Dynamic Sectorization for Air Traffic Control Due to Climate Sensitive Areas: Designing Effective Air Traffic Control Strategies. Aerospace 2023, 10, 405. [Google Scholar] [CrossRef]
  27. Robinson, J.E.; Thipphavong, J.; Johnson, W.C. Enabling performance-based navigation arrivals: Development and simulation testing of the terminal sequencing and spacing system. Air Traffic Control Q. 2015, 23, 5–27. [Google Scholar] [CrossRef]
  28. Ahrenhold, N.; Stasicka, I.; Abdellaoui, R.; Mühlhausen, T.; Temme, M.M. Enabling green approaches by FMS-AMAN coordination. Aerospace 2023, 10, 278. [Google Scholar] [CrossRef]
  29. Itoh, E.; Miyazawa, Y.; Finke, M.; Rataj, J. Macroscopic Analysis to Identify Stage boundaries in Multi-stage Arrival Management. In Air Traffic Management and Systems IV; Springer: Berlin/Heidelberg, Germany, 2021; pp. 59–76. [Google Scholar]
  30. Sekine, K.; Kato, F.; Kageyama, K.; Itoh, E. Data-driven simulation for evaluating the impact of lower arrival aircraft separation on available airspace and runway capacity at Tokyo International Airport. Aerospace 2021, 8, 165. [Google Scholar] [CrossRef]
  31. Arbuckle, D. Interval management application. In Proceedings of the ICAO Aircraft Surveillance Applications Workshop, Ulaanbaatar, Mongolia, 12–15 June 2017. [Google Scholar]
  32. EUROCONTROL. New Version of Escape ATC Simulator Will Facilitate Academic Research Worldwide. Available online: https://www.eurocontrol.int/news/new-version-escape-atc-simulator-will-facilitate-academic-research-worldwide (accessed on 5 August 2023).
  33. EUROCONTROL. EUROCONTROL Simulation Capabilities and Platform for Experimentation. Available online: https://www.eurocontrol.int/simulator/escape (accessed on 5 August 2023).
  34. Bouchal, A.; Had, P.; Bouchaudon, P. The Design and Implementation of Upgraded ESCAPE Light ATC Simulator Platform at the CTU in Prague. In Proceedings of the 2022 New Trends in Civil Aviation (NTCA), Prague, Czech Republic, 26–27 October 2022; pp. 103–108. [Google Scholar]
  35. Guleria, Y.; Tran, P.; Pham, D.T.; Alam, S.; Durand, N. A machine learning framework for predicting atc conflict resolution strategies for conformal automation. In Proceedings of the 11th SESAR Innovation Days, Virtual, 7–9 December 2021. [Google Scholar]
  36. EUROCONTROL. User Manual for the Base of Aircraft Data (BADA) Revision 3.15. In EEC Technical/Scientific Report No. 19/03/18-45; EUROCONTROL: Brussels, Belgium, 2019. [Google Scholar]
  37. ACA. ICAO Standard Phraseology. A Quick Reference Guide for Commercial Air Transport Pilots; Safety Initiative; EUROCONTROL: Brussels, Belgium, 2011. [Google Scholar]
  38. Antolović, D. ATC Simulator Deployment Concept at the Department of Air Transport. Master’s Thesis, Czech Technical University, Faculty of Transportation Sciences, Prague, Czech Republic, 2021. [Google Scholar]
  39. Japan Aeronautical Information Service Center. Aeronautical Information Publication (AIP). Available online: https://aisjapan.mlit.go.jp/ (accessed on 24 February 2022).
  40. Research Institute for Sustainable Humanosphere, Kyoto University. Meso-Scale Model Grid Point Value (MSMGPV). Available online: http://database.rish.kyoto-u.ac.jp/index-e.html (accessed on 22 February 2020).
  41. Baxley, B.T.; Swieringa, K.A.; Wilson, S.R.; Roper, R.D.; Abbott, T.S.; Hubbs, C.E.; Goess, P.; Shay, R.F. Air Traffic Management Technology Demostration-1 (ATD-1) Avionics Phase 2 Flight Test and Results. In NASA/TP–2018-219814; NASA: Washington, DC, USA, 2018. [Google Scholar]
  42. DSNA. XMAN: A Concept Taking Advantage of ATFCM Cross-Border Exchanges. In Proceedings of the Fifteenth Meeting of the Civil Aviation Authorities of the SAM Region (RAAC/15), Asuncion, Paraguay, 4–6 December 2017. Available online: https://www.icao.int/NACC/Documents/Meetings/2017/NACCDCA7/NACCDCA7WP20.pdf (accessed on 1 August 2024).
  43. Japan Civil Aviation Bureau (JCAB). Overview of Air Safety Operations (Written in Japanese). Available online: https://www.mlit.go.jp/koku/content/001743241.pdf (accessed on 15 August 2024).
Figure 1. Schematic diagram of multi-stage arrival management. STAGE 4 (Air Traffic Flow Management) effectively manages the uncertainties introduced by pop-up aircraft joining the traffic flow from nearby airports or departure points. STAGE 3 (En Route Arrival Management) maintains a continuous flow of traffic using statistical information to minimize corrective actions due to uncertainties in longer-distance flights while coordinating with Departure Manager (DMAN) to ensure that runway assignments are harmonized with the departure traffic flow. STAGE 2 (Metering Operation) optimizes the aircraft sequence to enable continuous descent approaches, focusing on environmental efficiency and safety. STAGE 1 (Final Approach Area) tightly sequences aircraft on the centerline with minimal buffers while ensuring minimum wake turbulence separation.
Aerospace 11 00866 g001
Figure 2. Overview of the norh wind operations at RJTT.
Aerospace 11 00866 g002
Figure 3. Radar tracks for one day in December 2019 are displayed in four different colors based on the direction toward RJTT during a northerly wind operation. Tokyo Approach Control Area (TACA) is outlined by a black polygon, featuring six entry fixes marked with black dots. A brown dotted concentric circle, with a radius of 120 NM, is centered on RJTT, and another with a radius of 180 NM is centered on waypoint XAC, corresponding to En Route AMAN horizon. This is because the point at which flights from the north and south have approximately equal flight duration is located around this area, necessitating the difference in radii. The cruise speed control and runway assignment decisions are executed within the en route sector, represented by a red polygon and a green polygon.
Aerospace 11 00866 g003
Figure 4. ESCAPE Light implementation.
Aerospace 11 00866 g004
Figure 5. Snapshot of radar screen interface with T25 sector in Fukuoka FIR for controller working position 1 (CWP01) in ESCAPE Light simulator. The call sign is kept secret because the actual regularly scheduled flights are used in the experiment. When using AMAN, the HMI in the lower right part is visualized.
Aerospace 11 00866 g005
Figure 6. Snapshot of radar screen interface with feeding sector of T25 in Fukuoka FIR for controller working position 2 (CWP01) in ESCAPE Light simulator. The call sign is kept secret because the actual regularly scheduled flights are used in the experiment.
Aerospace 11 00866 g006
Figure 7. Snapshot of user interface for pilot working position (PIL01) in ESCAPE Light simulator.
Aerospace 11 00866 g007
Figure 9. Condition of controller instructions illustrated using snapshot of radar screen of CWP01 in ESCAPE Light simulator. The call sign is kept secret because the actual regularly scheduled flights are used in the experiment.
Aerospace 11 00866 g009
Figure 10. Radar chart of Post Run Questionnaire (PRQ) and Post Exercise Questionnaire (PEQ). (a) Radar chart of Post Run Questionnaire (PRQ). The average values are summarized according to TF1 to TF3, which are the three types of traffic scenarios (see Figure A1). (b) Radar chart of Post Exercise Questionnaire (PEQ). The values are separated by each test subject.
Aerospace 11 00866 g010
Figure 11. Bar chart of the average flight duration differences in T25 under various control strategies: Nominal (NOM), Speed Control (SPD), and Runway Assignment (RWY). Each subplot corresponds to a different scenario characterized by the combination of test subjects (S1, S2), traffic type (T1, T2, T3), and wind conditions (W1, W2, W3) as summarized in Table 2. “ Δ ” means the difference in which, for instance, Δ S1_T1_W1 indicates that the values are calculated by subtracting the value in N#S1_T1_W1 (Trial1) from A#S1_T1_W1 (Trial18). The y-axis represents the flight duration difference in seconds (s), with negative values indicating shorter flight duration using En Route AMAN.
Aerospace 11 00866 g011
Figure 12. This figure shows the flight duration in T25 across different scenarios, comparing trials without and with the implementation of the AMAN. The scenarios are differentiated by test subjects (S1, S2), traffic types (T1, T2, T3), and wind conditions (W1, W2, W3) following Table 2, as indicated on the y-axis. Red bars represent the average flight duration without AMAN, while blue bars represent the average flight duration with AMAN. For instance, red bar of S1_T1_W1 is N#S1_T1_W1 (Trial1) and blue bar of S1_T1_W1 is A#S1_T1_W1 (Trial18). The x-axis shows the flight duration in seconds (s). Error bars indicate the standard deviation for each trial, reflecting the variability in flight duration within each scenario.
Aerospace 11 00866 g012
Figure 13. Bar chart of the number of ATC instructions issued in different scenarios, without and with the implementation of the AMAN. The scenarios are categorized by test subjects (S1, S2), traffic types (T1, T2, T3), and wind conditions (W1, W2, W3) following Table 2, as shown on the top of each subplot. The x-axis represents different types of ATC instructions: “Direct To” (DIR) instructions, “Flight level” (FL) changes, “Heading” (HDG) adjustments, and “Speed” (SPD) adjustments. Red bars represent the average flight duration without AMAN, while blue bars represent the average flight duration with AMAN. For instance, red bar of S1_T1_W1 is N#S1_T1_W1 (Trial1) and blue bar of S1_T1_W1 is A#S1_T1_W1 (Trial18).
Aerospace 11 00866 g013
Figure 14. Bar chart of the total number of ATC instructions issued in different scenarios, with or without the implementation of the AMAN. The scenarios are differentiated by test subjects (S1, S2), traffic types (T1, T2, T3), and wind conditions (W1, W2, W3) following Table 2, as indicated on the x-axis. The x-axis represents the total number of ATC instructions. Each subplot corresponds to a different traffic characterized by the destination as shown in Figure A1: “East-to-West bound traffic” (E2W), “RJTT Arrivals” (RJTTarr), “Other W2E bound traffic” (Other W2E). Red bars represent the average flight duration without AMAN, while blue bars represent the average flight duration with AMAN. For instance, red bar of S1_T2_W1 is N#S1_T2_W1 (Trial7) and blue bar of S1_T2_W1 is A#S1_T2_W1 (Trial24).
Aerospace 11 00866 g014
Figure 15. New Human–Machine Interface (HMI) for En Route AMAN.
Aerospace 11 00866 g015
Table 1. Example of daily schedule for a ATCo.
DayTimeActivity
Day 011:00–12:00Briefings and Training Session prior to the actual experiment day
Day 1–911:00–11:30Simulation run 1 (without En Route AMAN)
Day 1–911:30–12:00Simulation run 2 (with En Route AMAN)
Day 1–912:00–12:15Debriefing and ATCos feedback session for a scenario including Post-Run Questionnaire (PRQ)
Day 912:15–12:30Debriefing and ATCos feedback session for total exercises including Post-Exercise Questionnaire (PEQ) on the final experiment day only
Table 2. Trial list of HITL simulations.
Trial NumberTrial ID 1AMAN SupportSubjectTraffic CaseWeather ConditionNRWY 2NSPD 3
1N#S1_T1_W1No (N)Subject 1TF 1W1 (Light)
2N#S1_T1_W2NSubject 1TF 1W2 (Average)
3N#S1_T1_W3NSubject 1TF 1W3 (Strong)
4N#S2_T1_W1NSubject 2TF 1W1 (Light)
5N#S2_T1_W2NSubject 2TF 1W2 (Average)
6N#S2_T1_W3NSubject 2TF 1W3 (Strong)
7N#S1_T2_W1NSubject 1TF 2W1
8N#S1_T2_W3NSubject 1TF 2W3
9N#S2_T2_W1NSubject 2TF 2W1
10N#S2_T2_W2NSubject 2TF 2W2
11N#S2_T2_W3NSubject 2TF 2W3
12N#S1_T3_W1NSubject 1TF 3W1
13N#S1_T3_W2NSubject 1TF 3W2
14N#S1_T3_W3NSubject 1TF 3W3
15N#S2_T3_W1NSubject 2TF 3W1
16N#S2_T3_W2NSubject 2TF 3W2
17N#S2_T3_W3NSubject 2TF 3W3
18A#S1_T1_W1Yes (Y)Subject 1TF 1W137
19A#S1_T1_W2YSubject 1TF 1W237
20A#S1_T1_W3YSubject 1TF 1W337
21A#S2_T1_W1YSubject 2TF 1W137
22A#S2_T1_W2YSubject 2TF 1W237
23A#S2_T1_W3YSubject 2TF 1W337
24A#S1_T2_W1YSubject 1TF 2W125
25A#S1_T2_W3YSubject 1TF 2W324
26A#S2_T2_W1YSubject 2TF 2W125
27A#S2_T2_W2YSubject 2TF 2W225
28A#S2_T2_W3YSubject 2TF 2W324
29A#S1_T3_W1YSubject 1TF 3W125
30A#S1_T3_W2YSubject 1TF 3W214
31A#S1_T3_W3YSubject 1TF 3W313
32A#S2_T3_W1YSubject 2TF 3W125
33A#S2_T3_W2YSubject 2TF 3W214
34A#S2_T3_W3YSubject 2TF 3W313
1 Nomenclature for Trial ID: The Trial ID follows the format N#S1_T1_W1, where N indicates that AMAN was not used (or A if it was used). # is a separator, S1 refers to Subject 1 (the first participant), T1 represents Traffic case 1 (the first traffic flow scenario, TF1), and W1 denotes Weather condition 1. 2  N R W Y : This column indicates the number of aircraft for which runway assignment instructions were altered by En Route AMAN. 3 N S P D : This column indicates the number of aircraft for which speed control instructions were issued by En Route AMAN.
Table 3. Questions PQR (Q1 to Q10) and PEQ (Q11 to Q17).
IDQuestion
Q1I felt comfortable during the overall run.
Q2I was able to plan and organize my work according to my preferences.
Q3I was able to predict the traffic evolution depending on the traffic situation and speed control/runway assignment.
Q4I had the feeling of focusing too much on a single problem or a specific area during my work.
Q5I have the feeling that I focused too much on a single issue due to the change in speed and runway.
Q6I was provided with all the information I needed to understand the traffic situation/implications of speed control/highway assignment.
Q7The received information was timely and complete.
Q8On average, I would rate my situational awareness as…
Q9Considering the whole of the accomplished tasks, the time pressure experienced during this run was:
Q10The overall task volume in terms of attention, skill, or effort I experienced during this run was:
Q11In general, I felt comfortable in managing en route aircraft in the En Route AMAN environment.
Q12Applying En Route AMAN will not negatively affect job satisfaction levels for ATCos.
Q13The applied concept for En Route AMAN will allow a sufficient level of safety.
Q14The applied concept for En Route AMAN will allow a satisfactory personal situational awareness.
Q15The introduction of En Route AMAN does not imply additional effort or abilities.
Q16Do you see any unexpected or unwanted effects regarding the controlling speed and assigning runway for managing en route traffic?
Q17Do you see any need for change in training or human resource management to allow the application of the En Route AMAN concept en route?
Table 4. The Likert scale for the questions. The numbers 1 to 5 indicate the assigned numeric values.
Questions12345
Q1–Q7 and Q11–Q17strongly disagreedisagreeneither agree nor disagreeagreestrongly agree
Q8very badpoorfairgoodexcellent
Q9–Q10completely demandingdemandingneither demanding nor undemandingundemandingcompletely undemanding
Disclaimer/Publisher’s Note: The statements, opinions and data contained in all publications are solely those of the individual author(s) and contributor(s) and not of MDPI and/or the editor(s). MDPI and/or the editor(s) disclaim responsibility for any injury to people or property resulting from any ideas, methods, instructions or products referred to in the content.

