Abstract
The self-circulating casing treatment can effectively expand the stable working range of the compressor, with little impact on its efficiency. With a single-stage transonic axial flow compressor NASA (National Aeronautics and Space Administration) Stage 35 as the research object, a multi-channel unsteady numerical calculation method was used here to design three types of self-circulating casing treatment structures: 20% Ca (axial chord length of the rotor blade tip), 60% Ca, and 178% Ca (at this time, the bleed position is at the stator channel casing) from the leading edge of the blade tip. The effects of these three bleed positions on the self-circulating stability expansion effect and compressor performance were studied separately. The calculation results indicate that the further the bleed position is from the leading edge of the blade tip, the weaker the expansion ability of the self-circulating casing treatment, and the greater the negative impact on the peak efficiency and design point efficiency of the compressor. This is because the air inlet of the self-circulating casing with an air intake position of 20% Ca is located directly above the core area of the rotor blade top blockage, which can more effectively extract low-energy fluid from the blockage area. Compared to the other two bleed positions, it has the greatest inhibitory effect on the leakage vortex in the rotor blade tip gap and has the strongest ability to improve the blockage at the rotor blade tip. Therefore, 20% Ca from the leading edge of the blade tip has the strongest stability expansion ability, achieving a stall margin improvement of 11.28%.
1. Introduction
For compressors with good aerodynamic performance and a high ratio of stage loading to stage pressure, it is difficult to maintain a stable operating condition, and problems with flow instability may occur. Rotary stall and surge are two typical unstable flow phenomena in a compressor under off design conditions [1]. Therefore, a valuable topic in flow control research is how to delay the compressor rotating stall and surge and ensure the stable operation of the compressor. In terms of improving compressor stability and delaying compressor stall, there are mainly two kinds of control methods, namely active methods and passive ones. Casing treatment is one of the passive control methods, including slot casing treatment, slit casing treatment, and self-circulating casing treatment. Compared to the first two forms, self-circulating casing treatment achieves a larger increase in the stabilized operating margin of the compressor while having a smaller negative impact on the compressor efficiency. That is to say, it can take into account the performance of the compressor while effectively expanding the stability, which is the main reason why it has been widely studied worldwide.
Weichert et al. [2] conducted experiments on a 1.5-stage low-speed compressor to investigate the effects of design parameters such as structure, position, angle of suction, and injection ports, as well as the number of recirculation loops, on the processing stabilization capability of the self-circulating silo. A structure that worked well was identified, which achieved a 2.2–6.0% increase in the stability margin. The study also showed that different stall types would affect the stabilization effect of the self-circulating casing treatment. Kumar et al. [3] investigated the differences in the effectiveness of self-circulating casing treatments for stabilization expansion at different injection yaw angles (±30°, ±47°, and +53°). They found that the stabilization mechanism of self-circulating casing treatment is the excitation effect of high-speed injection on the low-energy fluid in the blade top region. The treatment of self-circulating casings with different injection yaw angles can improve the stall margin. When the injection yaw angle is +47°, the best stabilization effect is achieved, with a 9.6% increase in the stall margin and a 0.83% increase in efficiency. Bu Yuanyuan et al. [4] compared the Krain high-pressure ratio centrifugal impellers in two cases, applying a self-circulating upstream tank-enclosed casing and a self-circulating casing treatment structure. The results showed that self-circulating casing treatment is effective in delaying the onset of a stall and slightly increasing the efficiency of the compressor, as well as the overall pressure ratio in the near-stall region.
Haoguang Zhang [5,6,7,8,9,10] conducted a series of studies on different axial flow compressor rotors from 2009 to 2021. The results showed that self-circulating casing has a good stabilization effect on different compressors. It provides additional energy to the low-energy zone at the top of the blade, effectively inhibits the occurrence of the overflow phenomenon at the leading edge of the top of the blade, reduces the degree of blade top channel blockage, and increases the channel’s flow capacity. The study also indicated that there is the potential to improve both the rotor performance and stability by optimizing key geometric parameters of the self-circulating casing.
Li Jichao et al. [11] carried out an experimental study of self-circulating casing treatment with different bleed methods on a low-speed single-stage axial flow compressor and clarified that self-circulating casing treatment is to improve the compressor stall margin by changing the gap leakage vortex trajectory. Li Jichao et al. [12] also investigated the effects of different draft angles and injection yaw angles on the stabilizing effect of self-circulating casing treatment on a transonic axial flow compressor. Their results showed that an appropriate bleed angle and injection yaw angle can effectively improve the stall margin and increase the peak efficiency of the compressor. Yansong [13,14] conducted numerical simulations on Rotor 37 to investigate how different bleed positions, as well as nozzle throat heights, affect the stabilizing effect of self-circulating casing treatment. The following conclusion was obtained: self-circulating casing treatment achieves a better stabilizing effect with the bleed position in the rotor blockage region compared to that behind the rotor. In addition, Yansong [15] studied the influence of the bleed position on the stabilization effect of self-circulating casing treatment using the rotor of a subsonic compressor. The results showed that the best dilatation stabilization effect is achieved when the bleed position is in the core of the low-velocity zone at the top of the rotor blade, and the flow margin obtained is as high as 22.77%.
Guo Yanchao [16] studied the stabilizing mechanism of self-circulating casing treatment and the influence of the axial injection position on its stabilizing ability in a counter-rotating compressor and found that the axial injection position should not be too close to the leading edge of the blade, and the stall margin increases by 7.73% when the injection position is 40% of the axial chord length from the leading edge of the blade. It was also analyzed that the first stall level of the counter-rotating compressor can be changed by self-circulating casing treatment, but the type of stall initiation is not changed.
Wang Wei [17,18] conducted a parametric study on the axial flow compressor blade top injection and self-circulating casing treatment by a combination of numerical simulation and experimental research and summarized the design law of the influence of different design parameters on the self-circulating expansion and stabilization performance. Subsequently, Wang Wei [19] designed a coupled casing treatment structure in order to improve the stall margin of a highly loaded two-stage axial flow compressor. The structure draws low-energy fluid from the top of the rotor blade of the first stage into the inlet guide vane channel, which greatly improves the flow conditions at the top of the rotor blade and expands the stabilized operating range of the compressor and also increases the design point efficiency.
Zhong Yiming [20] conducted unsteady numerical simulations on Rotor 35 to investigate the effects of three different circumferential bias angles of self-circulating casing treatment on the performance and stability of a compressor. The results showed that self-circulating casing treatment with a circumferential bias angle of 15° leads to the largest amount of flow margin improvement but results in a decrease in the overall pressure ratio. Differences in the nonstationarity of different self-circulating casing treatments coupled with the flow field at the top of the blade result in different stabilization effects.
Most of the previous studies on self-circulating casing treatment are focused on the compressor rotor, and few of them are carried out on a single-stage transonic axial compressor. In addition, most of them are experimental studies or steady numerical simulations, which are mainly concerned with the effect of self-circulating casing treatment on the performance and stability of a single-stage transonic axial compressor, with little attention paid to the effect of casing treatment on rotor/stator matching and flow inside the static subchannel. It is then worth exploring how self-circulating casing treatment with different geometrical parameters affects rotor/stator matching and the flow field inside the stator. In addition, for the geometric design parameters of the self-circulating casing treatment, most of the previous studies on the self-circulating casing treatment on single-stage transonic axial flow compressors focused on the bleed angle and injection yaw angle, while there have been few parametric studies on the key geometric parameter of the bleed position.
In this regard, a single-stage transonic axial compressor NASA Stage 35 was used here for parametric research on the geometric parameter of the bleed position of self-circulating casing treatment by a multi-channel unsteady numerical computation method, with a view toward addressing the deficiencies of existing studies on self-circulating casing treatment. It is also to clarify the influence of bleed position on the performance and stability of the compressor and the internal flow of the rotor channel, as well as rotor/static matching and internal flow of the static channel, and to reveal the intrinsic mechanism by which this geometrical parameter affects the stabilizing effect of self-circulating casing treatment.
2. Research Objects and Numerical Methods
2.1. Research Objects
NASA Stage 35, the inlet stage of a low-spreading ratio transonic compressor designed by the NASA Lewis Research Center, was selected here. Its design parameters and performance test data are available in the literature [21].
Figure 1 provides a schematic of the meridional flow path for Stage 35, and the data measurement locations are Stations 1, 2, and 3. In the experiment, parameters such as static pressure, total pressure, and total temperature are measured at Station 1 and Station 3. Figure 2 shows the geometric model of Stage 35. Table 1 lists the major design parameters of Stage 35.
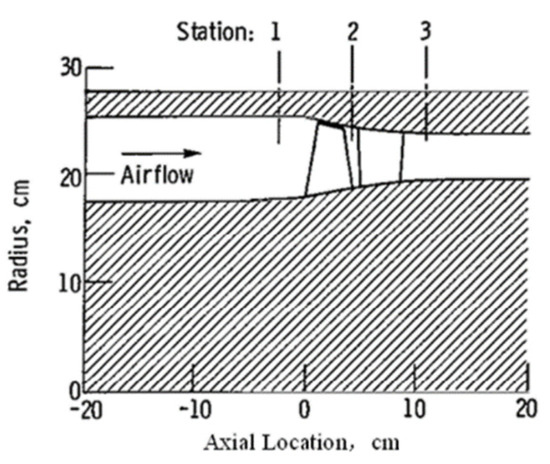
Figure 1.
Stage 35 meridian runner diagram.
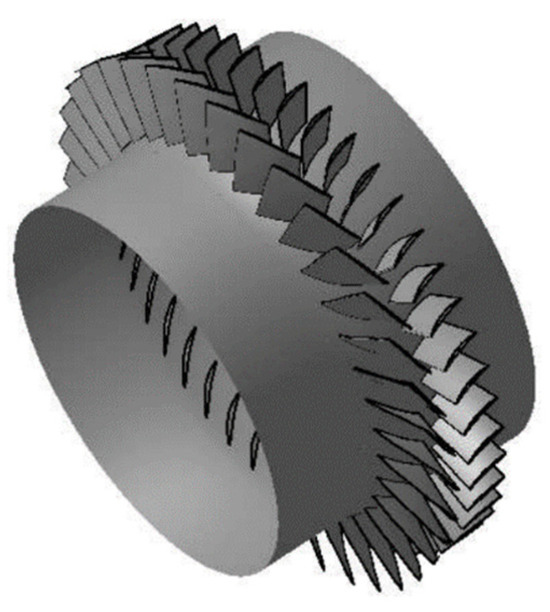
Figure 2.
Stage 35 geometry model.

Table 1.
NASA Stage 35 key design parameters.
2.2. Numerical Method
The IGG/Autogrid5 module of NUMECA 16.1 software was used for meshing, as shown in Figure 3a. The computational domain mesh is divided into inlet extension, rotor blade channel, static sub-bladed channel, and outlet extension along the airflow direction, where the inlet and outlet extensions adopt the H-shaped mesh topology, while the rotor and static subchannels use the HOH-type mesh topology, and the tip gap uses the butterfly mesh topology, as shown in Figure 3b.
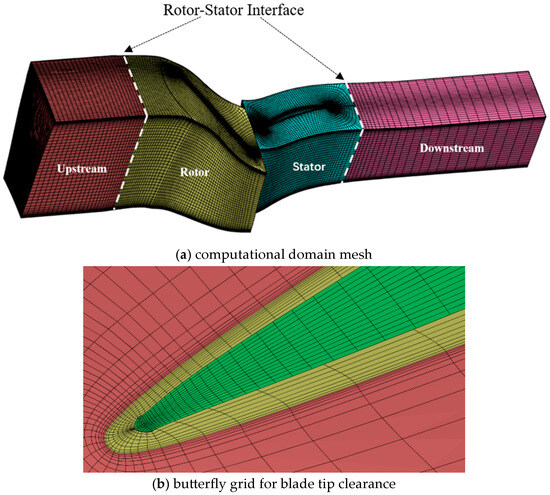
Figure 3.
Schematic of a single-channel grid.
In this article, the number of selected grids is 1.27 million, and the specific distribution of the grid nodes is shown in Table 2. The thickness of the first layer of the grid close to the wall is 5 × 10⁻⁶ m, the Y+ value of the grid is less than 2, the minimum orthogonal angle of the grid is about 15°, the maximum aspect ratio is less than 750, and the maximum expansion ratio is less than 3.5. The quality of the grid meets the requirements of the calculations.

Table 2.
Grid node distribution.
Numerical calculations were performed using the EURANUS (Brussels, Belgium) solver of NUMECA 16.1/FineTurbo [22]. A suitable turbulence model is selected to numerically simulate the full 3D unsteady flow field by solving the full 3D Reynolds time-averaged Navier–Stokes equations. The spatial discretization of the control equations in the relative coordinate system is accomplished using the Symmetric TVD scheme in the second-order windward format. When selecting the oscillatory restricted-type selection for numerical solutions in linear and nonlinear domains, we choose the min–mod format. The time discretization of the control equations is done by the fourth-order display Runge–Kutta method.
We use local time stepping as the time advancement method for steady calculations, and the data transfer method used for the trans-static interface is the full non-matching mixing plane. Unsteady computation is then changed to the dual time stepping advancement method, and domain scaling is used for the trans-static interface. Set the physical time step for the rotor to turn one blade pitch to 20, and the virtual time step is 20.
The inlet boundary condition is set as the axial inlet, given the absolute total temperature and absolute total pressure of 288.2 K and 101,325 Pa. Boundaries on both sides of the mesh are set to periodic boundaries, and all solid-wall surfaces satisfy the adiabatic, no-slip boundary conditions.
Obtain the entire performance curve of the compressor by increasing the average static pressure at the outlet during calculation. The calculation is considered to converge when the inlet and outlet flow rates and performance parameters such as the total pressure ratio and efficiency remain steady or vary periodically, and the dichotomy method is used to capture the near-stall point. The previous condition for the numerical calculation of dispersion is the near-stall condition, and the back pressure difference between the near-stall condition and the dispersion condition is guaranteed to be 100 Pa.
2.3. Numerical Method Validation
According to the previous research experience of our group [23,24], the numerical calculation results no longer vary with the grid number in the case that the grid number of a single channel is greater than 700,000. Since the number of grids used this time is 1.27 million, the grid independence verification is no longer performed.
Considering the influence of turbulence models on the numerical simulation results, the Spalart–Allmaras turbulence model (hereinafter referred to as SA), the k-epsilon (low Re Yang-Shih variant) (hereinafter referred to as KE) turbulence model, and the shear stress transport variant of the k-ω turbulence model (hereinafter referred to as SST) are selected for validation in this paper.
Figure 4 shows the total performance curves in terms of pressure ratio and isentropic efficiency obtained by selecting different turbulence models for the steady-state computation in comparison with the experimental values. It can be seen that, for the blocking mass flow rate, the calculation results of different turbulence models are basically the same, but they are all slightly smaller than the experimental value; for the near-stall mass flow rate, the near-stall mass flow rate obtained by the SST turbulence model is much larger than the experimental value, which cannot predict compressor performance under low mass flow conditions. The near-stall mass flow rate obtained by the SA turbulence model and the KE turbulence model is similar, which is all larger than the experimental value. For the total pressure ratio curves, the calculated values of the total pressure ratios of the three turbulence models are smaller than the experimental values, and the SA turbulence model curves are more closely matched with the experimental curves. For the isentropic efficiency curves, the isentropic efficiency characteristics of the three turbulence models are very close to each other, and the calculated values of isentropic efficiency for the flow conditions after the peak efficiency point are all larger than the experimental values; the calculated peak efficiencies of the three turbulence models are slightly larger than the experimental values, and the flow rate at the peak efficiency point is slightly smaller than the experimental values.
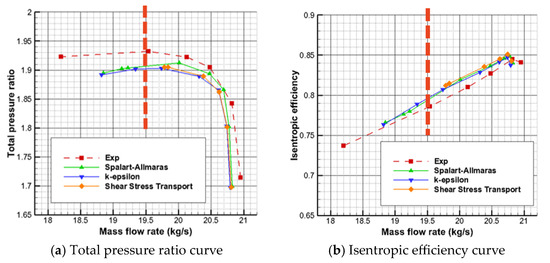
Figure 4.
Total performance curves for different turbulence models.
In order to further evaluate the advantages and disadvantages of the SA turbulence model and the KE turbulence model, Figure 5 presents a comparison of the performance of the primitives computed by the two turbulence models with respect to the experimental values at a dimensionless flow rate of 0.933. The dimensionless flow rate is defined as the ratio of the compressor mass flow rate to the blockage mass flow rate. The dimensionless blockage flow rate of 0.933 corresponds to a compressor mass flow rate of 19.5 kg/s. In Figure 4 and Figure 6, I use a red curve to represent the position corresponding to this operating condition. Figure 5a shows the total pressure ratio/total pressure recovery coefficient raw performance of the rotor and stator, and Figure 5b shows the absolute total temperature ratio raw performance of the rotor. From Figure 5a, it can be seen that the trends of the calculated and experimental values of the two turbulence models along the variations in blade height are basically the same, and the total static sub-pressure ratio curves of the two are in good agreement with the experimental values. The calculated values of the rotor total pressure ratio are more consistent at low blade heights and are less than the experimental values above a 0.5 blade height, while the calculated values of the SA turbulence model are more consistent with the experimental values. As can be seen in Figure 5b, the calculated values of the two turbulence models agree with the experimental values at a 0.3 blade height, the calculated values of the KE model are closer to the experimental values at a 0.95 blade height, and the SA turbulence model is closer to the experimental values at other blade heights. Combining the total and primitive properties, the SA turbulence model will be selected for subsequent calculations as follows.
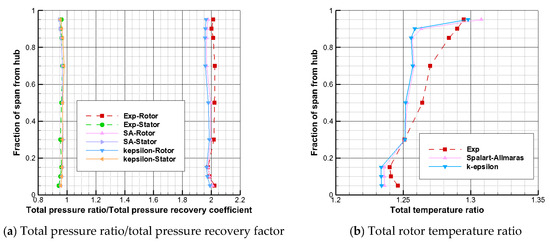
Figure 5.
Performance of different turbulence model primitives.
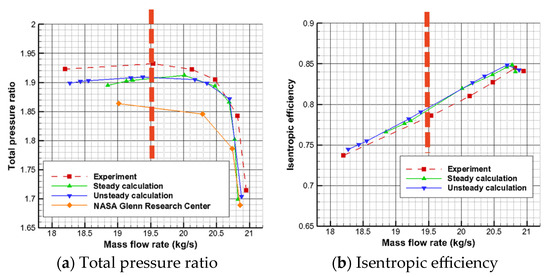
Figure 6.
Total performance curves for the unsteady calculations [24].
Based on the single-channel 1.27 million grid number and the SA turbulence model, multi-channel unsteady numerical simulations were continued to further confirm the accuracy of the numerical simulations. As the number of Stage 35 rotor and static sub-blades are not equal, the full-channel unsteady-state numerical simulation is too demanding on the computer hardware, and the computation time is too long, so this paper adopts the method of approximating the number of blades. The number of stator blades is changed from 46 to 45, and the ratio of rotor to static channels in the approximated multi-channel calculation is 4:5, which effectively reduces the amount of calculation. The total number of grids for the multi-channel compressor numerical model is 5.41 million. The multi-channel numerical calculation setup is consistent with the single-channel numerical calculation setup.
Figure 6 shows the total performance curves for the numerical simulation and experimental measurements. From the figure, it can be seen that, for the blocking mass flow rate, both the unsteady and steady value calculations are slightly smaller than the experimental value, and the unsteady calculated value is closer to the experimental value. For the near-stall mass flow rate, the results of the steady calculations are larger than the experimental values, and the results of the unsteady calculations are very close to the experimental values. In Figure 6a, the general trend of numerical simulation results and experimental values is basically the same, but the total pressure ratio calculated for most of the conditions is smaller than the experimental value, and the unsteady calculations are closer to the experimental value in most of the flow conditions. In Figure 6b, the calculated values of the numerical simulation are overall greater than the experimental values. Taken together, the results of the unsteady calculations are closer to the experimental values than the steady calculations in their prediction of the near-stall mass flow rate and simulation of the trend of the characteristic line. In addition, Figure 6a also provides the numerical calculation about the 35th stage in the literature [25] (the efficiency characteristic graph is not given in this literature), and the comparison shows that the calculations obtained by the unsteady numerical method adopted in this paper are closer to the experimental values, and the calculation accuracy is higher.
Figure 7 presents the performance of the primitives obtained from numerical simulations and experimental measurements at a 0.933 dimensionless flow rate. Figure 7a shows that the results of the numerical simulation are generally in good agreement with the experimental values. For the static total pressure ratio, the results of the unsteady calculations are closer to the experimental values up to a 0.7 blade height, and the results of the steady calculations are closer to the experimental values above a 0.7 blade height. For the total rotor pressure ratio, the results of the steady and unsteady calculations below a 0.5 blade height do not differ much and fit well with the experimental values, while the results of the unsteady calculations from a 0.5 blade height to a 0.7 blade height are more in line with the experimental values, and the results of the steady calculations from a 0.7 blade height and upwards are more in line with the experimental values. Figure 7b shows that, for the total rotor temperature ratio, the results of the unsteady calculations are closer to the experimental values throughout the blade height. Taken together, the total and primitive performance results obtained from the unsteady calculations are closer to the experimental values compared to those obtained from the steady calculations.
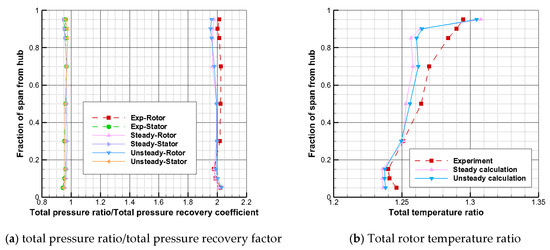
Figure 7.
Comparison of the numerical simulation and experimentally measured primitive performance.
In conclusion, the total and raw performance results from the unsteady calculations are closer to the experimental values than the steady calculations.
The above analysis shows that there are some differences between the numerical calculation results and the experimental values, and the differences may be due to the existence of various errors in the experimental measurements, the difference between the geometric model of the compressor used in the numerical calculations and the real compressor, the lack of accuracy of the turbulence model selected for numerical calculations, and so on. However, through the comparison of the total performance and primitive performance, it can be found that the numerical calculation method using this grid, SA turbulence model, and other configurations can accurately predict the trend and magnitude of the changes in the total performance curve and primitive performance curve of the Stage 35 compressor. This demonstrates the high reliability of the numerical calculation method used in this paper.
3. Presentation and Design of the Research Program
According to previous research on other axial compressors [13], the position of the bleed air in the self-circulating casing treatment will affect its expansion effect. In order to carry out research on the self-circulating casing treatment with different bleed positions, this paper designs three types of self-circulating casing treatments with different bleed positions. Due to the self-circulating casing treatment structure of the bleed section and the injection section of the airflow direction being greatly deflected, the bleed and the injection parts of the improper design of the contour are likely to cause airflow separation. In order to ensure that the airflow flows as close to the wall as possible and reduce the loss of airflow separation, in this paper, referring to the relevant studies of our group [18,19], all the structures use Coanda profiles for the bleed and injection portions of the structure, and the bleed and injection angles are both 10°.
The structure of the self-circulating casing treatment is shown in Figure 8. In the figure, h represents the height of the injection throat, b represents the axial length of the injection port, a represents the axial length of the bleed port, c represents the radial width of the bridgeway, L1 represents the axial distance between the trailing edge of the injection port and the leading edge of the rotor blade, L2 represents the axial distance between the leading edge of the bleed port and the leading edge of the rotor blade, and and represent the bleed angle and injection angle, respectively.
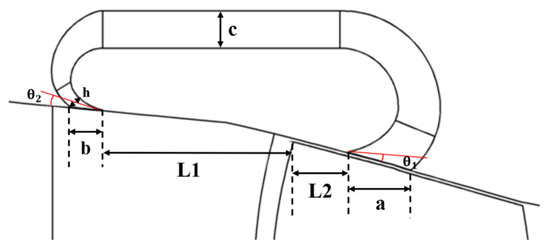
Figure 8.
Schematic diagram of the self-circulating casing treatment structure.
The throat height of the nozzle is kept constant in this section and later studies. Nine self-circulating casing treatments are evenly distributed throughout the entire ring, with one self-circulating casing treatment corresponding to four blade channels. Table 3 presents the basic design parameters for the self-circulating casing treatment, where Ca represents the rotor blade top axial chord length.

Table 3.
Basic design parameters for self-circulating casing treatment.
This paper focuses on the influence of the air guide position of the self-circulating casing treatment on its stabilizing effect, i.e., the ratio of the axial distance between the leading edge of the air guide opening and the leading edge of the blade to the axial chord length on the top of the blade. Based on the analysis of the solid-wall casing flow field, three self-circulating casing treatment structures with different bleed positions were designed, all with a circumferential coverage of 50%; a bleed position of −85% Ca (the minus sign represents that the bleed position is located upstream of the leading edge of the rotor); and bleed positions of 20% Ca, 60% Ca, and 178% Ca (the bleed position of this structure is located over the static sub), which are represented by CTB0.2, CTB0.6, and CTB1.78, respectively, where “CT” stands for casing treatment; “B” stands for bleed position; and the numbers “0.2”, “0.6”, and “1.78” correspond to 20% Ca, 60% Ca, and 178% Ca of the bleed position. Figure 9 presents a schematic of the structure of the self-circulating casing in the meridional plane at different bleed positions, where “LE” is the leading edge of the blades, and “TE” is the trailing edge of the blades.
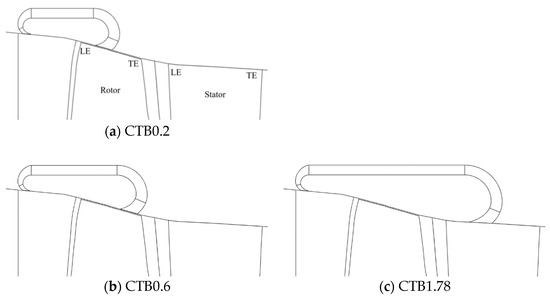
Figure 9.
Schematic diagram of the meridian surface of the self-circulating casing treatment for different bleed positions.
Figure 10 provides a three-dimensional schematic of the self-circulating casing treatment structure (CTB0.2, as an example). In order to ensure that the grid quality meets the requirements of orthogonality, the processing structure of the self-circulating casing has been divided into an air intake section, bridge section, and jet section. The bleed section and the injection section are made of two components. This can be seen in Figure 9’s meridian surface schematic and is distinguished by different colors in Figure 10. The bleed section, the bridge section, and the injection section are shown in the green, blue, and yellow areas of the figure, respectively, and all three sections are H-gridded and encrypted at the walls. The distribution of the number of grid nodes in the circumferential and radial directions for the bleed section, the bridge section, and the injection section are 97 (circumferential) × 21 (radial), and the number of grid nodes in the flow direction are 57, 81, and 45, respectively. The total number of computational model grids after processing with the self-circulating casing is about 5.95 million. For numerical calculations, the grid block of the self-circulating casing treatment is set to be stationary. In order to achieve data exchange between the static domain and rotating domain of the self-circulating casing processing structure, two layers of sliding blocks are installed between the two (gray part in the figure). The upper sliding block is connected to the self-circulating casing treatment, and the lower sliding block is connected to the casing surface using full non-matching. The interface between the two sliding blocks is set as a transition static interface, and data transmission is achieved using the region scaling method. The relevant settings for the nonstationary calculations are consistent with those in Section 2.2.
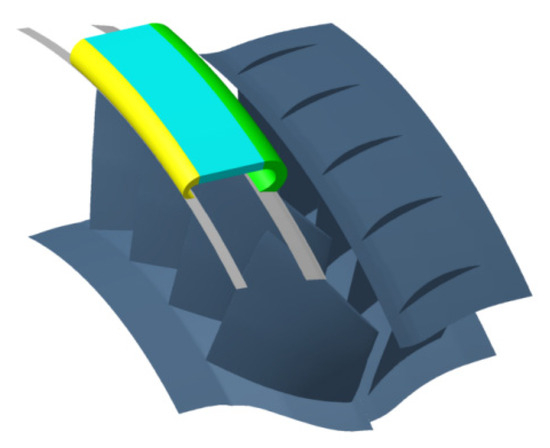
Figure 10.
Three-dimensional schematic of self-circulating casing treatment.
3.1. Total Performance Comparison Analysis
The total compressor performance curves for different casings are given in Figure 11; the horizontal coordinate is the compressor inlet flow rate, and SW represents the solid-wall casing. It can be seen from the figure that the total performance curves of self-circulating casing treatments and solid-wall casings with different bleed positions have consistent trends. The obstruction flows handled by the self-circulating casings with different bleed positions were smaller than those of the solid-wall casings, in contrast to the CTB0.2, which was closer to that of the solid-wall casings. The near-stall point flow values of the three self-circulating casing treatments for the compressor are all smaller than the near-stall mass flow rate of the solid-wall casing, indicating that all three self-circulating casing treatments can widen the stabilized operating range of the compressor to a certain extent, and that the CTB0.2 has the smallest near-stall point flow and the best stabilization widening effect.
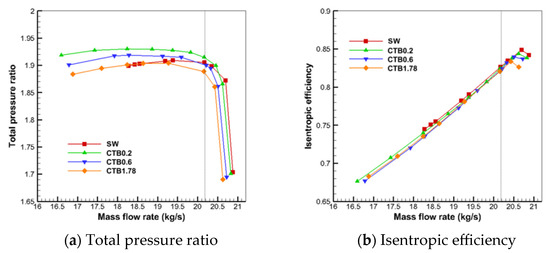
Figure 11.
Single-stage compressor total performance curve (time-averaged results).
As can be seen in Figure 11a, the total pressure ratio of the solid-wall casing compressor is higher than the total pressure ratio of the compressor with self-circulating casing treatment under high flow conditions. As the flow rate decreases, the total pressure ratios of CTB0.2 and CTB0.6 begin to be higher than that of the solid-wall casing, while the total pressure ratio of CTB1.78 remains consistently lower than that of the solid-wall casing. In the full flow range, the compressor has a lower total pressure ratio as the bleed position moves backward, and CTB0.2 is the most favorable for the total pressure ratio of the compressor.
From Figure 11b, it can be seen that the peak efficiency point flow rate of all three self-circulating casing treatments is less than that of the solid-wall casing, and the relation remains in peak efficiency. In addition, the peak efficiency decreases as the bleed position moves backward. The isentropic efficiencies handled by all three self-circulating casings are slightly lower than those of the solid-wall casings for flow conditions after the compressor reaches peak efficiency. The isentropic efficiency curve of CTB0.2 is always above the curves of CTB0.6 and CTB1.78 at the full flow condition, indicating that CTB0.2 has the least effect on the isentropic efficiency of the compressor.
Stage 35 has a design point flow of 20.188 kg/s, and its exact location is marked with a dashed line on the figure. From the figure, it can be seen that the design point total pressure ratio of CTB0.2 is higher than that of the solid-wall casing, while the design point total pressure ratios of CTB0.6 and CTB1.78 are lower in comparison to that of the solid-wall casing, and all the three self-circulating casing treatments slightly reduce the design point efficiency of the compressor.
Figure 12 provides the rotor performance curves in a single-stage compressor with different casings. For the total pressure ratio curve, similar to the single-stage compressor total pressure ratio performance, the total pressure ratio of the solid-wall casing rotor is higher than the total pressure ratio of the rotor with self-circulating casing treatment under high flow conditions. As the flow rate decreases, the total pressure ratios of CTB0.2 and CTB0.6 begin to be higher than that of the solid-wall casing, while the total pressure ratio of CTB1.78 remains consistently lower than that of the solid-wall casing. The further forward the position of the air lead, the most favorable the self-circulating casing treatment is for the improvement of the total rotor pressure ratio. These results assure and extend the research on the influence of the bleed position on compressor stability in References [13,14,15].
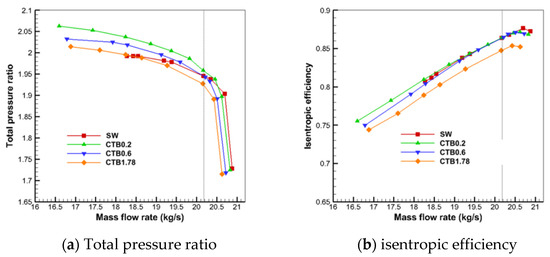
Figure 12.
Total pressure rotor performance curve (time-averaged results).
For the isentropic efficiency curves, the peak rotor efficiencies for all three self-circulating casing treatments are lower than the peak efficiencies for the solid-wall casing. After reaching the peak efficiency, the isentropic efficiency curves of CTB0.2 and CTB0.6 basically coincide at higher flow conditions. At small and medium flow conditions, the isentropic efficiency of CTB0.2 is slightly higher than that of the solid-wall casing, and the isentropic efficiency of CTB0.6 is slightly less than that of the solid-wall casing. The isentropic efficiency curve of CTB1.78 is significantly lower than that of the solid-wall casing and the other two self-circulating casing treatments at full flow conditions. The further back the air intake position is, the greater the negative impact of the self-circulating casing treatment on the isentropic efficiency of the rotor.
Figure 13 presents the curves of the static total pressure recovery coefficients of the compressors with different casings as a function of the flow rate. The static total pressure recovery coefficient is the ratio of the total pressure at the outlet of the static blade channel to the total pressure at the inlet of the static blade channel. From the figure, it can be seen that, near the blockage flow rate, the total static sub-pressure recovery coefficient of the compressor treated with the self-circulating casing is larger than that of the solid-wall casing. As the flow rate decreases, the total static pressure recovery coefficients of CTB0.2 and CTB0.6 begin to be lower than that of the solid-wall casing, and the total static pressure recovery coefficient of CTB0.2 is the lowest, while the total static pressure recovery coefficient of CTB1.78 is always larger than that of the solid-wall casing.
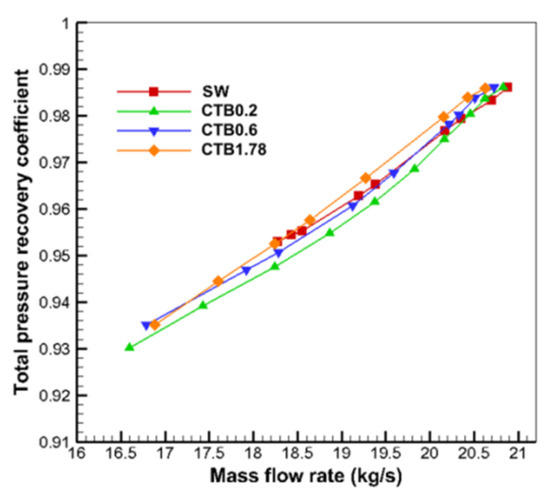
Figure 13.
Static total pressure recovery coefficient with the flow rate curve (time-averaged results).
In order to quantify the differences in the ability of different self-circulating casings to handle structural stability expansion, three metrics are defined, i.e., stall margin improvement (SMI), peak efficiency improvement (PEI), and design efficiency improvement (DEI). The stall margin improvement is defined as [26]
The peak efficiency improvement is defined as
The design point efficiency improvement is defined as
where represents the total pressure ratio, m represents the mass flow rate, represents the peak efficiency, represents the design point efficiency, the lower corner labeled S represents the near-stall point, and SW and CT represent the solid-wall casing versus the compressor with casing treatment, respectively. Figure 14 lists the SMI, PEI, and DEI obtained from self-circulating casing treatment at three different bleed positions. From the figure, it can be seen that, as the bleed position moves backward, the expansion ability of the self-circulating casing treatment continuously weakens. The maximum SMI obtained from CTB0.2 is 11.28%, while the expansion ability of CTB0.6 and CTB1.78 is weak, with only 8.99% and 7.38% obtained SMI.
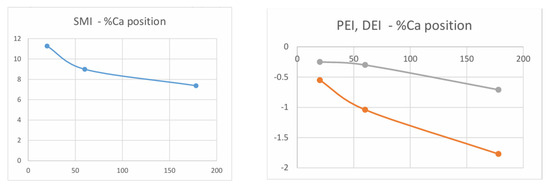
Figure 14.
SMI, PEI, and DEI (time-averaged results) for self-circulating casing treatments with different bleed locations.
All three self-circulating casing treatments reduced the peak efficiency of the compressor, with CTB0.2 having the lowest reduction and obtaining a PEI of −0.55%, and CTB0.6 and CTB1.78 having increased reductions and obtaining PEIs of −1.04% and −1.77%, respectively. All three self-circulating casing treatments slightly reduce the isentropic efficiency of the press at the design point, with DEIs of −0.25%, −0.30%, and −0.71%, respectively. The three self-circulating casing treatments extend the stabilized operating range of the compressor while reducing the design point efficiency of the compressor to a lesser extent.
3.2. Flow Analysis inside the Compressor Channel
Different structures to take basically the same mass flow conditions of unsteady calculations, in which the solid-wall casing has near-stall conditions, most of the subsequent analysis on the real-wall casing near-stall point of the mass flow rate of nearly equal conditions will not be repeated in the following description. Figure 15 presents an iso-surface plot of the relative Mach number distribution of the S1 flow surface at 98% blade height for the time-averaged results for the solid-wall casing and the compressor treated with self-circulating casings with different bleed positions and the following flow field analyses of the time-averaged results of the unsteady calculations, if not otherwise specified.
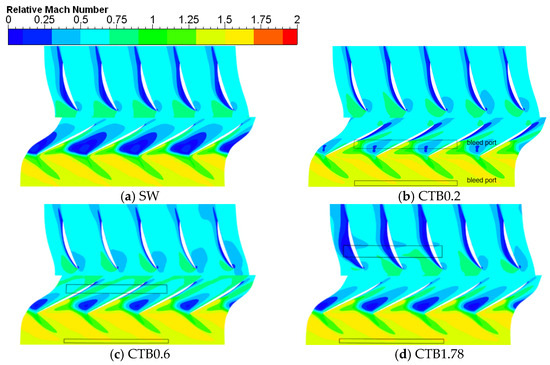
Figure 15.
Iso-surface plot of relative Mach number distribution at a 98% blade height.
The black solid line box in the figure shows the bleed and injection plots of self-circulating casing treatment. As can be seen from Figure 15a, under the near-stall condition, there is a large area of low Mach number region in the rotor blade top channel of the solid-wall casing, and the low Mach number region is close to the pressure surface of the rotor blades, with a large circumferential dimension, and the axial direction extends from the inlet of the channel all the way to the middle and lower reaches of the channel, which results in a serious clogging of the blade top channel, with a small effective circulation area, and greatly impedes the incoming flow from flowing smoothly through the rotor channel.
By comparing and observing Figure 15b–d, it can be seen that the treatment of the self-recirculating casing at three different positions of air intake has improved the flow condition of the blade top channel to a certain extent. The low-speed zone area of the rotor blade top channel has decreased. The closer the bleed position is to the clogged area of the rotor blade top of the solid-wall casing, the smaller the area of the low-speed zone. It can be seen that there is only a small dark blue area in the rotor blade tip area of CTB0.2. After treatment with the self-circulating casing, the separation of the attached surface layer occurred in the middle and rear of the suction surface of the moving blade, but in general, the circulation condition of the rotor blade top channel was effectively improved. The effect of the self-circulating casing treatment on the elimination of low-energy fluids decreases with the backward shift of the bleed position, but CTB0.6 and CTB1.78 both provide some containment effect for the region where the attachment layer separation occurs in the middle and rear of the suction surface of the rotor blade top of CTB0.2. At the top of the static sub-blade (near the casing), CTB0.2 and CTB0.6 all improved the static blade suction surface attachment layer separation, with CTB0.6 having a more pronounced improvement effect. CTB1.78 aggravated the static blade suction surface attachment layer separation, and, due to the suction effect of the suction ports, there was a small area of low Mach number at the middle of the static blade pressure surface. The suction there is a small area of lower Mach numbers at the trailing edge of the port.
The distributions of the rotor outlet dimensionless dense flow and static sub-outlet dimensionless dense flow along the blade height for the solid-wall casing and self-circulating casing treatments with different bleed positions are given in Figure 16. The outlet dense flow is obtained by multiplying the axial velocity () of the outlet airflow with the local density (), the outlet dense flow with different blade heights is circumferentially averaged along the meridian plane, and the rotor inlet averaged dense flow with a solid-walled casing is used for dimensionless quantization.
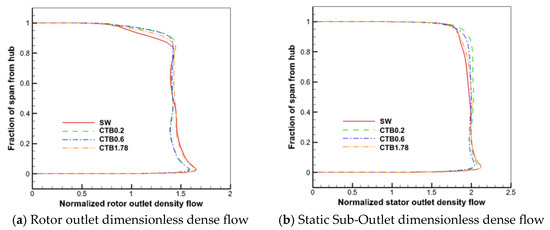
Figure 16.
Distribution of the dimensionless dense flow along the blade height.
As can be seen in Figure 16a, the outlet dimensionless dense flow of the solid-wall casing in the rotor blade top region is significantly reduced under near-stall conditions, indicating that the blockage of the rotor blade top channel has caused a significant dip in the channel’s flow capacity. The three self-circulating casing treatments with different bleed positions were able to improve this phenomenon, but there were differences in the improvement effects. In the radial range, CTB0.2 improves the exit dimensionless dense flow in the 0.75 blade height to the blade top range more than the other two self-circulating casing treatments. CTB0.6 was able to have essentially the same effect as CTB0.2 in the region above a 0.9 blade height but was not as effective as CTB0.2 in other radial ranges. The magnitude of the increase in the dimensionless dense flow at the rotor outlet and the radial range of action was not as good for CTB1.78 as for CTB0.2 and CTB0.6. In the blade root to 0.45 blade height range, the exit dimensionless dense flow of the solid-wall casing was not much different from the exit dimensionless dense flow of CTB1.78 but higher than the exit dimensionless dense flows of CTB0.2 and CTB0.6. This indicates that the self-circulating casing treatment redistributes the rotor outlet airflow parameters along the blade height direction while enhancing the flow capacity in the rotor blade top region. The extent of redistribution of the rotor outlet airflow parameters along the blade height decreases with the backward shift of the bleed position.
From Figure 16b, it can be seen that the static sub-exit dimensionless dense flow of CTB0.2 and CTB0.6 is larger than that of the solid-wall casing in the range above a 0.4 blade height. In the range of a 0.4~0.95 blade height, the static exit dimensionless dense flow of CTB1.78 is larger than that of the solid-wall casing, while above a 0.95 blade height, the static exit dimensionless dense flow of CTB1.78 is smaller than that of the solid-wall casing. Based on Figure 15, it can be seen that this is due to the fact that self-circulating casing treatment with the air intake above the static channel causes severe attachment layer separation at the suction surface at the static near the casing, exacerbating the blockage of the channel at the static near the casing. The self-circulating casing treatment causes the static sub-outlet parameters to redistribute to a lesser extent along the blade height as the bleed position is moved back.
The distributions of the static sub-inlet axial velocities and absolute airflow angles along the blade height for the solid-wall casing and the three self-circulating casing treatments are given in Figure 17. As analyzed above, the self-circulating casing treatment causes the airflow parameters at the rotor outlet to be redistributed along the blade height direction. From the figure, it can be seen that, below a 0.5 blade height, CTB0.2 and CTB0.6, in which the bleed ports are above the rotor, significantly reduce the axial velocity of the static inlet and the absolute airflow angle, which implies that the angle of attack of the incoming flow increases, whereas the reduction of the axial velocity of the static inlet and the absolute airflow angle of CTB1.78, in which the bleed ports are above the static, is very small. The static inlet axial velocity and absolute airflow angle of CTB1.78 are greater than those of the solid-wall casing in the range of 0.5 to 1.0 blade height. Above a 0.8 blade height, the static inlet axial velocity and absolute airflow angle become larger after treatment with the self-circulating casing, and the static inlet axial velocity and absolute airflow angle of CTB0.6 are the largest, and it has the best effect in mitigating the airflow separation at the static near the casing, which is in agreement with the law obtained from Figure 12.
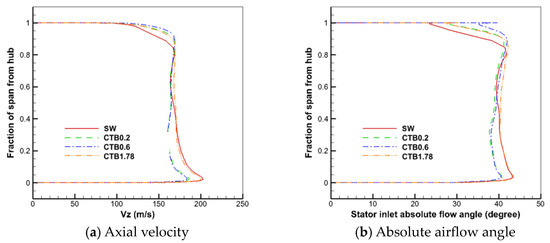
Figure 17.
Distribution of the static sub-inlet axial velocity and absolute airflow angle along the blade height.
The flow parameters at the static inlet affect the flow conditions in the static channel. Figure 17 provides the absolute Mach number iso-surface plot for the solid-wall casing and the three self-circulating casing treatments in the three cross-sections of the static subchannel perpendicular to the axis, with the axial positions of the three cross-sections for each structure being, from left to right, 20% b (with b representing the axial chord length of the static sub100% of the blade height (near the casing)), 50% b, and 70% b. It can be seen that the static blade suction surfaces are subject to airflow separation across the entire blade height. According to Figure 17, CTB0.2 and CTB0.6 with the bleed opening above the rotor will reduce the inlet axial velocity in the static low blade spread region, and the inlet airflow angle of attack will become larger, and it can be seen in Figure 18b,c that the airflow separation in the static low blade spread region is aggravated. This negative effect is much smaller for CTB1.78, where the bleed port is above the static sub. However, the circumferential dimensions of the static blade at full blade height for boundary layer separation are all small and do not have much effect on the smooth flow of air out of the channel.
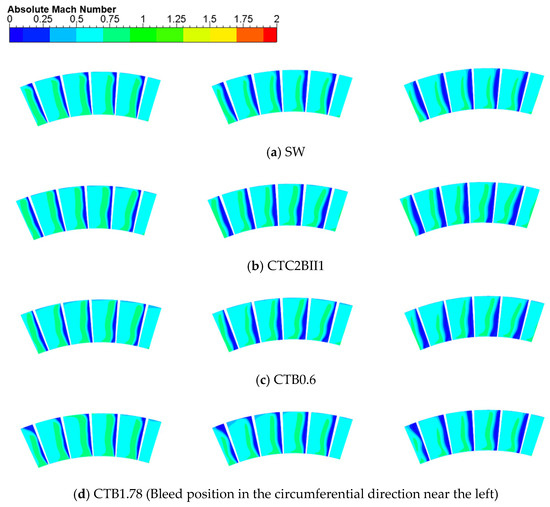
Figure 18.
Relative Mach number iso-surface plot for different cross-sections of the static subchannel perpendicular to the axis.
Analysis of Figure 17 shows that the absolute airflow angle increases in the CTB1.78 static sub-inlet near the casing region compared to the solid-wall casing, which is conducive to mitigating the airflow separation at the static sub near the casing. However, observing Figure 15a,d, compared to the solid-wall casing, the airflow separation is aggravated in some areas of the CTB1.78 static sub near the casing, which seems to be contradictory to the law obtained from Figure 17. Since the static inlet absolute airflow angle in Figure 17 is obtained after averaging along the circumferential direction, Figure 19 provides the distribution of the static inlet absolute airflow angle along the circumferential direction at a 98% blade height. From the figure, it can be seen that the static inlet absolute airflow angle of CTB1.78 is smaller than that of the static inlet absolute airflow angle of the solid-wall casing in part of the range of action of the bleed opening, in which the separation of static suction surfaces is aggravated; in the non-bleed opening region, the static inlet absolute airflow angle of CTB1.78 is larger than that of the solid-wall casing, which is in line with the distribution of the static suction surfaces of the solid-wall casing in Figure 15a,d. The distribution is consistent.
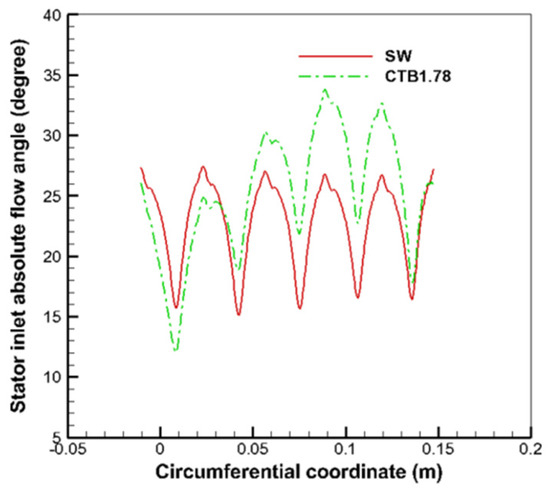
Figure 19.
Distribution of the absolute airflow angle of the static sub-inlet along the circumferential direction.
Figure 20 show a flow diagram of the rotor blade top gap leakage for the solid-wall casing and the three self-circulating casing treatments. The solid black box shows the bleed port for the self-circulating casing treatment. Observe Figure 20a, the solid-wall casing of the rotor blade top gap leakage flow in the flow through the surge after deceleration expansion, resulting in a large number of low-speed streamlines, the leakage flow is difficult to maintain for the concentration of the form after a large-scale deflection, the gap leakage vortex expansion and fragmentation, and at the same time, you can also see the obvious phenomenon of secondary leakage. Compared to the solid-wall casing, the three self-circulating casing treatments showed a reduction in the extent and scale of the gap leakage flow streamlines, both of which were more concentrated in morphology, and secondary leakage was significantly suppressed, with a significant reduction in the dark-blue, low-energy leakage streamlines. It can also be seen that, for CTB0.2 and CTB0.6, where the bleed port is above the rotor, part of the leakage flow line is significantly truncated due to the suction effect of the bleed port. As the bleed position moves backward, the suppression effect of self-circulating casing treatment on gap leakage flow becomes weak. CTB0.2, which suction port is located in the region where the solid-wall casing gap leakage flow expands, has the strongest ability to contain the leakage flow and does not have a dark-blue, low-energy flow line. CTB1.78 has less effect on the rotor tip gap leakage flow due to its suction port above the static sub and is significantly less effective than CTB0.2.
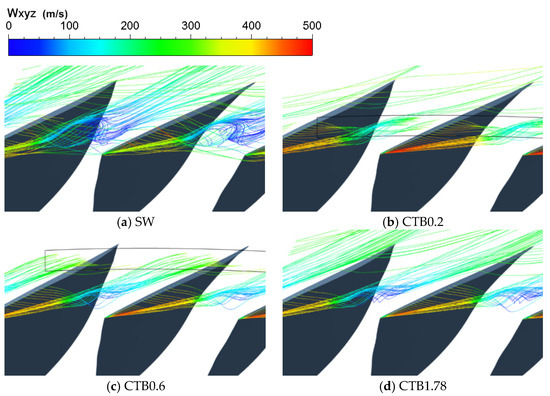
Figure 20.
Rotor blade tip clearance leakage flow line diagram.
3.3. Internal Flow of Self-Circulating Casing
Figure 21 presents the distribution of radial velocities of the CTB1.78 bleed flow. It can be seen that, for several static blade channels below the self-circulating casing treatment air intake, due to the static suction/pressure surface pressure difference, there is a large amount of airflow with negative radial velocities near the static suction surface, which impedes the circulation of the static channel airflow and causes blockage of the channel at the static near the casing. According to Figure 15a,d, for the static blade channel that is not below the self-circulating casing treatment air intake, the degree of clogging in the area at the static sub near the casing is reduced compared to the degree of clogging in the same static sub near casing channel of the solid-wall casing.
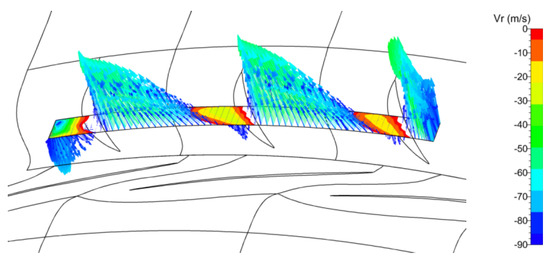
Figure 21.
Distribution of the radial velocity of CTB1.78 bleed flow.
Figure 22 presents the curves of the dimensionless drafts processed by the three self-circulating casings as a function of time step over one computational cycle (the physical time step set to 80 for the multichannel in the non-constantaneous computation), with the drafts being nine times the cyclic flow processed by a single self-circulating casing, and the dimensionless drafts being the ratio of the draft to the near-stall mass flow rate of the real-wall casing. The horizontal coordinate values refer to physical moments. There are some fluctuations in the dimensionless gravitational volume of the self-circulating casing treatment at different moments, and the CTB1.78 self-circulating casing treatment is located above the quiescence and has the smallest fluctuations in the dimensionless gravitational volume. The injection position is the same for the different self-circulating casing treatments, and the pumping effect of the self-circulating casing treatments is enhanced as the bleed position is shifted backward, and the pressure difference between the bleed and injection ports becomes larger. Thus, the overall dimensionless gravitational volume of CTB0.2, CTB0.6, and CTB1.78 increases as the gravitational position is shifted backward.
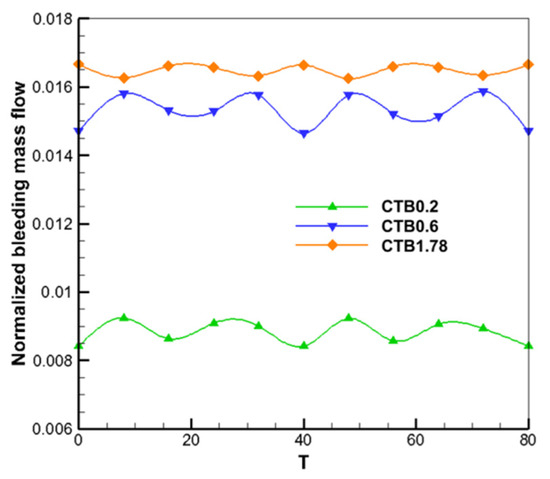
Figure 22.
Variation curve of the dimensionless bleed volume with moments.
It can be found that the magnitude of the dimensionless bleed volume does not represent the magnitude of the self-circulating casing treatment stabilization expansion capability. The instability of the compressor was initially triggered by low-energy blockage in the rotor blade tip region. In this paper, the self-circulating casing treatment improves the flow condition of the rotor blade top channel by suction of low-energy fluid. The air inlet of CTB0.2 is located at the core of the rotor blade top blockage area, which can extract a large amount of low-energy fluid. This has the strongest effect on eliminating clogged areas and suppressing the expansion and fragmentation of gap leakage vortices, and the maximum stall margin enhancement can be obtained with the minimum amount of bleed to obtain the maximum stall margin improvement.
Figure 23 shows an iso-surface plot of the absolute Mach number and the streamline distribution inside the self-circulating casing treatments with different bleed positions, and the circumferential cross-sections of different self-circulating casing treatments are taken at the same radial height. In Figure 23a, “IN” represents the injection port, “BL” represents the bleed port, and the black arrow is the rotor blade rotation direction. As can be seen in the figure, large low Mach number areas exist within all three self-circulating casing treatments. The self-circulating casing treatment recirculating airflow enters through the bleed port, develops inside the bridgeway, and finally exits at high velocity in the injection. For the CTB0.2 and CTB0.6, because their bleed ports are above the rotor, the rotation of the rotor makes the airflow into the bleed ports have a large tangential velocity, and most of the streamlines move tangentially in the bleed section to the right side of the self-circulating casing treatment. While it can be seen that the low Mach number region on the left side of the bridgeway for the CTB0.2 and CTB0.6, a clear vortex structure is produced. For CTB1.78, since the bleed port is located above the static sub, the tangential motion of the airflow is not obvious, and there is no vortex structure inside the bridge channel. Overall, the bleed position moves backward to reduce the flow loss inside the self-circulating casing, and among the three configurations, the flow loss inside the CTB1.78 is the smallest.
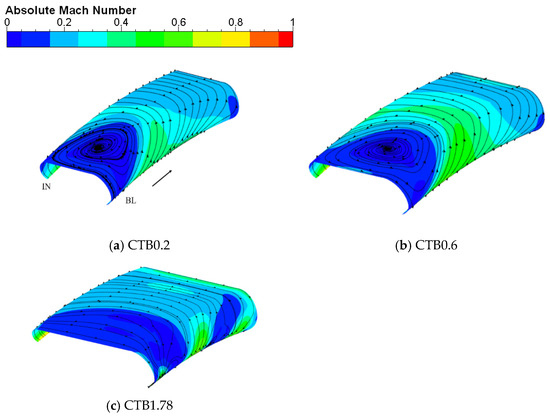
Figure 23.
Absolute Mach number and streamline distribution within self-circulating casing treatment.
3.4. Loss Analysis within the Channel
The distribution of rotor outlet relative total pressure loss coefficients along the blade height for the solid-wall casing and the three self-circulating casing treatments is given in Figure 24. The relative total pressure loss coefficient at the rotor outlet is defined as
where is the rotor inlet relative total pressure, is the rotor outlet local relative total pressure, and is the rotor inlet static pressure. The size of the rotor outlet relative to the total pressure loss coefficient can be used to characterize the size of the flow loss inside the rotor channel. As can be seen from the figure, below a 0.9 blade height, there is little difference in the relative total pressure loss coefficient at the rotor outlet for the three self-circulating casing treatments. Below a 0.4 blade height, there is little difference between the relative total pressure loss coefficients at the rotor outlet of the three self-circulating casing treatments and that of the solid-wall casing. In the 0.4 to 0.7 blade height range, the relative total pressure loss coefficients at the rotor outlets of the three self-circulating casing treatments are slightly less than the relative total pressure loss coefficients at the rotor outlets of the solid-wall casing. The relative total pressure loss coefficients at the rotor outlet for the three self-circulating casing treatments were slightly greater than the relative total pressure loss coefficients at the rotor outlet for the solid-wall casing in the 0.7 to 0.85 blade height range. In the range above a 0.85 blade height, the relative total pressure loss coefficient at the rotor outlet was significantly reduced after treatment with a self-circulating casing, and the relative total pressure loss coefficient at the rotor outlet was reduced to a lesser extent with the backward shift of the bleed position, and the relative total pressure loss coefficient at the rotor outlet was largest among the three self-circulating casing treatments for the rotor outlet of CTB1.78 with the greatest flow loss in the rotor blade top channel. In general, the rotor blade top channel flow loss increases as the bleed position moves backward.
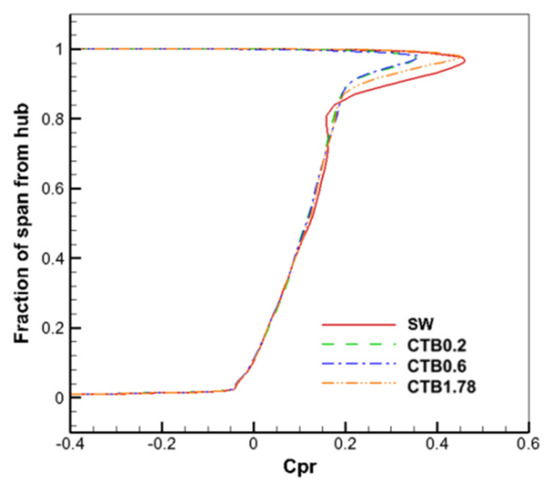
Figure 24.
Rotor outlet relative total pressure loss coefficient distribution along blade height.
The distribution of static sub-outlet total pressure loss coefficients along the blade height for the solid-wall casing and the three self-circulating casing treatments is given in Figure 25. The static sub-outlet total pressure loss coefficient is defined as:
where is the average total pressure at the static inlet, is the local total pressure at the static outlet, and is the average static pressure at the static inlet. The magnitude of the total pressure loss coefficient can be used to characterize the magnitude of the static sub-flow loss. It can be seen that the effect of the three self-circulating casing treatments on the static subchannel flow loss varies. The CTB0.2C0.5I0 and CTB0.6C0.5I0 curves have a similar trend, with an increased total pressure loss coefficient at the static sub-outlet in the region from the root of the blade (near the hub) to the middle of the blade as compared to the solid-walled cassette for CTB0.2C0.5I0 and CTB0.6C0.5I0. As can be seen from the above analysis, this is due to the increased degree of separation of the attached surface layer in the low blade spread region of the static sub and the increased flow losses after treatment with these two self-circulating casings. In the region of high blade spread, the total pressure loss coefficient at the static sub-outlet decreases for CTB0.2C0.5I0 and CTB0.6C0.5I0, and the flow loss also decreases. For CTB1.78C0.5I0, the curves basically coincide with those of the solid-wall casing below the 0.4 blade height range, and the total static outlet pressure loss coefficient is slightly smaller than that of the solid-wall casing in the 0.4 to 0.9 blade height range, whereas above the 0.9 blade height, the total static outlet pressure loss coefficient increases, as well as the flow loss. Overall, CTB1.78C0.5I0 has the least effect on the flow loss in the static subchannel.
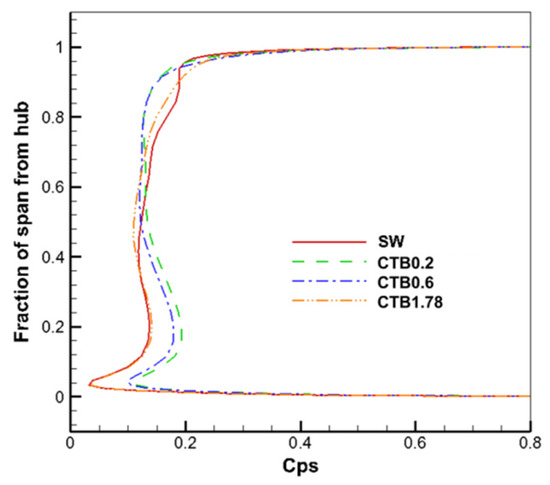
Figure 25.
Distribution of total pressure loss coefficients at static sub outlet along blade height.
4. Conclusions and Prospect
In this paper, a multi-channel non-stationary numerical simulation method is adopted to study the influence of self-circulating casing treatment with different bleed positions on the stability and performance of a compressor. By comparing and analyzing the total performance and internal flow field of compressors with different casings, we obtained the law of influence of self-circulating casing treatment with different bleed positions on compressor performance and stability, and we also revealed the intrinsic mechanism of the change of the bleed position that influences the stabilizing effect of self-circulating casings. The main conclusions are as follows:
- (1)
- The self-circulating casing treatments with different bleed positions can effectively expand the stabilized operating range of the compressor. As the bleed position moves backward, the improvement in stall margin obtained by self-circulating casing treatment decreases gradually, and the influence on the compressor efficiency increases gradually. The SMIs obtained by CTB0.2, CTB0.6, and CTB1.78 are 11.28%, 8.99% and 7.38%, respectively. The PEIs obtained for the three are −0.55%, −1.04%, and −1.77%, and the DEIs obtained are −0.25%, −0.30%, and −0.71%, respectively.
- (2)
- As the bleed position moves backward, the extent that self-circulating casing treatment enhances the total pressure ratio of a compressor rotor decreases, and the total pressure ratio is consistently smaller for CTB 1.78 than for solid-wall casing. The peak compressor rotor efficiency in the case of casing treatment decreases as the bleed position moves backward. In small and medium flow conditions, the rotor efficiency of CTB0.2 is slightly greater than that of solid-wall casing, which is to the contrary for CTB0.6 and CTB1.78. The total static pressure recovery coefficient increases with the backward shift of the bleed position, and the total static pressure recovery coefficient of CTB1.78 is larger than that of solid-wall casing under medium and large flow conditions.
- (3)
- As the bleed position moves backward, the bleed volume of self-circulating casing increases, but the stabilizing effect of self-circulating casing treatment becomes weak, and the bleed volume cannot measure the strength of stabilizing ability. The bleed position of CTB0.2 is directly above the blockage area of the rotor blade top, which can realize the best elimination effect on the blockage area with the smallest bleed volume. This case leads to the strongest inhibition on the development of leakage and leakage vortex expansion and crushing, and the greatest enhancement on the flow capacity of the rotor blade top channel and, in turn, realizes the largest improvement of stall margin and the best expanding and stabilizing effect.
- (4)
- The self-circulating casing treatment affects rotor/static matching and redistributes the static inlet airflow parameters along the blade height. Compared to the solid-wall casing, CTB0.2 and CTB0.6 decrease the absolute airflow angle of static inlet in the low blade spread region, and the negative effect of the self-circulating casing treatment on the static blade suction surface attachment layer separation increases, while the absolute airflow angle of static inlet in the low blade spread region does not change much with CTB1.78. After the casing treatment, the inlet absolute airflow angle in the high blade spread region of the static sub increased, and the CTB0.6, which has the greatest degree of change at the back of the bleed position, was the most effective in changing the suction surface attachment layer separation at the top of the static sub blade (near the casing).
- (5)
- As the bleed position moves backward, the internal flow condition of self-circulating casing treatment improves, and the flow loss caused by internal airflow mixing decreases. All three self-circulating casing treatments reduce the relative total pressure loss coefficient in the rotor blade top region, and the rotor relative total pressure loss coefficient increases as the bleed position moves backward. For the static channel, after self-circulating casing treatment, the further back the bleed position is, the smaller the total pressure loss coefficient at the static outlet is in the low blade spread region, which is to the contrary in the high blade spread region.
There are still some shortcomings in the research work of this article. During the research process, some areas that need further exploration were discovered, listed as follows:
- (1)
- This article only considers the influence of changes in a single geometric parameter on the expansion effect of self-circulating casing treatment when parameterizing the bleed position, ignoring the interaction between different geometric design parameters. In subsequent research, studies on the mutual influence between multiple geometric parameters can be conducted.
- (2)
- This article only relied on experience to select a few specific values for numerical research when studying the influence in the variation of the bleed position on the expansion stability effect of the self-circulating casing treatment but failed to determine the optimal value of the bleed position. In subsequent research, parameter values can be further optimized in order to obtain a self-circulating casing treatment structure with the best expansion effect and consideration of compressor efficiency.
Author Contributions
H.Z.: Conceptualization, methodology, software, validation, formal analysis, investigation, and data curation; J.X.: Conceptualization, methodology, software, validation, formal analysis, investigation, resources, data curation, writing—original draft preparation, and writing—review and editing. X.Z.: software, validation, formal analysis, investigation, resources, data, curation, and writing—original, draft, preparation; Y.F.: formal analysis, investigation; W.C.: validation, investigation, and formal analysis. All authors have read and agreed to the published version of the manuscript.
Funding
The authors disclosed receipt of the following financial support for the research, authorship, and/or publication of this article: This research was funded by the National Natural Science Foundation of China (Grant No. 51006084), the National Science and Technology Major Projects of China (Grant No. 2017-II-0005–0018), and the Key Program of National Natural Science Foundation of China (No. 51536006).
Data Availability Statement
The original contributions presented in the study are included in the article, further inquiries can be directed to the corresponding author.
Conflicts of Interest
The authors declare no conflicts of interest.
References
- Chen, M. Some Issues in the Research and Development of Aeroengine HP Compressor in China. Aero Engine 2006, 32, 5–11,37. [Google Scholar] [CrossRef]
- Weichert, S.; Day, I.; Freeman, C. Self-Regulating Casing Treatment for Axial Compressor Stability Enhancement. In Proceedings of the ASME 2011 Turbo Expo: Turbine Technical Conference and Exposition, Vancouver, BC, Canada, 6–10 June 2011. [Google Scholar]
- Kumar, S.S.; Chotalia, R.J.; Jana, S.; Ganguli, R.; Siddanagouda, K.B. Single Stage Axial Compressor Stability Management with Self-Recirculating Casing Treatment. In Proceedings of the AIAA Scitech 2019 Forum, San Diego, CA, USA, 7–11 January 2019. [Google Scholar]
- Bu, Y.; Chu, W.; Zhang, H.; Dong, X. Stability Improvement in High Pressure-Ratio Centrifugal Impeller with Self Recirculation Casing Treatment. J. Propuls. Technol. 2013, 34, 194–201. [Google Scholar] [CrossRef]
- Zhang, H.G.; Chu, W.L.; Wu, Y.H.; Gao, P.; Cao, Y. Numerical investigation of the flow mechanisms of compressor stall delay through end wall self recirculation. J. Propuls. Technol. 2009, 30, 202–208. [Google Scholar]
- Zhang, H.G.; Chu, W.L.; Wu, Y.H.; Su, Z.L. Flow mechanisms of improving compressor performance through self recirculation casing treatment. J. Propuls. Technol. 2010, 31, 301–308. [Google Scholar]
- Zhang, H.; Wu, J.; Chu, W.; Wu, Y.; Li, X. Full-Annulus Numerical Investigation of Axial Flow Compressor with Self Recirculation Casing Treatment. J. Propuls. Technol. 2013, 34, 918–924+931. [Google Scholar]
- Zhang, H.; Wu, J.; Wang, Y.; Chu, W.; Wu, Y. Influence of the injecting position of self recirculation casing treatment on compressor performance. J. Aerosp. Power 2016, 31, 1149–1158. [Google Scholar]
- Zhang, H.; An, K.; Tan, F.; Chu, W.; Wu, Y. Mechanism of affecting ability of stability enhancement with varying axial position of self-recirculating casing treatment. J. Aerosp. Power 2017, 32, 983–989. [Google Scholar]
- Zhang, H.G.; Dong, F.Y.; Wang, W.; Chu, W.L.; Yan, S. Mechanism of affecting the performance and internal flow field of an axial flow subsonic compressor with self-recirculation casing treatment. Proc. Inst. Mech. Eng. Part G J. Aerosp. Eng. 2021, 235, 295–307. [Google Scholar] [CrossRef]
- Li, J.; Liu, L.; Zhang, H.; Tong, Z.; Lin, F.; Nie, C. Experiment of self-recirculation tip injection in low speed single-stage compressor. J. Aerosp. Eng. 2012, 27, 2577–2584. [Google Scholar]
- Li, J.; Lin, F.; Liu, L.; Tong, Z.; Nie, C. Experimental Investigation of Self-recirculating Tip Air Injection in Transonic Axial Flow Compressor. J. Mech. Eng. 2014, 50, 135–143. [Google Scholar] [CrossRef]
- Yan, S.; Chu, W.L.; Zhang, H.G.; Liu, K. Effects of Different Axial Position of Bleeding Airon Circulation Casing Treatment. J. Propuls. Technol. 2019, 40, 1478–1489. [Google Scholar]
- Yan, S.; Chu, W. Study on the Influence of the Throat Height of the Injector of the Self-circulating Treatment Casing on the Rotor Performance. J. Eng. Thermophys. 2020, 41, 2400–2410. [Google Scholar]
- Yan, S.; Chu, W. Study on Enhanced Stability Ability of Self-Circulating Casing Treatment by Blade Tip Bleed Positions. J. Propuls. Technol. 2019, 40, 2731–2738. [Google Scholar]
- Guo, Y.; Gao, L.; Yang, G.; Wang, L. Study on the mechanism of stability improvement of the self-recirculating casing treatment in a counter-rotating compressor. J. Aerosp. Eng. 2022, 37, 191–203. [Google Scholar] [CrossRef]
- Wang, W.; Chu, W.; Zhang, H.; Wu, Y. The effects on stability, performance, and tip leakage flow of recirculating casing treatment in a subsonic axial flow compressor. In Proceedings of the ASME Turbo Expo 2016: Turbomachinery Technical Conference and Exposition, Seoul, Republic of Korea, 13–17 June 2016. [Google Scholar]
- Wang, W. The Effects and Flow Mechanisms of Tip Injection and Recirculating Casing Treatment in Axial Flow Compressors. Ph.D. Thesis, Northwestern Polytechnical University, Xi’an, China, 2016. [Google Scholar]
- Wang, W.; Chu, W.; Zhang, H. Study of Design of a Coupled Casing Treatment for a Two-Stage High-Loaded Axial Flow Compressor. J. Propuls. Technol. 2017, 38, 210–218. [Google Scholar]
- Zhong, Y.; Chu, W.; Yang, J.; Zhao, W. Effects of Self-Recirculating Casing Circumferential Offset on Unsteady Flow Field of Axial Compressor. J. Propuls. Technol. 2020, 42, 14. [Google Scholar]
- Reid, L.; Moore, R.D. Design and Overall Performance of Four Highly-Loaded, High-Speed Inlet Stages for an Advanced High-Pressure-Ratio Core Compressor; NASA: Washington, DC, USA, 1978.
- NUMECA International. User Manual FINE™/Turbo v8.9 Flow Integrated Environment; NUMECA International Chaussée de la Hulpe: Brussels, Belgium, 2011. [Google Scholar]
- Liu, W. Mechanism Investigation of the Influence of Blade Angle Slot Casing Treatment on Axial Compressor Performance and Stability. Master’s Thesis, The Northwestern Polytechnical University, Xi’an, China, 2020. [Google Scholar]
- Yanhui, W.; Jiangtao, T.; Qingpeng, L.; Zhuoxun, Z.; Wuli, C. Analysis ofrotor tip jet stabilization mechanism of cross-sound axial compressor. J. Eng.Thermophys. 2011, 32, 1119–1122. [Google Scholar]
- Herrick, G.; Hathaway, M.; Chen, J.P. Unsteady Full Annulus Simulations of a Transonic Axial Compressor Stage. In Proceedings of the 47th AIAA Aerospace Sciences Meeting including The New Horizons Forum and Aerospace Exposition, Orlando, FL, USA, 5–8 January 2009. [Google Scholar]
- Guo, Z.; Chu, W.; Zhang, H.; Liang, C.; Meng, D. Statistical evaluation of stability margin of a multi-stage compressor with geometric variability using adaptive polynomial chaos-Kriging model. Phys. Fluid 2023, 35, 076114. [Google Scholar] [CrossRef]
Disclaimer/Publisher’s Note: The statements, opinions and data contained in all publications are solely those of the individual author(s) and contributor(s) and not of MDPI and/or the editor(s). MDPI and/or the editor(s) disclaim responsibility for any injury to people or property resulting from any ideas, methods, instructions or products referred to in the content. |
© 2024 by the authors. Licensee MDPI, Basel, Switzerland. This article is an open access article distributed under the terms and conditions of the Creative Commons Attribution (CC BY) license (https://creativecommons.org/licenses/by/4.0/).