3.2. Mathematical Model of the Optimization Problem
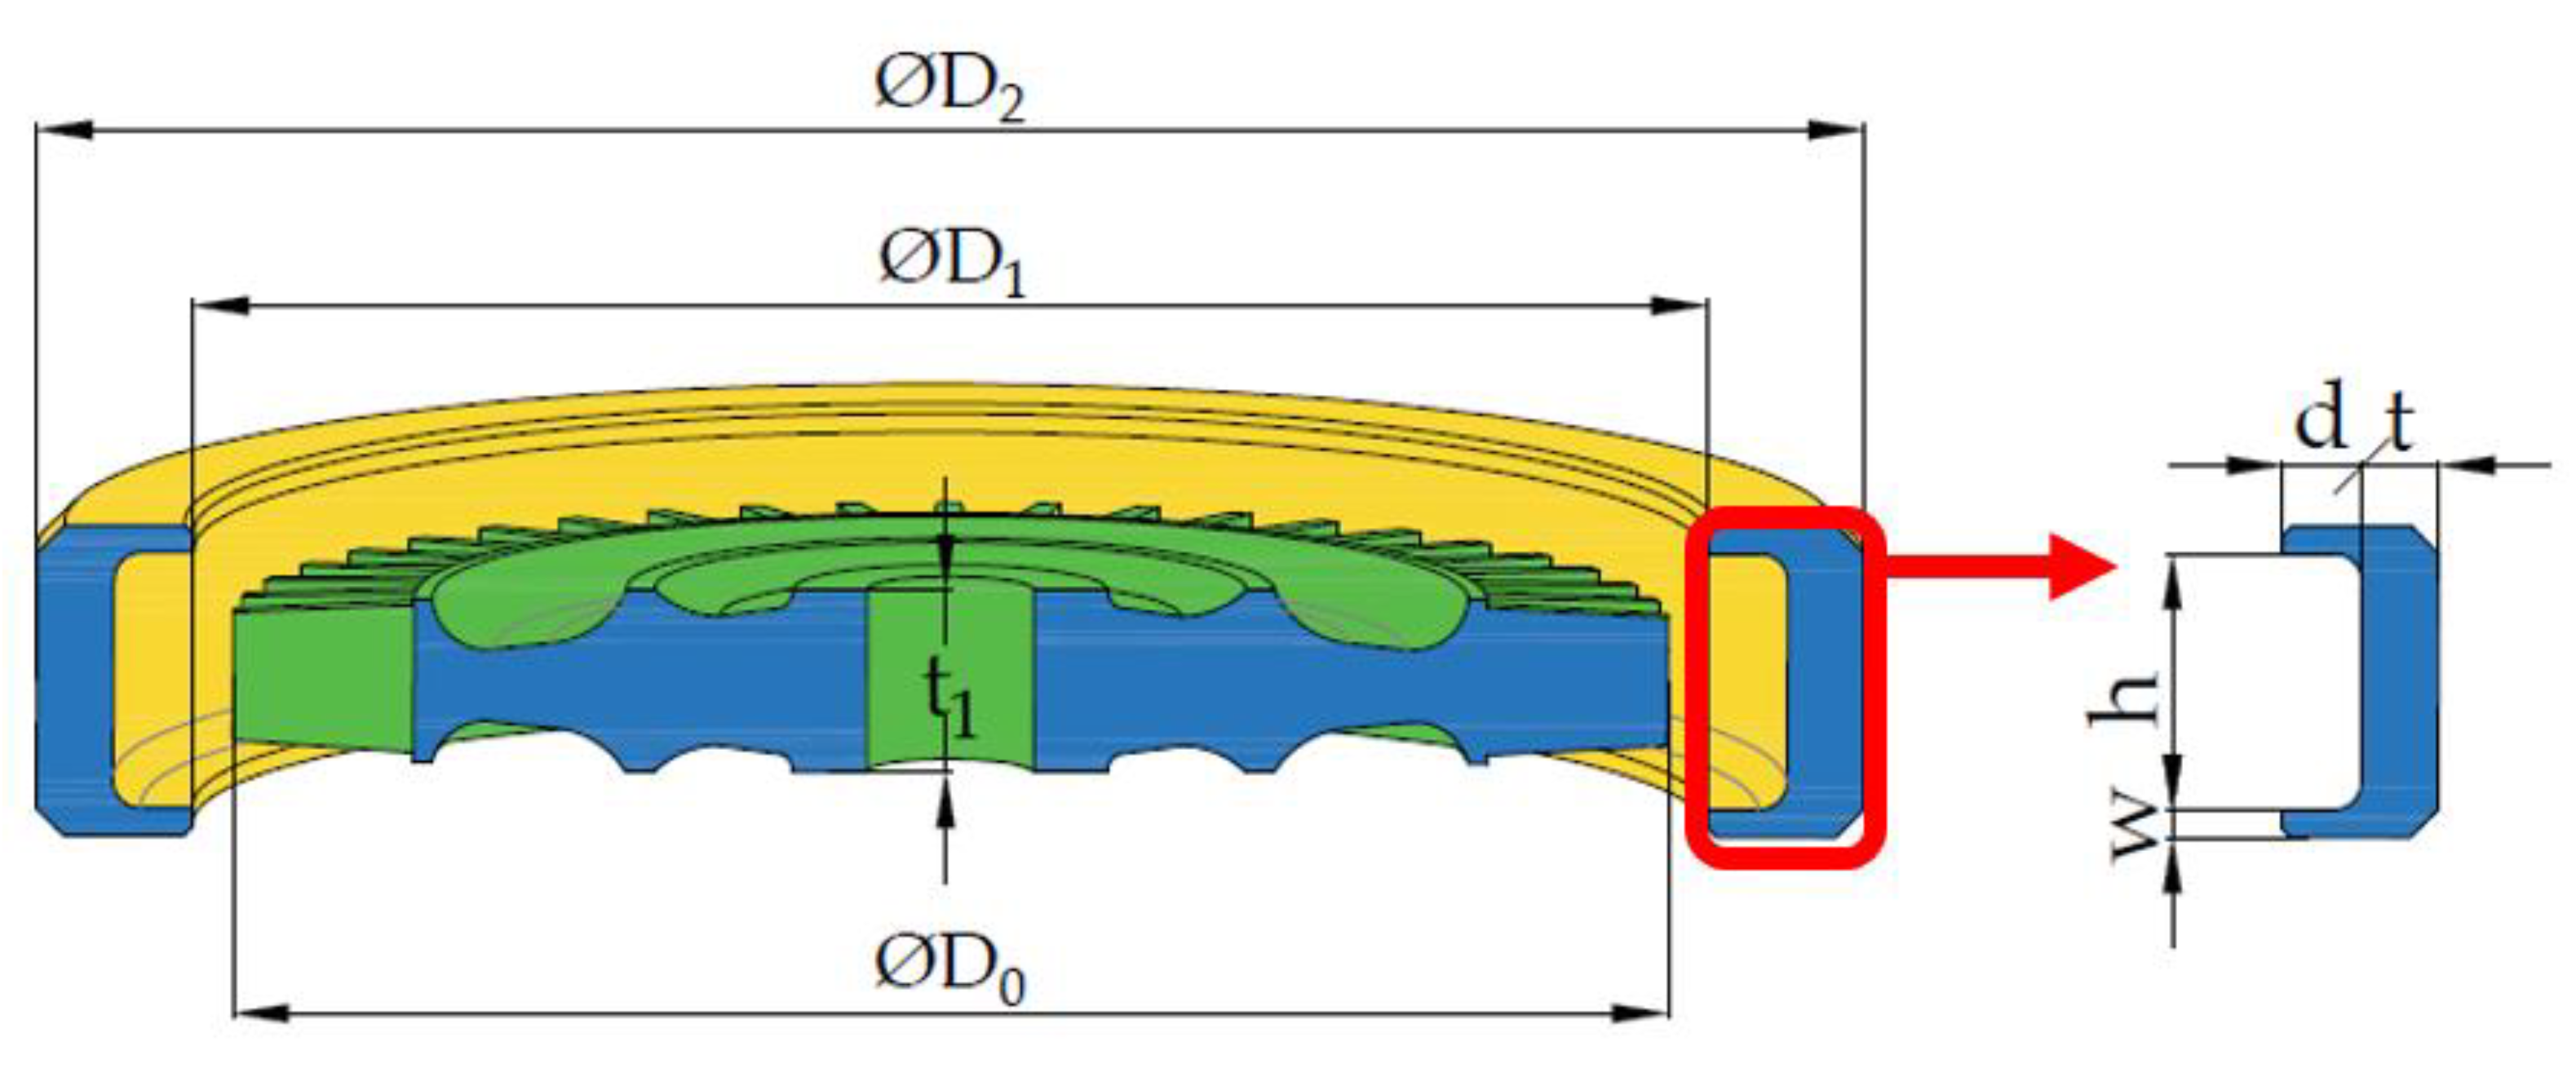
The minimum mass M of the U-type containment ring is selected as the optimization objective. Meanwhile, the U-type containment ring with mass M should meet the containment requirements after the turbine disk of a certain type of air turbine starter is broken into three equal parts at free running speed. The four parameters t, h, d, and w are selected as optimization variables, as shown in
Figure 3. As described in the literature [
12], the kinetic energy absorbed by deformation of the containment ring during disk fragment impact is about 0.975 of the total energy, so the thresholds of residual kinetic energy and axial velocity are selected as 2 kJ and 5 m/s, respectively. Since the containment ring will be stretched during impact, a clearance should be set to allow the containment ring to deform and prevent interference with the surrounding structure. Here, the clearance diameter around the ring where the deformation is allowed is 140% of the original outer diameter of the containment ring [
17]. Therefore, the maximum outer diameter of the limiting containment ring after deformation is less than or equal to 140% of the original outer diameter.
According to the numerical simulation results of the initial containment ring, the parameter range of different structures in DOE sample generation is listed in
Table 3. The lower limit of the thickness of the containment ring is reduced by 1/3 relative to the initial value, and the upper and lower limits of the groove depth are increased and decreased by 1/3 relative to the initial value. The upper and lower limits of groove edge width increase and decrease by 1/2 relative to the initial values, respectively. The distance of the groove height is not less than 20 mm, the maximum thickness of the turbine disc, and not more than 1.5 times the maximum thickness of the turbine disc. Hence, the optimization problem can be described by Equation (5).
where
Ek1,
Ek2, and
Ek3 respectively represent the remaining kinetic energy of the debris after the turbine disks tricyclic rupture and impact on the containment ring.
v1,
v2, and
v3 represent the axial velocities of the three fragments, respectively.
R0 is the original outside diameter of the containment ring, and
Rmax is the diameter of the outer tangential circle after the containment ring is changed into a triangle by debris impact.
3.3. Building an Optimization Platform
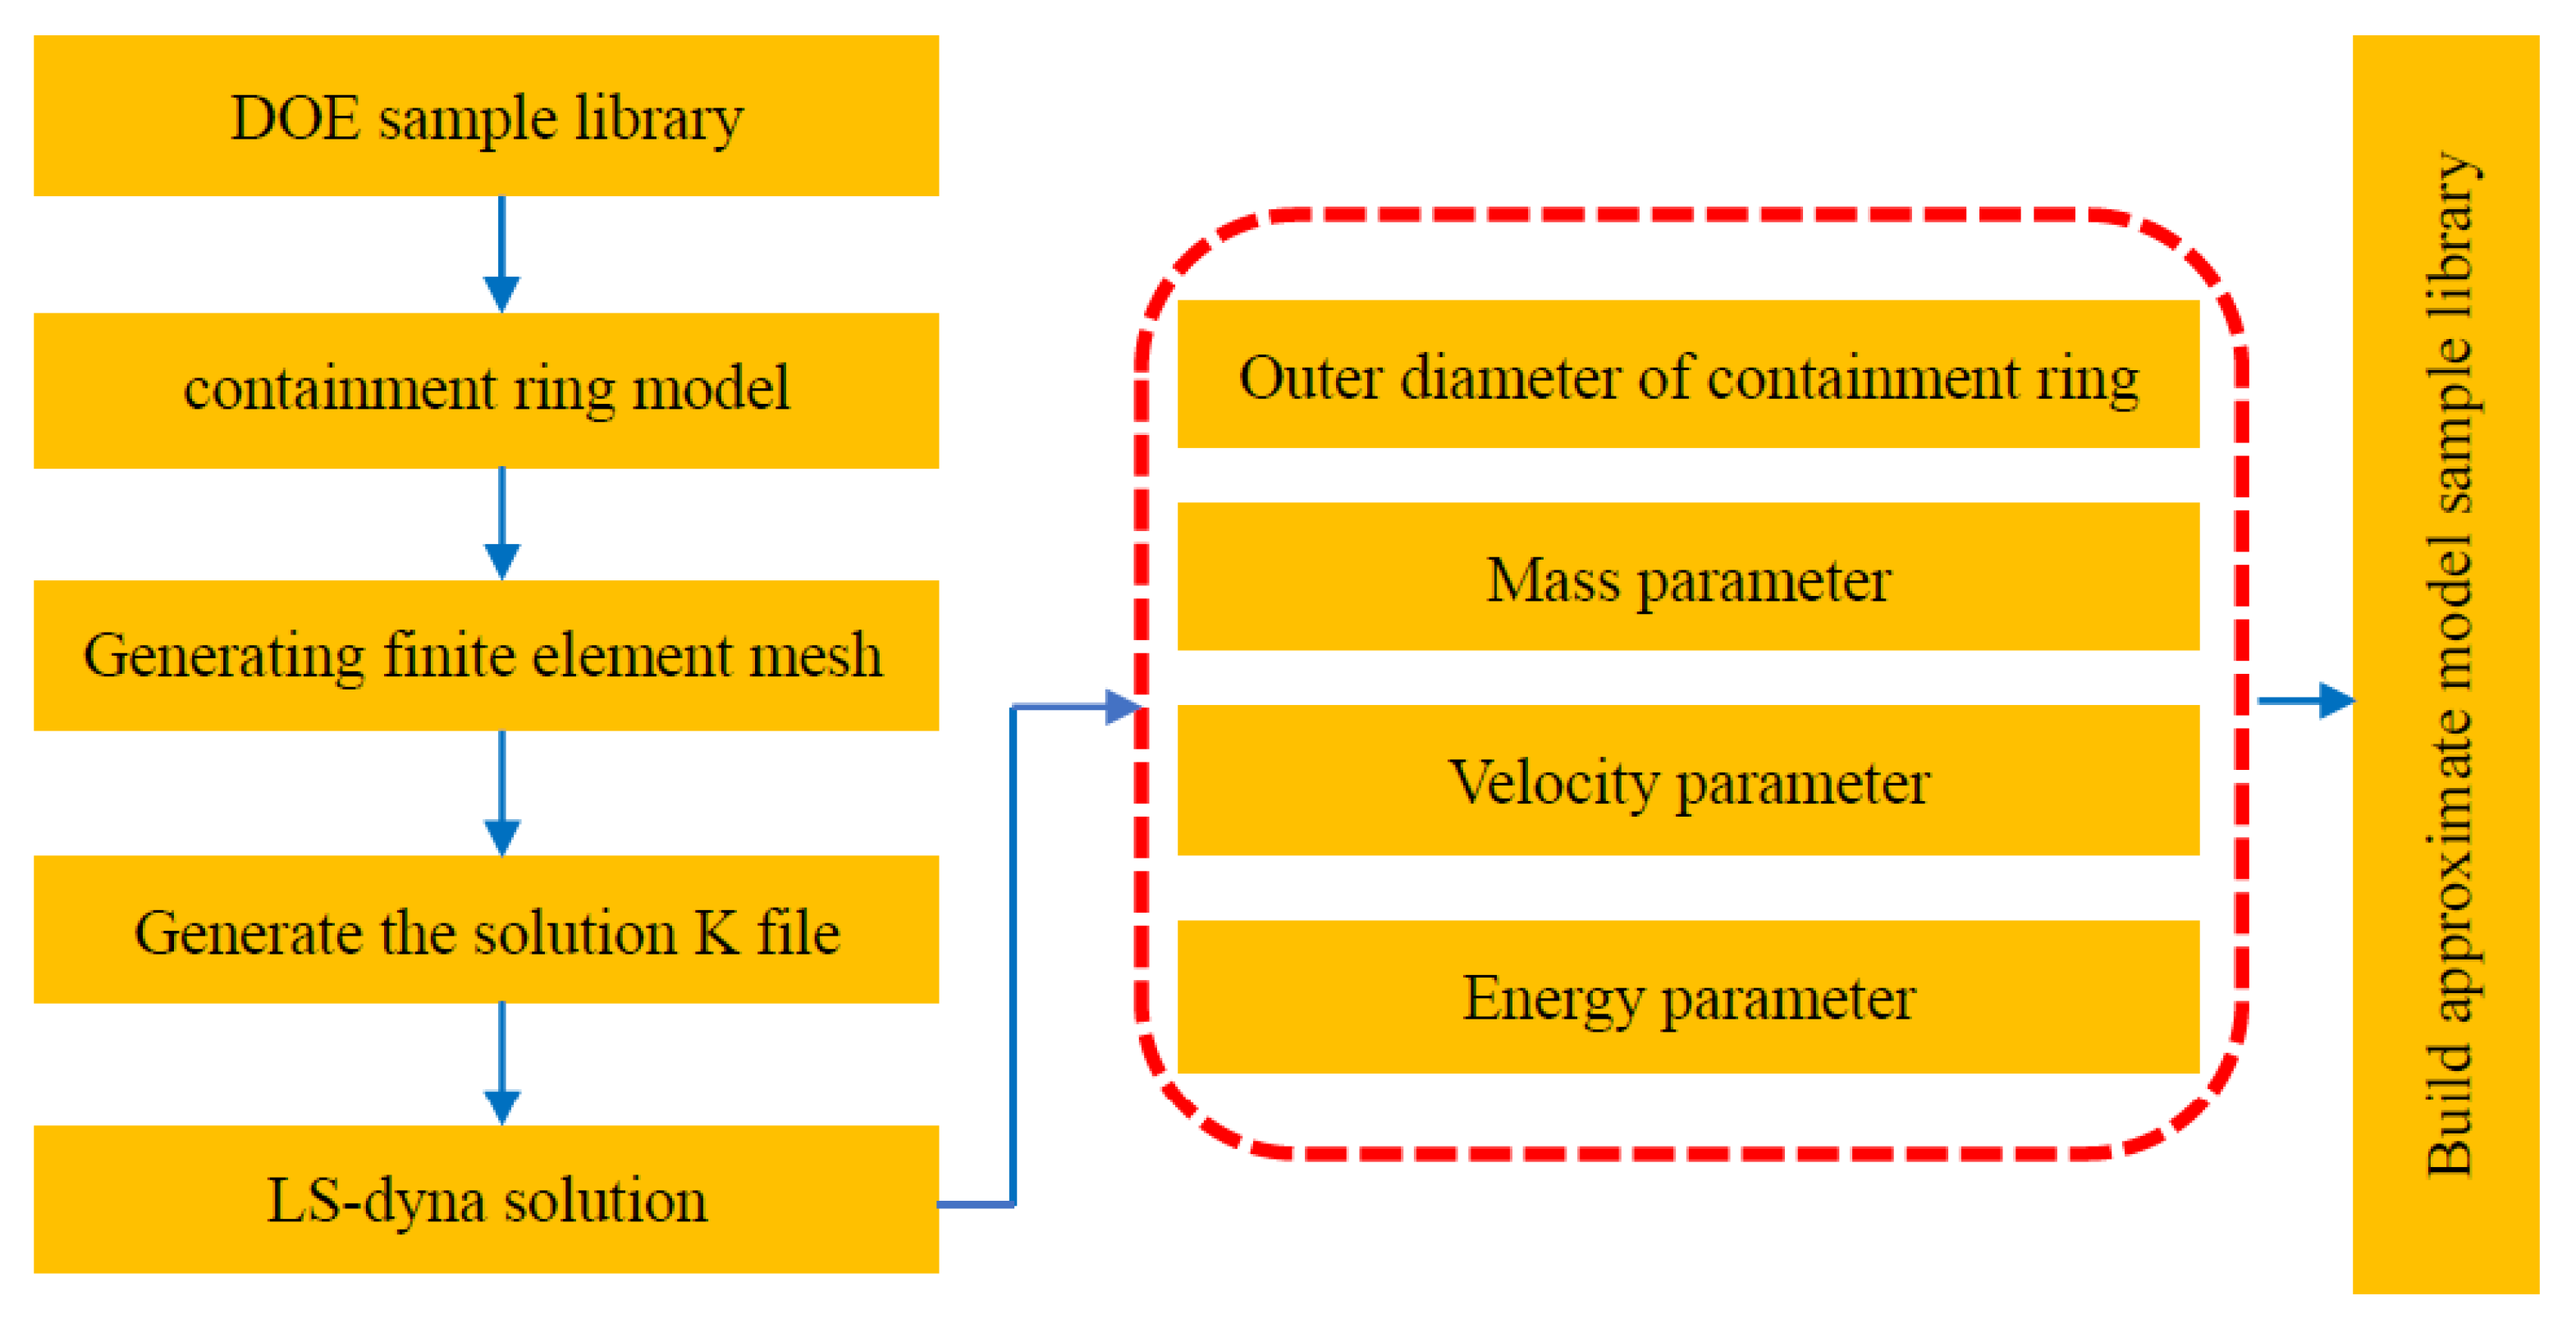
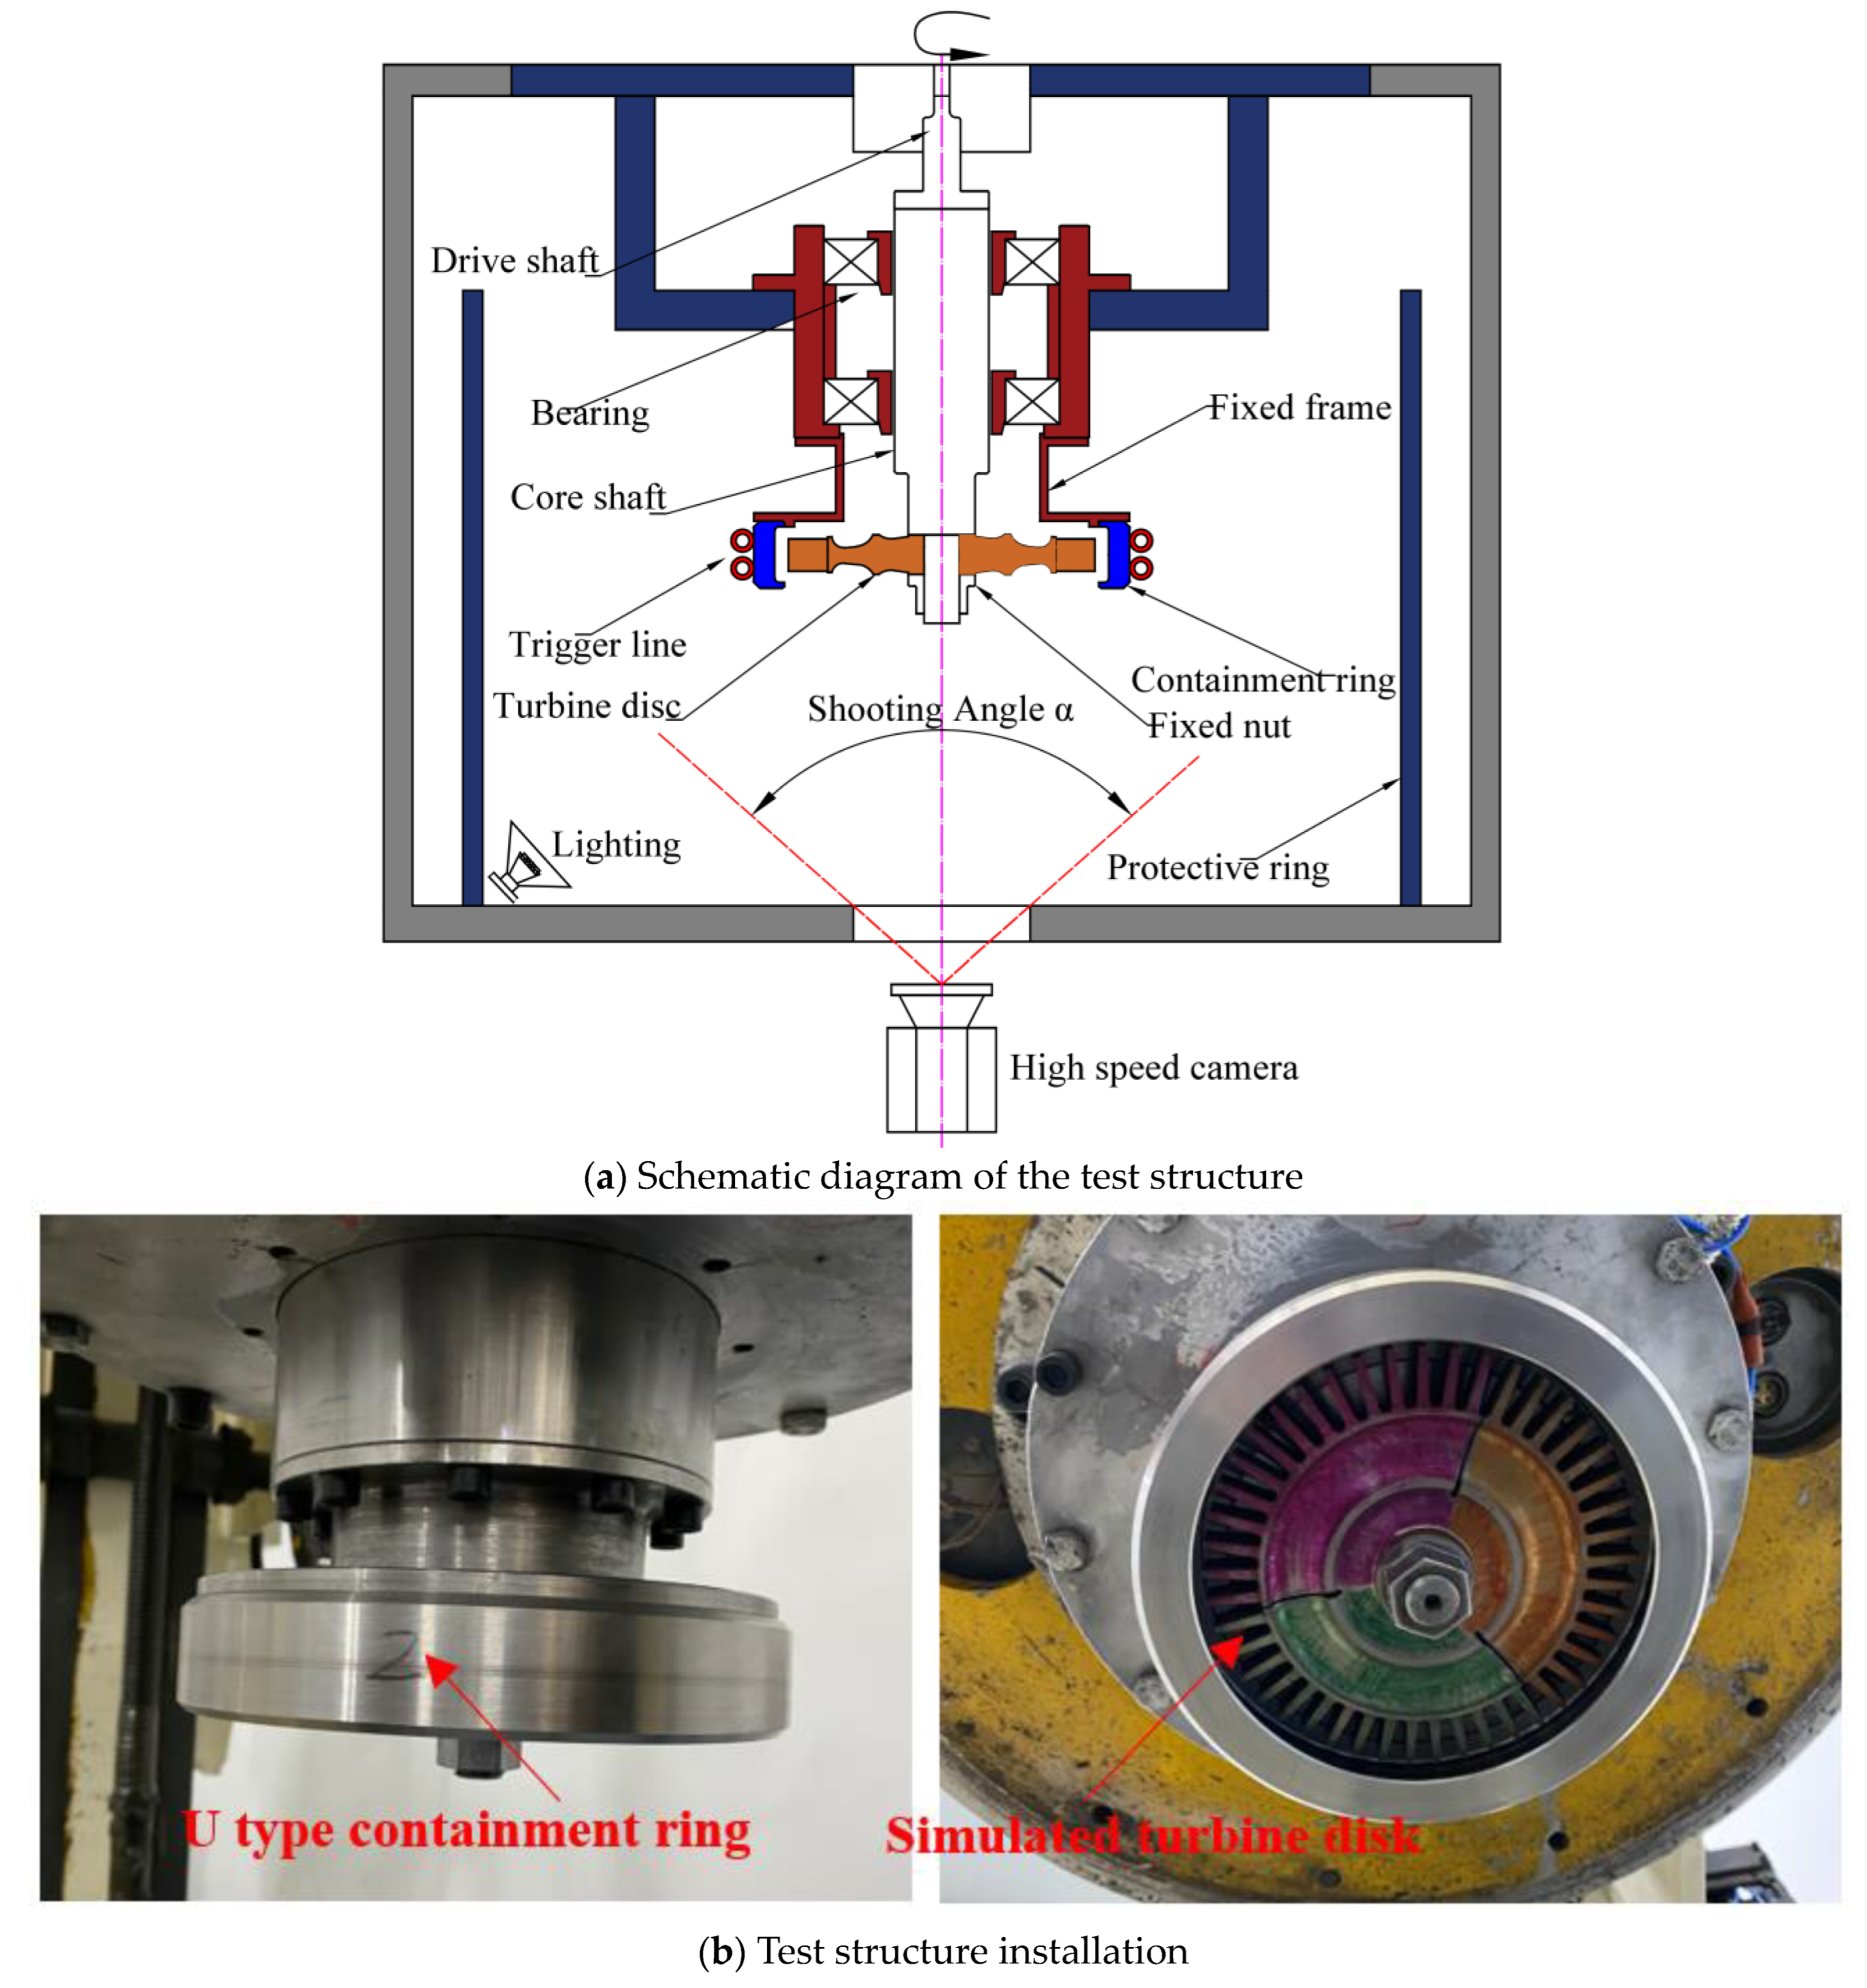
In order to realize the automatic optimization process of structural parameters, three-dimensional model generation, finite element mesh division, boundary conditions, control information setting, and result solving are realized automatically by combining batch processing commands. The automatic design flow of the sample library is shown in
Figure 8.
The Kriging approximate model is a model based on structural analysis and variogram theory to perform unbiased optimal estimation of regionalized variables in a limited region and can be used to solve problems with a high degree of nonlinearity to obtain an ideal fitting effect [
25,
26]. This method is suitable for the case of small sample point disturbances, and the calculation speed of this algorithm is faster than other methods. Compared with other approximate models, such as nonlinear regression, neural networks, and sparse grids, they are used on fewer occasions and correspond to the corresponding sample point generation methods. Since the data points in the DOE sample library need to be calculated by finite element and evaluated by error, the results of the sample library have high accuracy; that is, compared with the fitting method, the interpolation method is better, so this paper adopts the Kriging method to generate response surfaces. The Kriging model can be expressed as:
where
f(
x) represents the objective function.
y(
x) is the function that we solved, which represents the entire model of our sample space.
z(
x) represents the local deviation of the overall model, and its covariance form is as follows:
where
R represents the correlation matrix and
R(
xi,xj) represents the correlation function between any two sample points
xi and
xj. The most Gaussian correlation function can be used to express the correlation between sample points.
where
nv represents the number of variables.
and
represent the KTH element of sample points
xi and
xj, and
θk represents the unknown relevant parameters of the fitting model. After determining the correlation function, the relationship between the approximate response
of
f(
x) and the observation point
x is established as follows:
where
.
f,
y, and
rT(
x) are all
ns dimensional column vectors.
f is the target response value of each design point.
y is the unit column vector.
rT(
x) is the correlation between
x and sample points, which can be expressed as
rT(
x) = [
RT(
x,x1),
R(
x,
x2), …,
R(
x,
xm)]
T.
In the optimization platform design, the value range of optimization variables is first given, and a certain number of sample point libraries are generated using the optimized Latin square experiment method. The sample points are automatically modeled and simulated to obtain the deformation outside diameter, mass, velocity, and other information to form the sample result library. The mapping relationship between structural parameters and results is constructed by the Kriging approximation model. For the multi-parameter sample space, the multi-island genetic algorithm (MIGA) has obvious advantages [
27]. This optimization algorithm can effectively improve the search efficiency of the traditional genetic algorithm, support distributed optimization better, and avoid the local optimal solution more effectively [
28]. Therefore, the algorithm can support multi-parameter optimization better. The genetic algorithm is used to optimize the structural parameters according to the optimization objectives, and the optimized structural parameters are simulated and calculated, and the results predicted by the approximate model are compared. If the error is within the allowed range, the final optimization results will be obtained; otherwise, the set of data will be added to the sample database to continue to build a more accurate approximate model. The re-optimization continues until the error of the approximate model is within the allowable range.
3.4. Weight Analysis of Structural Parameters
Based on the initial containment ring, the influence of structural parameters on containment was analyzed using the optimal Latin Hypercube Experimental design method (DOE) and response surface modeling. The DOE method can make the value range of the sectional structural parameters of the containment ring have very good spatial filling and equilibrium, so that the influence of the interrelation between the structural parameters on the containment can be fully reflected and provide a sample basis for the response surface analysis. The response surface can well fit the complex response relationship between structural parameters and Ek and has good robustness.
According to the numerical simulation results of the initial containment ring, the parameter range of different structures in DOE sample generation is listed in
Table 3. The lower limit of the thickness of the containment ring is reduced by 1/3 relative to the initial value, and the upper and lower limits of the groove depth are increased and decreased by 1/3 relative to the initial value. The upper and lower limits of groove edge width increase and decrease by 1/2 relative to the initial values, respectively. The distance of the groove height is not less than 20 mm, the maximum thickness of the turbine disc, and not more than 1.5 times the maximum thickness of the turbine disc.
The objective function
f(x) in the Kriging model can be a first-order, second-order, third-order, or fourth-order polynomial. In order to obtain a more accurate model, the fourth-order polynomial function is used here, and the number of samples required to construct the model can be selected according to Equation (10) [
29].
where
Kmin is the minimum number of sample points and
N is the number of input variables. When
N = 4, the minimum number of samples is
Kmin = 23. Here, the sample library is generated with the sample number
K = 30, and numerical simulation is carried out. The sample library of results is shown in
Table 4.
The response surface function is shown in Equation (11).
Ek is the output variable
f(
x) as the result of the model, and the U-type ring structure parameter is the input variable
xn of the model.
where
β0,
β1, …,
β4N, and
βij were the parameters to be estimated. After calculation, response surface model Equation (12) can be expressed as:
Because the response surface model has some errors, error analysis is needed to ensure the accuracy of the model. The fitting accuracy evaluation formula for the response surface model is as follows [
30]:
where
is the
ith point’s approximate model prediction;
yi is the verification value for the
ith point. The larger the value of
R2, the higher the degree of fit. When
R2 ≥ 0.9, the model is successfully established. The fitting accuracy of the response surface model in this model is
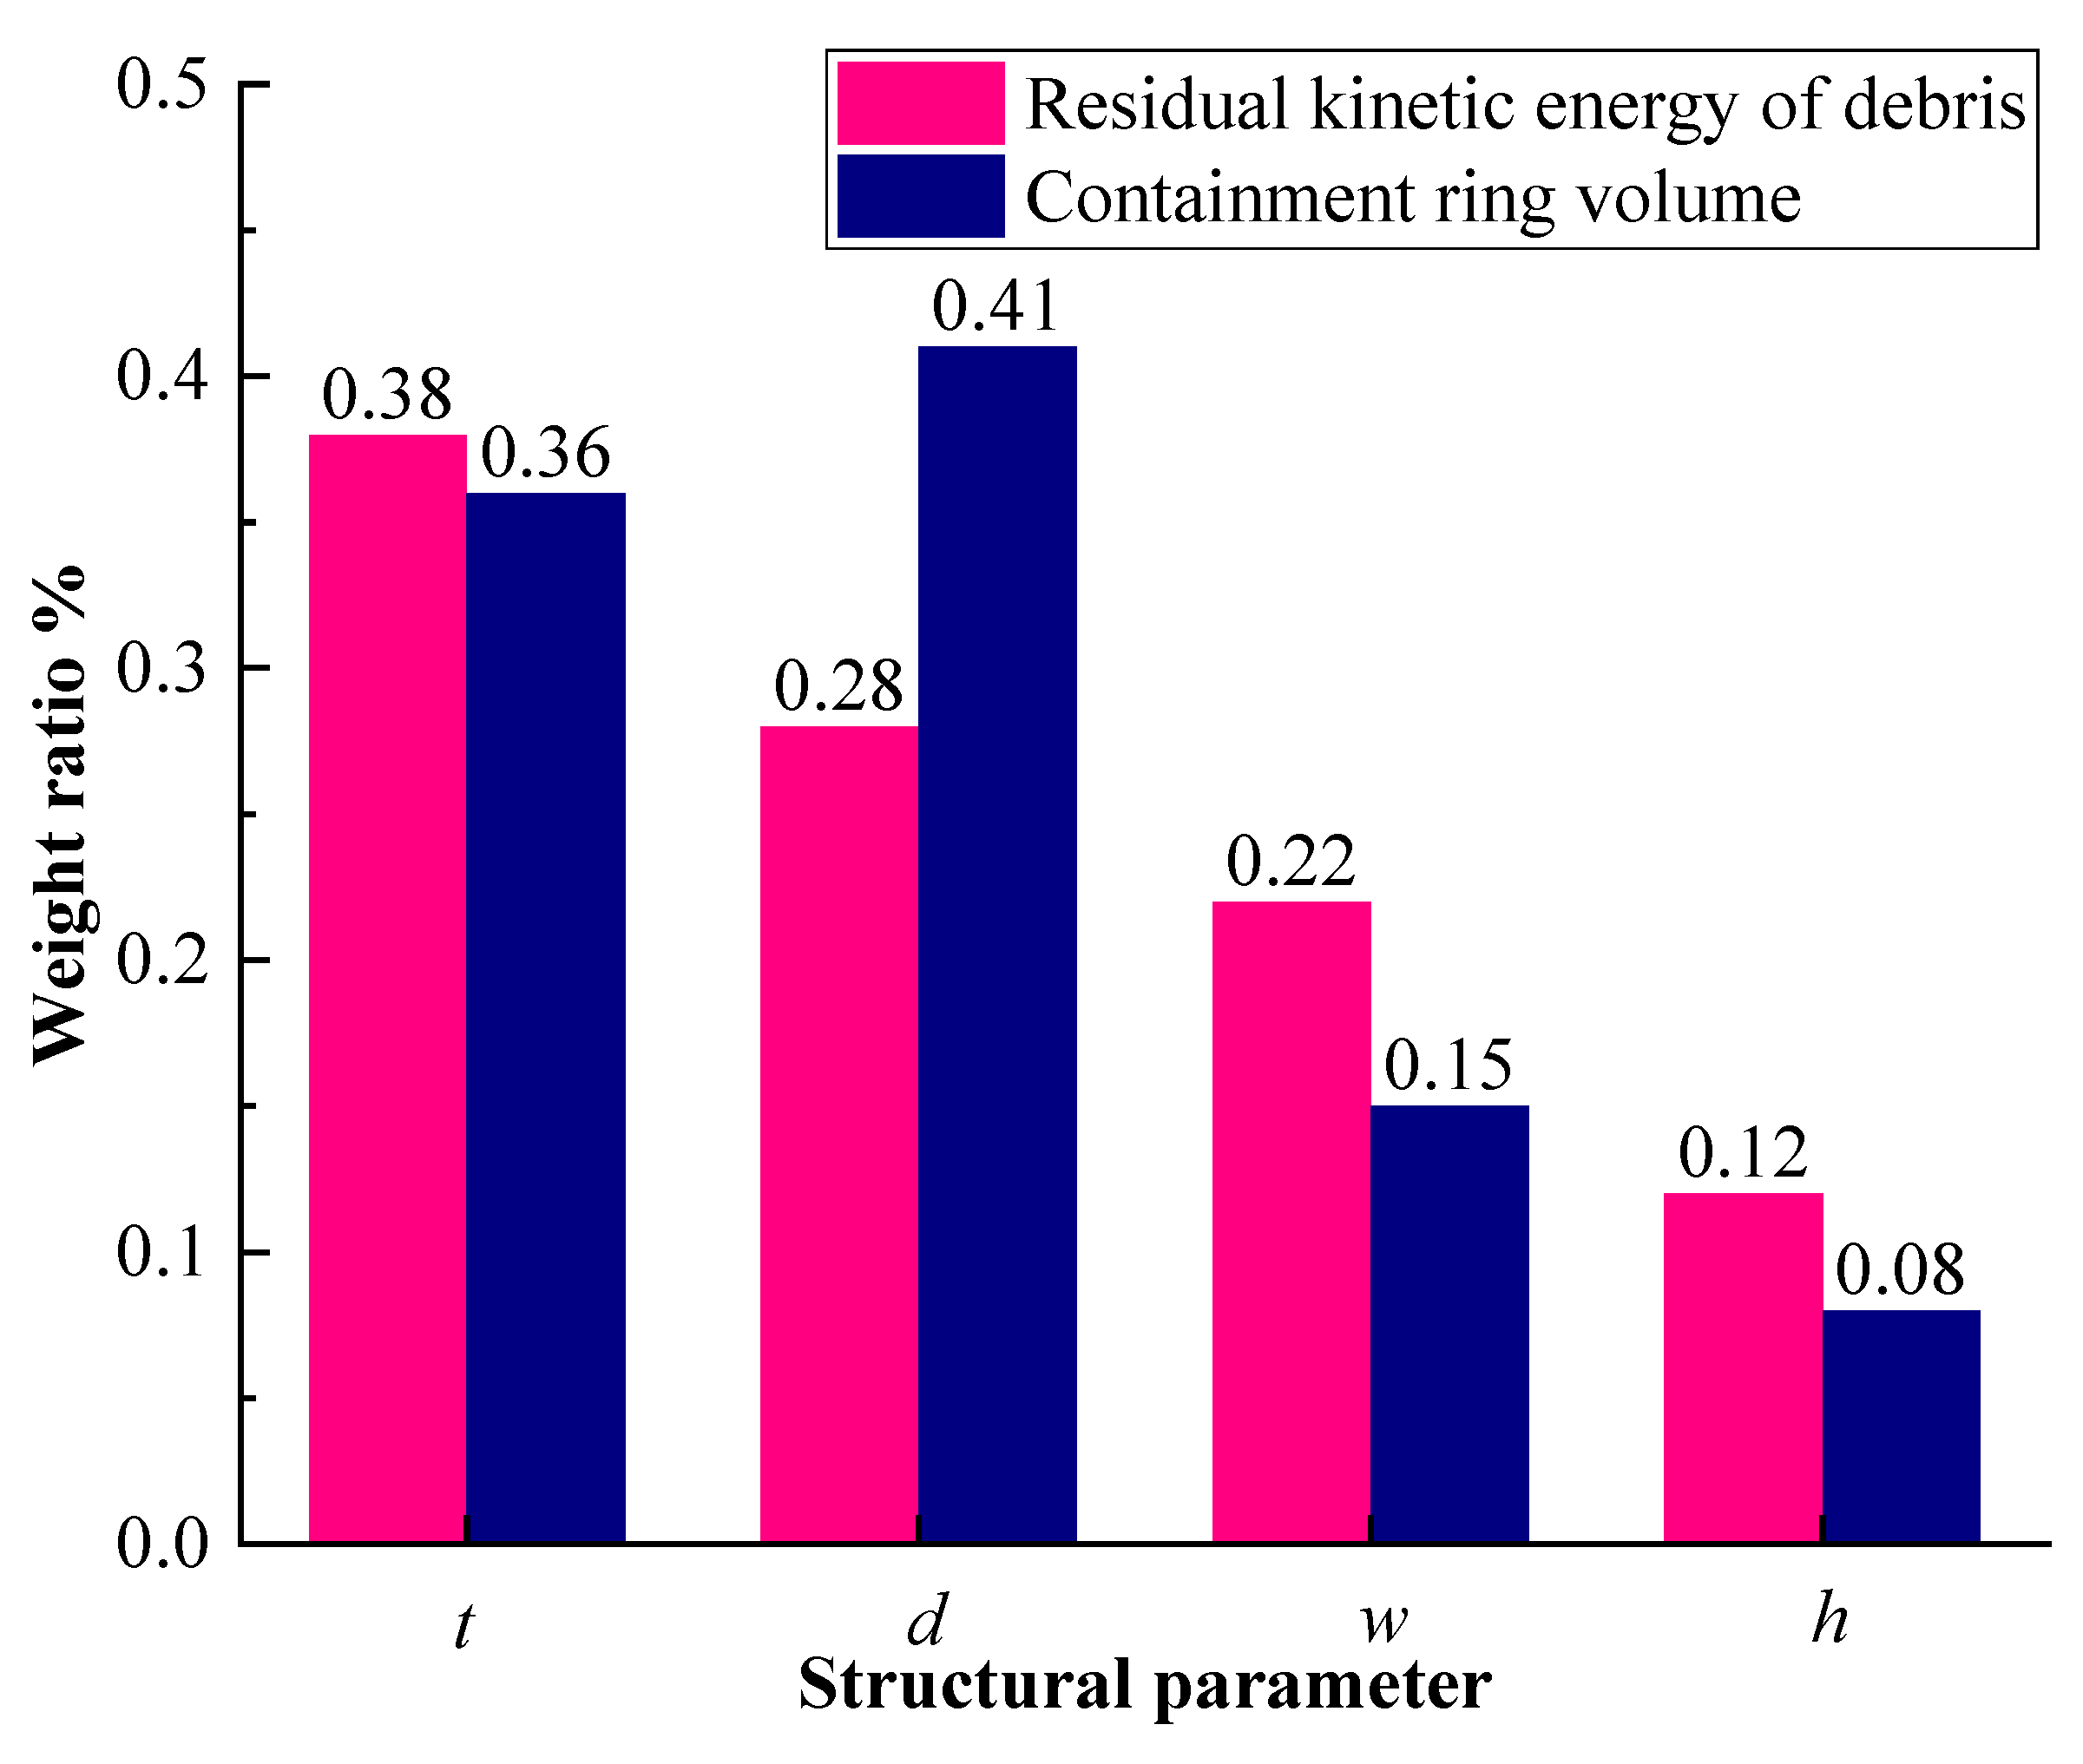
R2 = 0.92, so the response surface model is successfully built. Through calculation and analysis based on the response surface model, the influence weights of various structural parameters on the residual kinetic energy of debris and the volume of the containment ring are obtained. As shown in
Figure 9, the containment ring thickness
t is the biggest factor affecting the residual kinetic energy of debris, accounting for nearly 38% of the weight. The parameters
d,
w, and
h decrease in sequence.
3.5. Optimization Results and Analysis
Considering the spatial location restrictions of other external components, the containment condition is set so that the containment ring will not be broken and the outer diameter deformation does not exceed 40% [
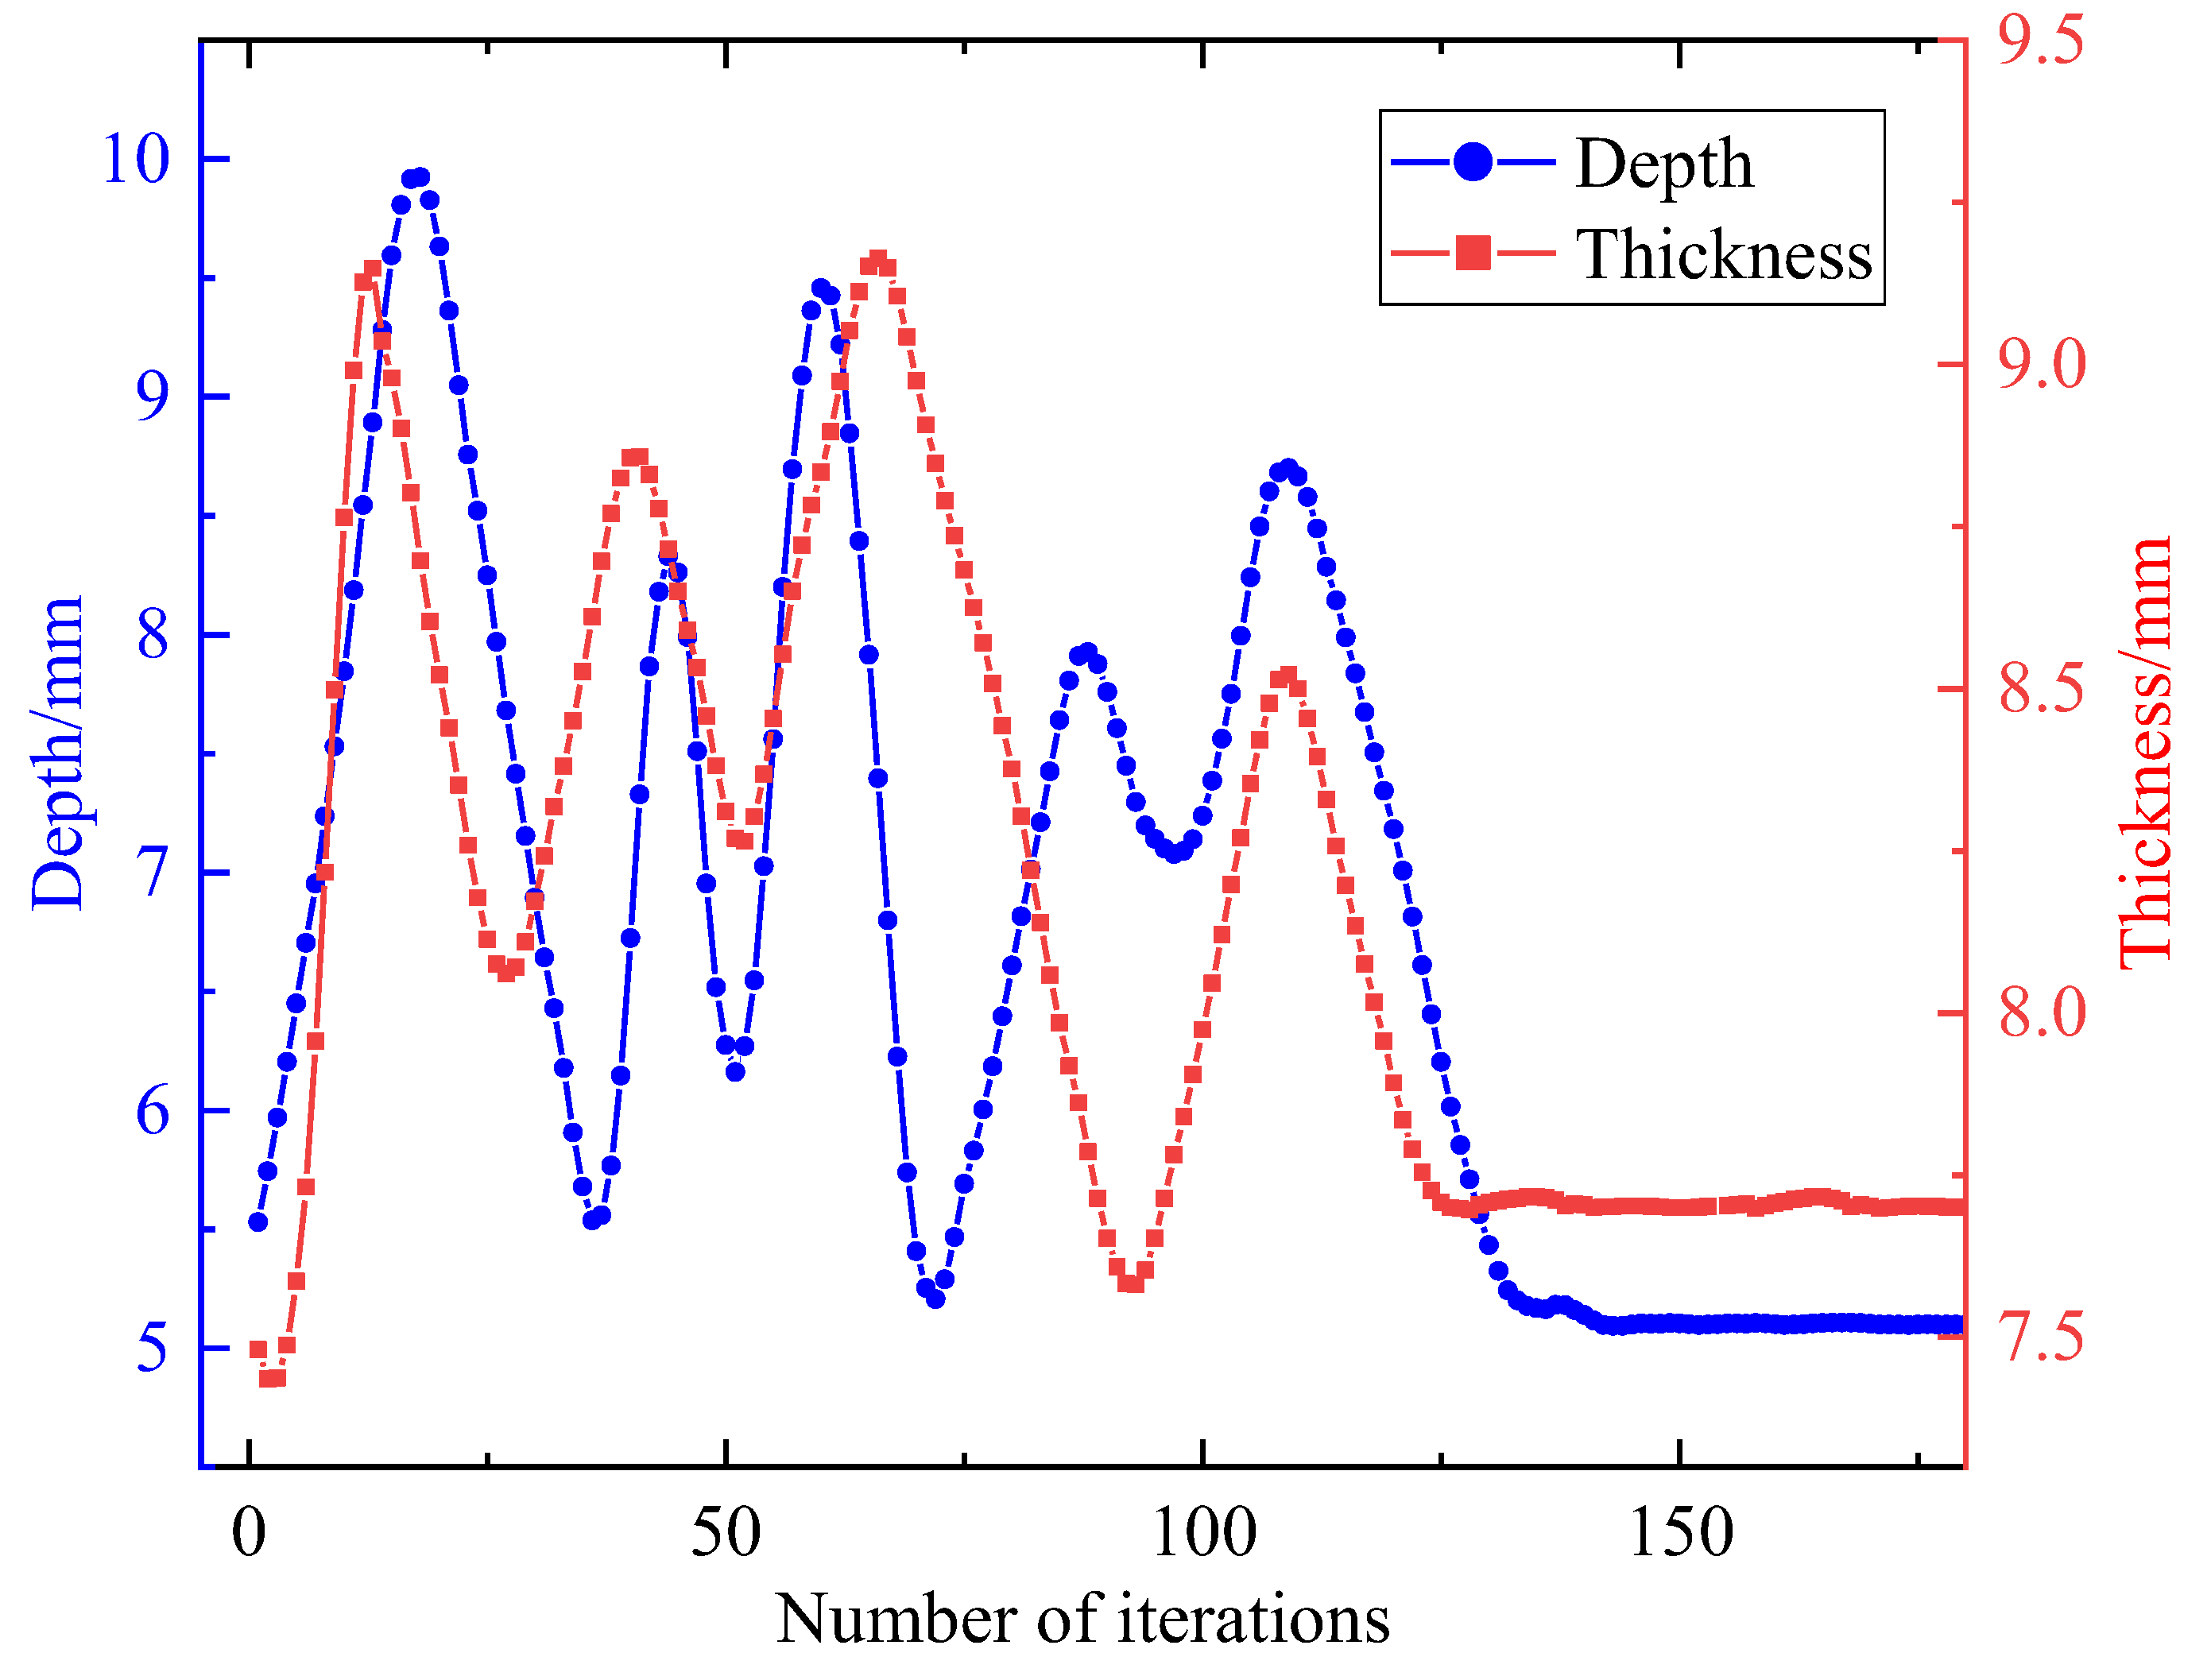
12]. The iterative optimization process is shown in
Figure 10. Parameters of containment ring thickness and groove depth converge after 130 iterations.
The structure of the initial U-type containment ring was optimized, and the parameters before and after optimization are shown in
Table 5. The weight of the optimized containment ring is 1421 g, and the weight reduction effect reaches 26.5%. All parameters of the optimized containment ring meet the constraint conditions.
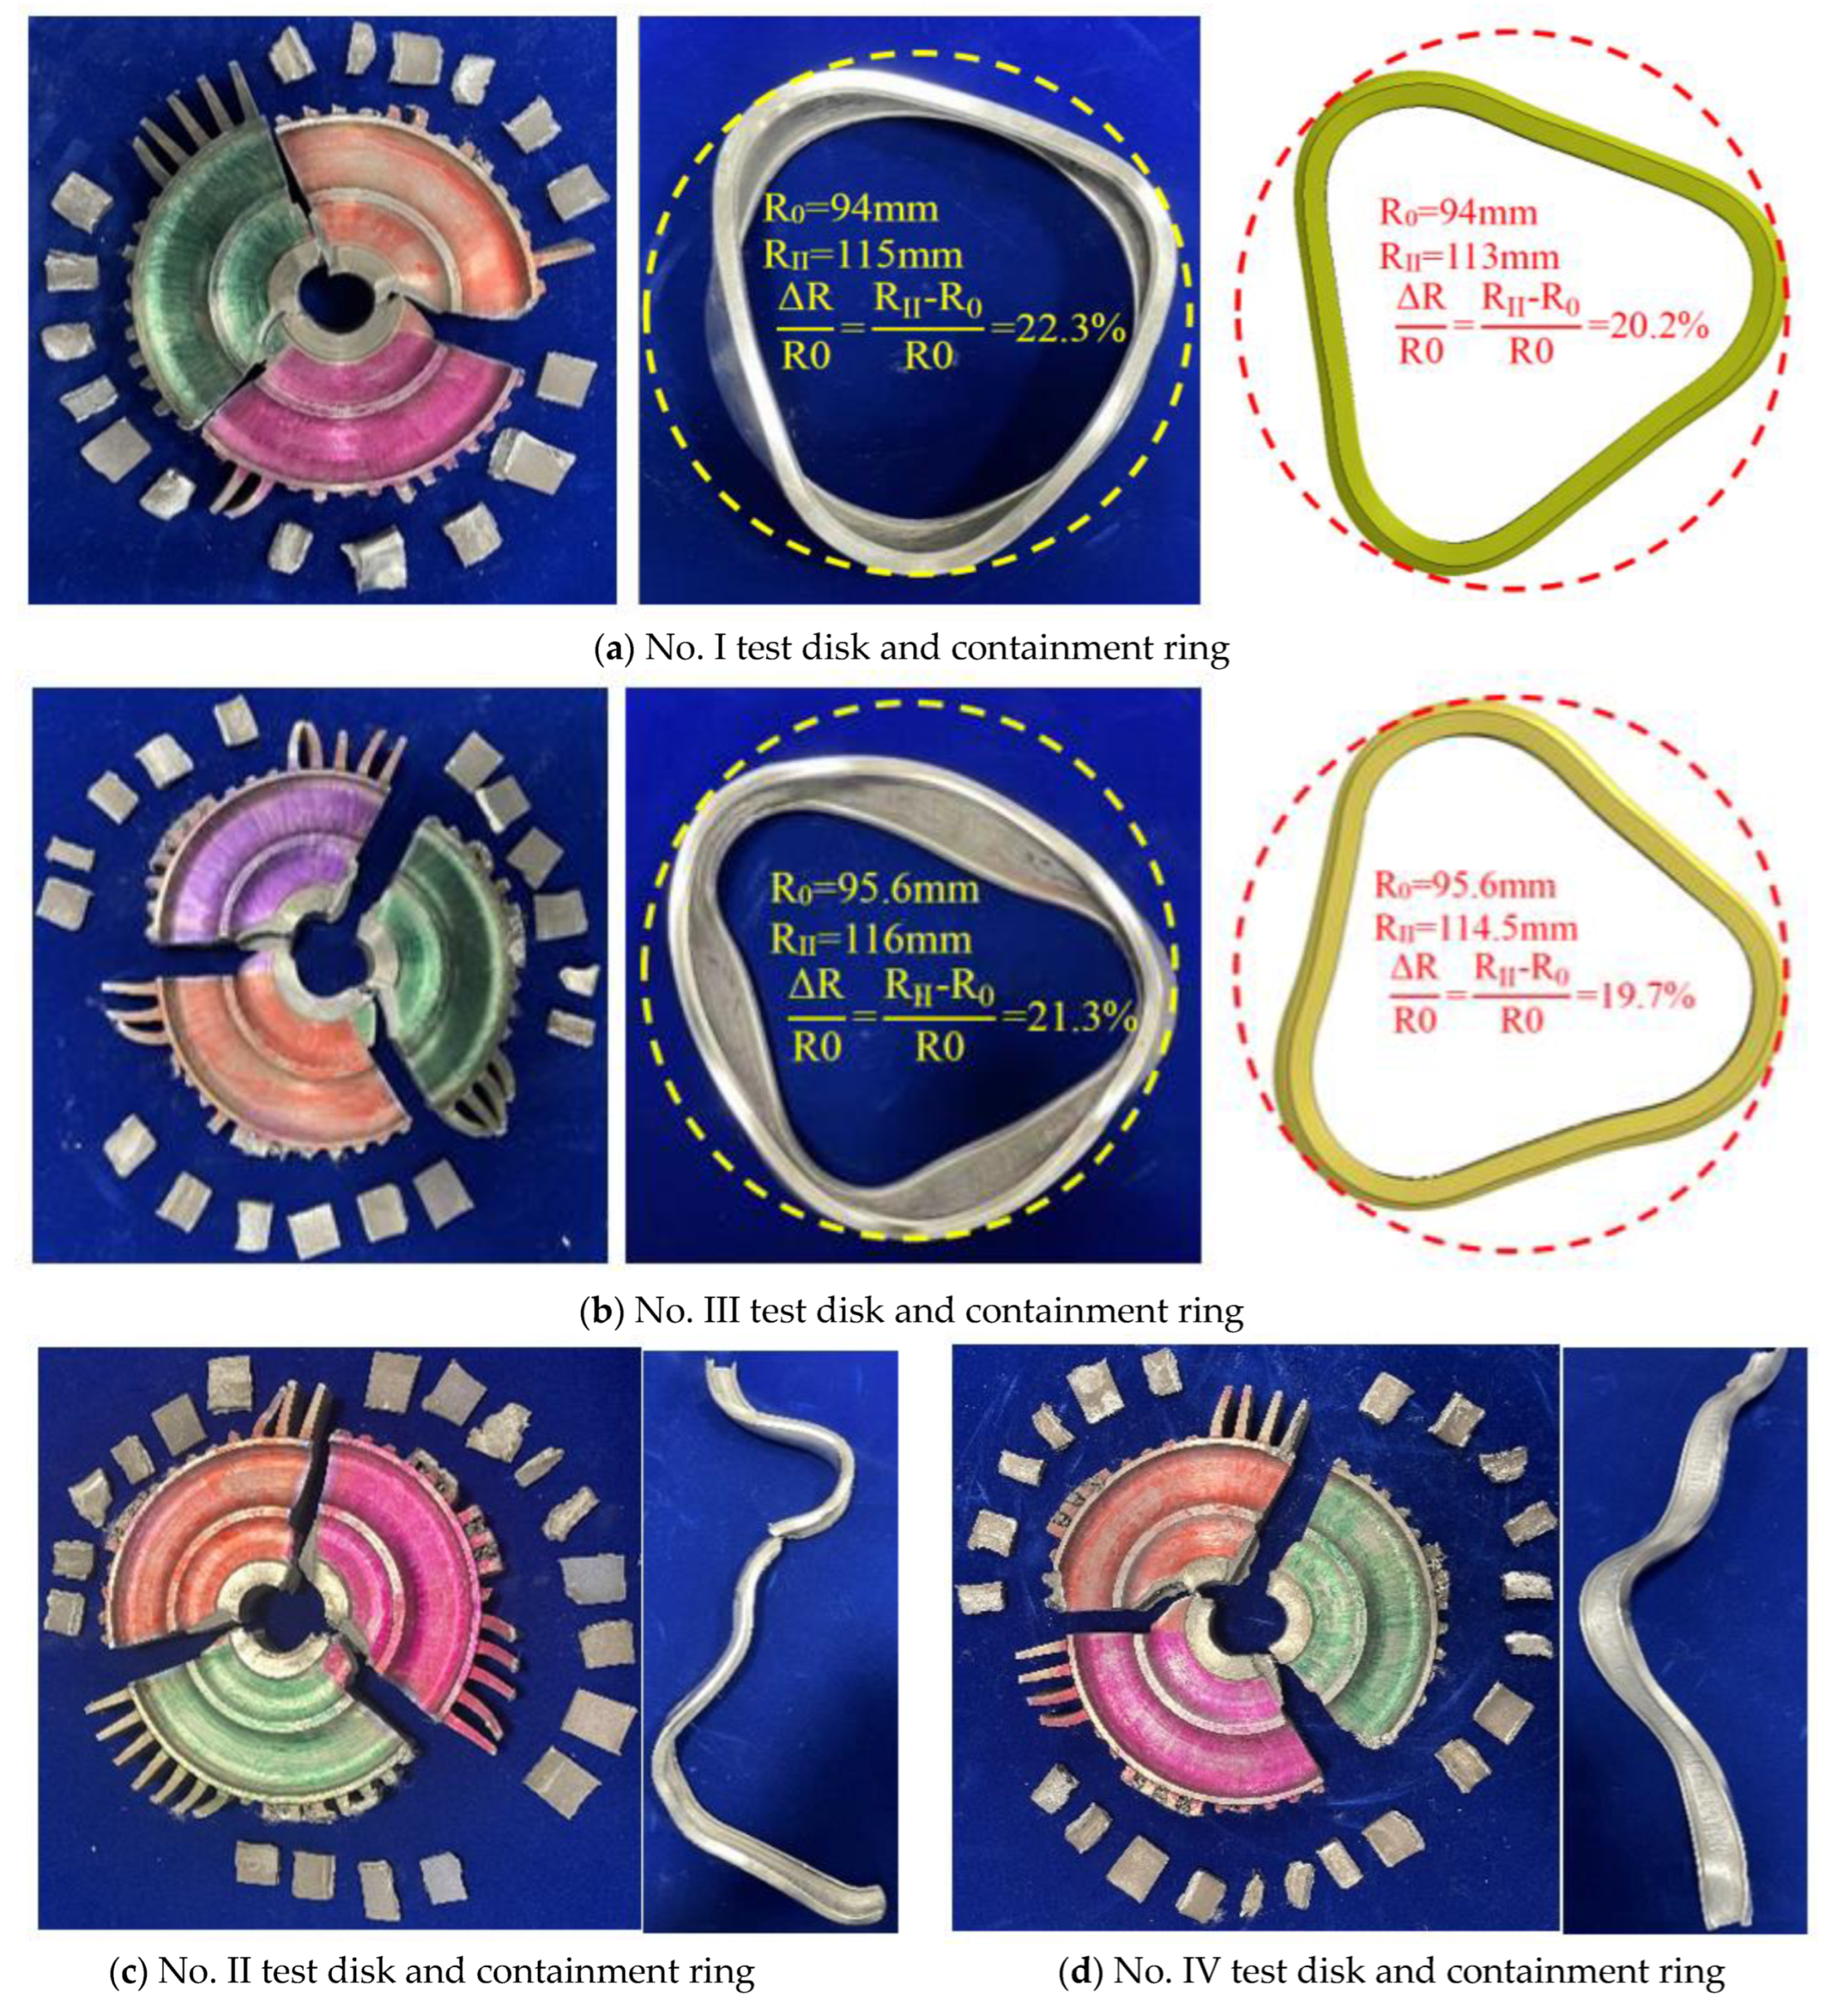
In order to verify the containment capacity of the optimized containment ring and explore the influence of parameters, such as the thickness and groove depth of the containment ring on the containment capacity, containment rings with the four structural parameters shown in
Table 6 were designed according to the above optimization results for simulation analysis. The calculated rotation speed was 90,000 r/min. The No. I containment ring was defined as the containment state by the simulation results. The containment rings No. I and No. II were selected for comparative analysis with different ring thicknesses, while the groove depth of the ring was the same. Containment rings No. II and No. III were selected for comparison. While the containment ring thickness was kept the same, the containment capability increased with the groove depth of the ring. Finally, the containment rings No. I and No. IV are selected to compare and analyze the influence of groove depth reduction to a certain extent on the containment when the thickness is the same.
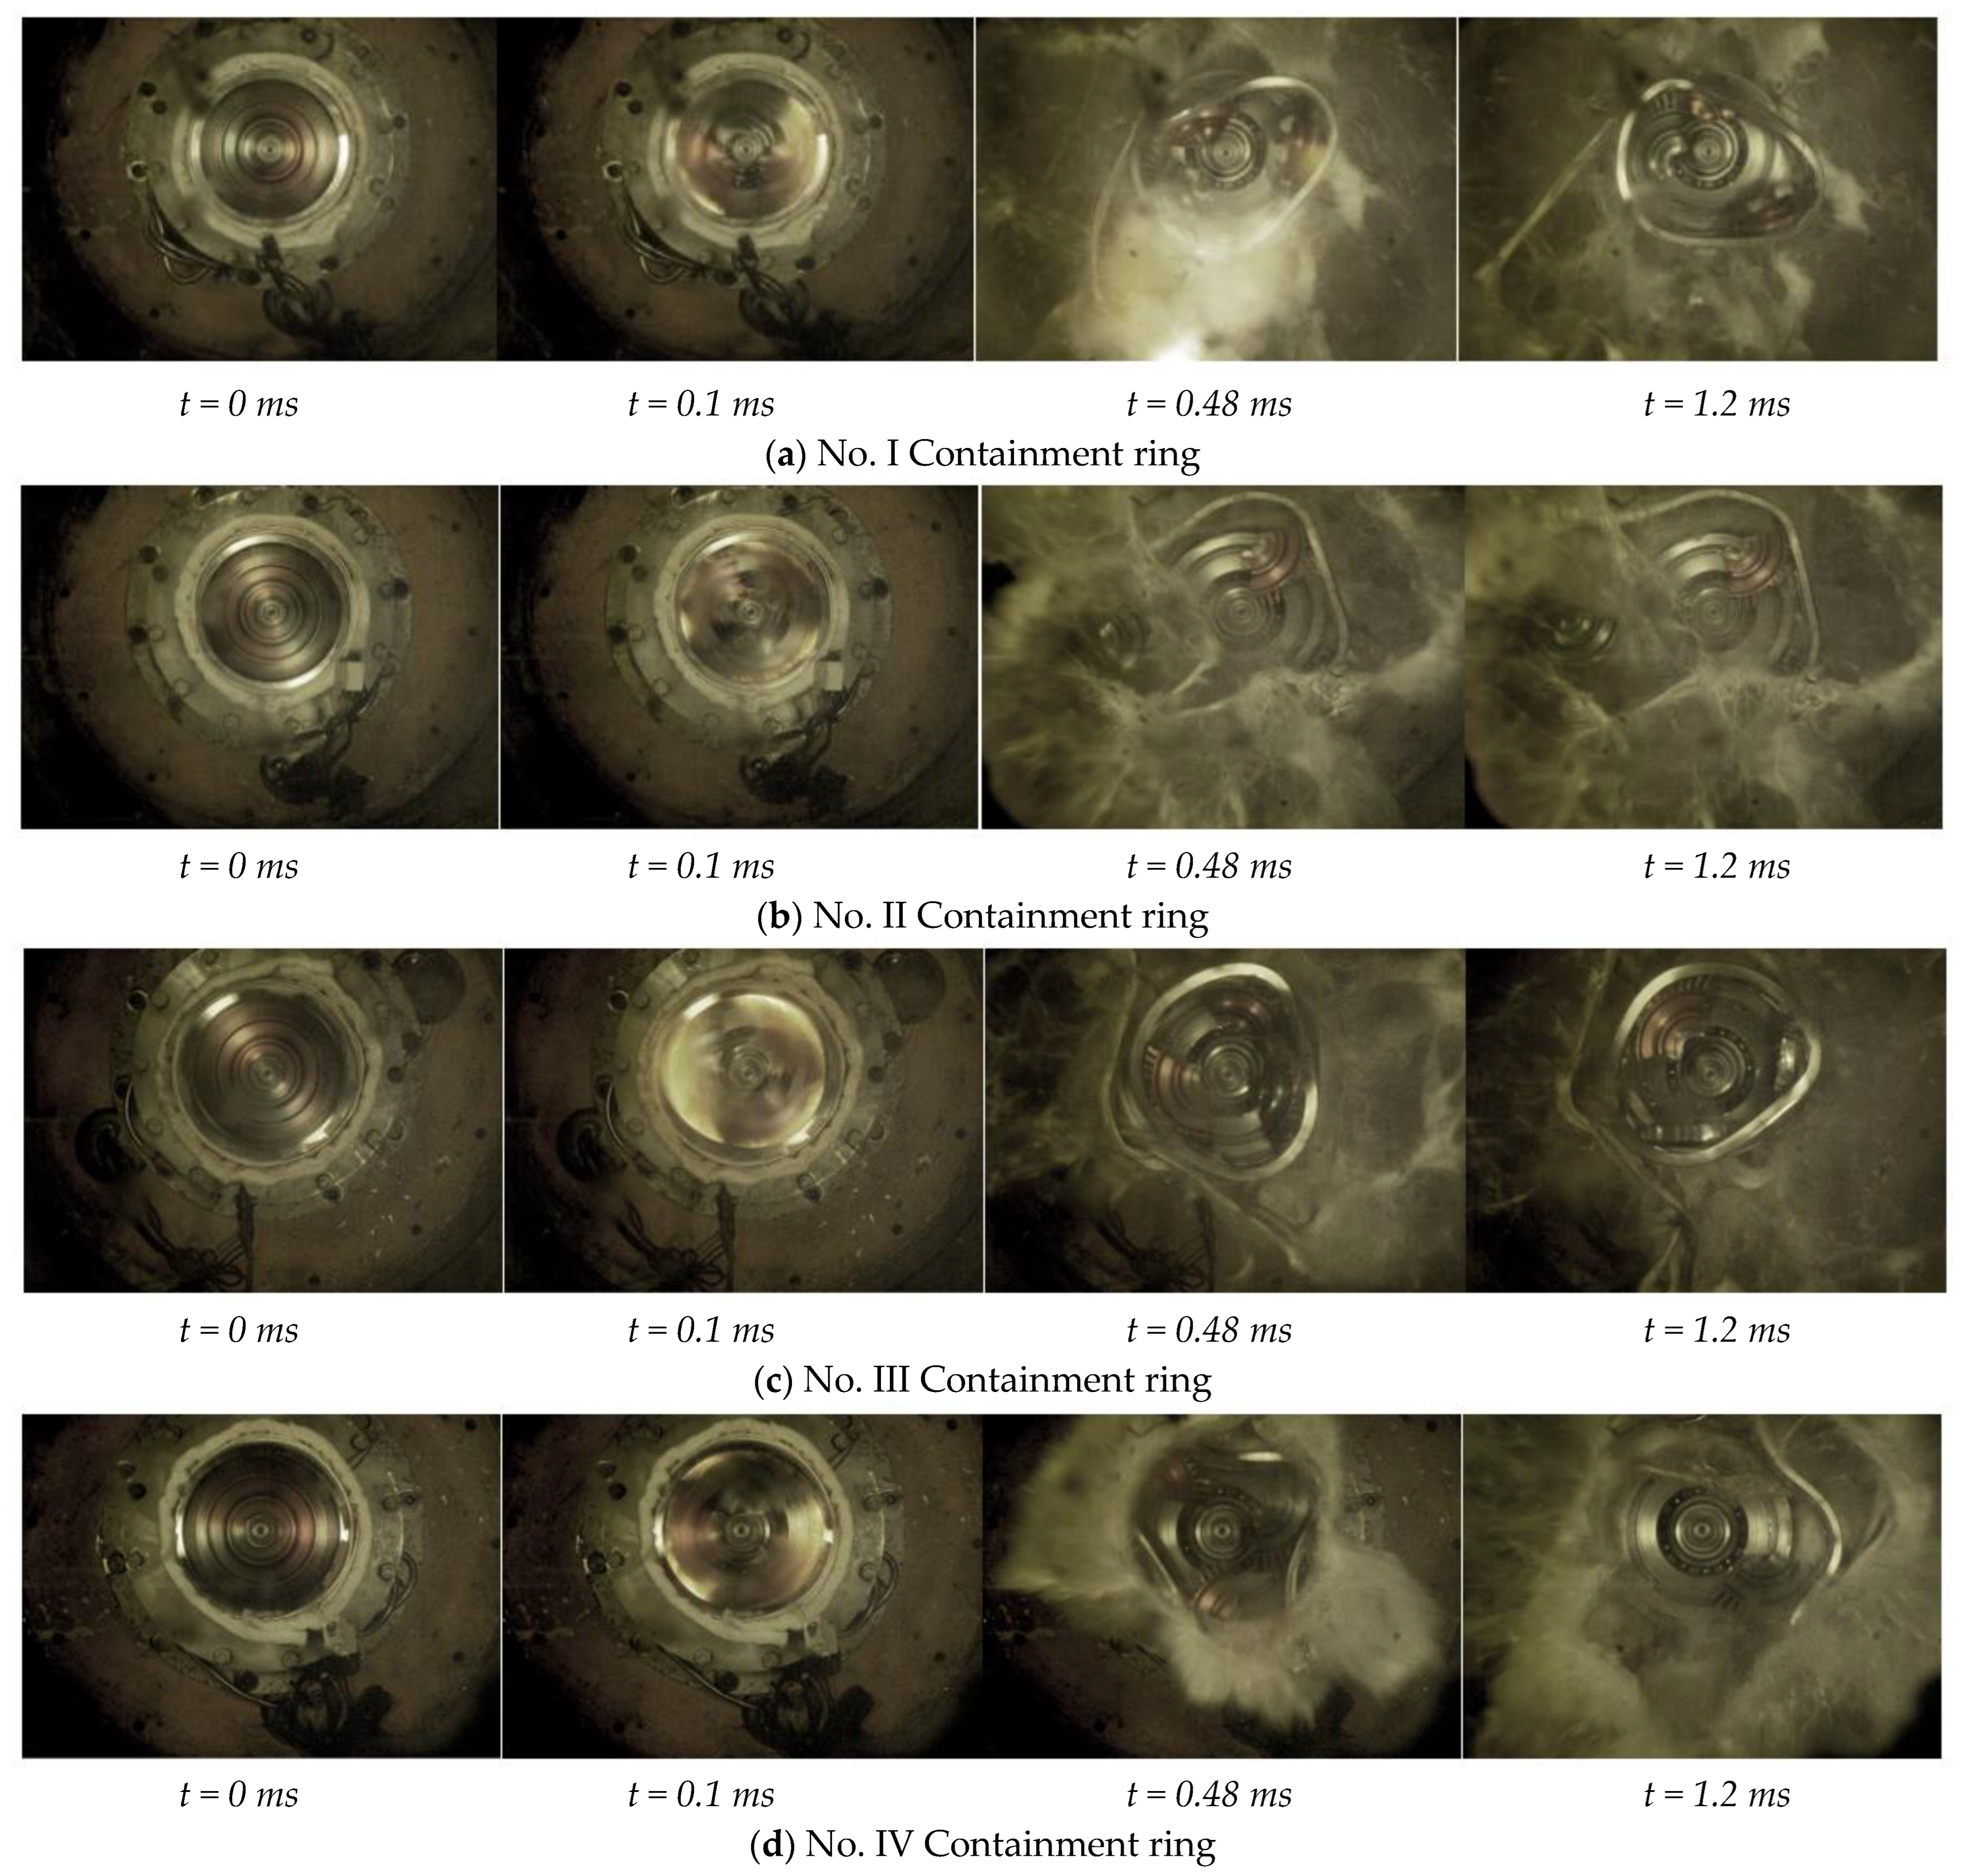
Figure 11 is the result of a numerical simulation with optimized parameters. Containment ring No. I:
t = 7.9 mm,
d = 6.1 mm; the simulation result is containment. In the simulation results, when
t = 0.09 ms, the turbine rotates into three equal parts and has an impact on the containment ring. Subsequently, the turbine disc blades rub against the inner wall of the containment ring, resulting in blade damage and spatter. The containment ring gradually becomes a triangle. Containment ring No. II:
t = 7.6 mm,
d = 6.1 mm. The simulation result is non-containment. When
t = 0.09 ms, the turbine disc rotates in three equal parts and impacts the containment ring. When
t = 0.09~0.48 ms, friction occurs between the turbine disc blades and the inner wall of the containment ring, and the blades are damaged. When
t = 0.48 ms, the containment ring began to break. When
t = 1.2 ms, the containment ring was evenly pulled into three sections. By comparing the simulation results of No. I and No. II containment rings, it can be seen that the containment capacity can be improved by increasing the thickness of the containment rings under the same groove depth.
No. III containment ring: t = 7.6 mm, d = 8.0 mm. The simulation result is the containment state. When t = 0.09 ms, the turbine disc rotates in three equal parts and impacts the containment ring. When t = 0.48 ms, the containment ring gradually becomes triangular, and the turbine disc rotates inside the ring all the time. No. IV containment ring: t = 7.9 mm, d = 5.5 mm: simulation results are non-containment. When t = 0.09 ms, the turbine disc rotates in three equal parts and impacts the containment ring. Afterwards, friction occurs between the turbine disc blades and the inner wall of the containment ring. When t = 0.48 ms, the containment ring began to break. When t = 1.2 ms, the containment ring was evenly pulled into three sections.
Through the simulation analysis of No. I, II, III, and IV containment rings, it can be seen that the containment capacity of containment rings can be improved by increasing the groove depth size under the condition of the same thickness of containment rings. However, it is worth noting that when the depth of the containment ring groove is reduced to a certain extent (d = 5.5 mm), simply increasing the thickness of the containment ring cannot improve the containment capacity of the ring. Therefore, the influence of the groove depth parameter on the containment capacity of the containment ring is second only to that of the thickness parameter, which is consistent with the weight analysis results of the structural parameters of the containment ring. The trajectory of the disk fragment may change along the axial direction during the impact with the containment ring. Therefore, improving the groove depth parameter of the containment ring can effectively limit the axial motion trajectory of disk fragments, thus improving the protective capacity of the ring.
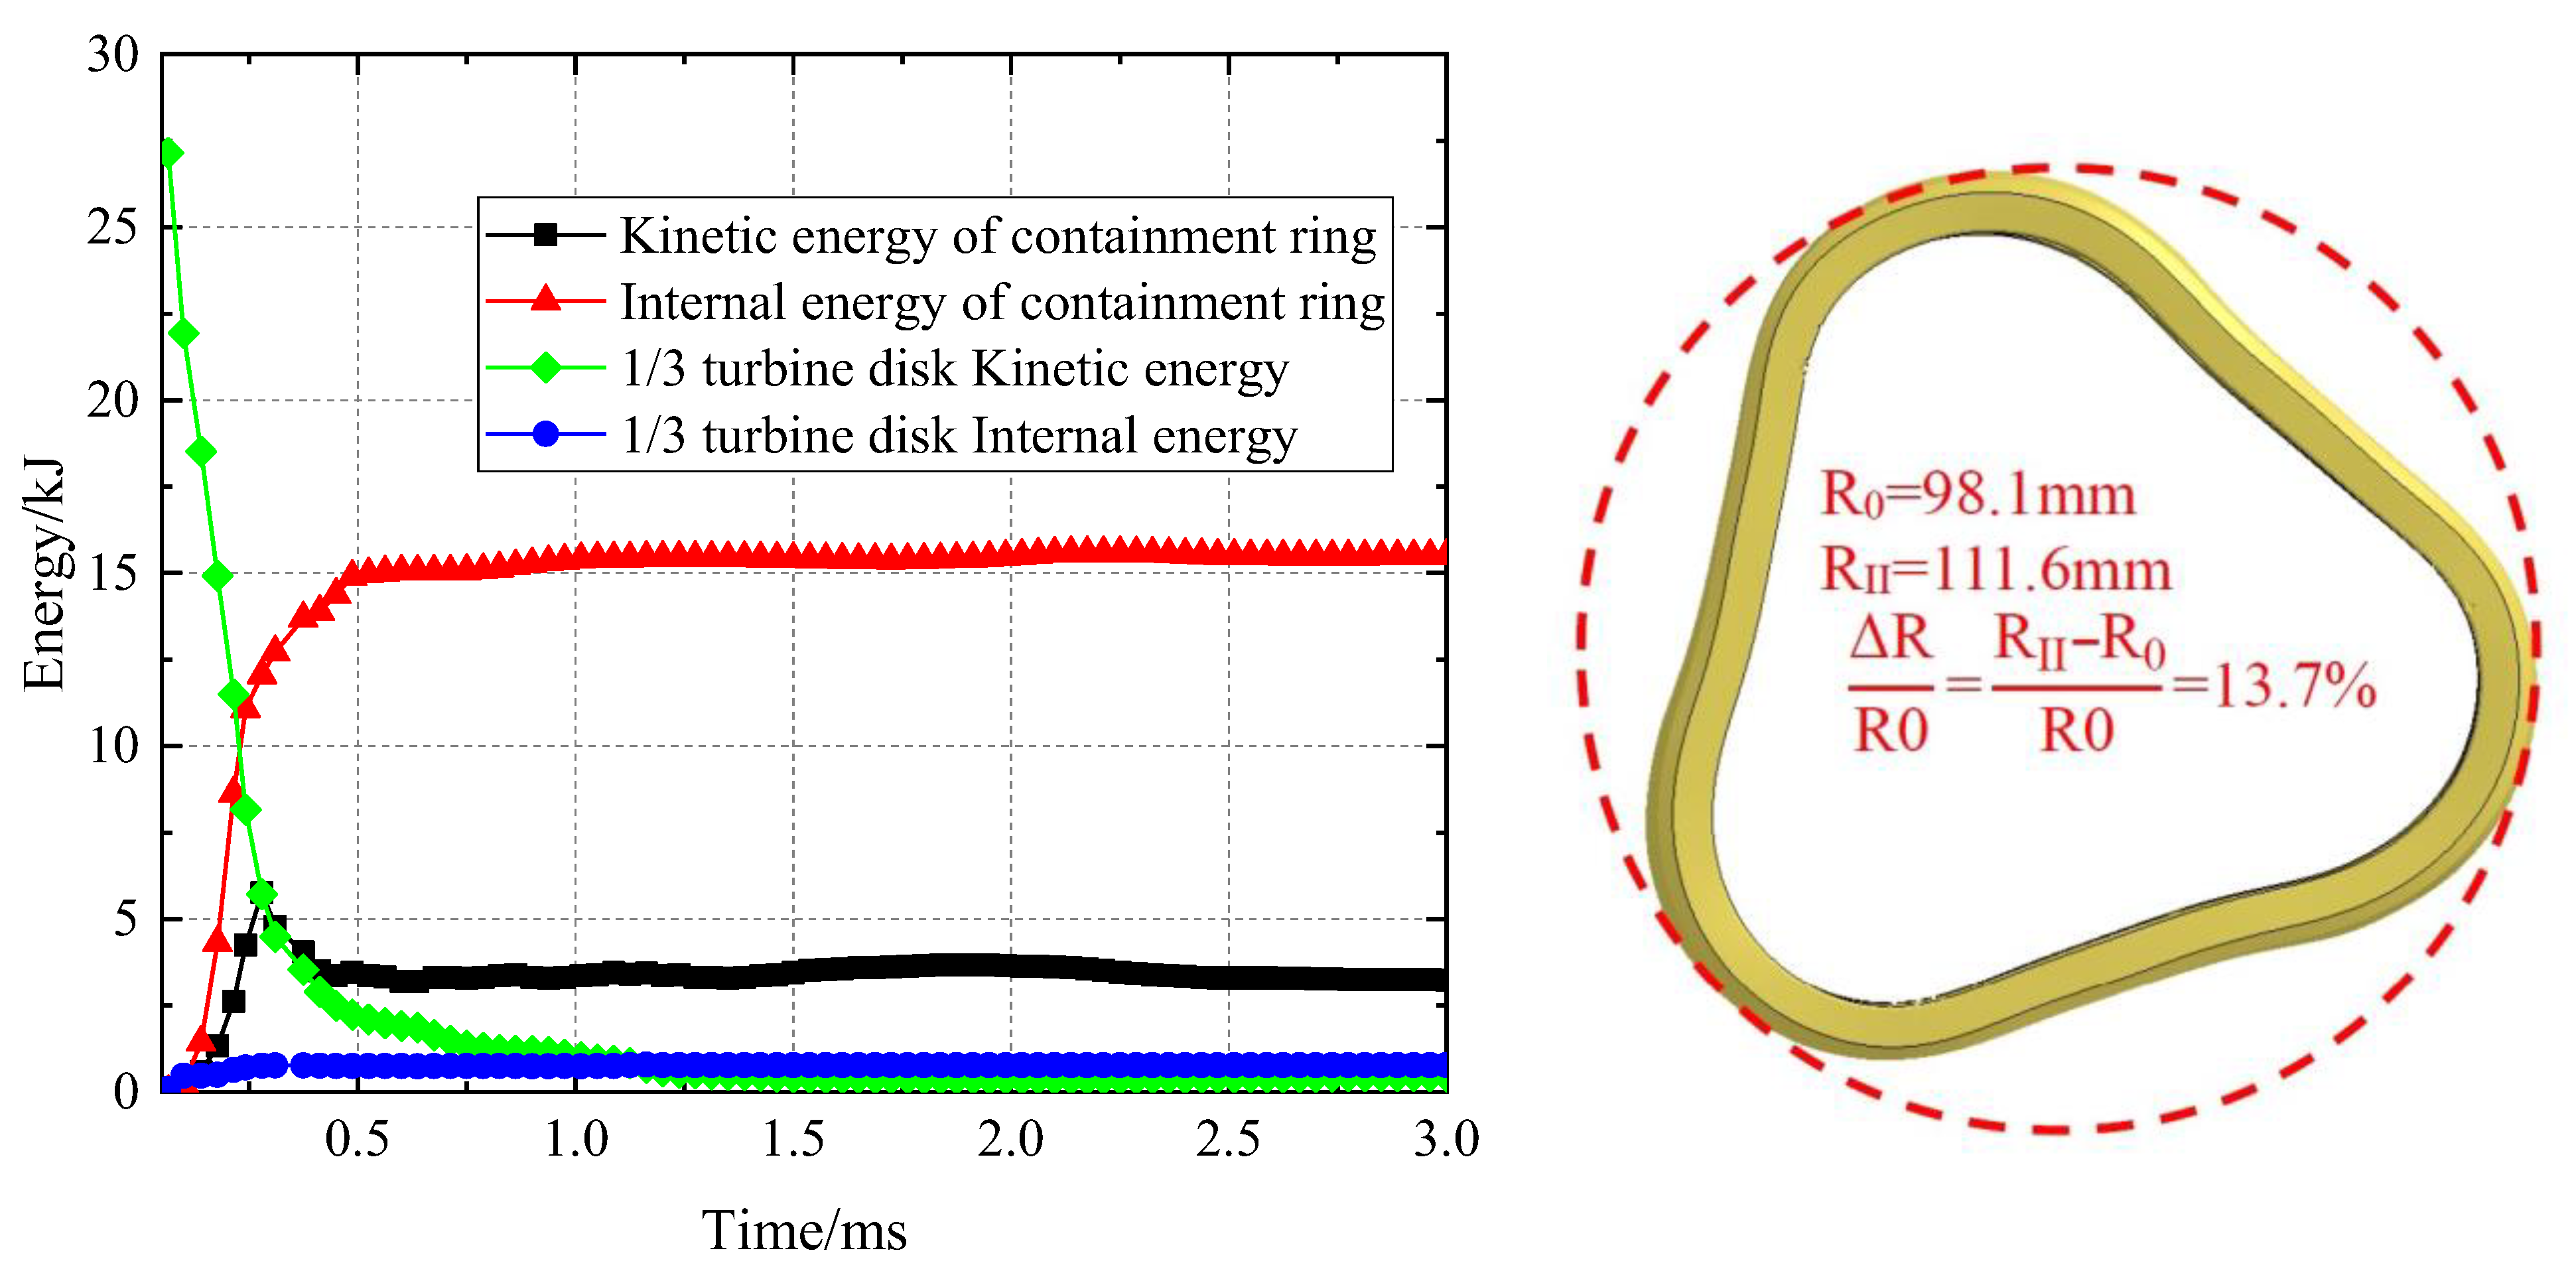
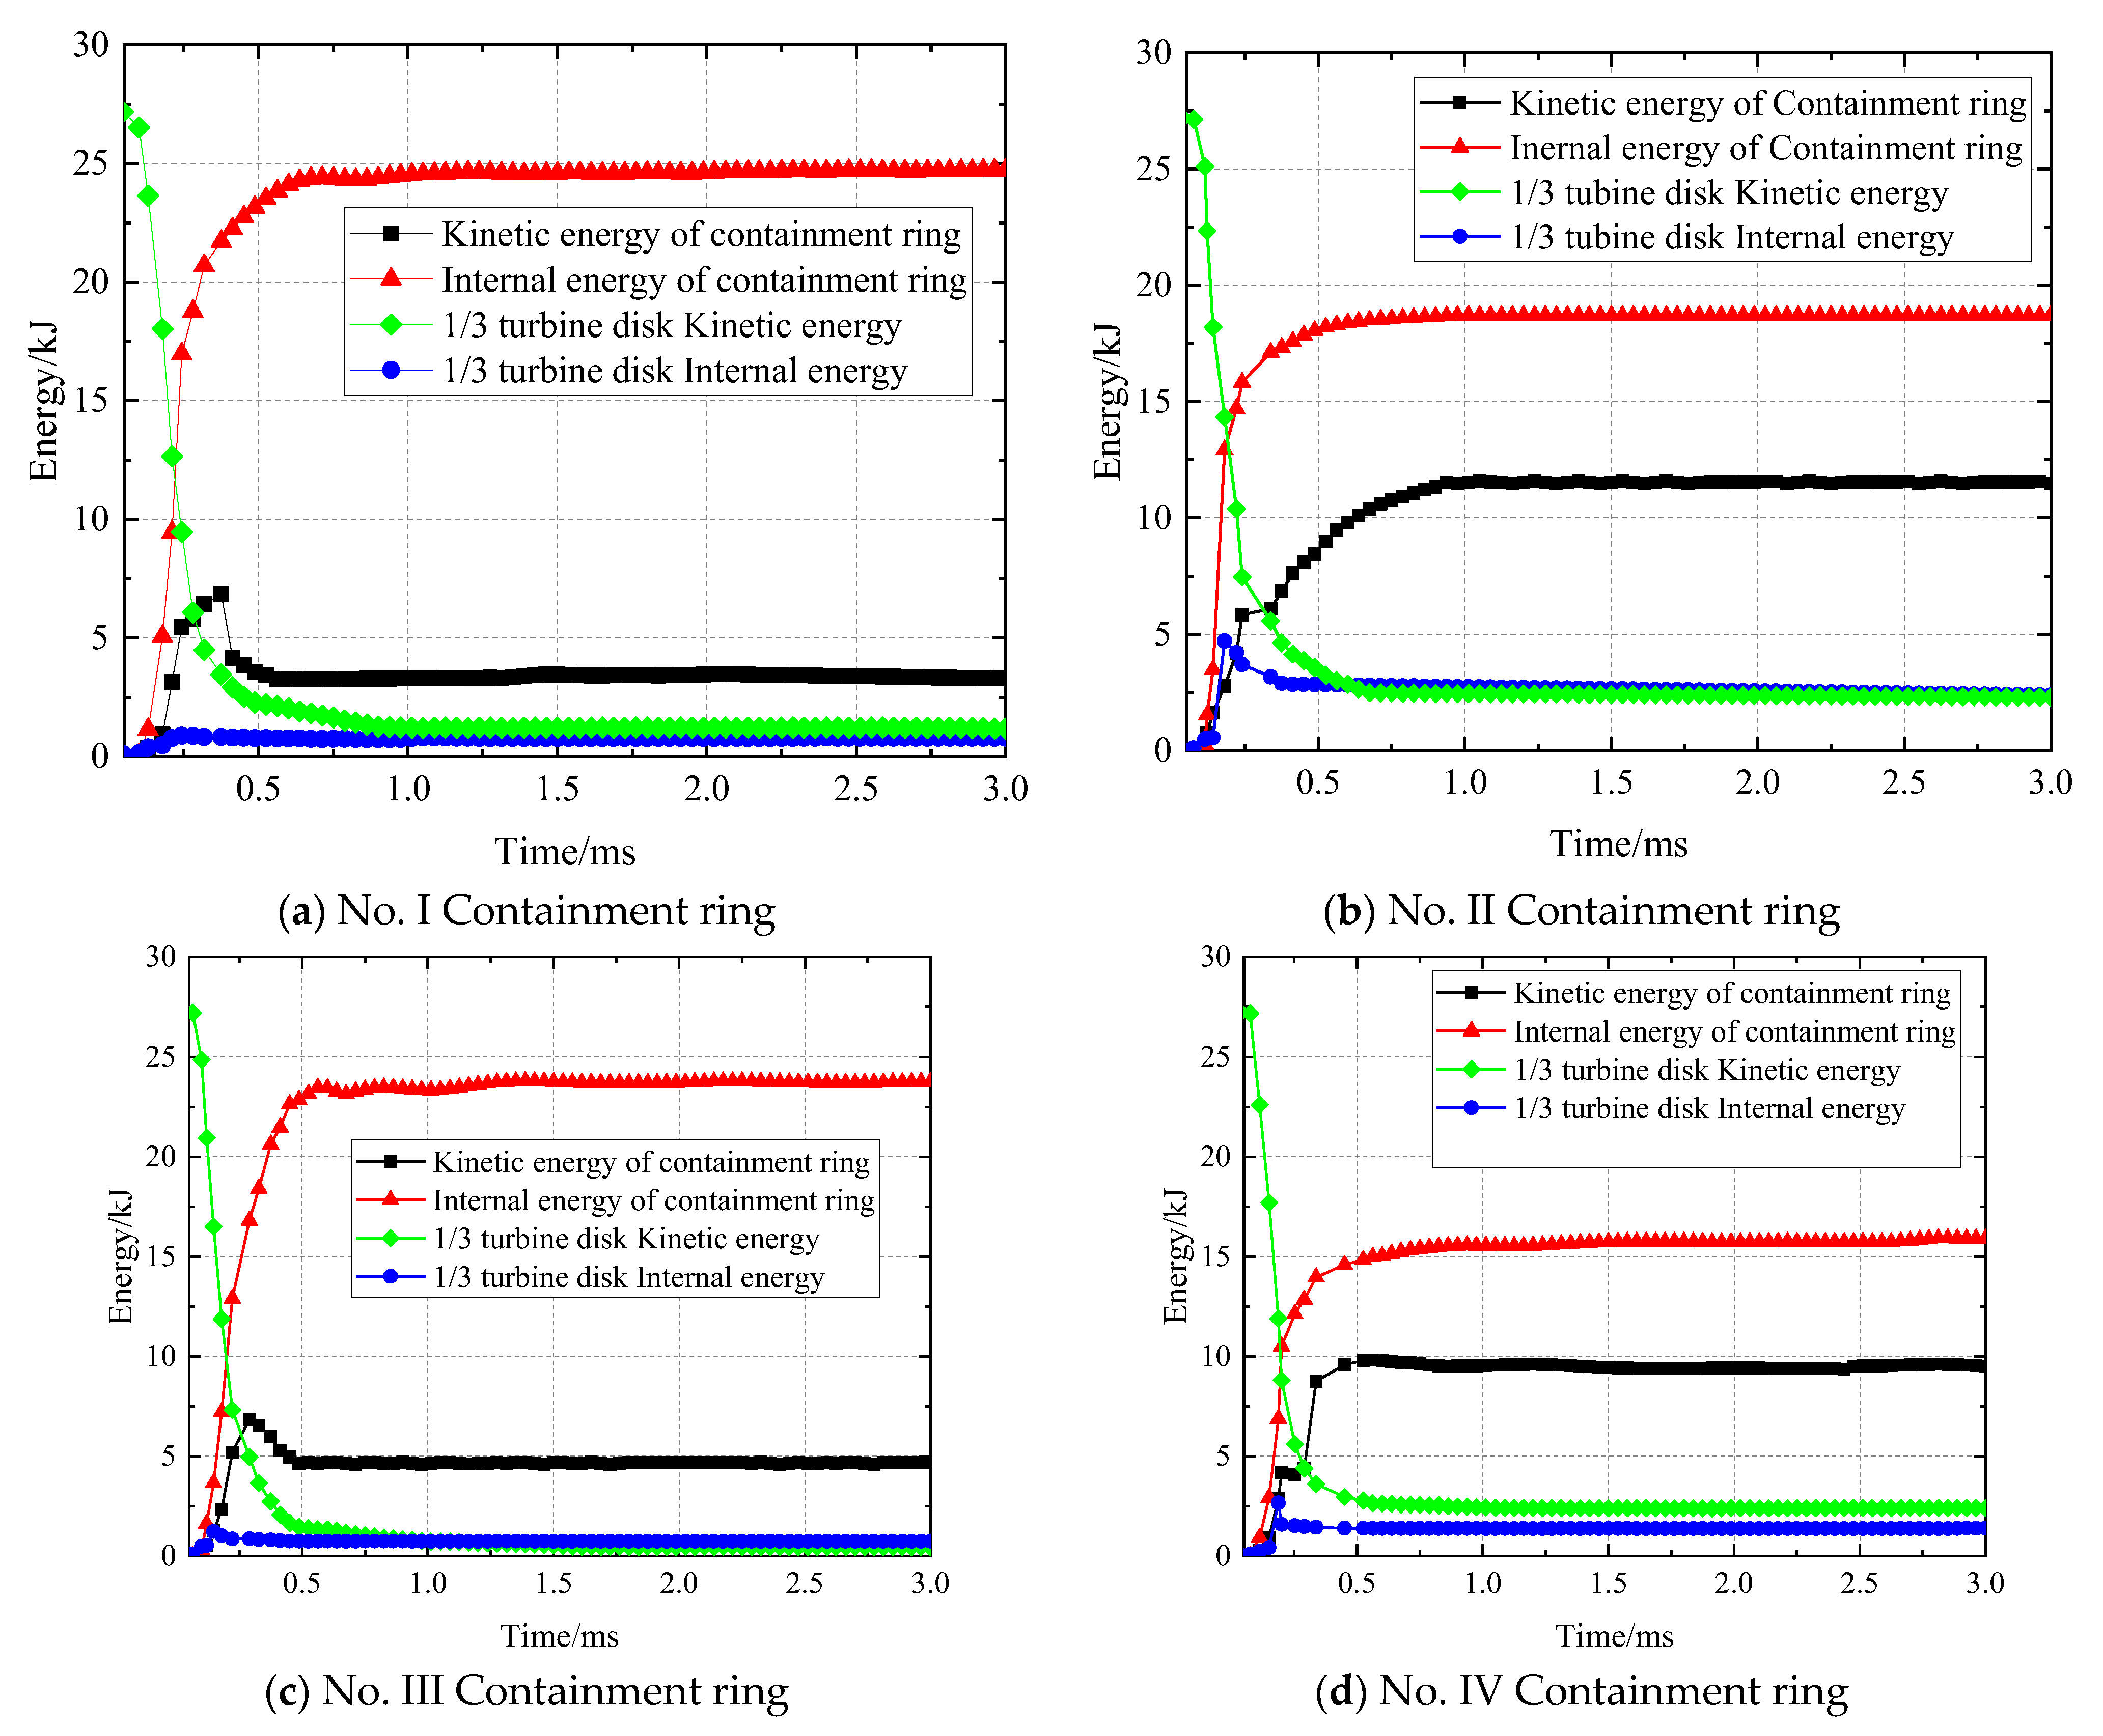
Figure 12 shows various energy variation processes in the turbine disc and containment ring. As shown in
Figure 12a, during the impact of the No. I containment ring, the energy changes rapidly within
t = 0~0.48 ms. After
t = 0.48 ms, the energy of each component basically no longer changes, and the impact process is over. In numerical simulation, the kinetic energy of 1/3 turbine disk before and after impact is
Ea = 27.2 kJ and
Ek = 1.24 kJ, respectively, and the kinetic energy decreases by 95.4%. Internal energy
Ec = 23.7 kJ of containment ring; compared with the containment ring before optimization,
Ec increased by 8.4 kJ. Obviously, because the optimized containment ring is more fully deformed and absorbs more energy, the kinetic energy of the containment ring is significantly increased. From
Figure 12b, it can be seen that during the impact of the No. II containment ring, the energy changes rapidly within
t = 0~0.48 ms. After
t = 0.56 ms, the energy of each component basically no longer changes, and the impact process is over. In numerical simulation, the kinetic energy of 1/3 turbine disk before and after impact is
Ec = 27.2 kJ and
Ek = 0.51 kJ, and the kinetic energy decreases by 98.12%.
By comparing the kinetic energy and internal energy of the containment ring during the impact, it is obvious that the containment ring absorbed most of the kinetic energy, and the internal energy increased significantly while the kinetic energy of the containment ring also increased to a certain extent. This indicates that the optimized containment ring can absorb the energy of disk fragments more effectively on the premise of providing effective containment, which is very favorable for the weight reduction design of the containment ring structure [
31].
