1. Introduction
The application of composite materials in the aerospace industry is rapidly increasing, particularly in critical areas such as the turbine engine fan case where impact resistance is essential. Designing safe and lightweight structures with high toughness poses a significant challenge for the next generation of aircraft. The definition of reliable advanced computational analysis methods is a key factor to reduce the design and certification timeline for new composite materials used in future aircraft structures. Many research studies are currently involved in the definition of a physical-based numerical modeling technique that can be adopted to design and validate aeronautical structures subjected to several types of impact loads [
1,
2,
3]. Aerospace composite structures are known for their exceptional mechanical performances and lightness. However, composites are vulnerable and prone to failure due to the brittle nature of the resin-matrix constituent when subjected to a low- and high-velocity impact. Delaminations and back-face failure are only a few examples of visible impact damage associated with low- and high-energy impact damage. The uncertainty in modeling and experimental investigations is such that often composite structures are over-designed to ensure the necessary residual strength after impact, and as a result, the potential gain that can be achieved is reduced. To minimize uncertainties and improve the fidelity of the numerical and mathematical models used, NASA and FAA started the Advanced Composite Project (ACP), a joint research long-term collaboration in which the main purpose was to develop a reliable physical-based modeling methodology to evaluate High Energy Dynamic Impact events over aerospace composite structures [
4,
5,
6]. The APC was focused on the application of reliable numerical solutions [
7] to reduce the development and certification timeline for new composite aeronautics structures. However, the convergence and representativeness of several specific tools have to be validated to achieve a complex framework useful for the evaluation of structures when subjected to quasi-static and impact loads. Composite failure initiation and propagation is a highly localized phenomenon dependent on the mesoscale interaction of defects (pre-existing and generated) with the two constitutive material phases: fiber and matrix. For this reason, several studies have been conducted by NASA to characterize and reproduce the experimental observations with different proposed FE solutions and characteristic material formulations [
4]. A new composite material model incorporating deformation, damage, and failure has been developed and implemented in LS-DYNA under the ACP project [
8,
9,
10,
11,
12,
13]. The material model includes an elastoplastic damage representation, and it is meant to be a fully generalized representation suitable for a large number of composite architectures.
Several sensing technologies are currently available to detect, localize, and quantify the damage of an entire structure. Structural health monitoring (SHM) seeks to perform most of these tasks. In particular, the application of infrared thermography can be easily used to visualize interlaminar and intralaminar damage in a safe and cost-effective way. High-energy impact events are commonly defined as an adiabatic thermodynamic closed process, where the energy released after the initiation and the propagation of the fracture surface is entirely converted into internal heat. The conductive and convective heat exchange with the external environment is negligible due to the rapid evolution of the physical phenomenon. Several research results have been proposed in the literature to monitor the behavior and the energy absorption of unidirectional and woven composites during low-velocity Charpy impact experiments or drop tests [
14,
15,
16,
17,
18,
19,
20]. Temperature peaks up to 45 °C have been produced for a reduced range of kinetic energies (20–30 J) [
20]. On the other hand, the experimental high-velocity tests conducted with a light gas gun have shown a localized temperature increment above 200 °C in the specific active fracture zone (AFZ) [
21]. The localized thermal gradient generated by the friction of the impactor against the composite panel and also by the energy released during the fracture evolution can typically increase the local material temperature up to the characteristic glass transition temperature threshold of aerospace-grade epoxy resin. Therefore, it is fundamental to understand how the localized increment of temperature can affect the viscoelastic behavior of the resin and how this phenomenon can influence the high-velocity impact performance of a composite [
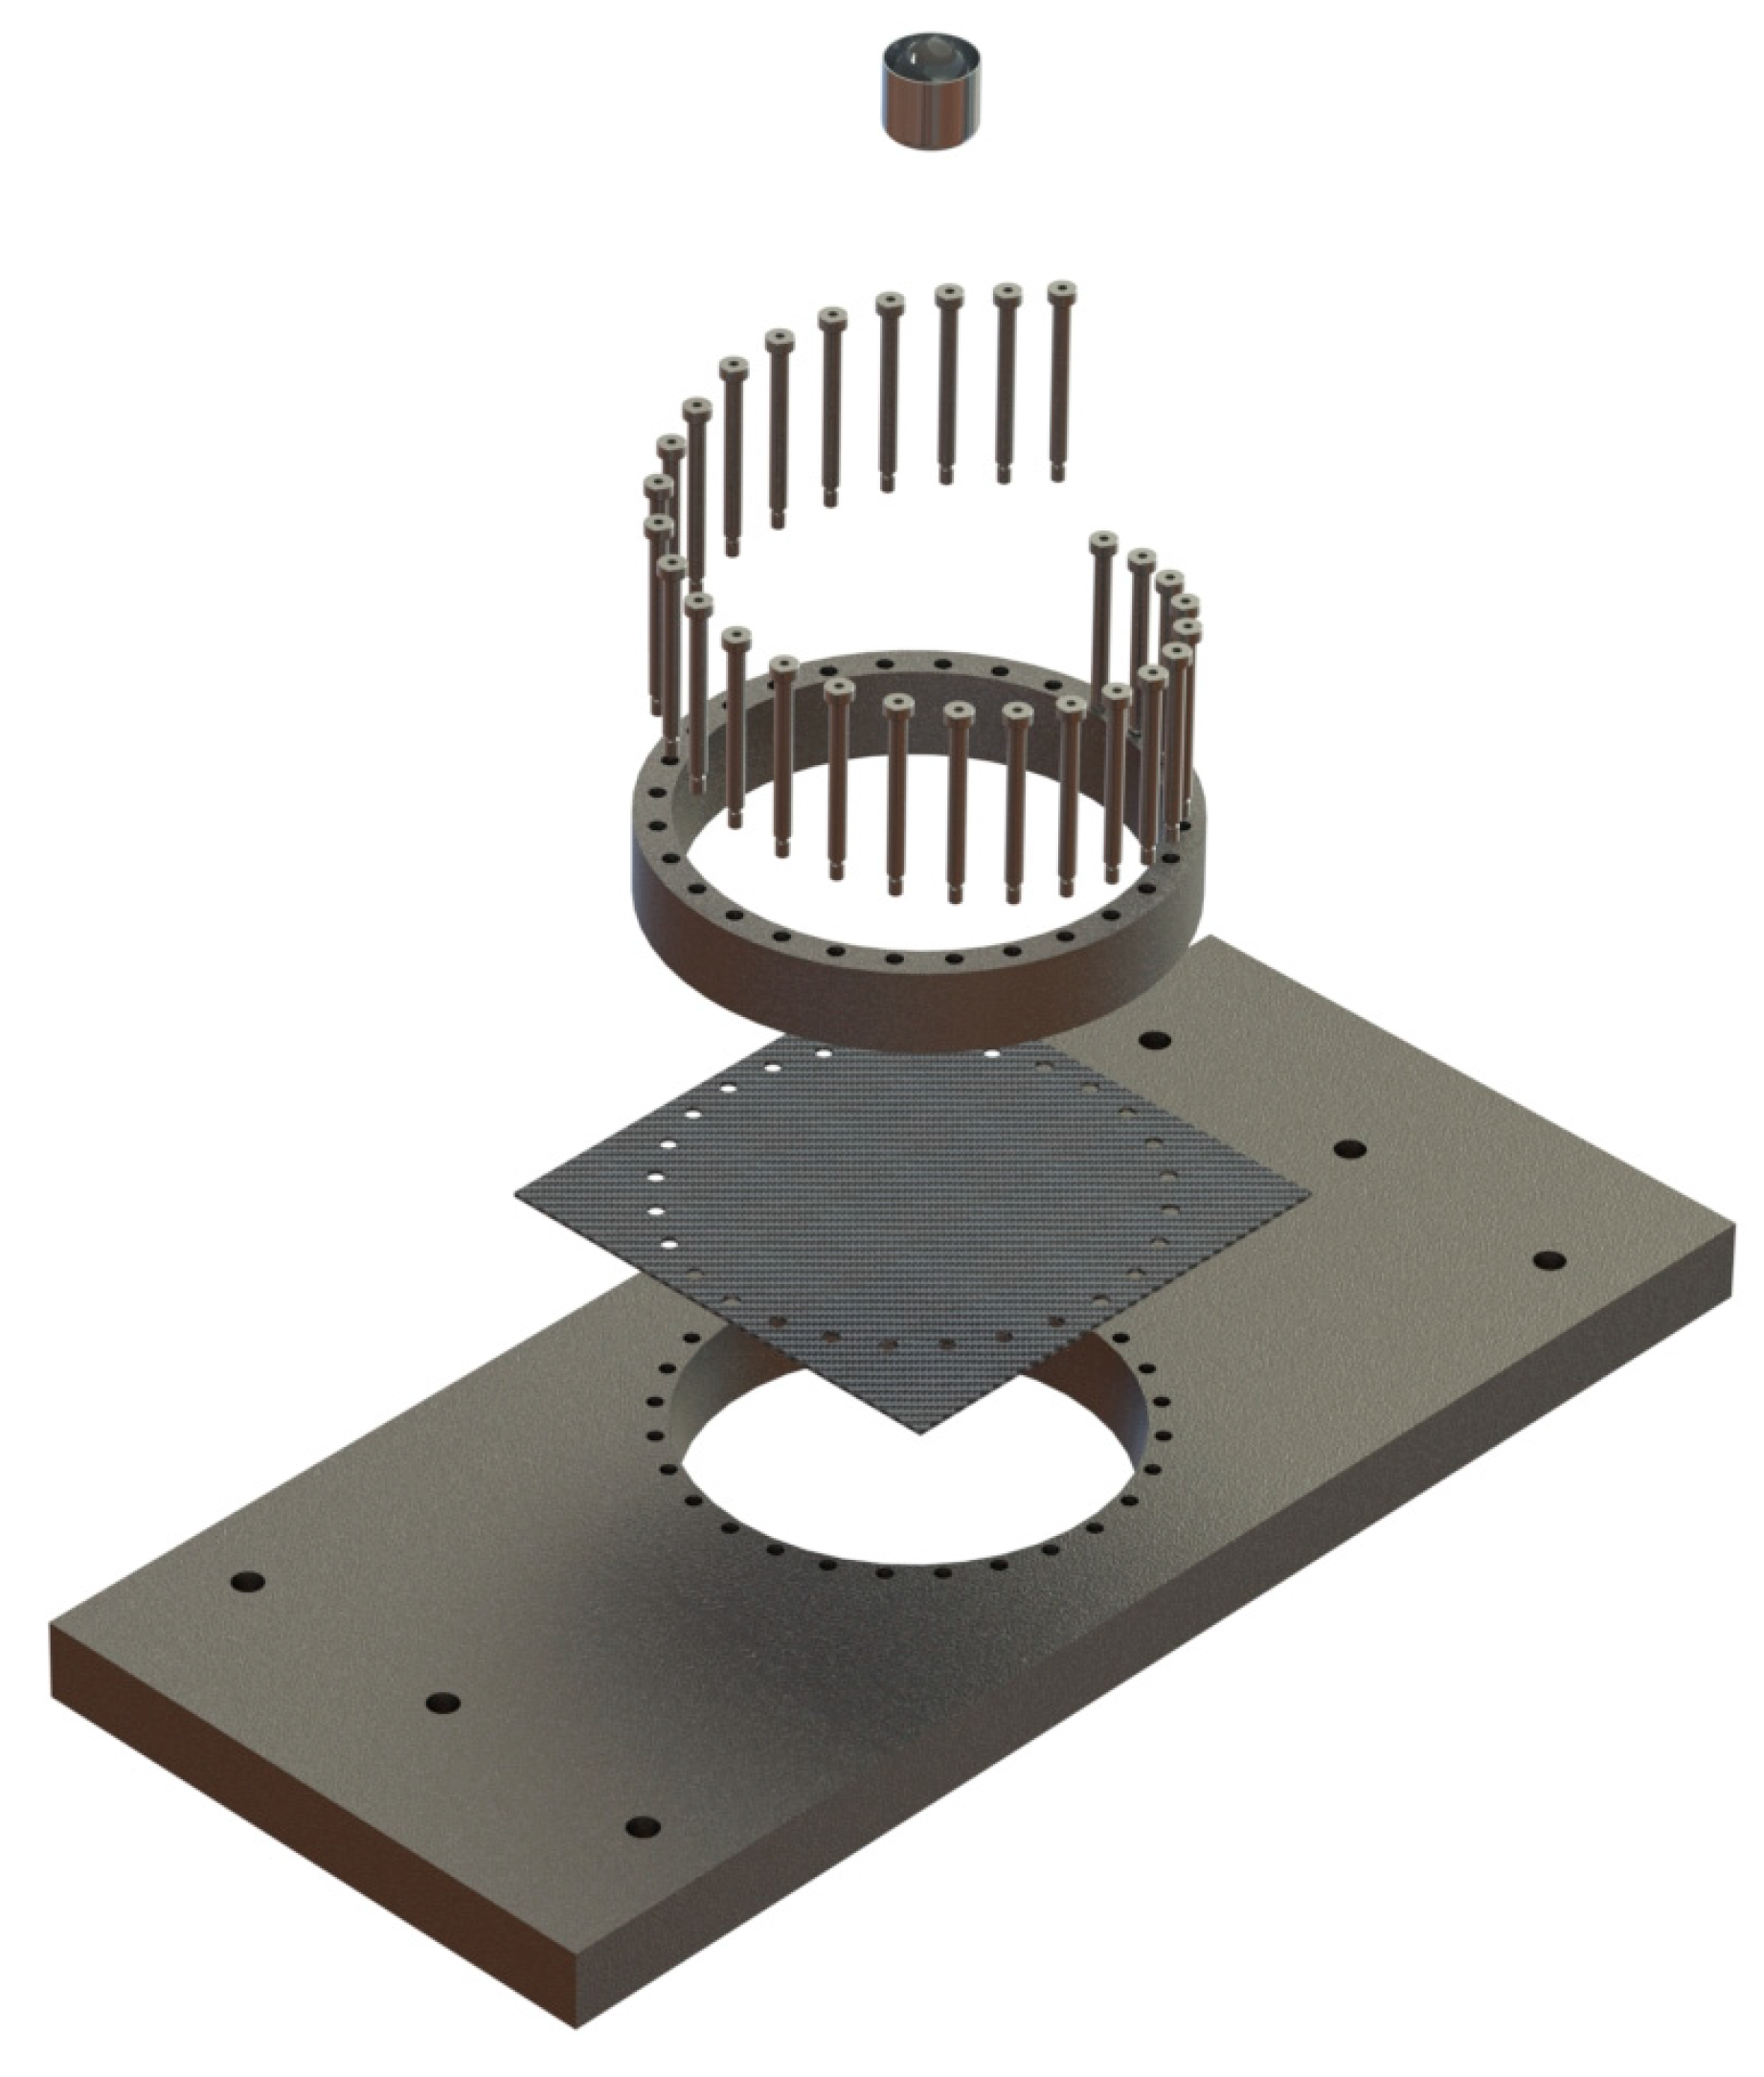
22]. In this paper, a coupled thermo-mechanical numerical modeling technique is presented for evaluating and describing a unidirectional quasi-isotropic carbon fiber-reinforced composite panel when subjected to a high-velocity impact (HVI). In particular, the thermal-gradient evolution inside the selected composite panel has been investigated in detail by applying a high-fidelity stacked shell-cohesive method. A standardized metallic ASTM D8101 projectile [
23] (
Figure 1) is considered for this investigation. The intralaminar and interlaminar material models adopted in the numerical modeling technique are presented and detailed in
Section 2. Mechanical properties associated with the selected composite material are reported based on the material characterization test campaign [
12]. Physical thermal material characteristics are also resumed and described in the following paragraphs. A brief introduction of the thermal-structural coupled methodology is provided according to what has been implemented in LS-DYNA.
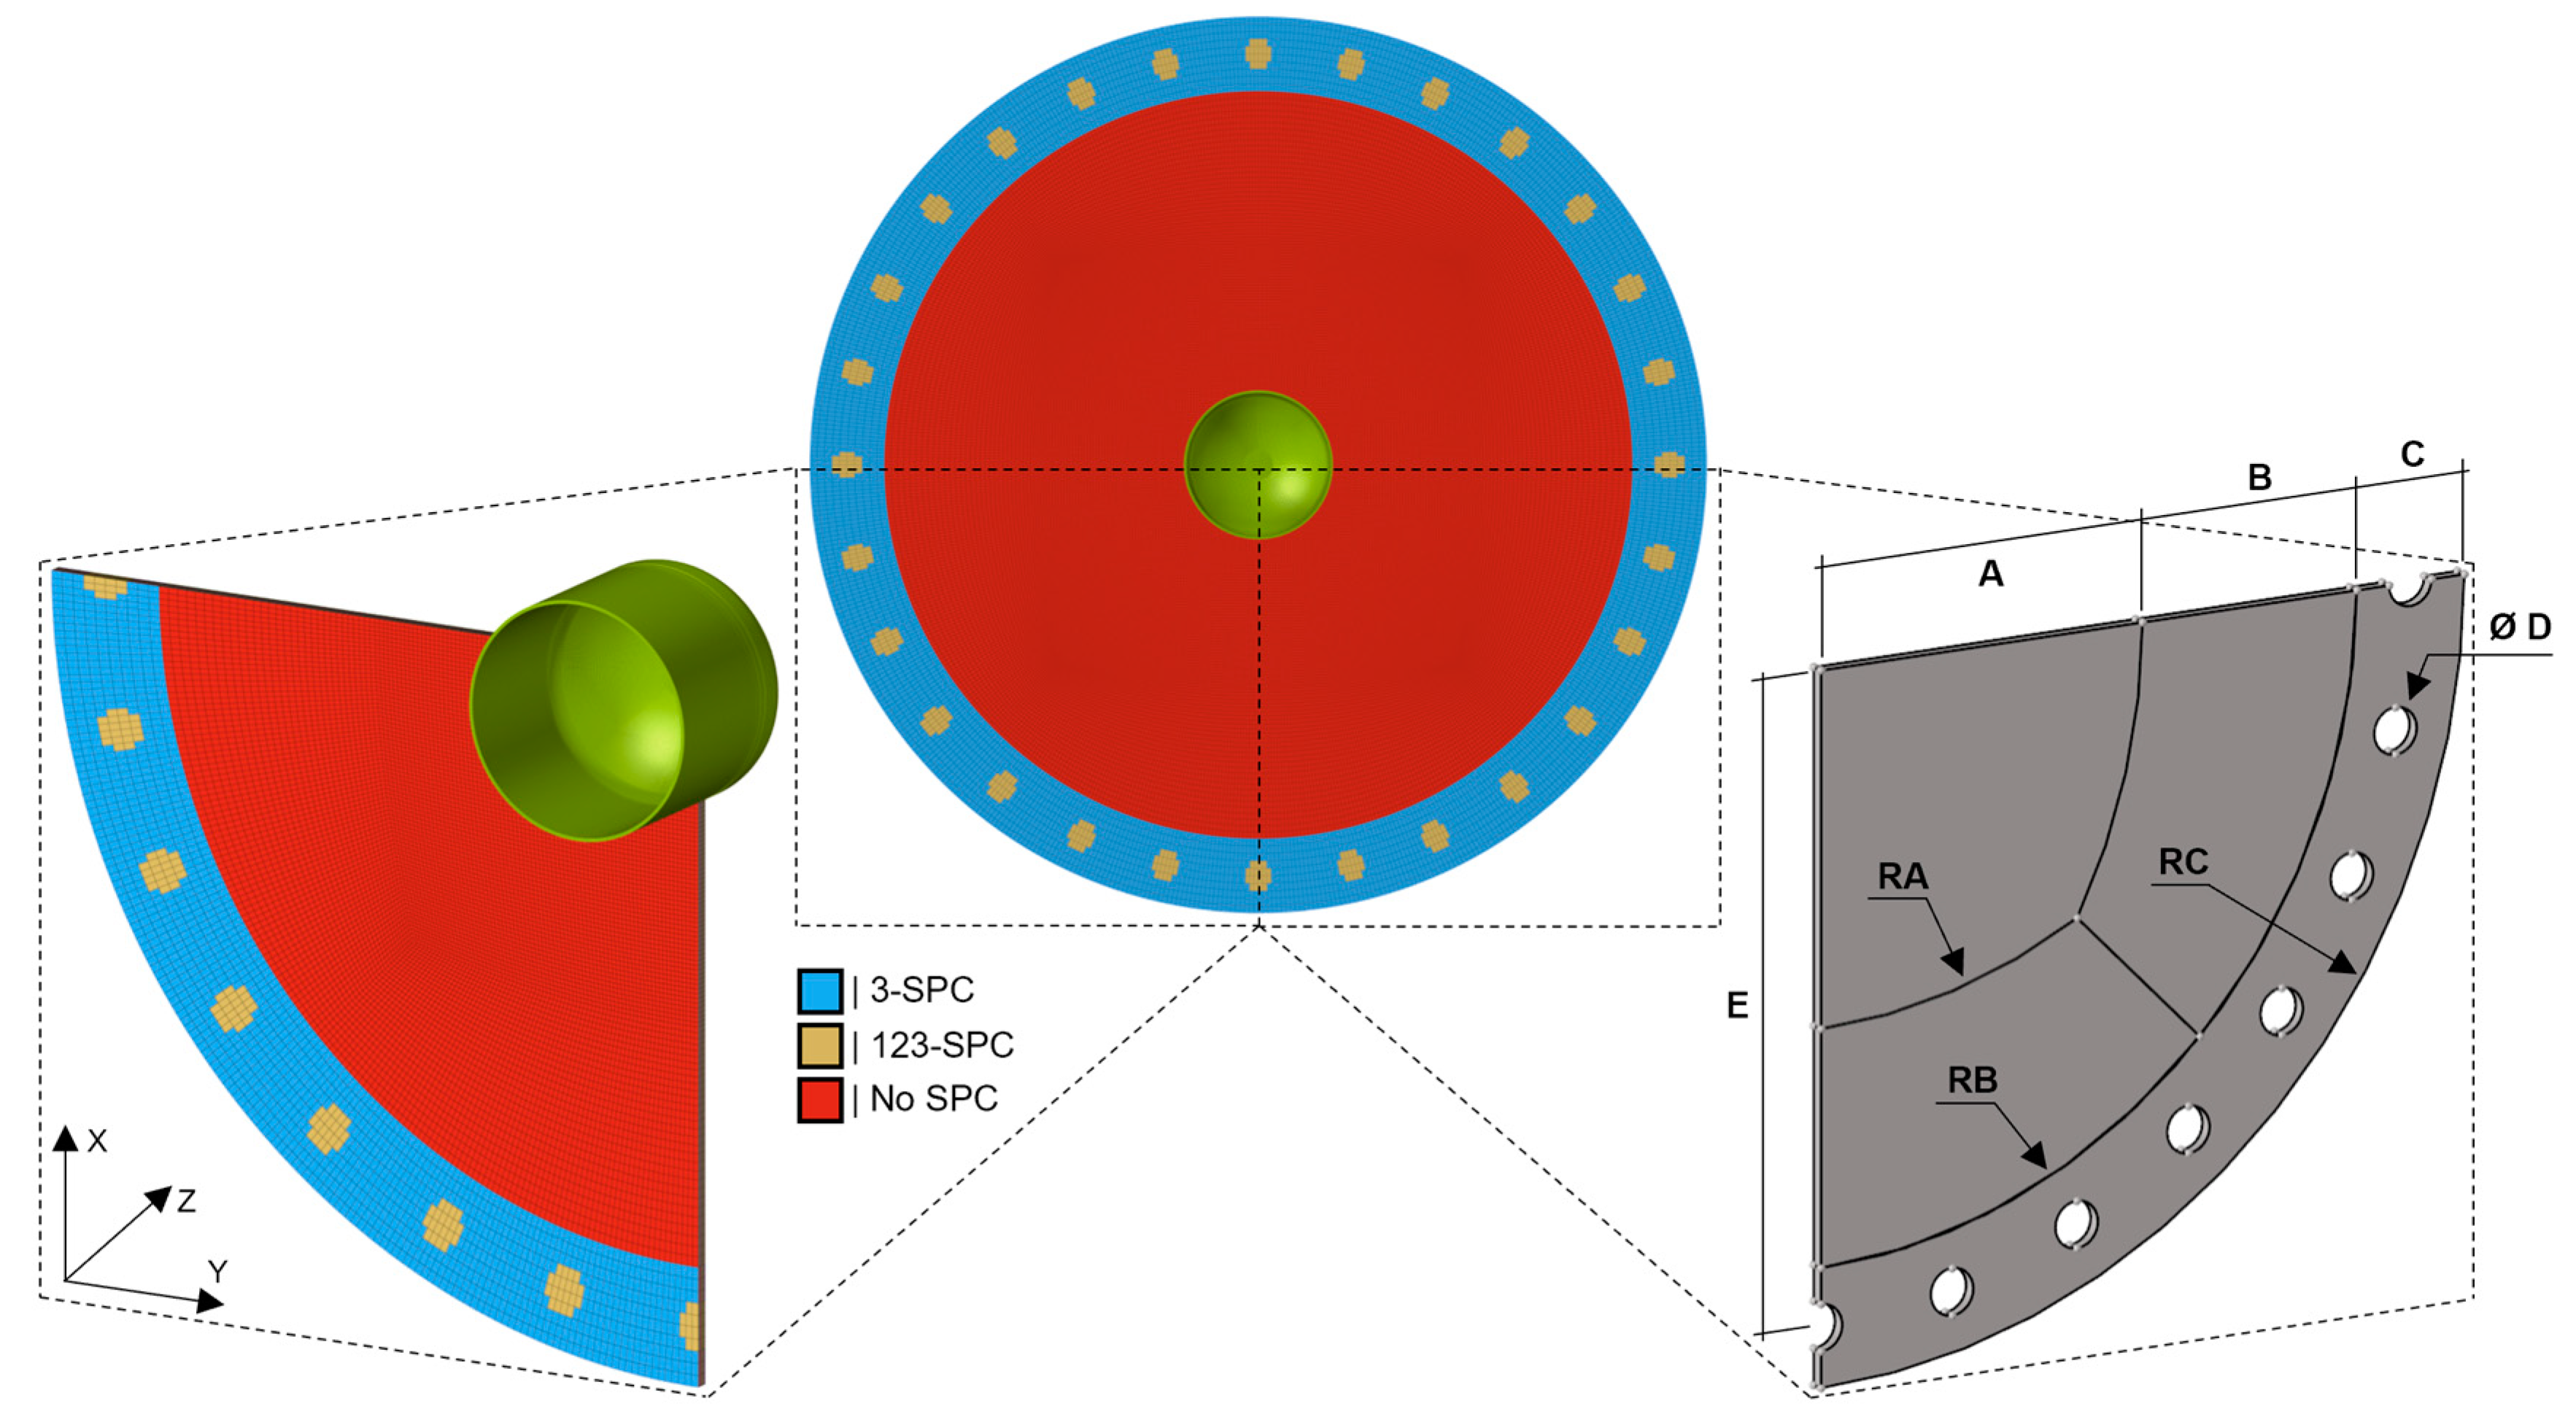
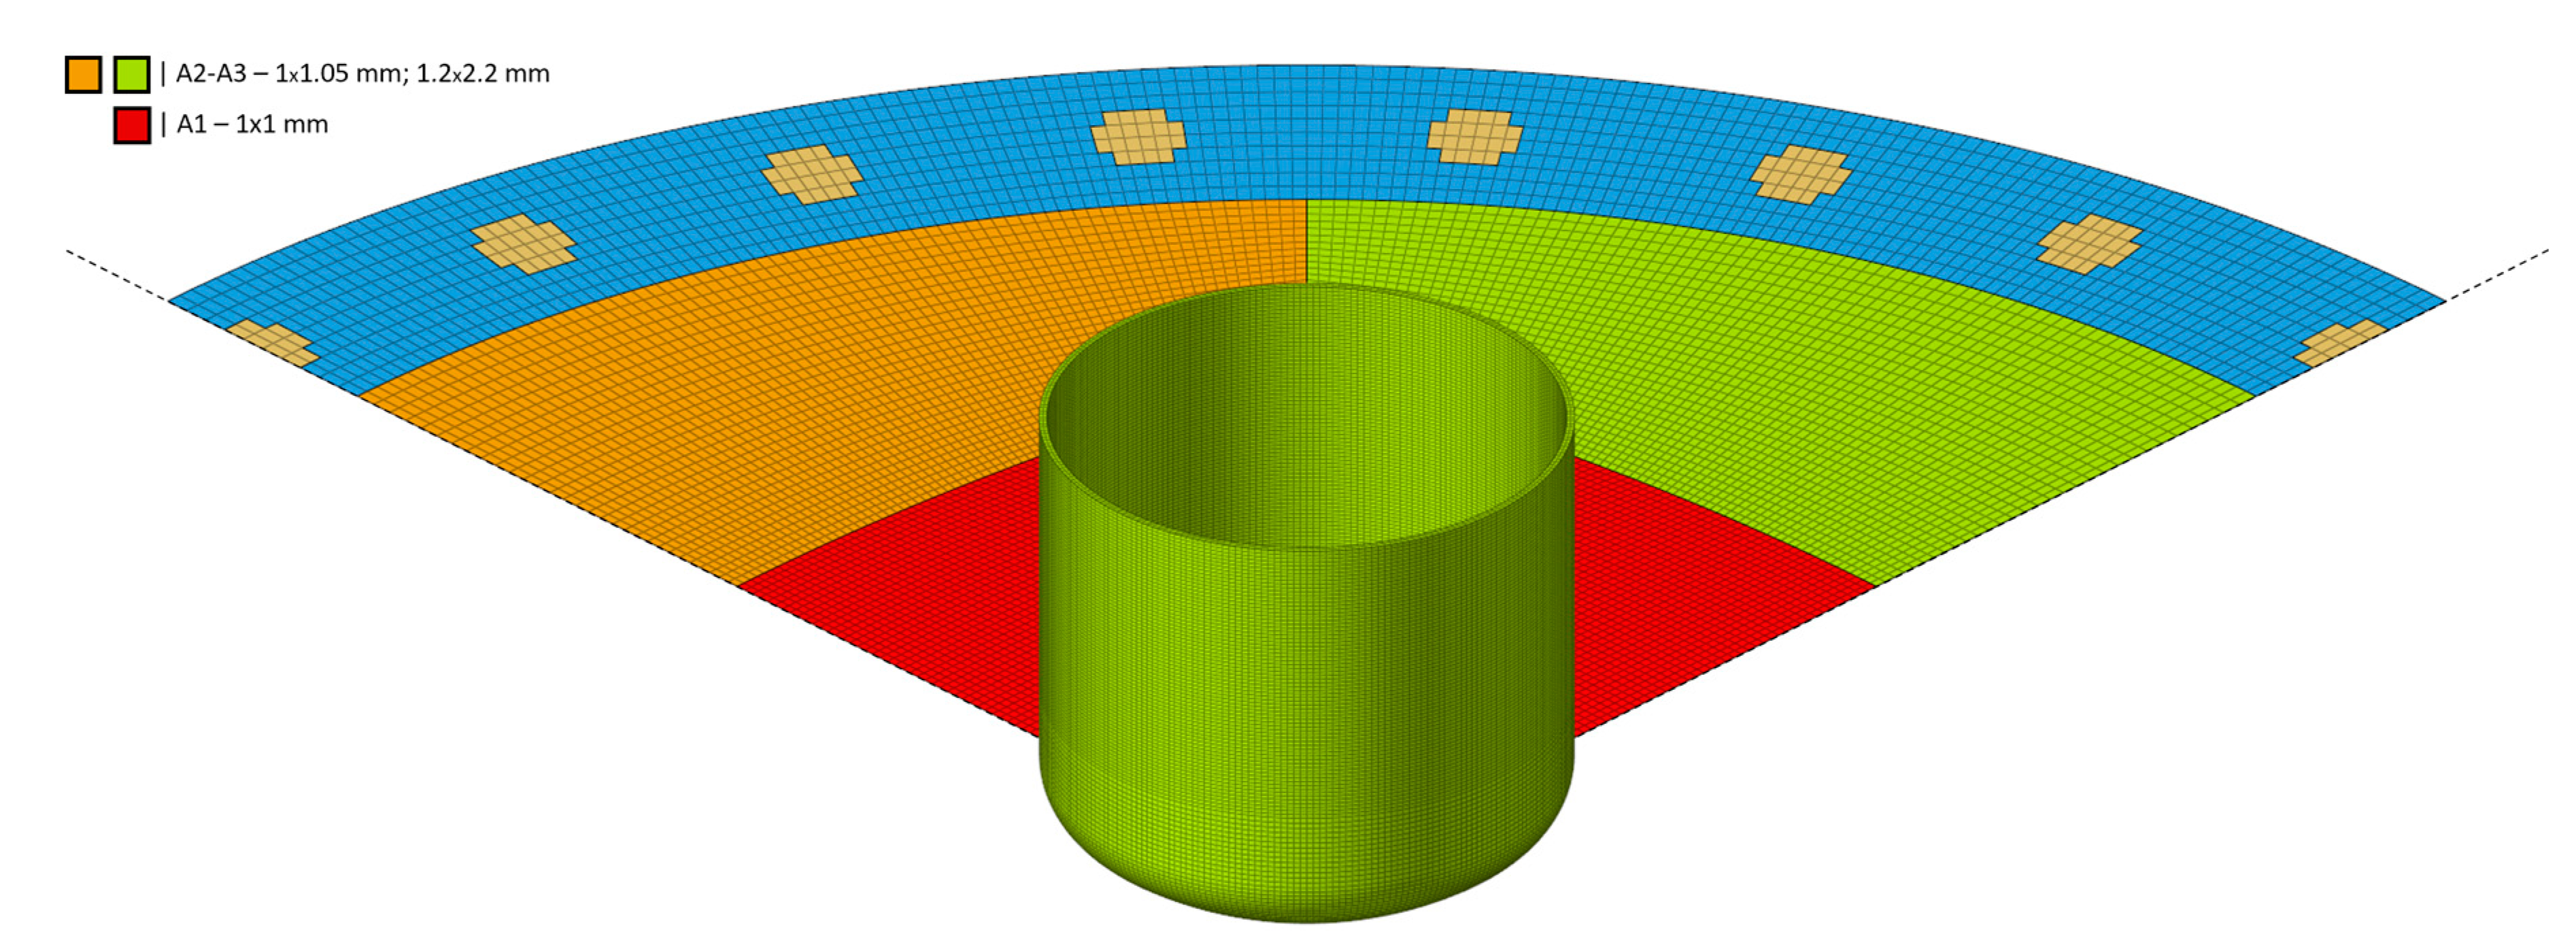
Section 3 describes the shell-cohesive modeling technique and the specific numerical keywords implemented in the numerical solution.
Section 4 describes the high-fidelity uncoupled stacked shell-cohesive methodology verified against the experimental results obtained by NASA [
13]. An innovative physical-based sensitivity analysis is presented, establishing a new methodology for the definition of the numerical model parameters for representing both the dynamic post-failure fracture evolution of a chosen composite panel and the residual kinetic energy of the projectile. The defined numerical solution is then utilized to examine the global and local thermal gradient evolution in the composite plies and to assess the localized intralaminar thermal peaks that may arise within the composite structure. This solution has the capability to quantify and assess the in situ thermal gradient progression that impacts the active fracture zone (AFZ) in a composite panel when subjected to high-velocity impacts. This innovative solution can be also employed to improve the knowledge about the localized active fracture zone that originates inside impacted composite structures. The improved understanding introduces novel physical-based
erosion parameters for fracture initiation and propagation. The methodology presented here can also be employed in combination with an experimental setup to monitor the thermal surface propagation and correlate the observed external distribution with the internal physical thermal evolution.
2. Material Models in LS-DYNA
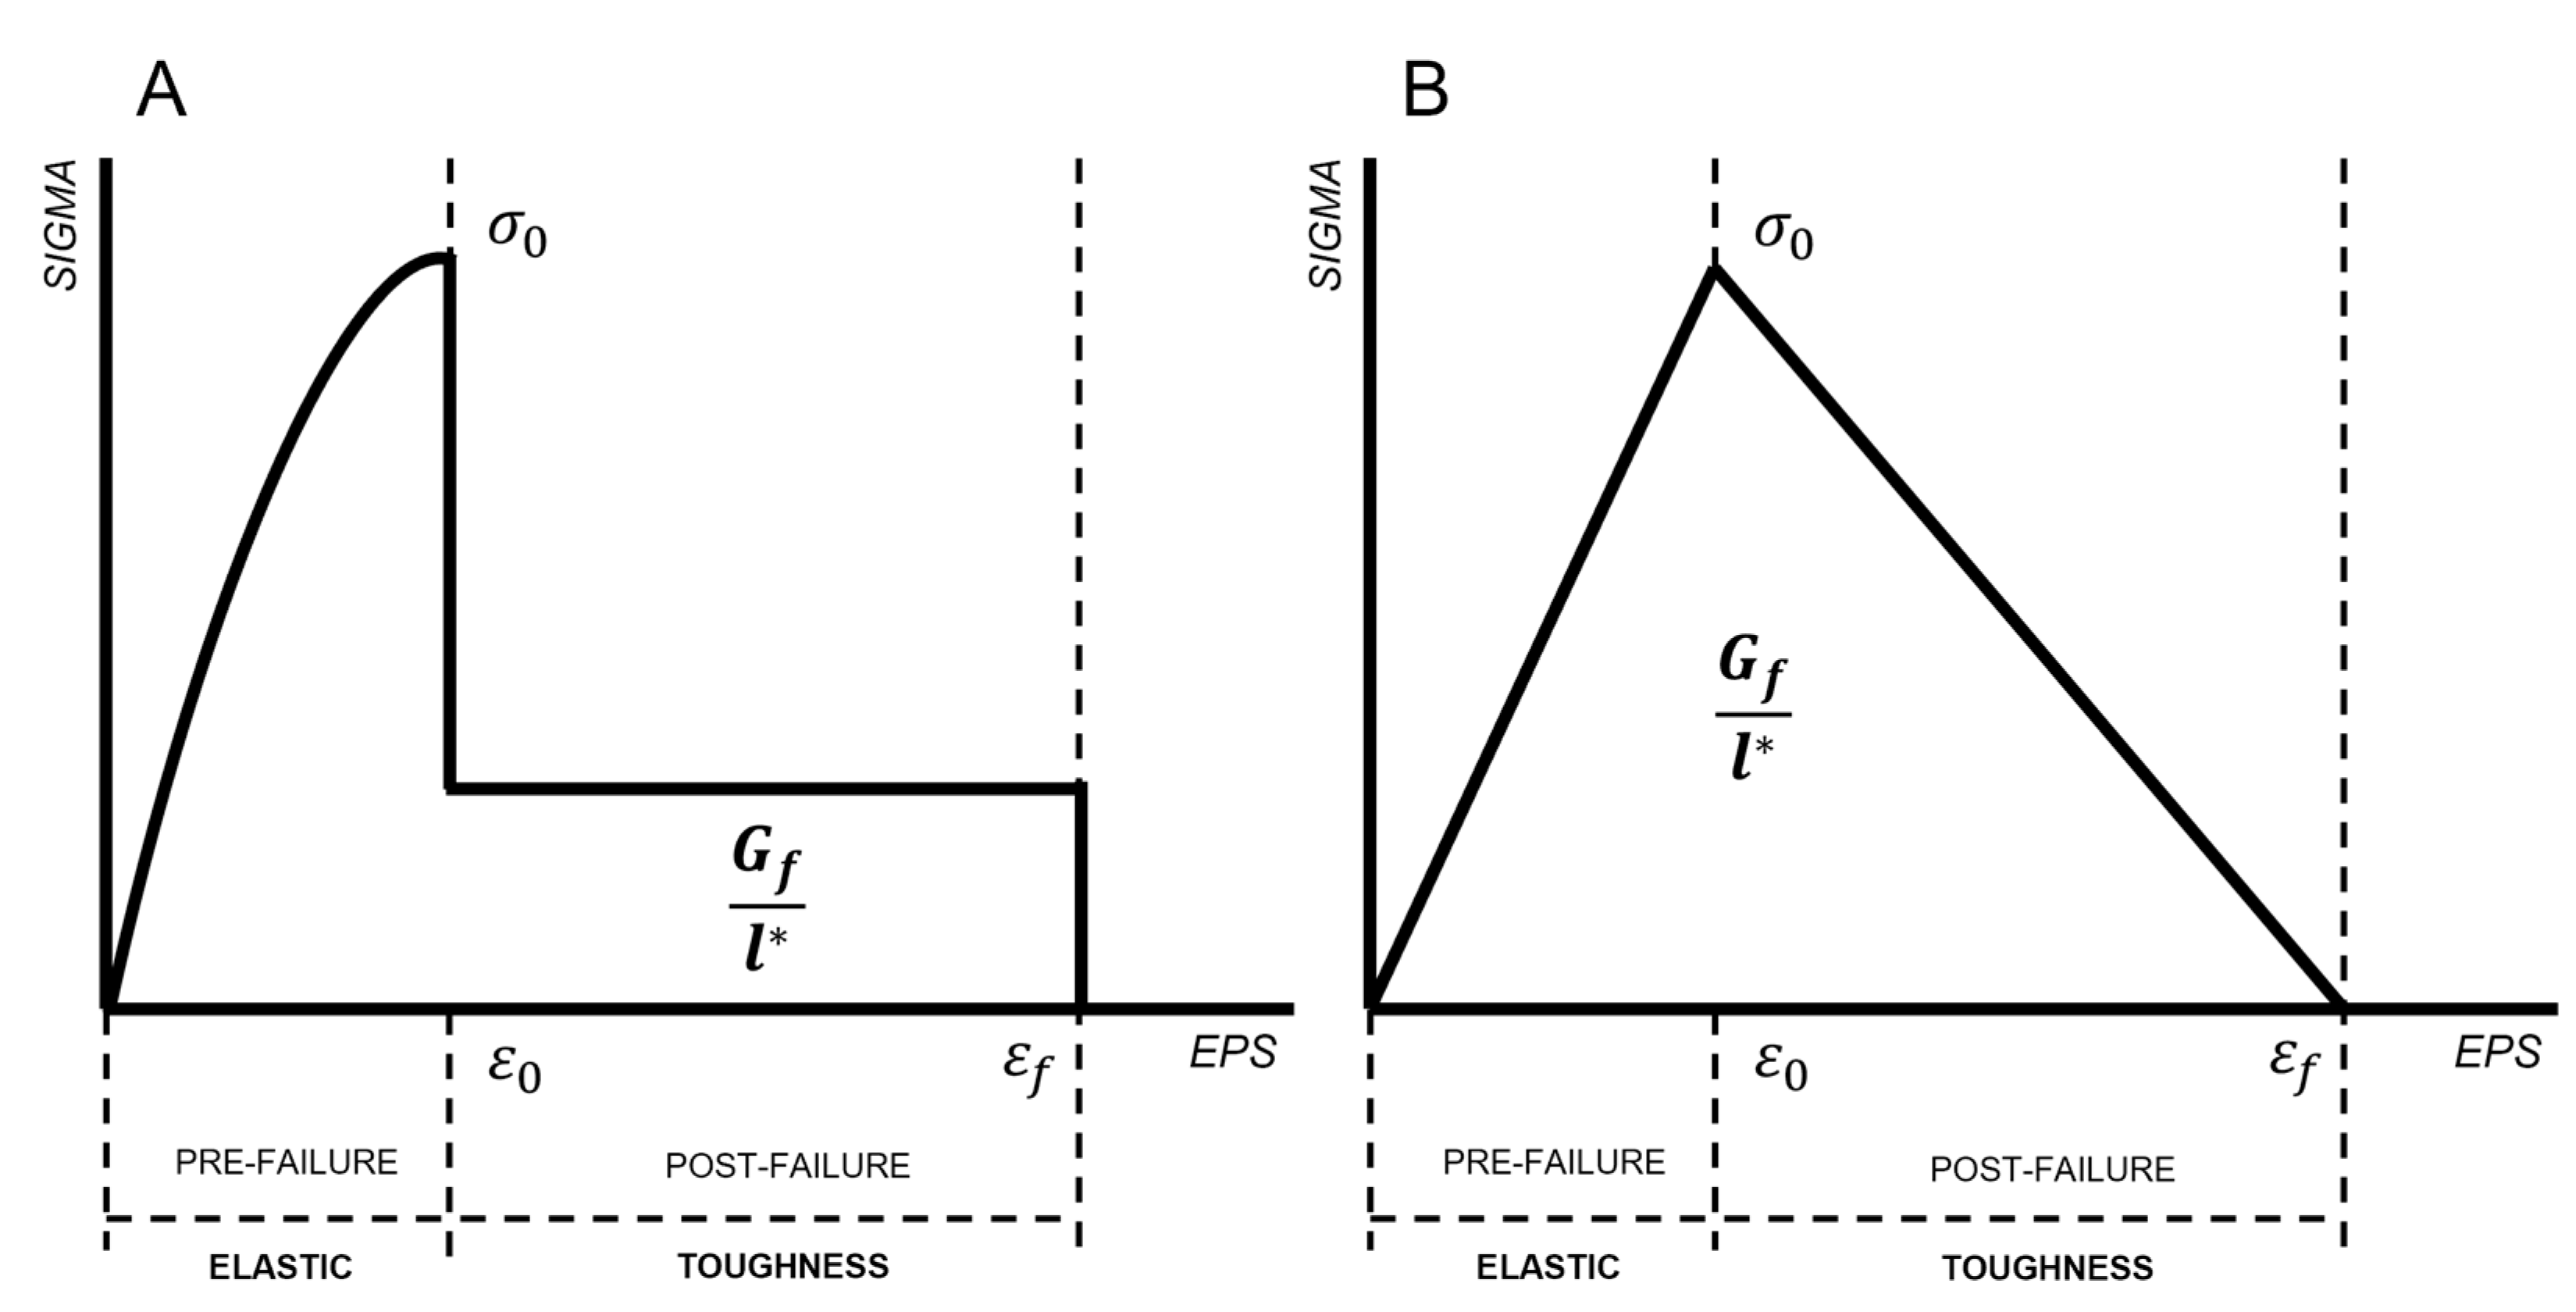
Specific material formulations are available in LS-DYNA that can be used to model and characterize the mechanical behavior of composite intralaminar and interlaminar regions when subjected to different loading conditions. Classically, an intralaminar material formulation implemented in an explicit solver can be described with the definition of two specific nonlinear domains: pre-failure elastic undamaged region and post-failure damaged region. The elastic undamaged phase mainly defines the global stiffness of the selected material, its temperature, and its strain rate dependency. On the other hand, the post-failure evolution is strictly connected with the material architecture and the energy absorption characteristic of the specified material. The specific selection of a characteristic post-failure behavior can set a completely different dynamic fracture initiation and propagation in the proposed numerical solution. Many different post-failure laws are currently presented in the literature, but no characteristic outcomes have been already found to define a punctual methodology for multiple composite architectures. The main intralaminar composite material models currently implemented in LS-DYNA are divided referring to the characteristic post-failure behavior: constant plateau and linear degradation law (
Figure 2). The former is based on a constant post-failure stress–strain plateau for each damaged material direction. Material formulations available in LS-DYNA that adopt this characteristic behavior are MAT54 and MAT58 [
24,
25]. The latter is based on a linear or bilinear post-failure softening of the orthotropic material characteristics. There are available in LS-DYNA specific material formulations, MAT261 and MAT262 [
24,
25], based on the mechanical theories proposed by Pinho et al. [
26,
27] and Camanho et al. [
28,
29]. The post-failure region can be characterized based on the typical energy release rate connected to the specific material direction. The interlaminar matrix phase that physically represents the through-thickness region that exists between two adjacent composite layers is generally represented in the literature through the definition of a cohesive zone region (CZM). The mathematical law that describes the cohesive zone method has been introduced by Dugdale [
30] and Barenblatt [
31] to describe the active fracture zone (AFZ) that exists ahead of a crack tip in a metallic structure. CZM methods are implemented in LS-DYNA with the definition of several specific material formulations, such as MAT138, MAT184, MAT185, and MAT240.
A high-velocity impact phenomenon is typically completely extinguished in less than 5 ms. The internal heat generated due to the conversion of the kinematic energy (KE) of the projectile and the contact friction into the internal fracture energy (IE) is stored completely internally inside the impacted composite structure. No consistent conduction is present between the impacted structure and the external environment. Several studies used infrared (IR) cameras to evaluate the variation of the temperature inside high-speed impacted composite panels. A high internal temperature gradient can change the physical and mechanical states of considered materials, modifying their dynamical evolution in approaching the constitutive glass transition temperature for aerospace-grade epoxy resins.
The simulations here proposed are performed using mechanical and thermal properties of typical unidirectional T800/F3900 lamina adopted in NASA ACP [
12,
32]. The intralaminar elastic static physical properties are listed in
Table 1. No intralaminar toughness properties have been evaluated in the specified material characterization campaign. An equivalent aerospace-grade CFRP epoxy material has been selected to support the energetic hypothesis for the definition of non-physical post-impact parameters introduced in the following paragraphs. Specific energy properties of IM7/8552 are reported in
Table 2. Finally, a list of characteristic non-physical parameters are provided in the following
Table 3. The interlaminar cohesive material properties are summarized in
Table 4 for the selected bilinear material model. The ASTM rigid impactor material properties are reported in
Table 5. Principal thermal-structural characteristic material properties necessary for the definition of the specified coupled simulation have been extracted from the literature [
33,
34,
35,
36] and summarized in
Table 6,
Table 7,
Table 8,
Table 9,
Table 10 and
Table 11.
2.1. Intralaminar Damage Model
The selected continuum damage model (CDM) has been developed by Matzenmiller et al. [
37] and implemented in LS-DYNA in the material card *MAT_LAMINATED_COMPOSITE_FABRIC (MAT58). This material formulation can be used to characterize the intralaminar behavior of composite materials with unidirectional layers or woven fabric plies. Specific failure surface methods are available for each specified material architecture. In this study, the faceted failure surface available for unidirectional composite laminate structure and nonlinear composite plies has been used. The selected failure orthotropic formulations implemented in MAT58 (FS = −1) is applied to allow an uncoupled failure of an arbitrary composite layer. All failure criteria are taken to be independent of each other. The specified formulations are here reported below:
The selected failure surface includes the definition of a nonlinear shear behavior characteristic of selected unidirectional composite material T800/F3900, as described in [
12,
32]. The formulations reported in (1)–(5) are related to the in-plane effective stresses (
) that are associated with the nominal plane-stress field through the characteristic damage parameters (
) (6). The damage parameters are implemented in MAT58 with an exponential law (7), where m,
and
are the parameters controlling the shape of the stress–strain response; strain and stress at maximum directional stress, correspondingly [
24,
25]. Moreover, the two damage parameters
and
assume different values for tension and compression. Thus, uncoupled post-failure damage parameters are introduced for this material model. The associated constitutive stiffness matrix of the FE element is defined as a function of the damage parameters and the mechanical properties of the undamaged composite layer [
24,
25]. In particular, the damage parameter (
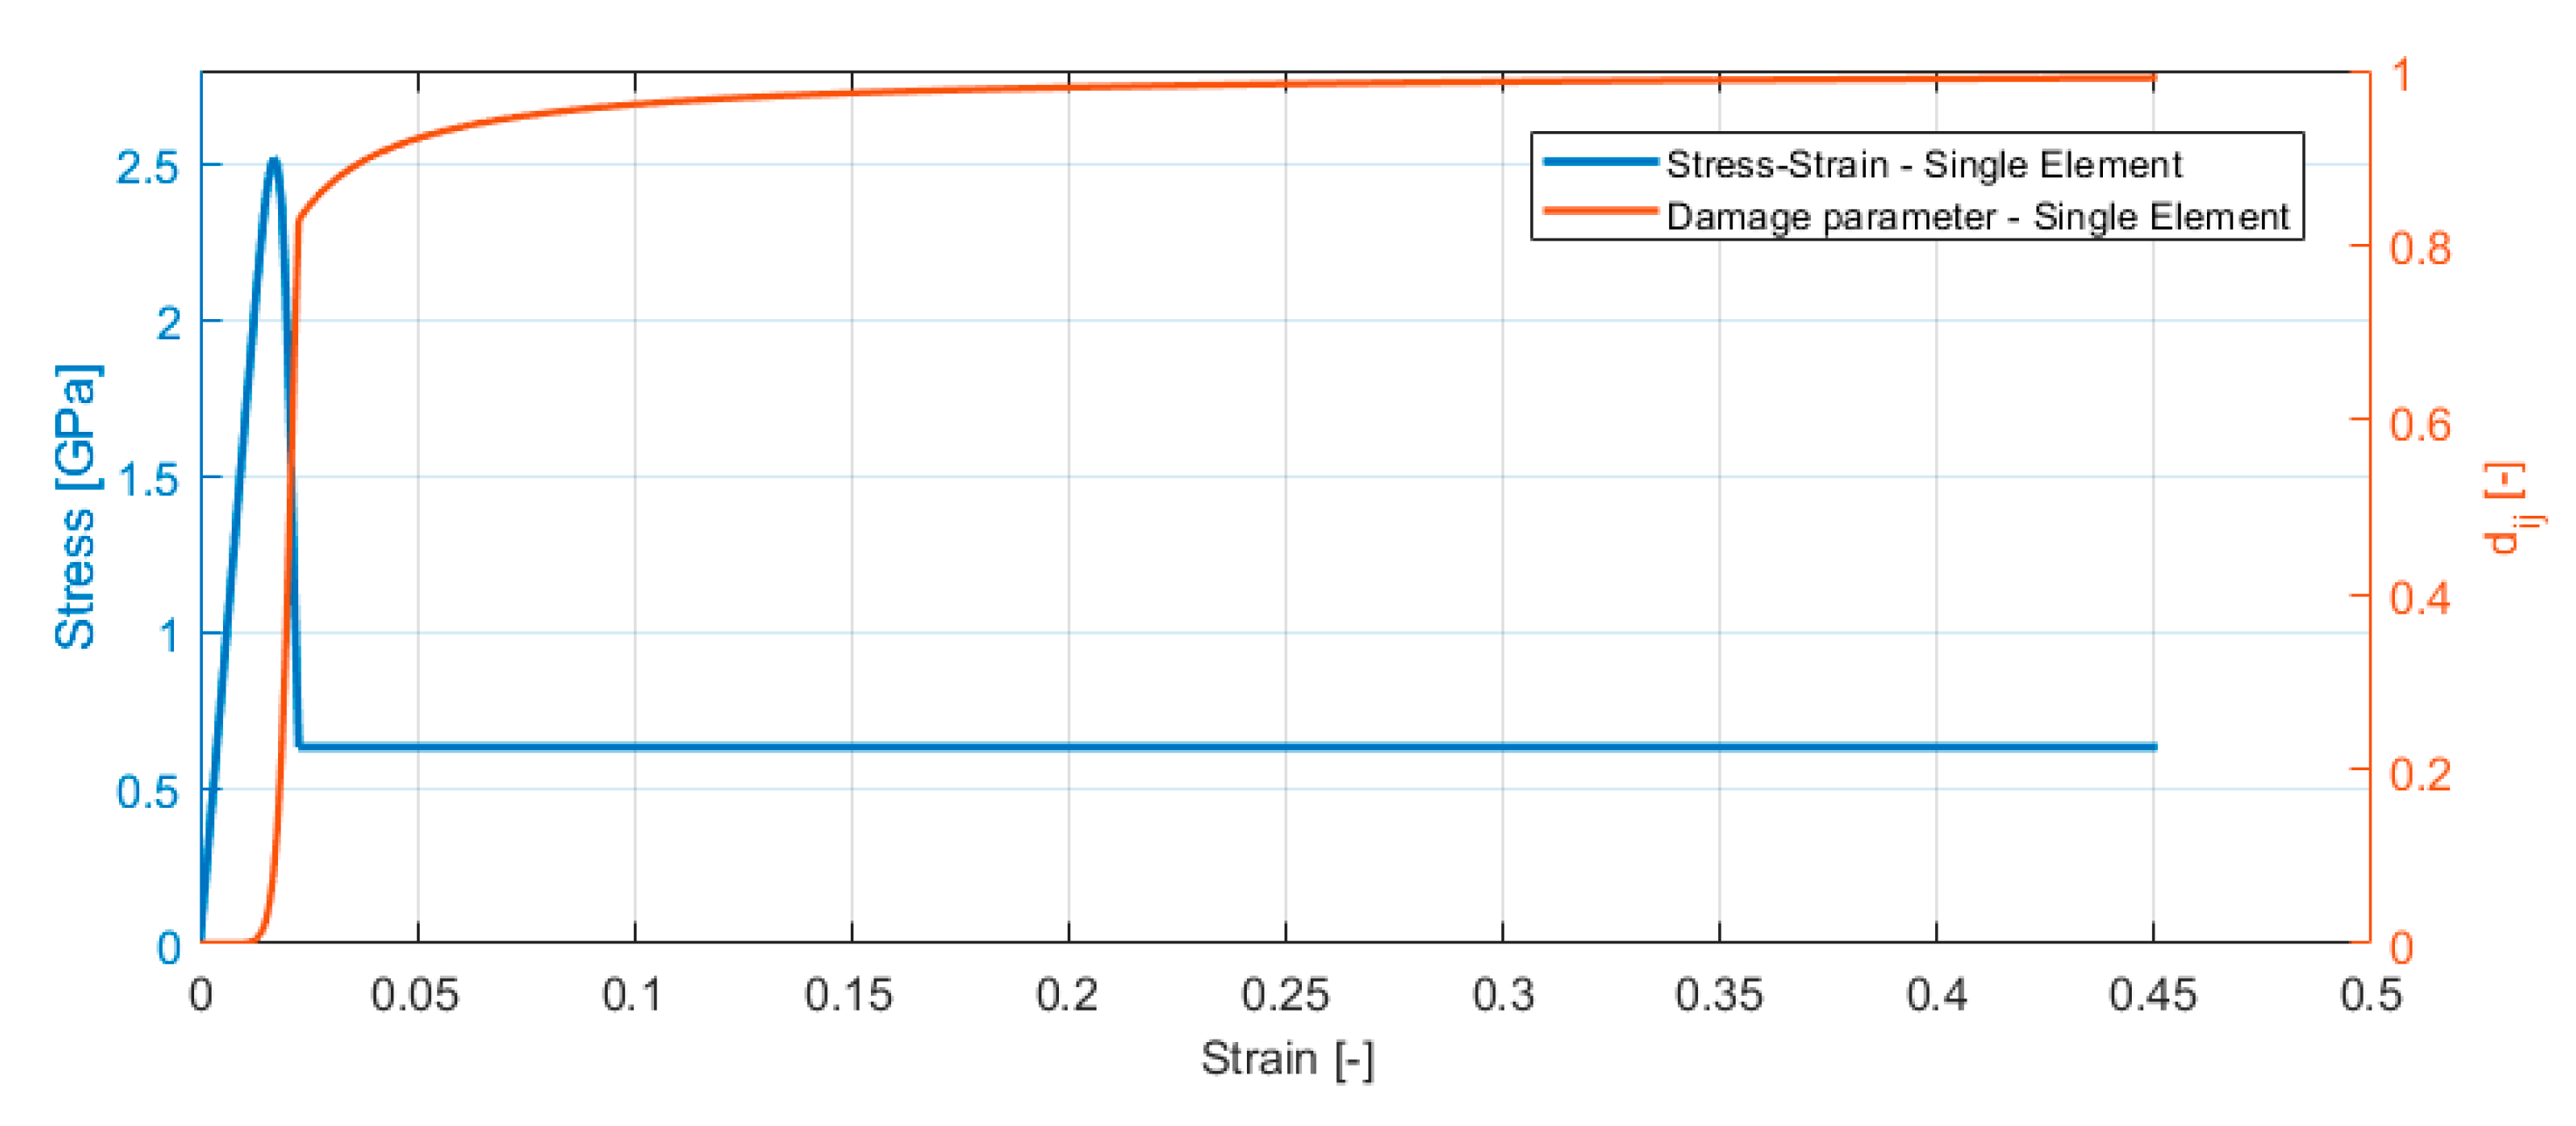
) is activated when the orthotropic material strength threshold is exceeded. Subsequently, during the post-failure evolution, the associated damage parameters increase exponentially based on the relative deformation (7) until the FE reaches the specified post-failure criteria (
Figure 3). The selected material formulation provides a smooth increase of load with curvilinear behavior around the failure threshold. The characteristic behavior prevents the immediate drop of stress after the failure initiation. This method decreases the numerical instabilities and sets the possibility of progressively changing the load path around the failed element without the generation of numerical high-frequency vibrations.
Non-physical parameters are introduced to describe the post-failure evolution of selected material formulation. In the context of this research article, the term
failure is associated with the mechanical characteristic material threshold, after which no further increase in the loading carrying capacity is allowed by the finite element in the specific failed direction. On the other hand, the term
erosion refers to the characteristic limit, classically defined through an equivalent generalized strain value, that set the deletion of the FE from further numerical calculations. Classically, the majority of non-physical parameters introduced in a mathematical material model are linked to the definition of the post-failure behavior of specified material in the specific orthotropic direction. In particular, the post-failure associated with the selected interlaminar material model is defined by two specific numerical parameters that control the stress–strain evolution and thus the fracture propagation:
and
. The material-aligned SLIMT value defines the residual stress level after the failure threshold in each material direction. Instead, the erosion limit, for the FE element, is controlled by the definition of an FE global maximum effective strain.
Table 2.
Associated intralaminar toughness of IM7/8552 as published in [
38] and relative nomenclature for MAT58.
Table 2.
Associated intralaminar toughness of IM7/8552 as published in [
38] and relative nomenclature for MAT58.
| Property | Units | Symbol | LS-DYNA
Parameters | Experimental
Value |
|---|
| Toughness 1T-direction | [GPa × mm] | Γ1T | - | 0.0916 |
| Toughness 1C-direction | [GPa × mm] | Γ 1C | - | 0.0799 |
| Toughness 2T-direction | [GPa × mm] | Γ 2T | - | 0.00020 |
| Toughness 2C-direction | [GPa × mm] | Γ 2C | - | 0.00076 |
| Toughness 12-direction | [GPa × mm] | Γ 12 | - | 0.00080 |
Table 3.
Selected MAT58 intralaminar mechanical and numerical parameters associated with T800/F3900 composite material.
Table 3.
Selected MAT58 intralaminar mechanical and numerical parameters associated with T800/F3900 composite material.
| Variable | | Definition | Inserted Value |
|---|
| FC | [-] | Failure surface type | −1 |
| SOFT | [-] | Softening reduction factor for crash front element | 1 |
| SLIMT1 | [-] | Post-failure maximum stress limit 1-tension | 0.25 |
| SLIMT2 | [-] | Post-failure maximum stress limit 2-tension | 1.00 |
| SLIMC1 | [-] | Post-failure maximum stress limit 1-compression | 0.45 |
| SLIMC2 | [-] | Post-failure maximum stress limit 2-compression | 1.00 |
| SLIMS | [-] | Post-failure maximum plane stress shear direction | 1.00 |
| TFAIL | [ms] | Time step criteria for element deletion | 1.0 × 10⁻⁹ |
| ERODS | [-] | Maximum effective strain for element failure | +0.52 |
| TAU1 | [GPa] | First nonlinear shear stress threshold | 0.0827 |
| GAMMA1 | [-] | First nonlinear shear engineering strain threshold | 0.04 |
2.2. Interlaminar Damage Model
The Cohesive Zone Model (CZM) is a nonlinear numerical technique utilized to depict the stress-displacement relationship surrounding a pre-existing material crack. The interface is modeled as a thin layer which describes the initiation and evolution of cracks or delaminations in a known a priori propagation path. Compared to traditional finite element (FE) fracture mechanics methods, the CZM offers several advantages, such as the ability to simulate intricate crack paths and loading conditions, as well as the incorporation of material nonlinearity and damage evolution. Typically, a bi-linear cohesive law is adopted in the literature to describe the CZM, which relates the local stress to the crack opening displacement as shown in
Figure 4. Fracture surface initiates inside a cohesive zone only upon satisfaction of characteristic failure strength. After failure initiation, the stiffness properties of damaged elements soften with further deformation. The area underneath the CZM constitutive law defines the energy necessary to propagate the fracture, which is commonly associated with fracture toughness (
GC). *MAT_COHESIVE_MIXED_MODE (MAT138) was selected for the definition of the CZM elements in the interlaminar region between adjacent composite plies. Cohesive material properties and cohesive stiffness values obtained with the formulations proposed by Polla et al. [
39] are reported in
Table 4.
Table 4.
MAT138 material parameters for the interlaminar region of T800/F3900, as published in [
40].
Table 4.
MAT138 material parameters for the interlaminar region of T800/F3900, as published in [
40].
| Variable | | Definition | Inserted Value |
|---|
| RHO | [kg/mm2] | Mass per unit of area | 7.692 × 10⁻⁸ |
| ROFLG | [-] | Density per unit of volume or area | 1.0 |
| INTFAIL | [-] | N° Integration point for deletion of an element | 1.0 |
| EN | [GPa/mm] | Normal cohesive stiffness | 17.21 |
| ET | [GPa/mm] | Tangential cohesive stiffness | 8.25 |
| GIC | [GPa × mm] | Energy release rate for mode I | 4.64 × 10⁻⁴ |
| GIIC | [GPa × mm] | Energy release rate for mode II | 1.84 × 10⁻³ |
| XMU | [-] | Exponential of the mixed mode criteria | −1.45 |
| T | [GPa] | Peak traction in the normal direction | 0.0274 |
| S | [GPa] | Peak traction in the tangential direction | 0.0856 |
Table 5.
MAT20 standard material parameters for rigid aluminum ASTM impactor.
Table 5.
MAT20 standard material parameters for rigid aluminum ASTM impactor.
| Variable | | Definition | Inserted Value |
|---|
| RHO | [kg/mm3] | Mass per unit volume | 2.63 × 10⁻⁶ |
| E | [GPa] | Isotropic Young modulus | 71.65 |
| PR | [-] | Poisson ratio | 0.3 |
2.3. Thermal Model
High-energy impact events are commonly defined as an adiabatic transient thermodynamic closed system; part of the kinetic energy (KE) of the projectile is converted into internal fracture energy, which is then partly transformed into heat within the internal intralaminar and interlaminar regions. Furthermore, the friction generated by the interaction of the system impactor-plate and the contact between internally delaminated surfaces can generate a localized heat that is stored inside the composite structure. The low thermal conduction capabilities of CFRP increase the localization effect of the thermal gradient generated during an impact event. The transient heat generated by the converted internal energy can be coupled with other features to provide modeling capabilities for thermal-stress analysis. Two major groups of thermal parameters are necessary to set a thermo-structural coupled model: thermal material characteristics and thermal contact parameters. Specific material models are available in LS-DYNA to set the thermal characteristic properties of selected material systems. The intralaminar composite region is defined with the introduction of *MAT_THERMAL_ORTHOTROPIC and *MAT_ADD_THERMAL_EXPANSION cards. Intralaminar specific heat, orthotropic thermal conductivity (k), and thermal expansion coefficients associated with a carbon fiber-reinforced polymer are reported in
Table 6 and
Table 9. Isotropic intralaminar resin thermal properties were inserted in *MAT_THERMAL_ISOTROPIC and are reported in
Table 7. The aluminum isotropic thermal characteristics are summarized in
Table 8 based on the same material card previously introduced.
The radiation laws assume that an object is considered a blackbody, which is an idealized object that absorbs radiation regardless of wavelength or direction and emits radiation at every wavelength independent of direction. However, most objects, including composites, do not exhibit idealistic blackbody characteristics and behave more like graybodies. These peculiarities set a lower emissivity, which causes the surface to emit less radiation than blackbodies. The emissivity coefficient selected for the indicated material is summarized in
Table 10. Thermal conductivity, radiation factor, and thermal conductance formulations are reported in Equations (8)–(10). The specified formulations have been used to define the thermal coefficient necessary to describe the thermal flux exchanged between two adjacent bodies in contact. In particular, the formulation reported in Equations (9) and (10) has been used to define the FRAD and H0 parameters that are necessary for the definition in LS-DYNA of the thermal flux exchanged by interacting bodies (
Table 11 and
Table 12). The amount of heat exchanged is directly dependent on the properties of the surface and the absolute distance that exists between the two surfaces. Other thermal parameters have been inserted according to the material properties found in the literature and on the default value described in the LS-DYNA user manual [
24,
25].
Table 6.
T02 material parameters for the thermal orthotropic characteristic of T800/F3900, as published in [
33].
Table 6.
T02 material parameters for the thermal orthotropic characteristic of T800/F3900, as published in [
33].
| Variable | | Definition | Inserted Value |
|---|
| HLAT | [J/kg] | Latent heat | 0 |
| HC | [J/kg × K] | Specific heat | 1040 |
| K1 | [J/ms × mm ×K] | Thermal conductivity in local x-direction | 9.000 × 10⁻⁶ |
| K2 | [J/ms × mm × K] | Thermal conductivity in local y-direction | 7.700 × 10⁻⁷ |
| K3 | [J/ms × mm × K] | Thermal conductivity in local z-direction | 7.000 × 10⁻⁷ |
Table 7.
T01 material parameters for the thermal isotropic characteristic of F3900, as published in [
34].
Table 7.
T01 material parameters for the thermal isotropic characteristic of F3900, as published in [
34].
| Variable | | Definition | Inserted Value |
|---|
| HLAT | [J/kg] | Latent heat | 0 |
| HC | [J/kg × K] | Specific heat | 1110 |
| TC | [J/ms × mm × K] | Thermal conductivity | 2.000 × 10⁻⁷ |
Table 8.
T01 material parameters for the thermal isotropic characteristic of aluminum, as published in [
35].
Table 8.
T01 material parameters for the thermal isotropic characteristic of aluminum, as published in [
35].
| Variable | | Definition | Inserted Value |
|---|
| HLAT | [J/kg] | Latent heat | 0 |
| HC | [J/kg × K] | Specific heat | 875 |
| TC | [J/ms × mm × K] | Thermal conductivity | 2.350 × 10⁻⁴ |
Table 9.
Thermal expansion coefficient for composite T800/F3900, as published in [
33].
Table 9.
Thermal expansion coefficient for composite T800/F3900, as published in [
33].
| Variable | | Definition | Inserted Value |
|---|
| ALPHA11 | [1/K] | Thermal Expansion in local x-direction | −1 × 10⁻⁶ |
| ALPHA22 | [1/K] | Thermal Expansion in local y-direction | 2.6 × 10⁻⁵ |
| ALPHA33 | [1/K] | Thermal Expansion in local z-direction | 2.6 × 10⁻⁵ |
Table 10.
Emissivity coefficient selected for the material phase inserted in the numerical solution, as published in [
36].
Table 10.
Emissivity coefficient selected for the material phase inserted in the numerical solution, as published in [
36].
| Variable | | Definition | Inserted Value |
|---|
| εAl | [-] | Emissivity of grey aluminum | 0.09 |
| εC | [-] | Emissivity of carbon | 0.77 |
Table 11.
Thermal parameters for the internal contact algorithm characteristic of F3900, as published in [
34,
36], based on Equations (8)–(10).
Table 11.
Thermal parameters for the internal contact algorithm characteristic of F3900, as published in [
34,
36], based on Equations (8)–(10).
| Variable | | Definition | Inserted Value |
|---|
| εcarbon | [-] | Emissivity of C | 0.77 |
| K | [J/K × ms × mm] | Thermal conductivity of delaminated surfaces | 2 × 10⁻⁷ |
| FRAD | [J/ms × mm2 × K4] | Radiation factor between the contact surfaces | 3.549 × 10⁻¹⁷ |
| H0 | [J/ms × mm2 × K] | Heat transfer conductance for closed gaps | 1.500 × 10⁻⁶ |
| LMIN | [mm] | Minimum gap between the surfaces | 0.1 |
| LMAX | [mm] | Maximum gap between the surfaces | 0.195 |
| FTOSLV | [-] | Fraction of sliding friction energy partitioned | 0.5 |
Table 12.
Thermal parameters for the global impactor-plate contact algorithm [
34,
36], based on Equations (8)–(10).
Table 12.
Thermal parameters for the global impactor-plate contact algorithm [
34,
36], based on Equations (8)–(10).
| Variable | | Definition | Inserted Value |
|---|
| εaluminium | [-] | Emissivity of grey Al | 0.09 |
| εcarbon | [-] | Emissivity of C | 0.77 |
| K | [J/K × ms × mm] | Thermal conductivity of delaminated surfaces | 2.4 × 10⁻⁸ |
| FRAD | [J/ms × mm2 × K4] | Radiation factor between the contact surfaces | 4.969 × 10⁻¹⁸ |
| H0 | [J/ms × mm2 × K] | Heat transfer conductance for closed gaps | 1.176 × 10⁻⁵ |
| LMIN | [mm] | Minimum gap between the surfaces | 0.1 |
| LMAX | [mm] | Maximum gap between the surfaces | 2.0 |
| FTOSLV | [-] | Fraction of sliding friction energy partitioned | 0.5 |
4. Result and Discussion
The presented numerical model is based on intralaminar and interlaminar material parameters that are requested for characterizing the post-failure fracture initiation and evaluation, such as what is observed in the experimental campaign. In particular, post-failure parameters characteristic of MAT58 (SLIM & ERODS) should be defined on physical-based values as derived by an experimental characterization testing campaign. A physical-based numerical solution can drastically decrease the amount of calibration steps required to obtain reliable numerical solutions that can be used to predict quasi-static and dynamic fracture evolution inside composite structures.
For a single finite element under a uniaxial deformation process, the specific fracture energy dissipated per unit volume (
) is defined by the area underlying the stress–strain curve. If a bilinear stress–strain curve is applied (
Figure 2B), the volumetric energy is given by Equation (11).
To avoid strain localization in a discrete FE mesh-dependent solution, a smeared cracking method has been adopted. Bazant [
44] and Pijaudier-Cabot [
45] related the volumetric energy of the characteristic material with its material-aligned fracture energy. The method can be applied to all introduced post-failure characteristic modes of failure (
Figure 2). The fracture energy dissipated per unit area within a fully failed element can be written in terms of the specific energy by multiplying the volumetric energy by a geometric characteristic quantity indicated as
characteristic length (
l*): it defines the FE length aligned with the specific loading direction. The characteristic final erosion deformation (
) is assigned in terms of material properties and characteristic length, as expressed in Equation (14), for a bilinear stress–strain curve. Moreover, the FE model must have a characteristic planar length that satisfies the condition reported in Equation (13) to ensure material stability, as previously described in
Section 3 for the definition of the characteristic mesh size.
The relation that links the specific energy with the associated experimental fracture energy for a MAT58 characteristic curve (
Figure 2A) is here defined. The final erosion deformation can be evaluated based on the material fracture energy and on the characteristic length (
), as expressed in Equations (15)–(17):
The selected value of post-failure stress limits (
) after the relative stress threshold in each characteristic direction is reported in
Table 3. A perfectly plastic plateau is assumed for both shear and matrix compression directions. The
SLIM value corresponding with the fiber compression has been selected based on the physical fiber kinking collapse observed in experimental results. A sensitivity analysis has been performed on
SLIM parameters and selected values have been reported in
Table 3 for both fiber and matrix traction directions. The conservative values for the specified material have been implemented in the present numerical solution. The specific erosion deformations can be evaluated for each material characteristic direction based on experimental fracture energy and characteristic planar mesh dimensions. The fracture energy values summarized in
Table 2 have been used for the erosion strain values definition according to the presented formulation Equation (17) and experimental evidence (
Table 14).
The erosion strain values defined in
Table 14 for each material-aligned direction can be used to define global maximum effective strain associated with each FE. The LS-DYNA
ERODS formulation reported in Equation (18) is derived by assuming that the material deformation is volume preserving [
24,
25]. Maximum absolute material-aligned strain erosion values are adopted for the definition of the
ERODS parameter based on the value reported in
Table 14. Erosion parameters equal to 0.439 have been defined based on selected material toughness and
SLIM parameters, as reported in
Table 2 and
Table 3.
The ballistic quantitative results are here summarized in
Table 15. A complete panel perforation has been observed in the numerical simulation with a residual impactor velocity of +35.8 m/s. The reported residual velocity is not congruent with the experimentally observed one: the numerical solution demonstrates a not-complete conversion of the kinetic energy into fracture energy with the specified numerical post-failure erosion parameters. As a consequence, a short sensitivity analysis has been performed starting from the physical-based value previously introduced and an
ERODS equal to 0.52 was identified. This value perfectly matches both the residual kinetic energy and the qualitative fracture and delamination morphology as observed in the referenced experimental activity (see
Table 15). The same set of
SLIM values reported in
Table 3 has been implemented in the present FE solution with the calibrated
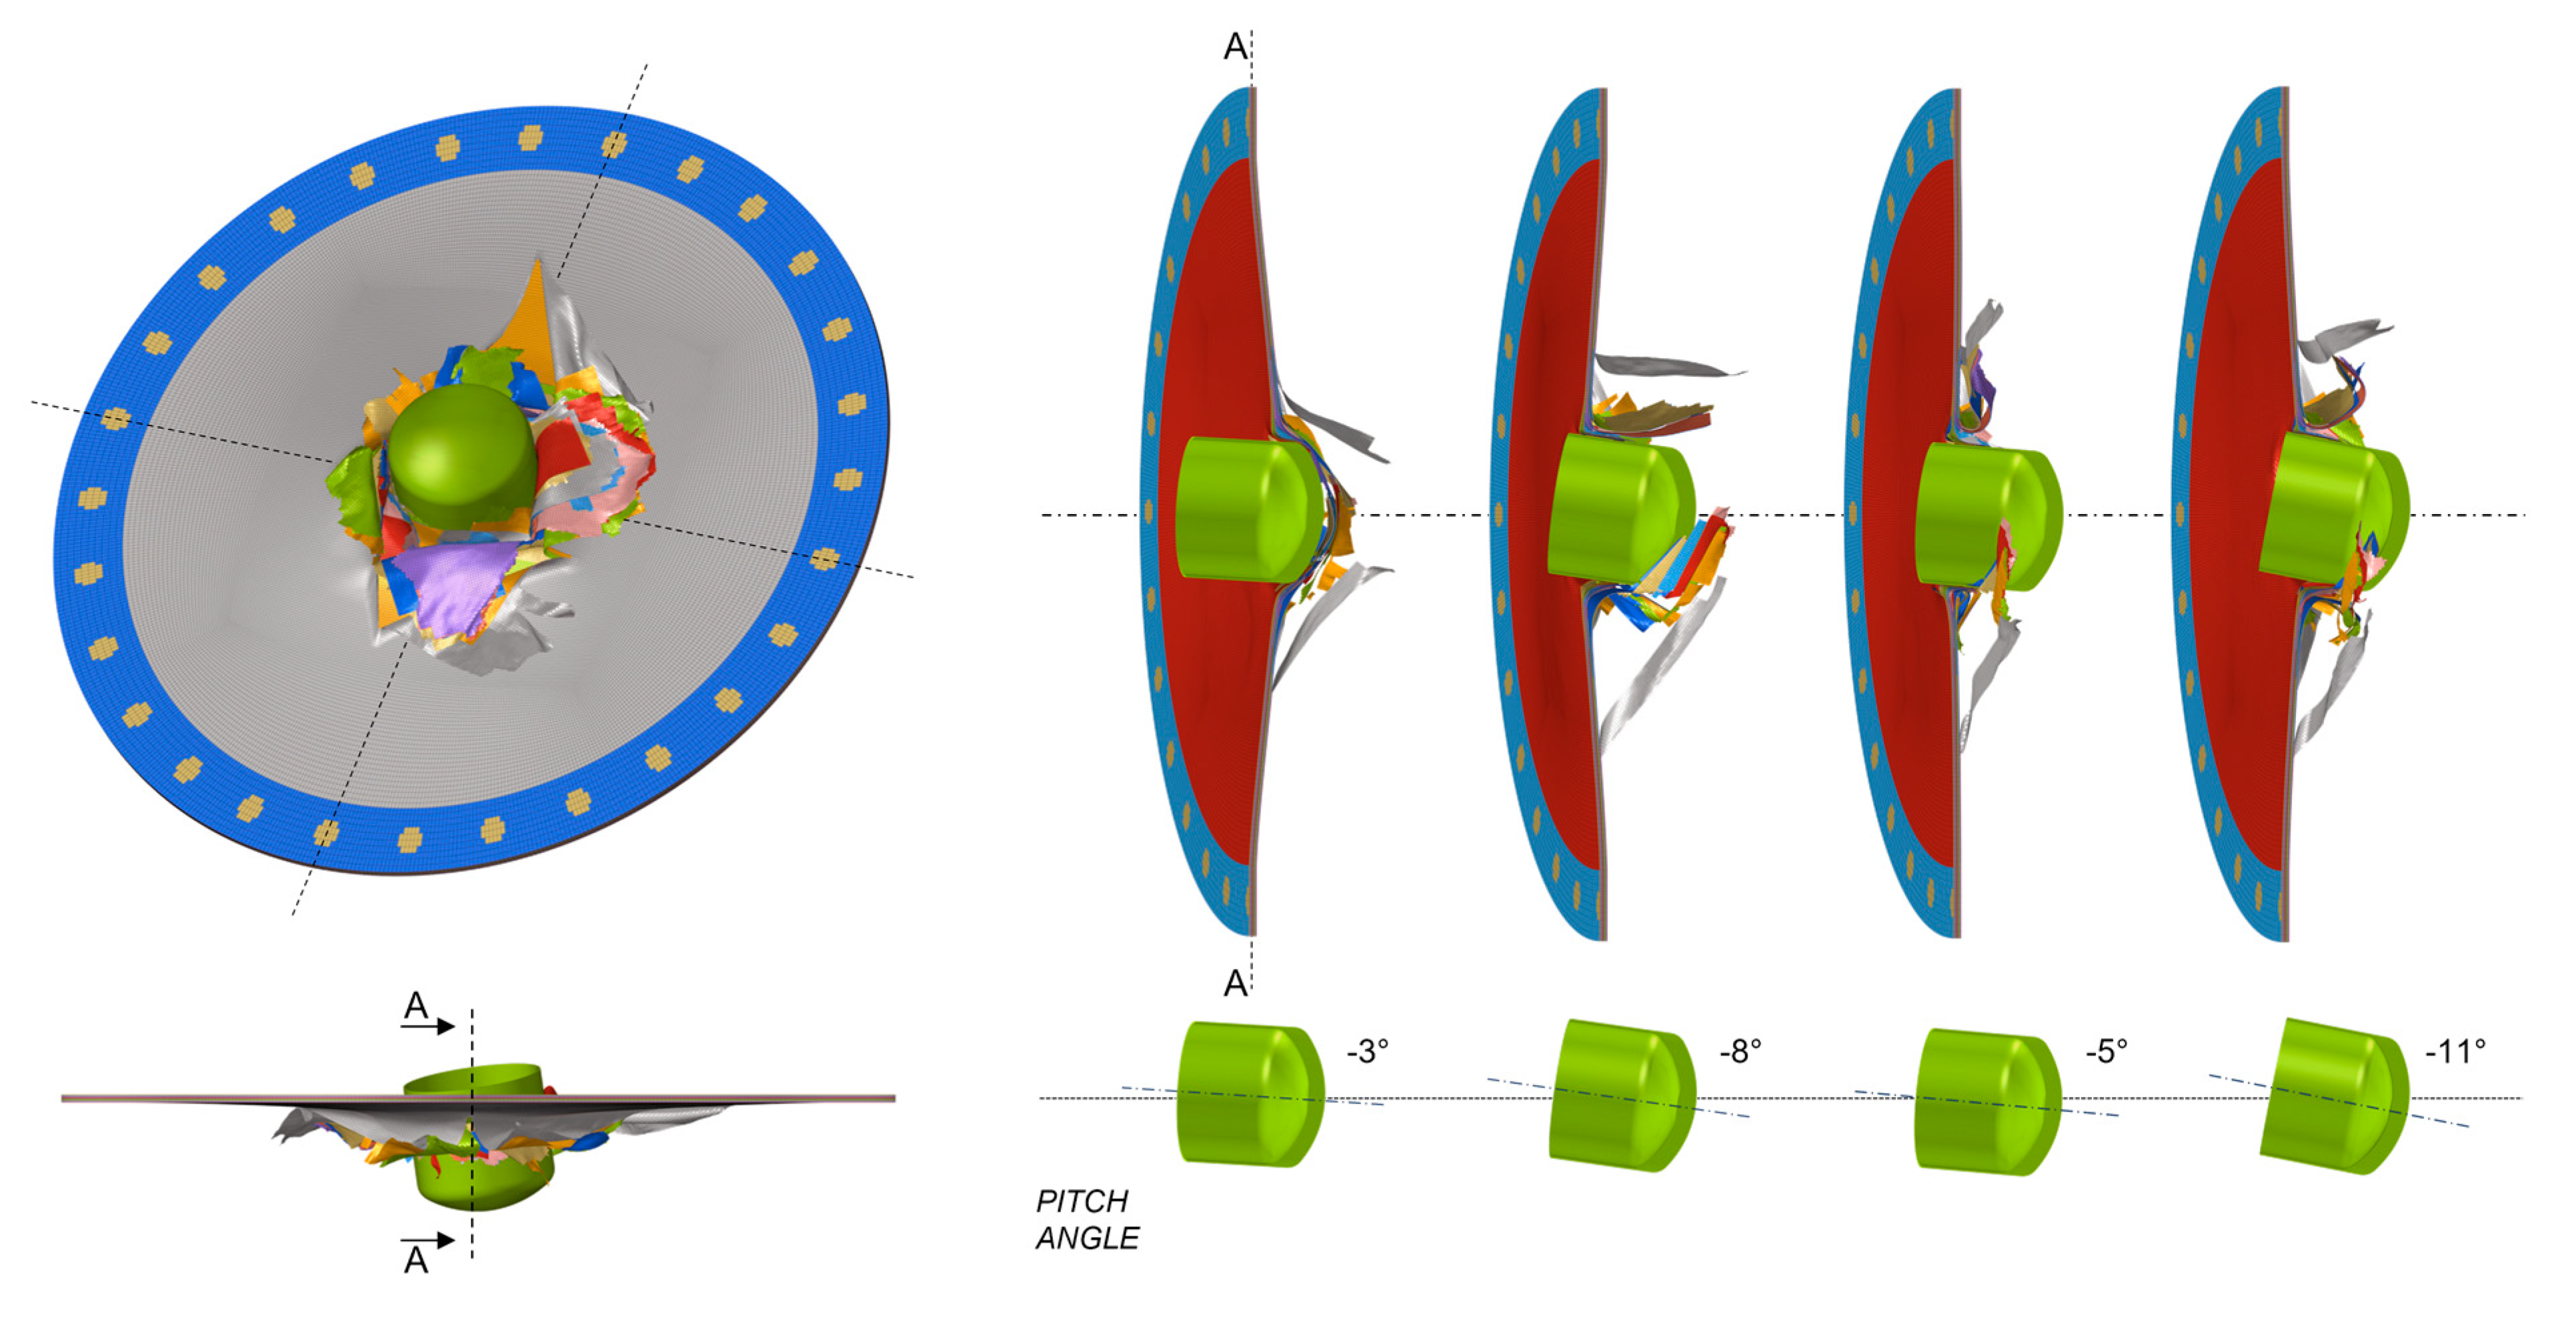
ERODS value previously introduced. The impact results considering the ASTM D8101 rigid impactor at +127.1 m/s against the selected composite panel are reported in
Figure 7. The numerical fracture morphology including delamination shape and its relative extension is compared against the experimental evidence as in [
13,
43]. The residual calculated velocity of the ASTM projectile after the complete perforation of the composite panel is +7.15 m/s, which is perfectly congruent with what is reported in [
13]. Moreover, the fracture evolution and the relative pitch angle dynamic variation of the impactor during the impact evolution is shown in
Figure 8 as also reported in experimental evidence [
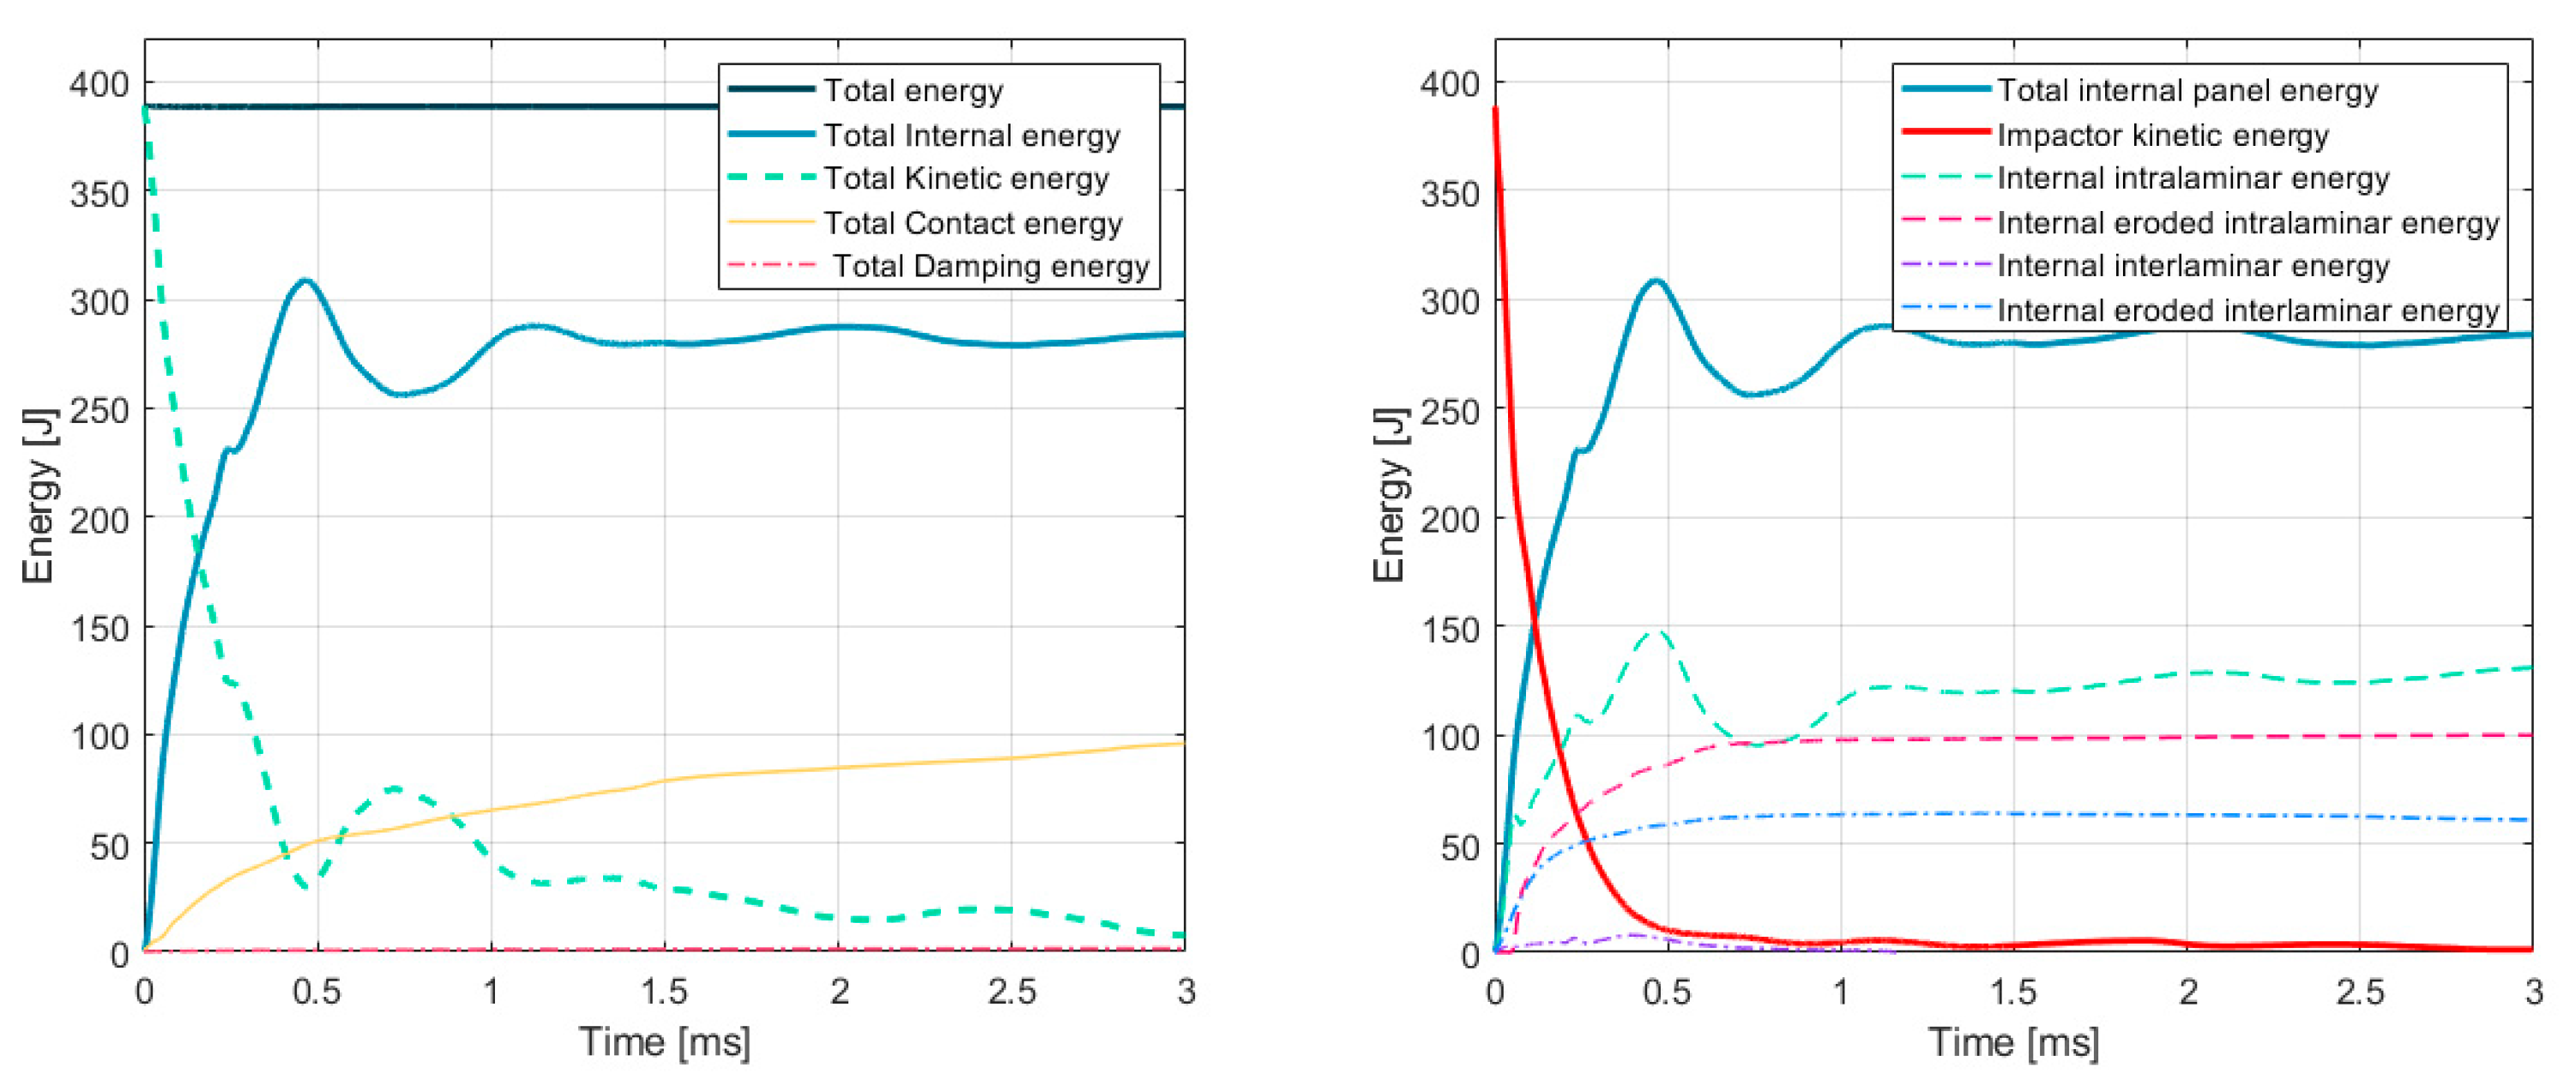
13]. The global energy conservation for the selected numerical model is presented in
Figure 9—SX. The graphs summarize the conversion of the projectile kinetic energy into internal composite elastic and fracture energies. During the perforation phase of the impact (t > 0.5 ms) a global kinetic and internal energy oscillation is observed. The energy is continuously exchanged between the impactor and the composite plate. After perforation (t > 0.75 ms), no more internal composite energy is dissipated and a projectile residual kinetic energy is observed. Furthermore, the graph reported in
Figure 9—DX resumes the distribution of the internal energy into the elastic and fracture contribution and the specific kinetic energy (KE) of the impactor. The KE of the projectile is drastically reduced starting from 389 J to 10 J in the first 0.5 ms. Therefore, 97.5% of the initial KE is dissipated in the first impact phase. Both internal intralaminar and interlaminar eroded energy, connected with the fracture evolution in the composite panel, is compared against the global internal energy that the entire structure observes during the impact evolution. The eroded energy contribution resumes the amount of KE that have been converted to initiate and propagate the fracture in the composite structure. After perforation, the eroded energy (intralaminar and interlaminar contribution) reaches a plateau: no further fracture propagation is observed. For this reason, the entire fracture phenomenon is extinguished in less than 1 ms.
The difference between the physical-based ERODS limit and the calibrated value is pointed out. Such a variation should be related to a potentially not consistent definition of the characteristic material toughness reported in
Table 2 for the selected material. Moreover, the combination of not fiber-aligned mesh structure with the definition of a global erosion threshold seems to be not consistent with the definition of reliable physical-based erosion control of FE in impact-explicit numerical models. A detailed evaluation of the proposed different aspects will be pointed out in future research studies. Consequently, a detailed experimental campaign seems necessary to define the characteristic energy properties of selected T800/F3900 to define a physical-based erosion threshold. Finally, the modeling technique presented here has been used for the evaluation of the coupled thermal-structural solution with the same material values and numerical parameters introduced and described.
The numerical model previously introduced and verified against the experimental observations has been used to define the thermo-structural coupled solution described here.
Figure 10 reports the temperature distribution for each composite layer at 25%, resulting in projectile initial KE. The ASTM projectile with an initial velocity of 127.1 m/s generates an internal thermal gradient that affects entirely all of the composite plate. The thermal distribution through the thickness and around the active fracture zone (AFZ) is reported. Maximum temperature values are localized in the middle layers of the composite panel due to the low thermal conduction of the CFRP.
The temperature evolution observed in P7 in the first 0.2 ms is reported in
Figure 11. The thermal map shows how the temperature progressively increases inside the specified composite ply during the fracture evolution. The map also illustrates that the thermal gradient follows a specific direction of propagation inside the intralaminar region orthogonal to the fiber direction. The thermal load spreads more easily into the matrix phase, which has higher thermal conduction than the carbon fiber phase (
Table 6). In particular, the localized peak of the temperature evaluated by the present numerical solution inside the AFZ is around 187 °C (460 K). The localized temperature is considerably above the typical epoxy glass transition temperature that ranges, respectively, around 80–150 °C (353–423 K) for resin infusion and pre-pregs aerospace-grade epoxy. Such thermal effects numerically determined have been investigated in particular for the related resin infusion (RI) characteristic material thermal limitations previously introduced.
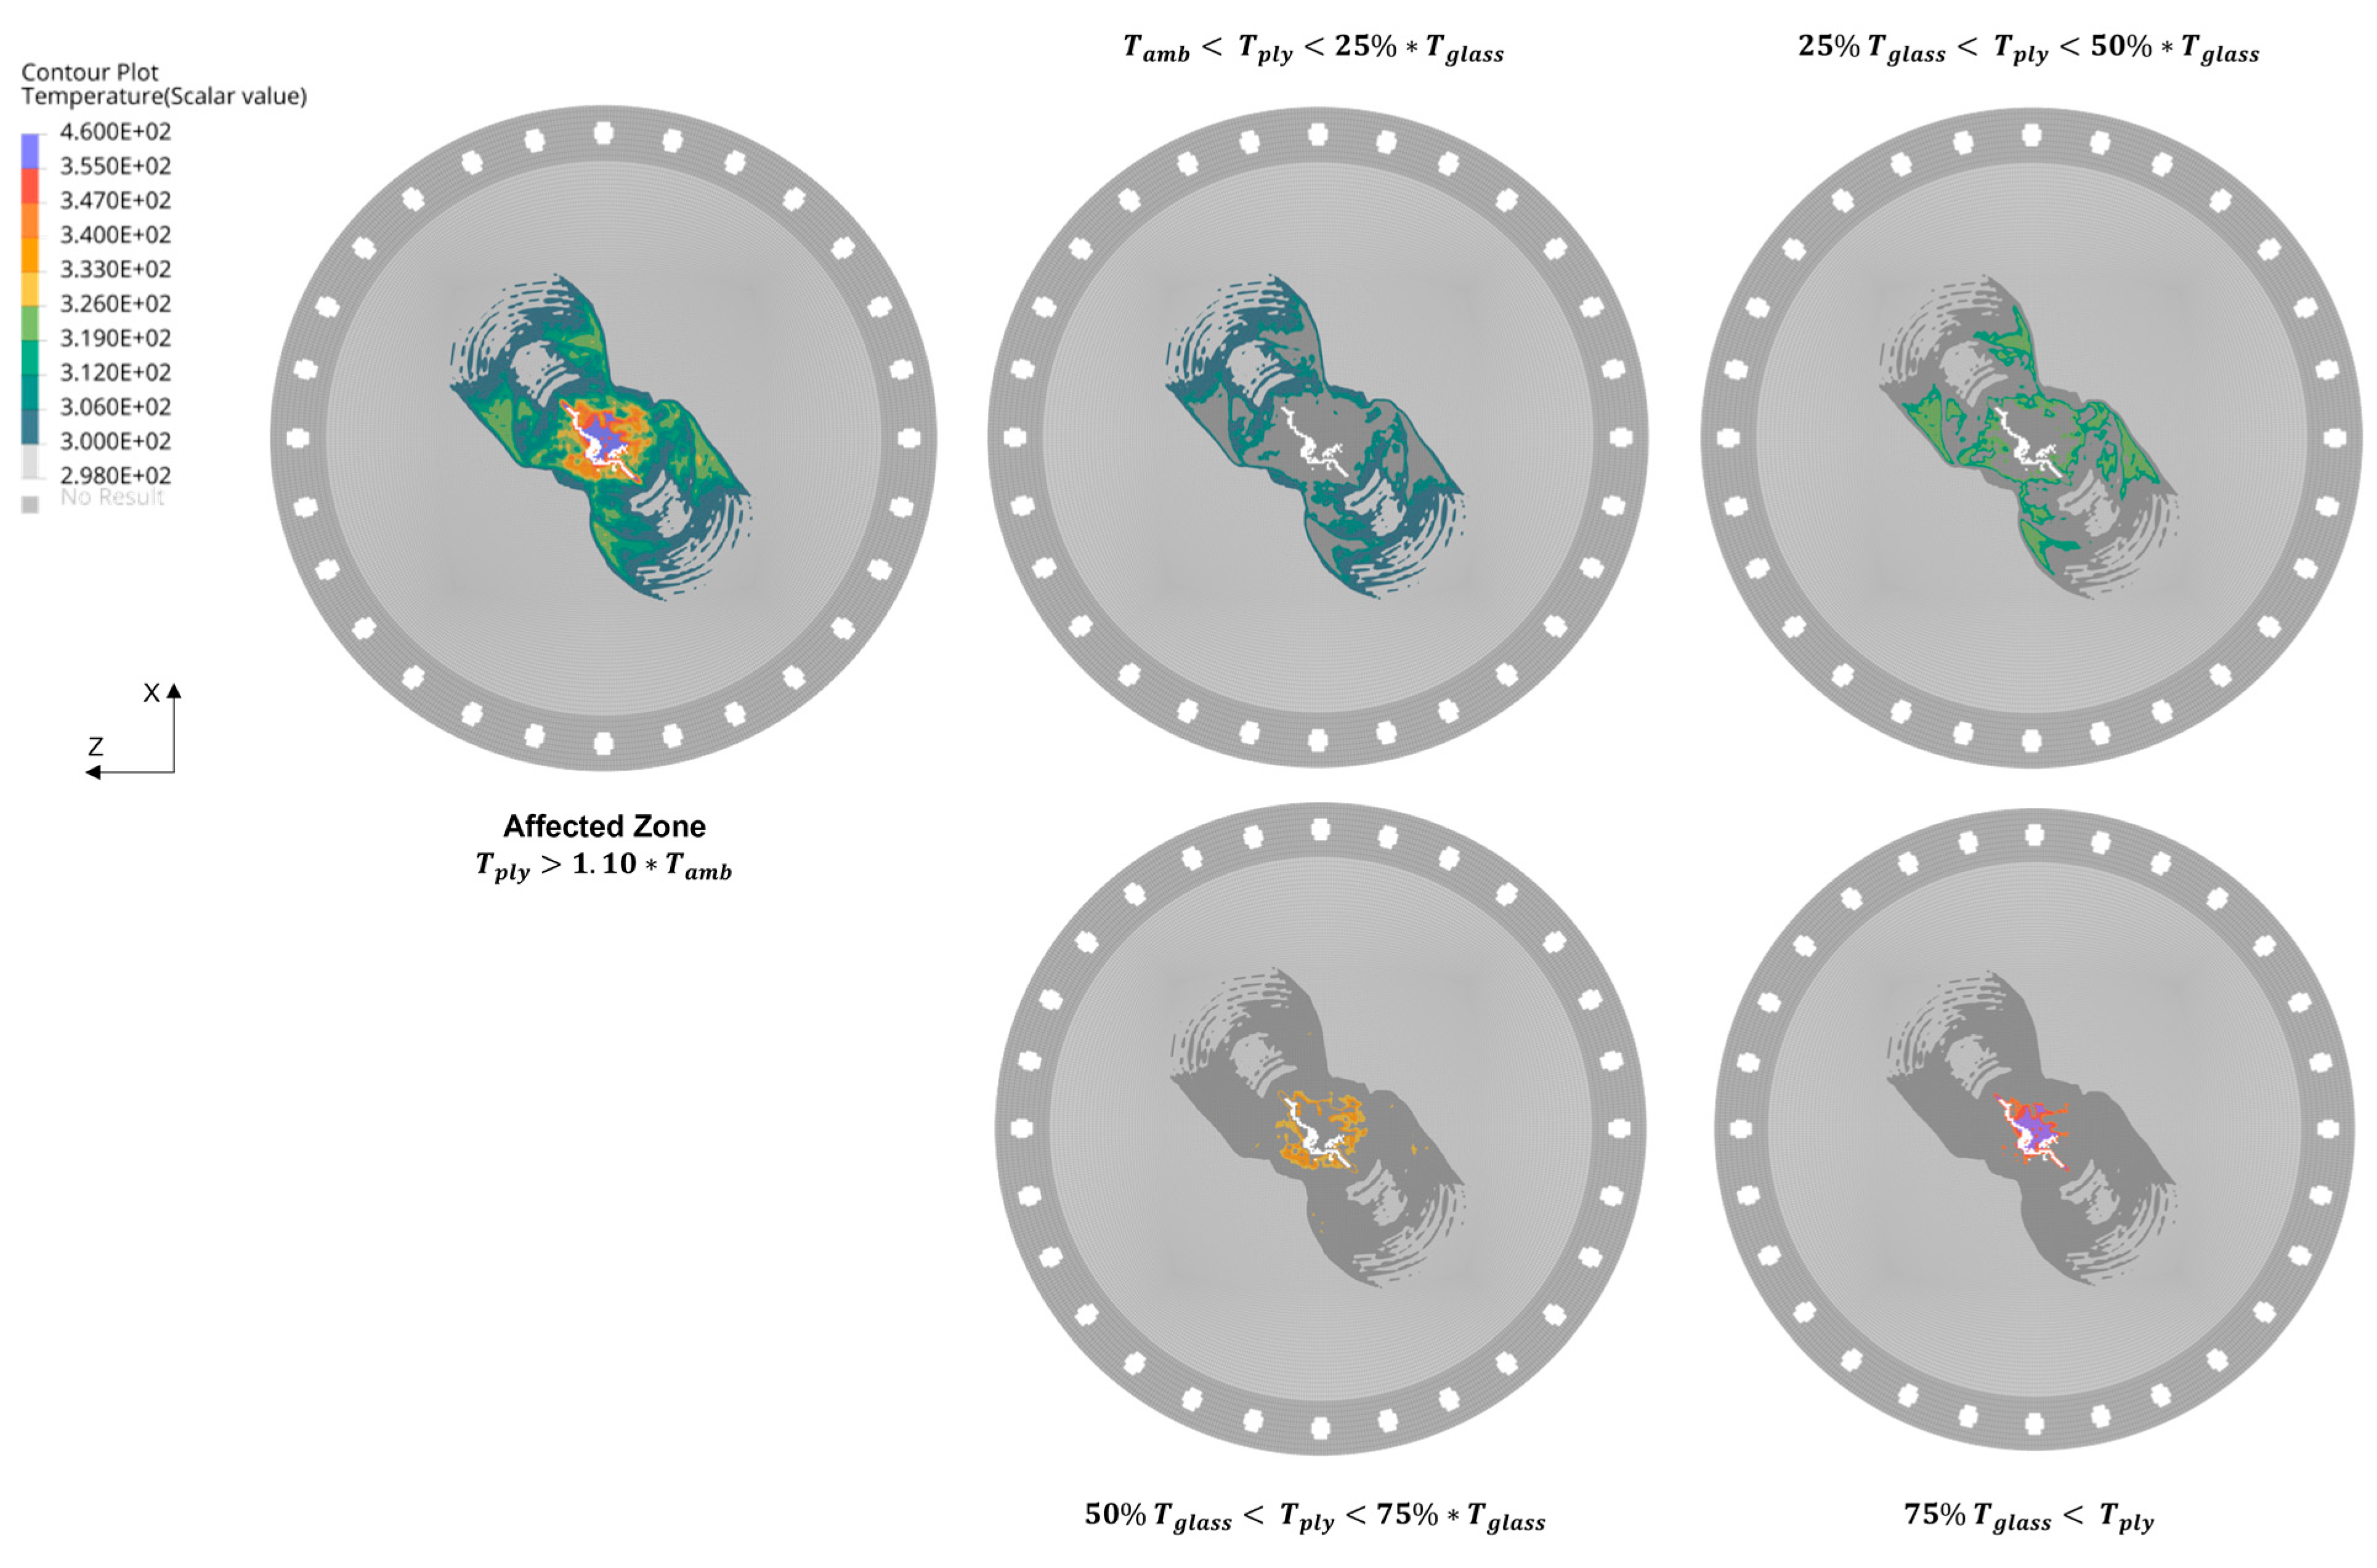
The thermal range between 25 and 82 °C (298–355 K) has been divided into four specific regions. Each characteristic thermal region associated with the plies P7 is reported in
Figure 12. Each section represents a specific range of temperatures that set a progressive reduction of the associated mechanical properties for a common aerospace-grade epoxy resin adopted for the RI manufacturing process. The localized area that shows the increment of the local temperature higher than 50% of the transition glass temperature is contained under the diameter of the characteristic ASTM impactor. Thus, the thermal degradation associated with the conversion of the kinematic energy into internal fracture is localized in that the specific fracture zone.
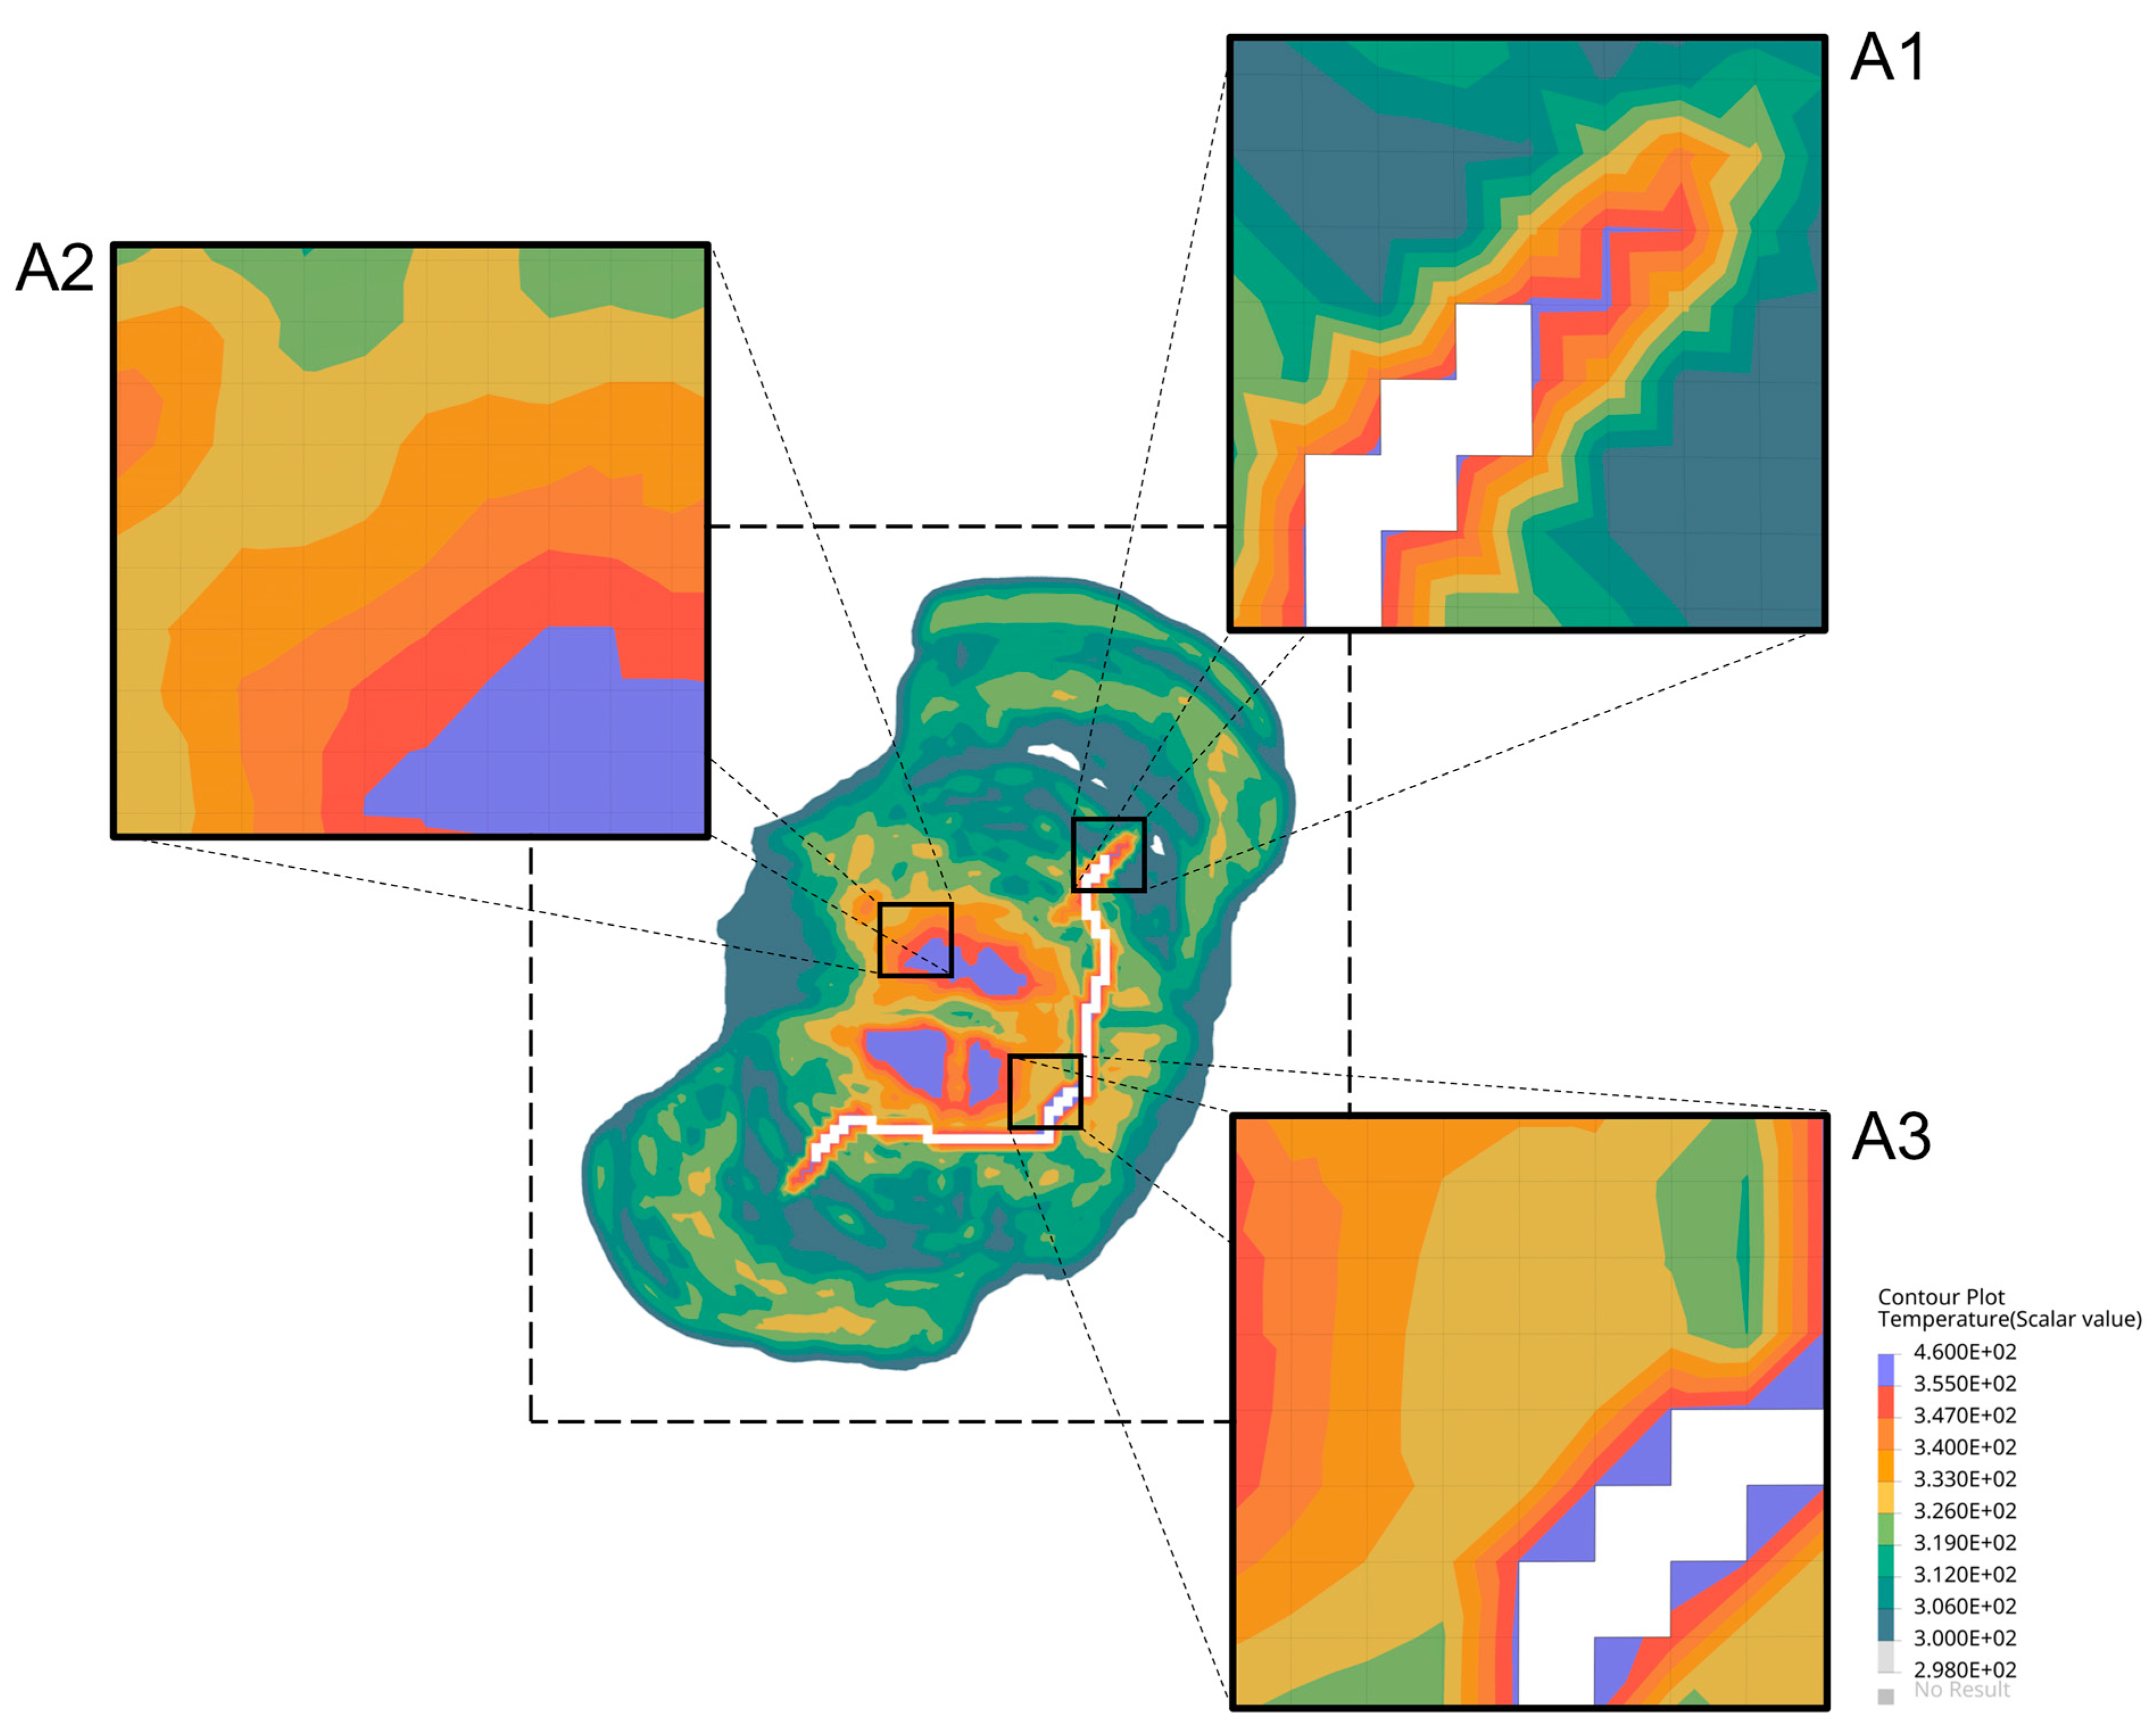
A close evaluation of the temperature distribution generated within P9 is reported in
Figure 13. The image shows three characteristic zones: A1, A2, and A3. Zone A1 details how the internal fracture energy is concentrated around the fracture propagation path. The image shows the peak of the thermal gradient along the line of nodes where the displacement of FE elements is evaluated, and fracture propagated. On the other hand, zone A2 specify how the temperature is smeared in the intralaminar region of the composite ply. Finally, zone A3 reports the residual thermal gradient after the propagation of the fracture inside the composite layer. The temperature is kept constant even after the erosion of the element to indicate that the thermal gradient generated is not dissipated quickly through adjacent layers. For this reason, the AFZ is affected by the conversion of the KE into the IE during the initiation of the fracture, but also after its propagation. The thermal degradation of the matrix phase has to be considered to evaluate the correct fracture evolution based on the physical phenomenon that originates around the composite fracture zone.
