Abstract
Shock waves and shock-shock interaction are typical phenomena in supersonic or hypersonic flows that have significant impacts on aerodynamic performance. To obtain a comprehensive understanding of the mechanism of shock wave interaction, shock wave detection (SWD) methods are required. However, it is often challenging for most current SWD methods to identify the relationship between shock waves (also known as shock topology). To address this issue, this paper proposes a novel three-dimensional shock topology detection method based on the tomographic reconstruction strategy. This method involves extracting parallel slices from the flow field, then utilizing a two-dimensional shock topology recognition algorithm to obtain shock lines. Shock bands are obtained by connecting shock lines for every two adjacent slices, and shock surfaces are generated by assembling shock bands. Interaction lines are also formed by connecting interaction points. The detected shock wave is a structure composed of “point-line-band-surface”, and the topology relationship with other shock waves is obvious. Numerical results show that the shock waves detected by the proposed method can be categorized into families. Moreover, the shock surfaces generated by this method are free of gaps, holes, and un-physical fragments, which is an improvement over existing SWD methods.
1. Introduction
The flow field around an aircraft flying at supersonic or hypersonic speed is mainly characterized by shock waves as well as their mutual interaction, which has significant effects on the aerodynamic, stability, and even aerothermodynamics performance of aircraft. On the one hand, by taking advantage of the high-pressure downstream of shock, high lift is generated for supersonic/hypersonic configurations, such as waverider [1] or high-pressure capturing wing [2], and better conditions are obtained for the inlet of scramjet [3]. On the other hand, negative effects such as wave drag, aerodynamic heating, pressure center jumping, rudder efficiency loss, sonic boom, etc., require extensive efforts to be avoided at the aerodynamic design phase [4,5]. Therefore, it is very important to accurately detect the shock wave structures using computational fluid dynamics (CFD) or experimental results, and further comprehensively understand the shock wave interacting mechanism [6]. In addition, with the help of shock wave interaction theory to better explore the local parameter relationships, it is necessary to identify the different shock topologies which reveals the connections between the various shock wave lines in the two-dimensional space, and surfaces in three dimensions. In particular, shock topology is also required as priori knowledge for several numerical methods, such as shock-fitting algorithms [7,8] and adaptive mesh techniques.
The shock reflection and interaction phenomena have sparked intense interest among numerous researchers over the last decades. Mechanisms such as the types of interaction, hysteresis phenomena, and the geometric features of shock waves have been intensively studied and revealed [6,9,10]. Traditional SWD methods are mainly based on the extremely high gradient of flow parameters across shock waves. In Pagendarm and Seitz’s method [11], the shock wave is located at the position where the second derivative of the density approaches zero. Lovely and Haimes [12] provided a method based on the essence that the flow speed perpendicular to the shock wave will drop from supersonic to subsonic after crossing the shock wave, thus the shock waves are located at the position where the normal Mach number is equal to one. Although these SWD methods are widely used in academic and engineering activities, due to numerical dissipations and oscillations, the final detected shock waves tend to be the structures with a lot of gaps or holes. When gradients appear in the denominator used in algorithms, they can increase the error in shock detection, leading to un-physical fragments, particularly in cases where the gradients are small, such as in uniform flow or slowly-varying isentropic flow. As a result, grid cells with small gradients have to be filtered. It is noted that, in these SWD processes, case-by-case filter parameters are also required based on the user experience according to specified CFD results, and as no uniform meaningful rules exist, it results in fragmentary shock surfaces and the elimination of weak shocks.
Recently, various novel SWD methods have been proposed in combination with machine learning algorithms to improve quality or efficiency. Monfort et al. [3] and Liu et al. [13] created the SWD methods based on convolutional neural networks (CNNs), where the training data is generated from the aforementioned traditional SWD methods. In recent years, CNNs are commonly used for the detection of flow structures [13,14,15,16]. Based on the image edge extraction algorithm, several two-dimensional SWD methods [17,18,19] can obtain effective results by processing the numerical or experimental Schlieren images. In addition, Kanamori and Suzuki [20] derived a method for determining shock waves by using characteristic theory and expanded it to the three-dimensional flow field [21]. However, the calculation procedure of this method is complicated [6].
In essence, the aforementioned SWD methods detect shock waves based on “local” features [22], such as the local gradients of pressure or density. Thus, the detected results are generally point/segment clouds that indicate the location of shock waves, without providing information about shock topology. Taking this into consideration, some researchers have tried to further identify the shock topology according to the “global” features of shock waves. Paciorri and Bonfiglioli [22] utilized the Hough transform and least-square fitting algorithms to acquire two-dimensional shock lines and constructed the shock topology using the fuzzy logic technique. Chang et al. [23] introduced a two-dimensional shock topology recognition method based on the K-means cluster analysis [24] and Bézier curve fitting algorithm [25]. They built up the shock topologies by connecting the adjacent “shock clusters”. Two-dimensional shock lines could be automatically identified according to this method. Nevertheless, three-dimensional shock waves are of practical interest and their topologies are much more complicated. These methods may be difficult to straightforwardly extend to three-dimensional flow, so it is still necessary to develop an effective method for three-dimensional shock topology recognition. This study provides an automatic topological reconstruction method of three-dimensional shock surfaces from a series of tomographic slices in order to avoid the appearance of holes, gaps, and un-physical fragments on shock wave surfaces. Tomographic reconstruction is a method of building a three-dimensional model from parallel slices and is frequently utilized in geometric modeling for use in areas such as medical imaging [26] and geological exploration [27].
In this paper, we provide an automatic shock topology detection method in three-dimensional flow fields from CFD results. In Section 2, the detailed algorithm and procedure of the three-dimensional shock topology reconstruction method are described. In Section 3, numerical verifications with several typical shock reflection and interaction structures are provided, and the shock surfaces detected by the algorithm described in this study are compared to traditional ones obtained. Finally, the conclusions are summarized in Section 4.
2. Three-Dimensional Shock Topological Reconstruction Algorithm
First, this section provides a detailed explanation of the tomographic reconstruction strategy, which involves slicing a three-dimensional flow field. Then, we introduce the two-dimensional shock topology recognition method [23] performed on each slice, which enables the extraction of the shock topology information from all slices. Finally, the approach to connecting the topology information of each slice is described, leading to the final shock surfaces and their topological structures.
2.1. Tomographic Reconstruction Strategy
Tomographic reconstruction is a common method for three-dimensional reconstruction in medical imaging [26]. Drawing on the idea of tomographic reconstruction, the three-dimensional flow field is cut into multiple slices to reconstruct the three-dimensional shock surfaces. In Computed Tomography (CT) scanning, the X-ray direction is perpendicular to the generated slice. Therefore, to facilitate the selection of the slice direction in this study, the direction parallel to the inflow and the main characteristic plane is adopted. The main characteristic plane is a cross-sectional view which can display the shock structure of the flow field more intuitively. This method has certain limitations and is not suitable for cases where the shock wave is parallel to the slice. In the future, data fusion can be performed using slices from different directions to solve this issue. As for the selection of the space between slices, we choose the minimum grid size of the flow field on the first slice as the space between the first and second slices, and so on. The range of the slices starts at the edge of the flow field for the first slice position and is followed by a series of slices covering the entire flow field with the spacing between the slices as described earlier. For a three-dimensional flow field, a schematic diagram of two-dimensional parallel slices is shown after the slices are taken, as in Figure 1a. Figure 1b is any of the slices depicted in Figure 1a. In Section 2.2, the two-dimensional shock topology recognition method will be applied to the part outlined in the box of Figure 1b.
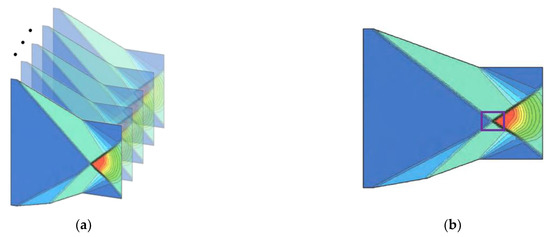
Figure 1.
Schematic diagram of the two-dimensional parallel slices in any three-dimensional flow field: (a) parallel slices, (b) an arbitrary slice.
2.2. Two-Dimensional Shock Topology Recognition Method
The two-dimensional shock topology recognition method [23] consists of three main steps: first, identifying shock cells to obtain all the grid cells that can represent shock waves in the flow field; second, clustering the shock cells using the K-means algorithm [24] to group them into multiple shock clusters to obtain the type and topological information of each cluster based on their adjacency relationship; and finally, treating the cluster centers as points on the shock wave and fitting them, using Bézier curves [25], to obtain smooth shock lines. This process enables accurate identification of shock topology in two-dimensional flow fields or slices.
2.2.1. Identification of Shock-Cells
To identify shock cells, the shock-capturing solution was treated as raw data and all cells were filtered based on the flow direction pressure gradient at the centers of the grid cells. Equation (1) presents the flow direction pressure gradient:
where indicates the pressure gradient at the center of the grid cell, and denotes the velocity vector. The following requirements must be satisfied by the :
where refers to a filter factor. Its value is suggested to be around 0.01, depending on many numerical simulations. represents the maximum flow direction pressure gradient.
After the filtered cells have been returned, the shock cells can be identified. Shock cells are defined as cells in which shock waves are present. A schematic diagram in Figure 2 illustrates the shock cells that have been detected in the local flow field.
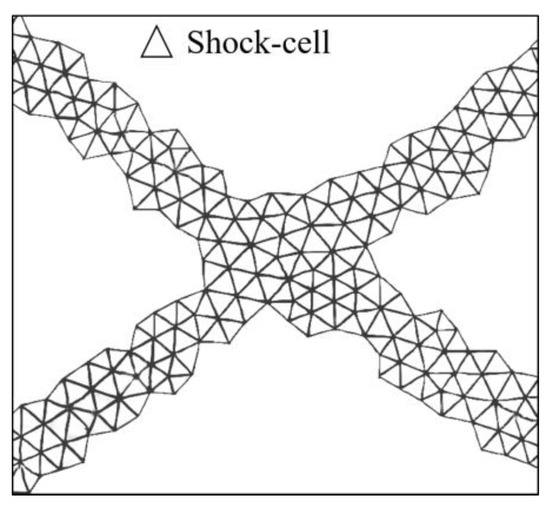
Figure 2.
Detected shock-cells.
2.2.2. Cluster Analysis of Shock-Cells
The K-means cluster analysis is a traditional data clustering method [24]. Following the application of K-means cluster analysis, all shock cells were grouped into a set of clusters, as illustrated in Figure 3a. Different colors represent different clusters. The topology types of shock clusters are explicitly classified into four divisions. By merging multiple adjacent interaction clusters and adjacent boundary clusters (Figure 3b), the topology type of each cluster is easily determined based on its adjacent information, as shown in Table 1. The shock topologies, such as shock-shock interaction or shock-wall interaction, can be identified based on these four types of shock clusters. The ordinary cluster center is referred to as an “ordinary point”, while the other cluster centers are collectively referred to as “key points”.
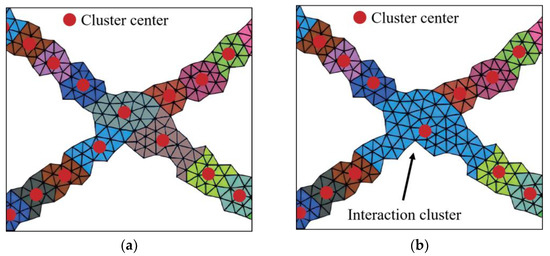
Figure 3.
Schematic diagram of shock clusters: (a) the initial result of the shock clusters, (b) the final result of the shock clusters.

Table 1.
Four kinds of shock clusters.
2.2.3. Identification and Curve Fitting of the Shock Lines
To generate a shock line, the search begins at a key point and continues sequentially, recording the adjacent ordinary point(s) until another key point is reached. To obtain smoother shock lines, the renowned Bézier curve fitting method [25] is utilized. Figure 4 shows the shock lines fitted from the cluster centers in Figure 3b.
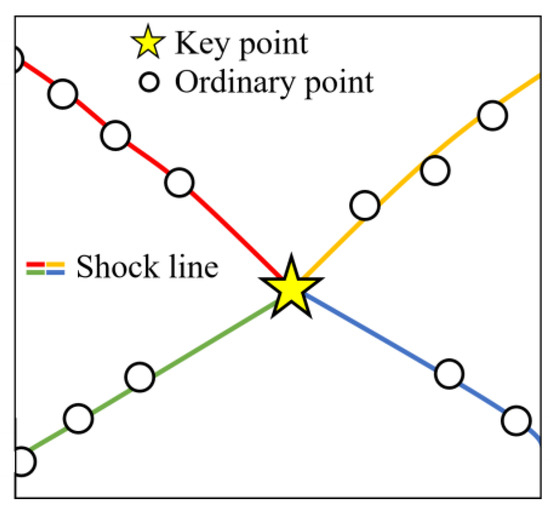
Figure 4.
Fitting shock lines.
2.3. Three-Dimensional Shock Topology Reconstruction Algorithm
When shock lines are obtained in all slices, the shock bands, which fill the space between two corresponding shock lines in adjacent slices (Figure 5a), can be obtained by a mapping strategy described later in this section. The shock surfaces are generated by connecting the adjacent shock bands, and the interaction lines are also obtained by connecting the corresponding key points (Figure 5b). Thus, a “point-line-band-surface” structure representing the shock topology is effectively extracted.
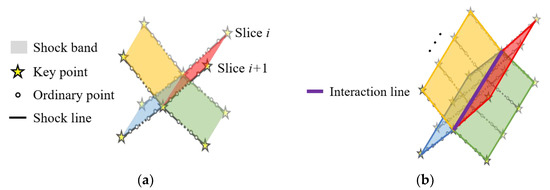
Figure 5.
Schematic diagram of the presented three-dimensional shock topology detection method: (a) shock bands between two adjacent slices and (b) shock surfaces obtained by connecting adjacent shock bands.
Before deriving this algorithm, we will first introduce the notation which will be used hereafter. During actual detection, the points fitted on the shock line can be substituted for the original cluster centers of ordinary clusters and considered as internal ordinary points. Consequently, the results from the two-dimensional shock topology recognition method are points with different topological information. In fact, an arbitrary two-dimensional shock line in each slice could be represented by the key points and internal points (ordinary points). In the slice, all key points are denoted as the set . Accordingly, the th shock line can be represented using the starting point , the ending point:
The key procedure of this method is the mapping of corresponding key points and the establishment of shock bands. Taking a free-shaped shock surface as an example, the mapping strategy is described in Figure 6. The most common situation, called “1-to-1 mapping”, is first described in Figure 6a between slice i and i+1 with its local topology displayed in Figure 6b. The key point (marked C) in slice i and (marked A) in slice i+1 are mapped only if their distance is smaller than all other pairs of key points in these two slices, which is expressed as:
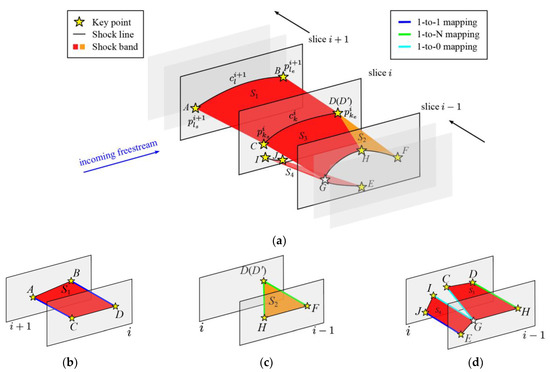
Figure 6.
Schematic diagram of the mapping strategy: (a) key points, shock lines, and shock bands in or between adjacent slices. (b–d) the local topologies of (b) 1-to-1 mappings, (c) 1-to-N mapping, and (d) 1-to-0 mapping.
is the Euclidean distance. The shock line k is expressed as , where are two key points that represent the starting and ending positions of this shock line, respectively. Two shock lines and are mapped, only if their key points are mapped respectively. Once two shock lines are mapped, a shock band can be automatically formed between them. For example, the shock band S1 is formed between (marked CD) in slice i and (marked AB) in slice i+1, where key point is mapped to and (marked D) is mapped to (marked B).
By traversing each slice, the mapping relationships in a series of shock lines could be established. Assuming that the shock lines are generated from slice to 𝑛, two edge lines and could be generated by the starting points and ending points, respectively. As a result, the three-dimensional shock band is obtained through the shock curves and two edge curves, expressed as:
The shock lines and edge curves are also known as the primary and cross curves, respectively.
In most situations, key points follow the 1-to-1 mapping relationship mentioned above (Figure 6b) if the distance between two adjacent slices is small enough. However, due to the complexity of the three-dimensional shock topology, there are two special situations which are described as follows, in terms of the shock bands between slices i−1 and slice i:
- 1-to-N mapping (Figure 6c): according to the mapping criterion described by Equation (1), key points H and F in slice i−1 are at the same distance to the single key point D in slice i which may appear when the shock wave interaction pattern changes suddenly. In this situation, a virtual key point is created at the same position of D. Thus, can be treated as a shock line with zero length mapped to shock line , and the shock band S2 can be formed by and ;
- 1-to-0 mapping (Figure 6d): the key points E and H of shock line are mapped to J and D, respectively. However, J and D belong to different shock lines in slice i, in other words, there are no key points in slice i−1 mapped to the remaining key points I and C. This case may occur when the shape of the wall or the topology of the shock line in the adjacent slices changes dramatically. An inner key point G is created on shock line , which is equidistant from I and C, and maps both I and C. Accordingly, the two shock bands, S3 and S4, can finally be formed.
Once the shock bands are formed between all the adjacent slices, the shock surfaces can be established by connecting shock bands one by one, where each shock band shares one shock line with its adjacent shock band. The side boundaries of shock surfaces, which are connected by the key points of the shock lines, are named “cross lines” in this paper. Therefore, the type of cross line can be judged clearly according to the classification of the key points [23]. As a result, the three-dimensional shock topologies can be identified, including separated shock waves as well as their interaction lines.
Furthermore, besides the shock topology, this method can also obtain smooth shock surfaces, without gaps, holes, and even un-physical fragments, which may be common deficiencies of most existing SWD methods. Moreover, benefiting from the advantages of the two-dimensional shock topology recognition method [23], this method’s filter parameter selection is less sensitive, making it promising for practical application.
3. Numerical Validation
In this section, the three-dimensional shock tomographic reconstruction algorithm that is suggested in this paper will be used to obtain the geometric shapes of the shock surface and the interaction positions of the shock surfaces for the flow fields containing typical shock reflection/interaction by way of CFD numerical simulations. For comparison, the SWD results obtained using a traditional method in [11] are also presented. The shock-capturing method is used to solve validated examples. An inviscid CFD solver with the second-order total variation diminishing scheme for spatial discretization and the implicit time-marching scheme is applied. The reliability of this solver has been verified in [2]. Next, the general applicability of the algorithm is verified by using three examples containing plane/curved shock surfaces and the shock reflection/shock-shock interactions.
3.1. Planer Shock Regular Reflected on a Side-Inclined Wall
Firstly, Figure 7a displays an oblique shock wave reflected on an inclined wall, where the incoming Mach number is 3.5. An incident shock wave, arising from the lower wall with the inclination angle of , is reflected (along the line marked c), on the upper wall with the spanwise deflection angle of . The incident shock wave does not reach the upper boundary at the side boundary A-A, but has already reflected at the boundary B-B. The pressure contours of the slices at boundary A-A and boundary B-B, as well as the two-dimensional shock topology recognition results on these two slices, are shown in Figure 7b,c. To emphasize the two-dimensional recognition results, the pressure contours on the slices are presented in a semi-transparent state.
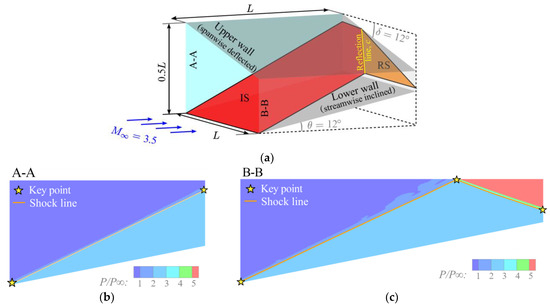
Figure 7.
Planer shock with regular reflection on a side inclined wall: (a) illustration of the shock wave structure and the calculation domain, (b,c) two-dimensional shock topology recognition results and pressure contours in side boundaries A-A and B-B.
Even though it is a rather simple case, problems may still arise using traditional SWD methods. Figure 8a displays the shock surfaces, represented by the iso-surfaces of , which are detected using the method in [11] with the filter parameter of . Here and are the first and second derivatives of density in the direction of velocity, respectively. The shock wave near the reflecting line is filtered out due to its smaller density gradient, leaving an evident gap between the incident and reflected shock waves. Moreover, due to the oscillations above the reflected shock wave near the side boundary B-B, un-physical fragments are incorrectly detected as shock waves. To remove these fragments, the filter parameter is changed to and the results are displayed in Figure 8b. However, there is still a gap near the reflection line, and its accurate position cannot be identified automatically.
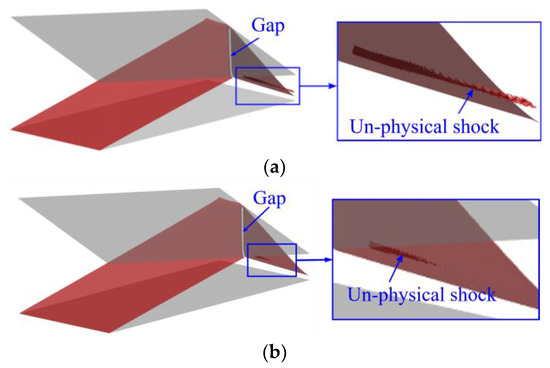
Figure 8.
Shock waves detected by the traditional method with the filter parameter of (a) and (b) , where the red and gray surfaces are the detected shock waves and walls, respectively.
Figure 9 displays the shock wave structures and shock topology detected using the method proposed in this paper. The shock wave structures are constructed by the key points, shock lines, shock bands, and shock surfaces, where the incident and reflected shock waves (IS and RS) are connected by a reflection line c along the upper wall. It is noted that the final detected shock surfaces are smoother and more complete than the results shown in Figure 8.

Figure 9.
Shock waves detected by the method proposed in this paper: (a) shock surfaces and reflection lines, (b) the “point-line-band-surface” structure for shock topology.
3.2. RR-MR Transition of Conical Shock Reflection
The next case illustrates the shock-shock interaction between two conical shock waves. The geometry and dimensions are displayed in Figure 10a, where incoming airflow at Mach number 6 passes through two parallel cone-cylinder models with a half-cone angle of 30°. The grid in this case is refined near the shock reflection, with an average grid spacing of 0.0001 L. Two conical shock waves are formed and interact at the horizontal symmetry plane. The interaction type changes from regular reflection (RR) to Mach reflection (MR) at a certain point C, as seen in Figure 10b. Figure 10c shows the pressure distribution contours of the flow field boundary and illustrates pressure contour lines at different slicing positions, including points B and C.
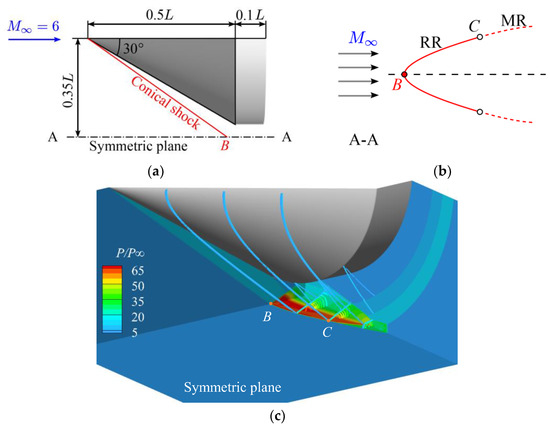
Figure 10.
RR-MR transition of conical shock reflection: (a) geometries and dimensions, (b) schematic of shock wave structure, (c) pressure contours.
Figure 11a,b depict the pressure contours and the two-dimensional shock topology recognition results on two slices near the transition point C. In Figure 11b, a partial enlargement has been deliberately added to the image, and key points have been hidden, with only the detected shock lines and pressure contours being partially enlarged. Meanwhile, Figure 11c,d illustrate the local amplifications of the shock wave and transition point C, which were obtained using traditional methods of [11] and the approach proposed in this study. Shock waves obtained using the traditional approach are represented using triangulated surfaces and their mutual interaction line can only be detected by the human eye. In addition, in Figure 11c, there are un-physical shocks not completely close to the Mach stem, which increases the difficulty of analyzing the shock wave interaction characteristics in this region. On the other hand, the interaction lines were automatically located with this method during the study, see c1 for the regular interaction line, c2/c3 for the Mach interaction lines, C for the transition point in Figure 11d, and their coordinates are in Figure 11e.
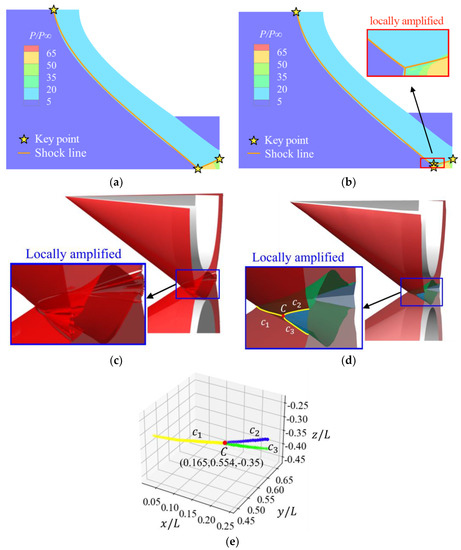
Figure 11.
Shock detection results: (a,b) the pressure contours and two-dimensional shock topology recognition results on two slices near the transition point C, (c,d) local shock surfaces near the interaction line by the traditional method and the method proposed by this study, (e) coordinates of the interaction lines and the transition point.
3.3. Interaction between Curved Shock Surfaces
The final case looks at the shock structures around a blunt-cylinder-flare body with the geometrical dimensions shown in Figure 12a, where the incoming Mach number is 2.95 and the angle of attack is 10°. The strong bow shock wave originating at the leading edge weakens in the downstream part of the leeward side, and the expansion fan appears near the windward side, close to the tapered corner. The embedded shock in the vertical symmetric plane is displayed as two isolated shock lines separated by the blunt-cylinder-flare body, as seen in Figure 12b. They are connected at the slice with a spanwise distance greater than 0.15L, the two shock waves are connected into one, as seen in Figure 12c,d. According to the detection method used in this study, the embedded shock is “one” shock surface consisting of these shock lines, which is already displayed in Figure 13a.
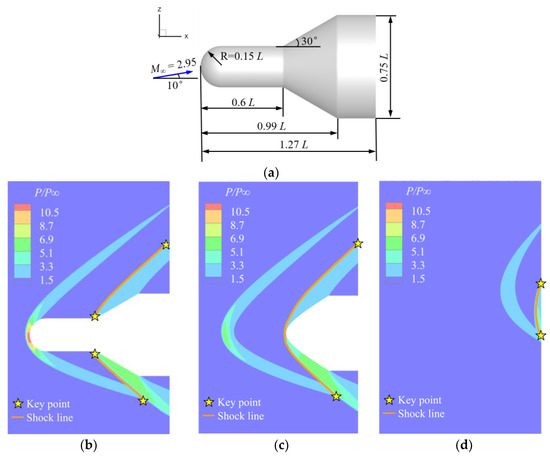
Figure 12.
Interaction between curved shock surfaces: (a) numerical calculation domain. Shock lines from embedded shock at various semitransparent slices with (b) y = 0 (the vertical symmetric plane), (c) y = 0.15L, and (d) y = 0.72L.
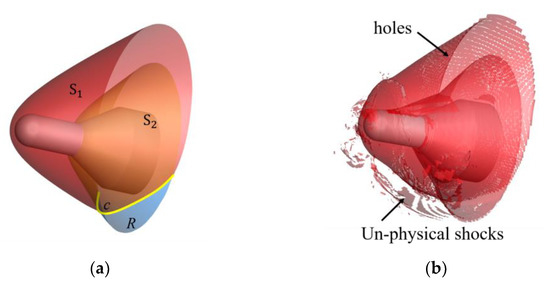
Figure 13.
Shock waves are detected by (a) the method in this study and (b) the traditional method as a contrast.
The bow shock S1 and the embedded shock S2 mutually interact along line c, as seen in Figure 13a, which are detected by the method proposed in this study. In contrast, shock waves detected by the traditional method in [11] are shown in Figure 13b, where numerous holes and un-physical shocks appear, and no topologies are obtained. Therefore, near the interaction position in Figure 13b, it is hard to distinguish the shock. As a result, it is difficult to accurately distinguish the shock waves near the interaction position in Figure 13b, and there is no clear interaction line. Additionally, a large number of un-physical shocks are identified in the locations where there are no shock waves, such as in front of the bow shock wave. There are also misidentified cases in the vicinity of expansion waves; weak shock waves leading to holes and gaps in the bow shock surface. However, in Figure 13a, these above-mentioned misidentified cases are significantly reduced in the results obtained by the tomographic algorithm because the proposed method makes use of the accuracy of the two-dimensional shock topology recognition method [23]. This case demonstrates the greater reliability of the tomographic reconstruction algorithm compared to the traditional technique [11].
4. Conclusions
In summary, we have proposed a method of shock wave and shock topology detection identified from three-dimensional numerical results. This method automatically detects reflection and interaction lines that separate shock surfaces, resulting in smoother shock surfaces without gaps, holes, or un-physical fragments. It is accurate for various types of shock structures, such as incident shock, reflected shock, and Mach stem. This method has potential applications in the research and development of supersonic/hypersonic aircraft for complex shock structures. In future research, the robustness of this method still needs to be validated with more test cases, and more effort is needed to address issues, such as the direction of slices and more efficient spacing strategies.
Author Contributions
Conceptualization, M.L. and Z.T.; methodology, M.L. and Z.T.; software, M.L.; validation, M.L., Z.T. and S.C.; formal analysis, M.L. and S.C.; investigation, K.C. and S.D.; resources, Z.T. and S.D.; data curation, M.L., Z.T. and S.C.; writing—original draft preparation, M.L., Z.T. and S.C.; writing—review and editing, M.L. and Z.T.; visualization, M.L. and S.C.; supervision, K.C.; project administration, K.C. and S.D.; funding acquisition, K.C. and S.D. All authors have read and agreed to the published version of the manuscript.
Funding
This research was funded by the National Natural Science Foundation of China under Grant No. 12002347 and the Basic frontier science research Program of the Chinese Academy of Sciences under Grant No. ZDBS-LY-JSC005.
Data Availability Statement
Data sharing not applicable.
Conflicts of Interest
The authors declare no conflict of interest.
References
- Nonweiler, T. Aerodynamic Problems of Manned Space Vehicles. J. R. Aeronaut. Soc. 1959, 63, 521–528. [Google Scholar] [CrossRef]
- Cui, K.; Li, G.-L.; Xiao, Y.; Xu, Y.-Z. High-Pressure Capturing Wing Configurations. AIAA J. 2017, 55, 1–11. [Google Scholar] [CrossRef]
- Monfort, M.; Luciani, T.; Komperda, J.; Ziebart, B.; Mashayek, F.; Marai, G.E. A Deep Learning Approach to Identifying Shock Locations in Turbulent Combustion Tensor Fields. In Modeling, Analysis, and Visualization of Anisotropy; Schultz, T., Özarslan, E., Hotz, I., Eds.; Springer International Publishing: Cham, Germany, 2017; pp. 375–392. [Google Scholar]
- Votta, R.; Schettino, A.; Bonfiglioli, A. Hypersonic High Altitude Aerothermodynamics of a Space Re-Entry Vehicle. Aerosp. Sci. Technol. 2013, 25, 253–265. [Google Scholar] [CrossRef]
- Perurena, J.B.; Asma, C.O.; Theunissen, R.; Chazot, O. Experimental Investigation of Liquid Jet Injection into Mach 6 Hypersonic Crossflow. Exp. Fluids 2009, 46, 403–417. [Google Scholar] [CrossRef]
- Wu, Z.; Xu, Y.; Wang, W.; Hu, R. Review of Shock Wave Detection Method in CFD Post-Processing. Chin. J. Aeronaut. 2013, 26, 501–513. [Google Scholar] [CrossRef]
- Onofri, M.; Paciorri, R. Shock Fitting: Classical Techniques, Recent Developments, and Memoirs of Gino Moretti; Springer International Publishing: Berlin, Germany, 2017; pp. 171–190. [Google Scholar]
- Chang, S.; Bai, X.; Zou, D.; Chen, Z.; Liu, J. An Adaptive Discontinuity Fitting Technique on Unstructured Dynamic Grids. Shock. Waves 2019, 29, 1103–1115. [Google Scholar] [CrossRef]
- Skews, B.W. Aspect Ratio Effects in Wind Tunnel Studies of Shock Wave Reflection Transition. Shock. Waves 1997, 7, 373–383. [Google Scholar] [CrossRef]
- Ben-Dor, G. Shock Wave Reflection Phenomena. NASA STI/Recon Tech. Rep. A 2007, 93, 11439. [Google Scholar] [CrossRef]
- Pagendarm, H.G.; Seitz, B. An Algorithm for Detection and Visualization of Discontinuities in Scientific Data Fields Applied to Flow Data with Shock Waves. In Scientific visualization: Advanced software techniques; Palamidese P, Ed.; Prentice Hall: Delhi, India, 1993; pp. 161–177. [Google Scholar]
- Lovely, D.; Haimes, R. Shock Detection from Computational Fluid Dynamics Results. In Proceedings of the 14th Computational Fluid Dynamics Conference, Norfolk, VA, USA, 1–5 November 1999; American Institute of Aeronautics and Astronautics: Norfolk, VA, USA, 1999. [Google Scholar]
- Liu, Y.; Lu, Y.; Wang, Y.; Sun, D.; Deng, L.; Wang, F.; Lei, Y. A CNN-Based Shock Detection Method in Flow Visualization. Comput. Fluids 2019, 184, 1–9. [Google Scholar] [CrossRef]
- Liu, C.; Jiang, R.; Wei, D.; Yang, C.; Li, Y.; Wang, F.; Yuan, X. Deep Learning Approaches in Flow Visualization. Adv. Aerodynam. 2022, 4, 17. [Google Scholar] [CrossRef]
- Doroshchenko, I.A.; Znamenskaya, I.A.; Sysoev, N.N.; Lutsky, A.E. High-Speed Flow Structures Detection and Tracking in Multiple Shadow Images with Matching to CFD Using Convolutional Neural Networks. Sci. Vis 2022, 14, 1–11. [Google Scholar] [CrossRef]
- Chen, H.; Tian, Y.; Guo, M.; Le, J.; Ji, Y.; Zhang, Y.; Zhang, H.; Zhang, C. Flow Field Reconstruction and Shock Train Leading Edge Position Detection of Scramjet Isolation Section Based on a Small Amount of CFD Data. AIA 2022, 4, 28. [Google Scholar] [CrossRef]
- Fujimoto, T.R.; Kawasaki, T.; Kitamura, K. Canny-Edge-Detection/Rankine-Hugoniot-Conditions Unified Shock Sensor for Inviscid and Viscous Flows. J. Comput. Phys 2019, 396, 264–279. [Google Scholar] [CrossRef]
- LI, G.; Kontis, K.; Fan, Z. Automatic Shock Detection, Extraction, and Fitting in Schlieren and Shadowgraph Visualization. AIAA J. 2021, 59, 2312–2317. [Google Scholar] [CrossRef]
- Smith, N.T.; Lewis, M.J.; Chellappa, R. Extraction of Oblique Structures in Noisy Schlieren Sequences Using Computer Vision Techniques. AIAA J. 2012, 50, 1145–1155. [Google Scholar] [CrossRef]
- Kanamori, M.; Suzuki, K. Shock Wave Detection in Two-Dimensional Flow Based on the Theory of Characteristics from Cfd Data. J. Comput. Phys. 2011, 230, 3085–3092. [Google Scholar] [CrossRef]
- Kanamori, M.; Suzuki, K. Three-Dimensional Shock Wave Detection Based on the Theory of Characteristics. AIAA J. 2013, 51, 2126–2132. [Google Scholar] [CrossRef]
- Paciorri, R.; Bonfiglioli, A. Accurate Detection of Shock Waves and Shock Interactions in Two-Dimensional Shock-Capturing Solutions. J. Comput. Phys. 2020, 406, 109196. [Google Scholar] [CrossRef]
- Chang, S.; Bai, X.; Liu, J. A Two-Dimensional Shock Wave Pattern Recognition Algorithm Based on Cluster Analysis. Hangkong Xuebao/Acta Aeronaut. Astronaut. Sin. 2020, 41, 162–175. [Google Scholar] [CrossRef]
- MacQueen, J. Some Methods for Classification and Analysis of MultiVariate Observations. In Proceedings of the Fifth Berkeley Symposium on Mathematical Statistics and Probability, Berkeley, CA, USA, 21 June–18 July 1967; Volume 1, pp. 281–297. [Google Scholar]
- Bézier, P. Numerical Control: Mathematics and Applications; Wiley: London, UK, 1972; p. 256. [Google Scholar]
- Habis, M.; Capderou, A.; Ghostine, S.; Daoud, B.; Caussin, C.; Riou, J.-Y.; Brenot, P.; Angel, C.Y.; Lancelin, B.; Paul, J.-F. Acute Myocardial Infarction Early Viability Assessment by 64-Slice Computed Tomography Immediately After Coronary Angiography: Comparison With Low-Dose Dobutamine Echocardiography. J. Am. Coll. Cardiol 2007, 49, 1178–1185. [Google Scholar] [CrossRef]
- Fredrich, J.T.; Menéndez, B.; Wong, T.F. Imaging the Pore Structure of Geomaterials. Science 1995, 268, 276–279. [Google Scholar] [CrossRef] [PubMed]
Disclaimer/Publisher’s Note: The statements, opinions and data contained in all publications are solely those of the individual author(s) and contributor(s) and not of MDPI and/or the editor(s). MDPI and/or the editor(s) disclaim responsibility for any injury to people or property resulting from any ideas, methods, instructions or products referred to in the content. |
© 2023 by the authors. Licensee MDPI, Basel, Switzerland. This article is an open access article distributed under the terms and conditions of the Creative Commons Attribution (CC BY) license (https://creativecommons.org/licenses/by/4.0/).