
Multi-Objective Design Optimization of Multiple Tuned Mass Dampers for Attenuation of Dynamic Aeroelastic Response of Aerospace Structures

 , ,
, ,
Abstract
1. Introduction
2. Materials and Methods
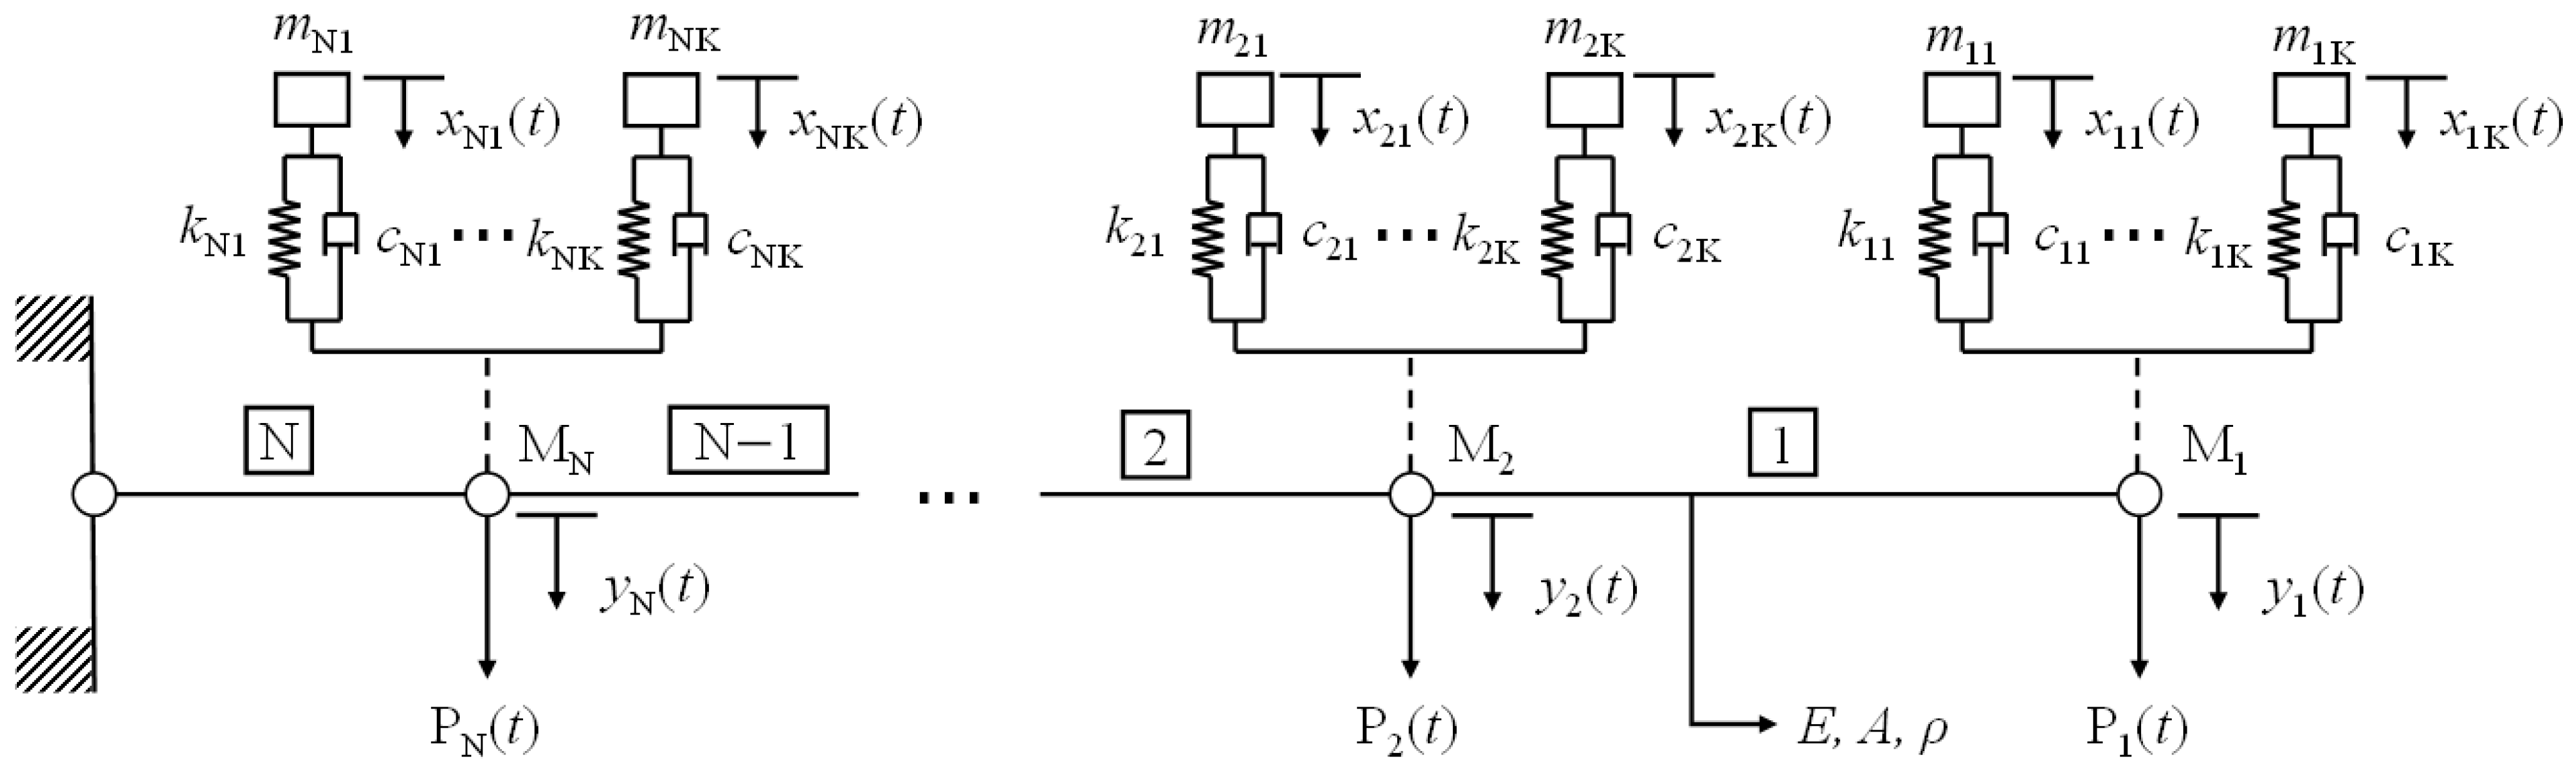
2.1. Structural Model with Multiple-Tuned Mass Dampers
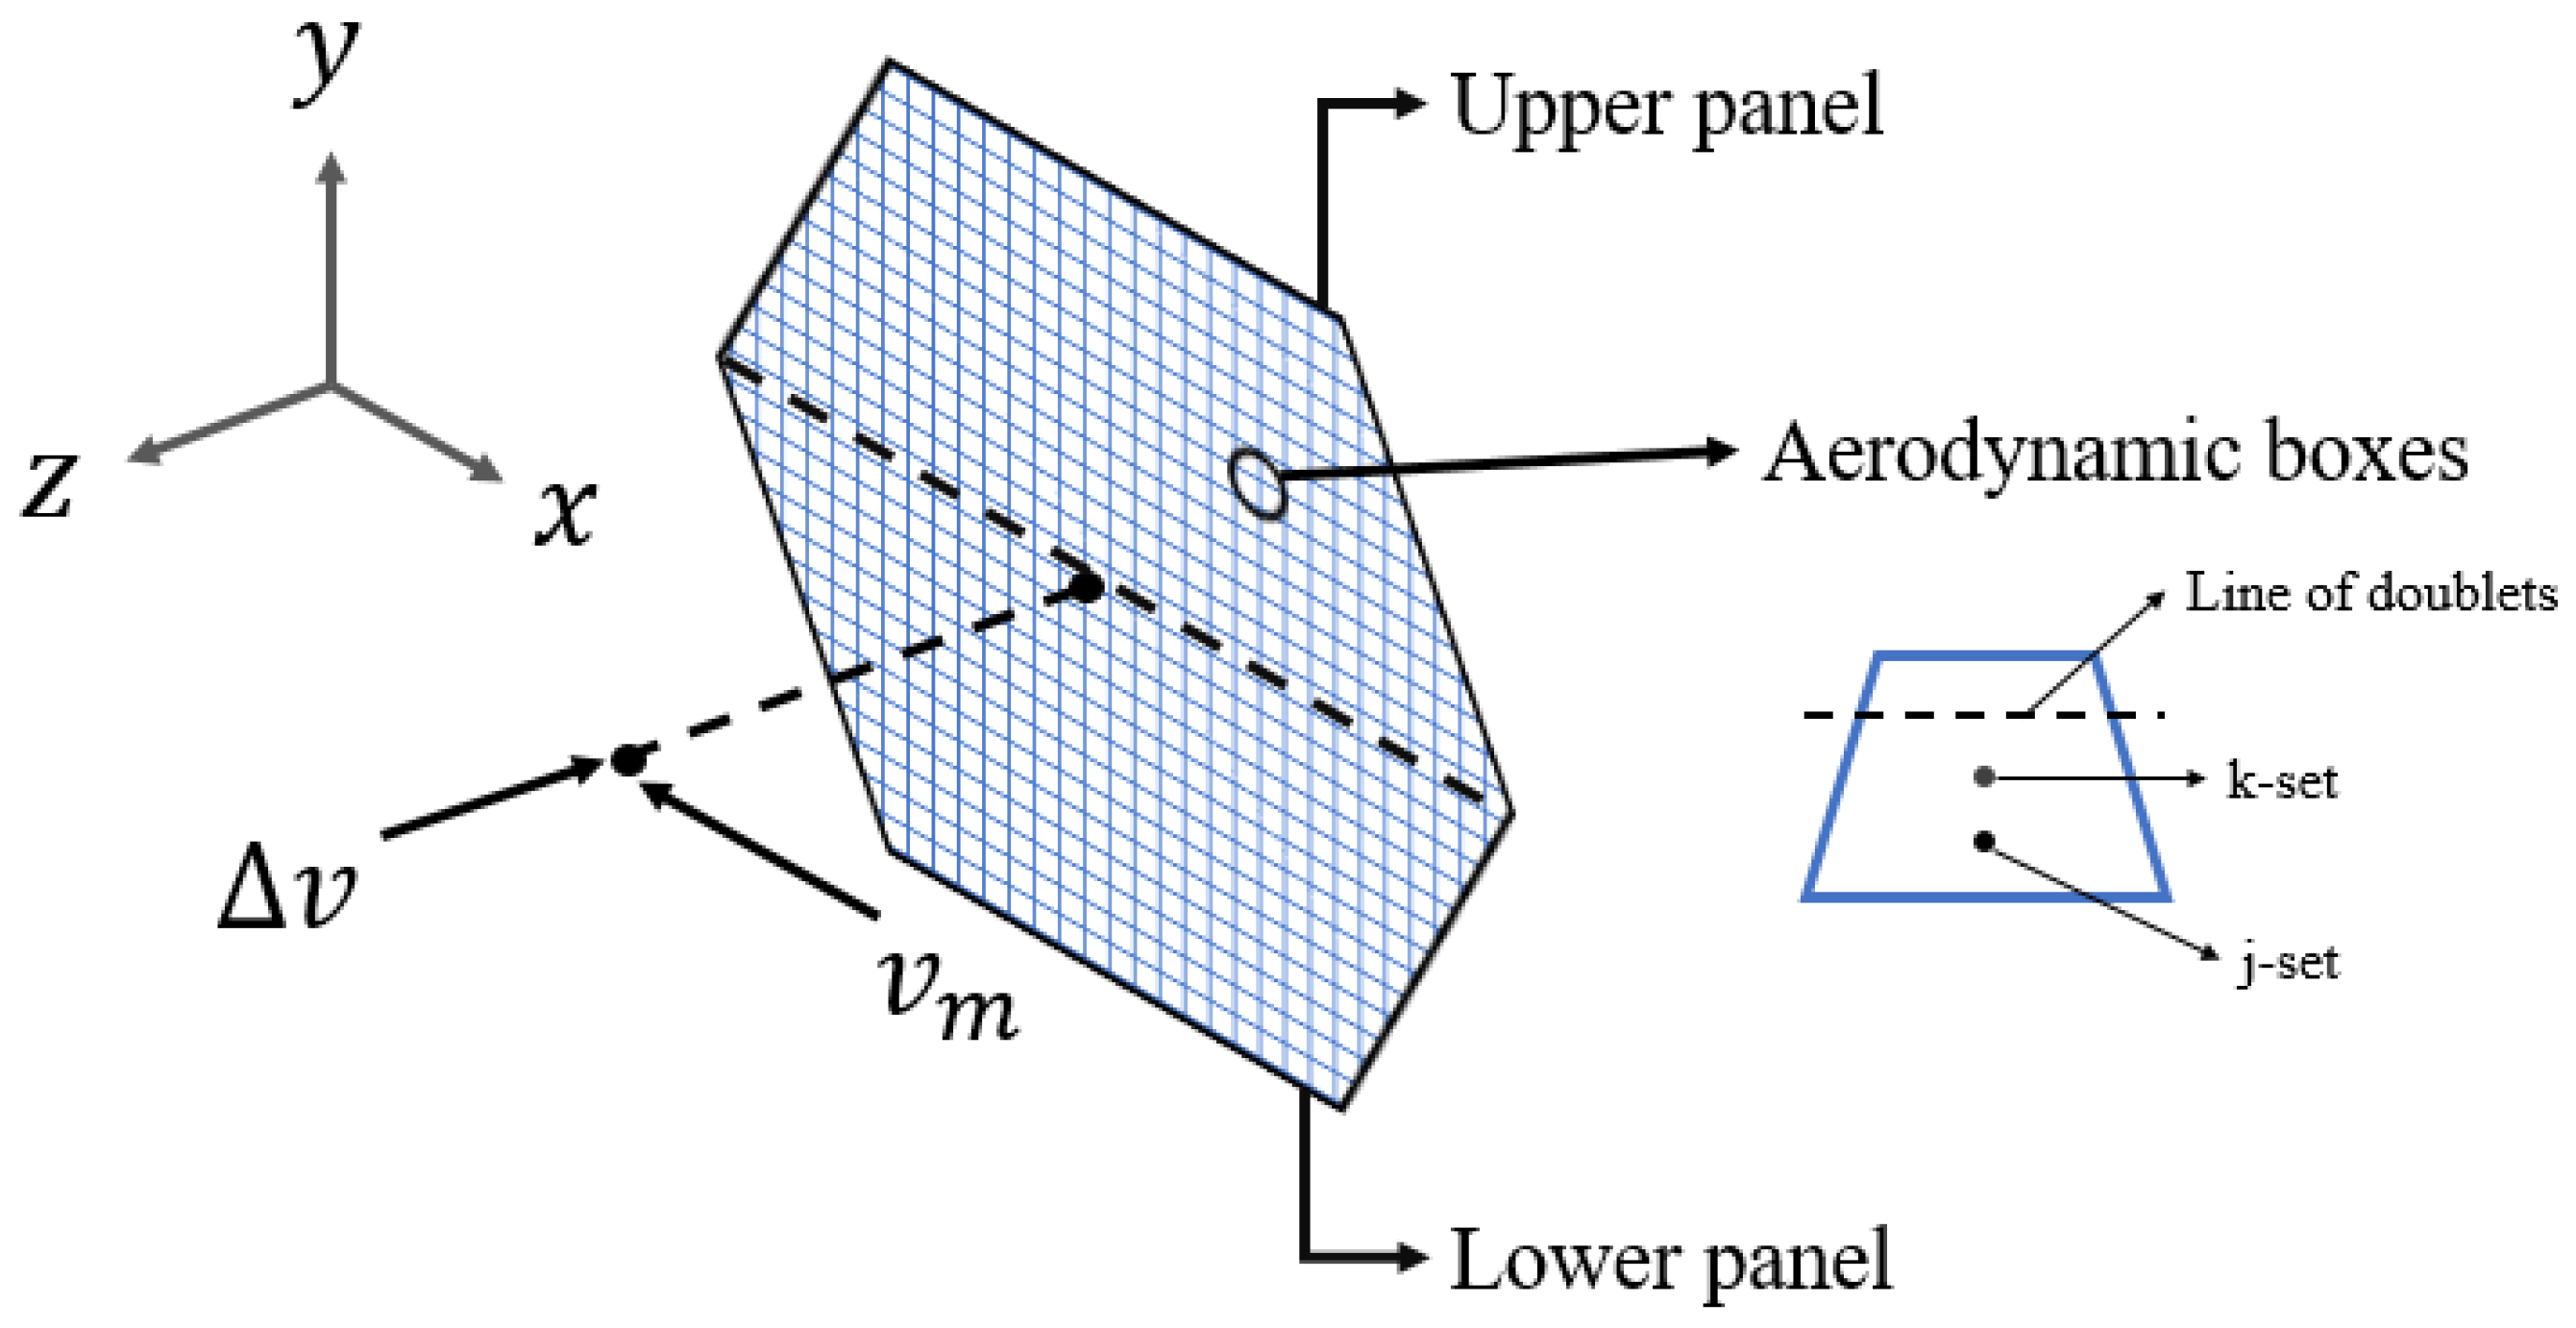
2.2. Aerodynamic Model
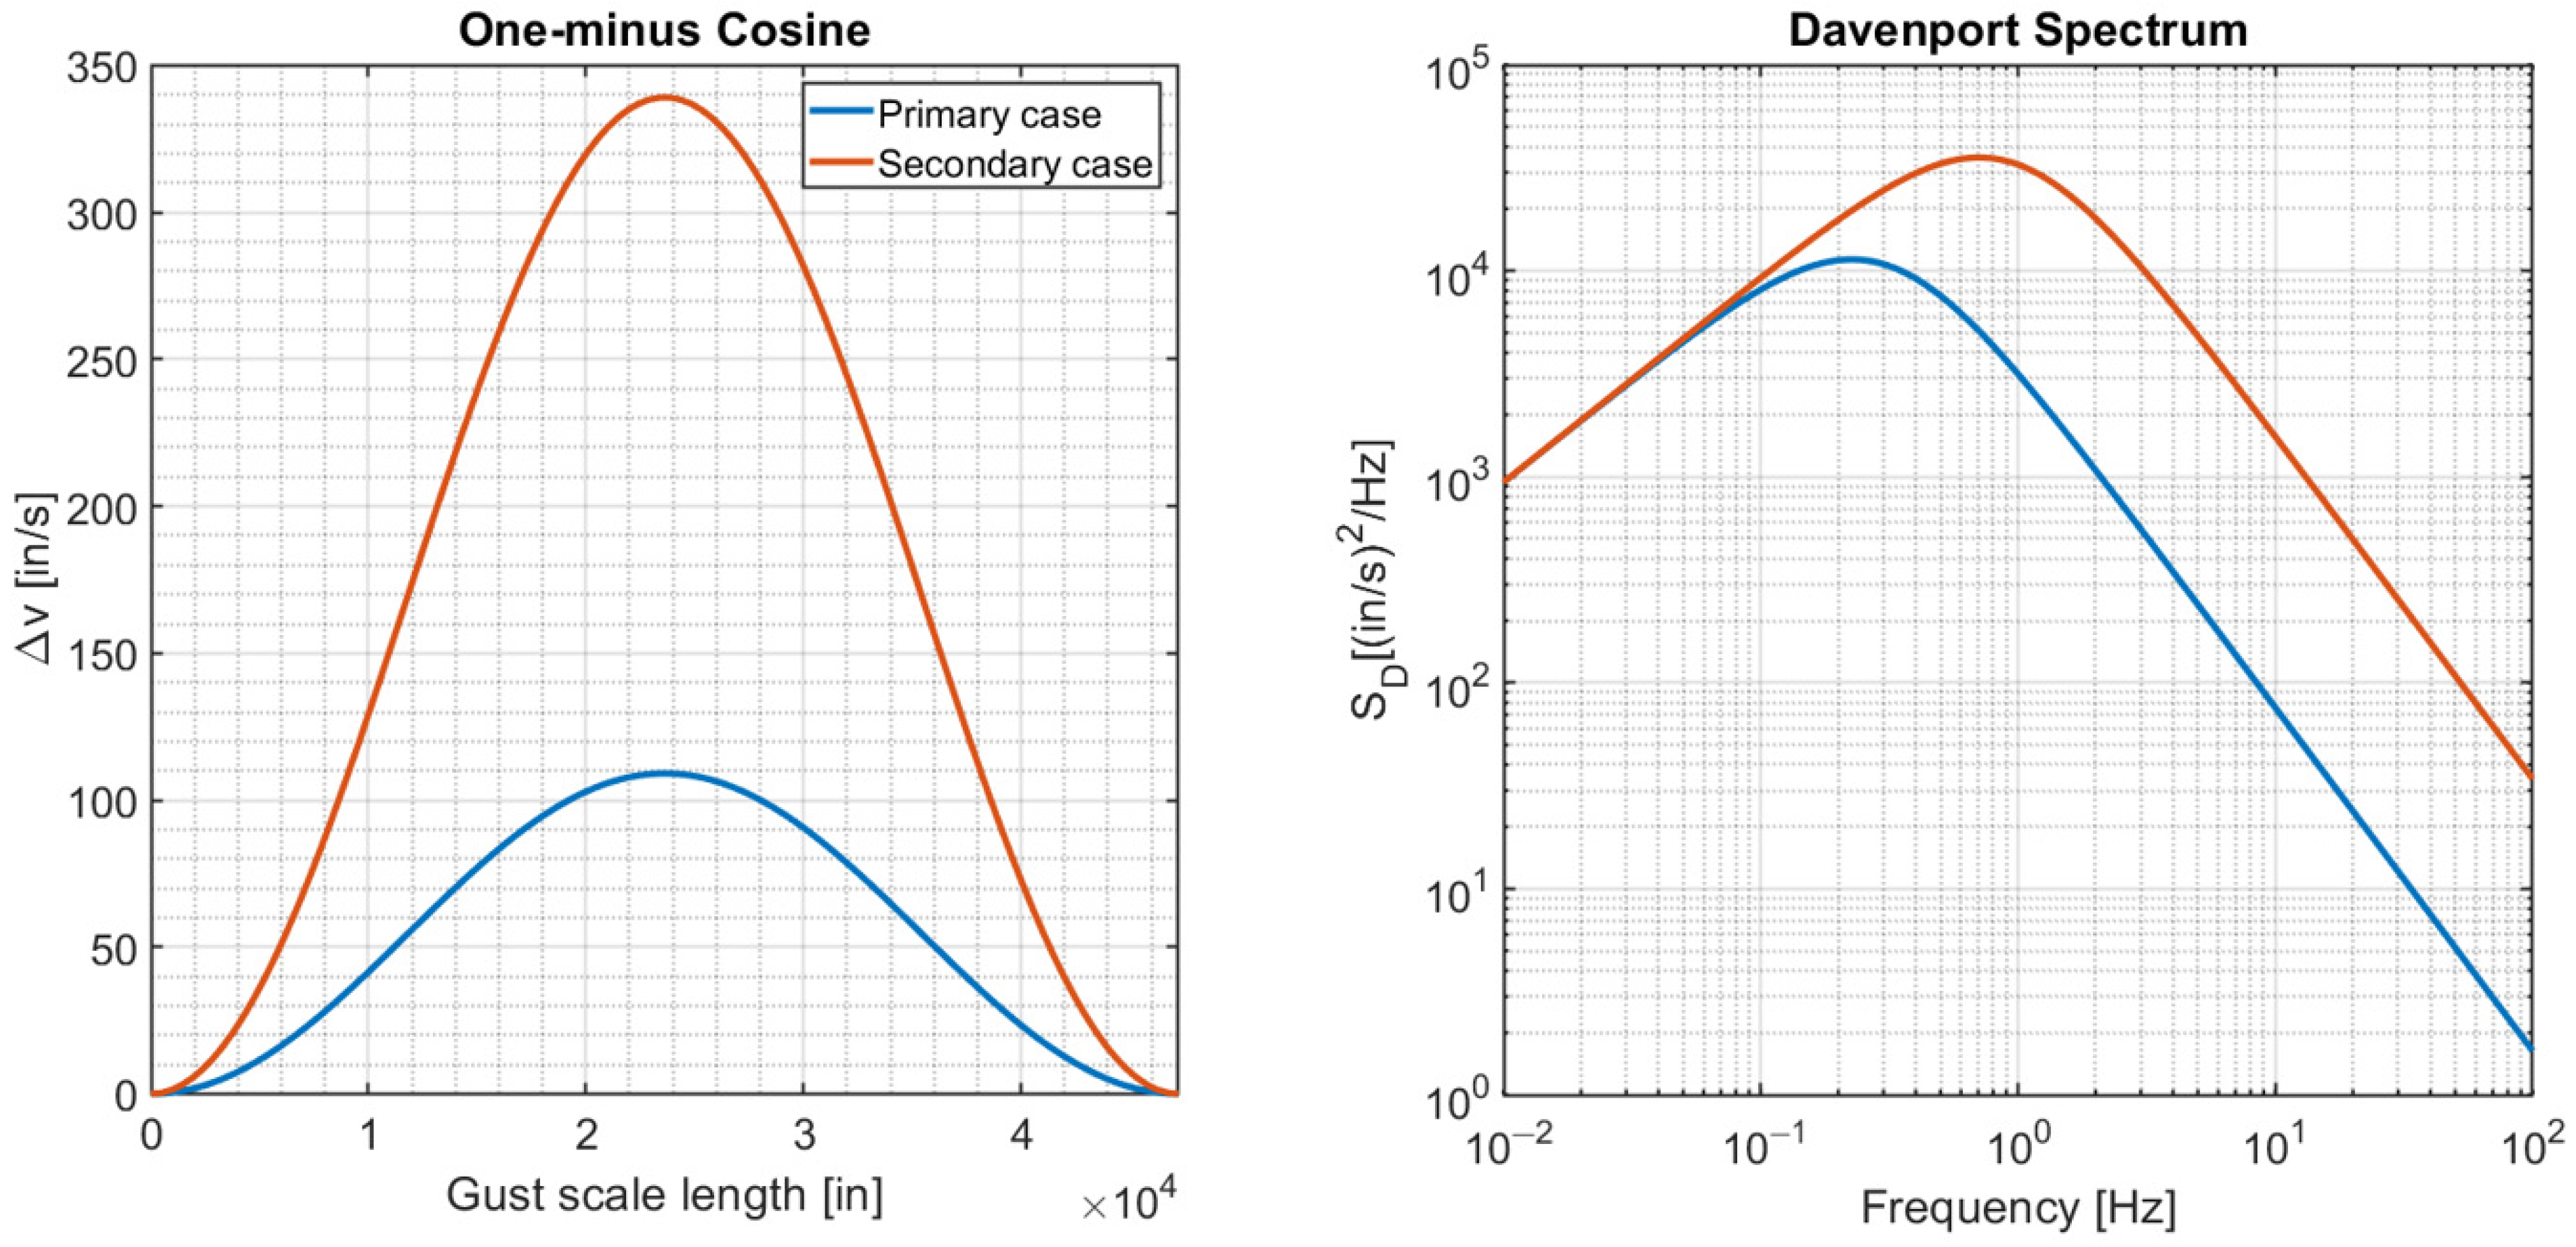
Atmospheric Gust Disturbances
2.3. Time-Consistent Loads and Displacements
2.4. Multi-Objective Design Optimization Procedure
| Fitness function: | Minimize |
| Minimize | |
| Design variables: | |
| Constraints: | |
3. Case Study
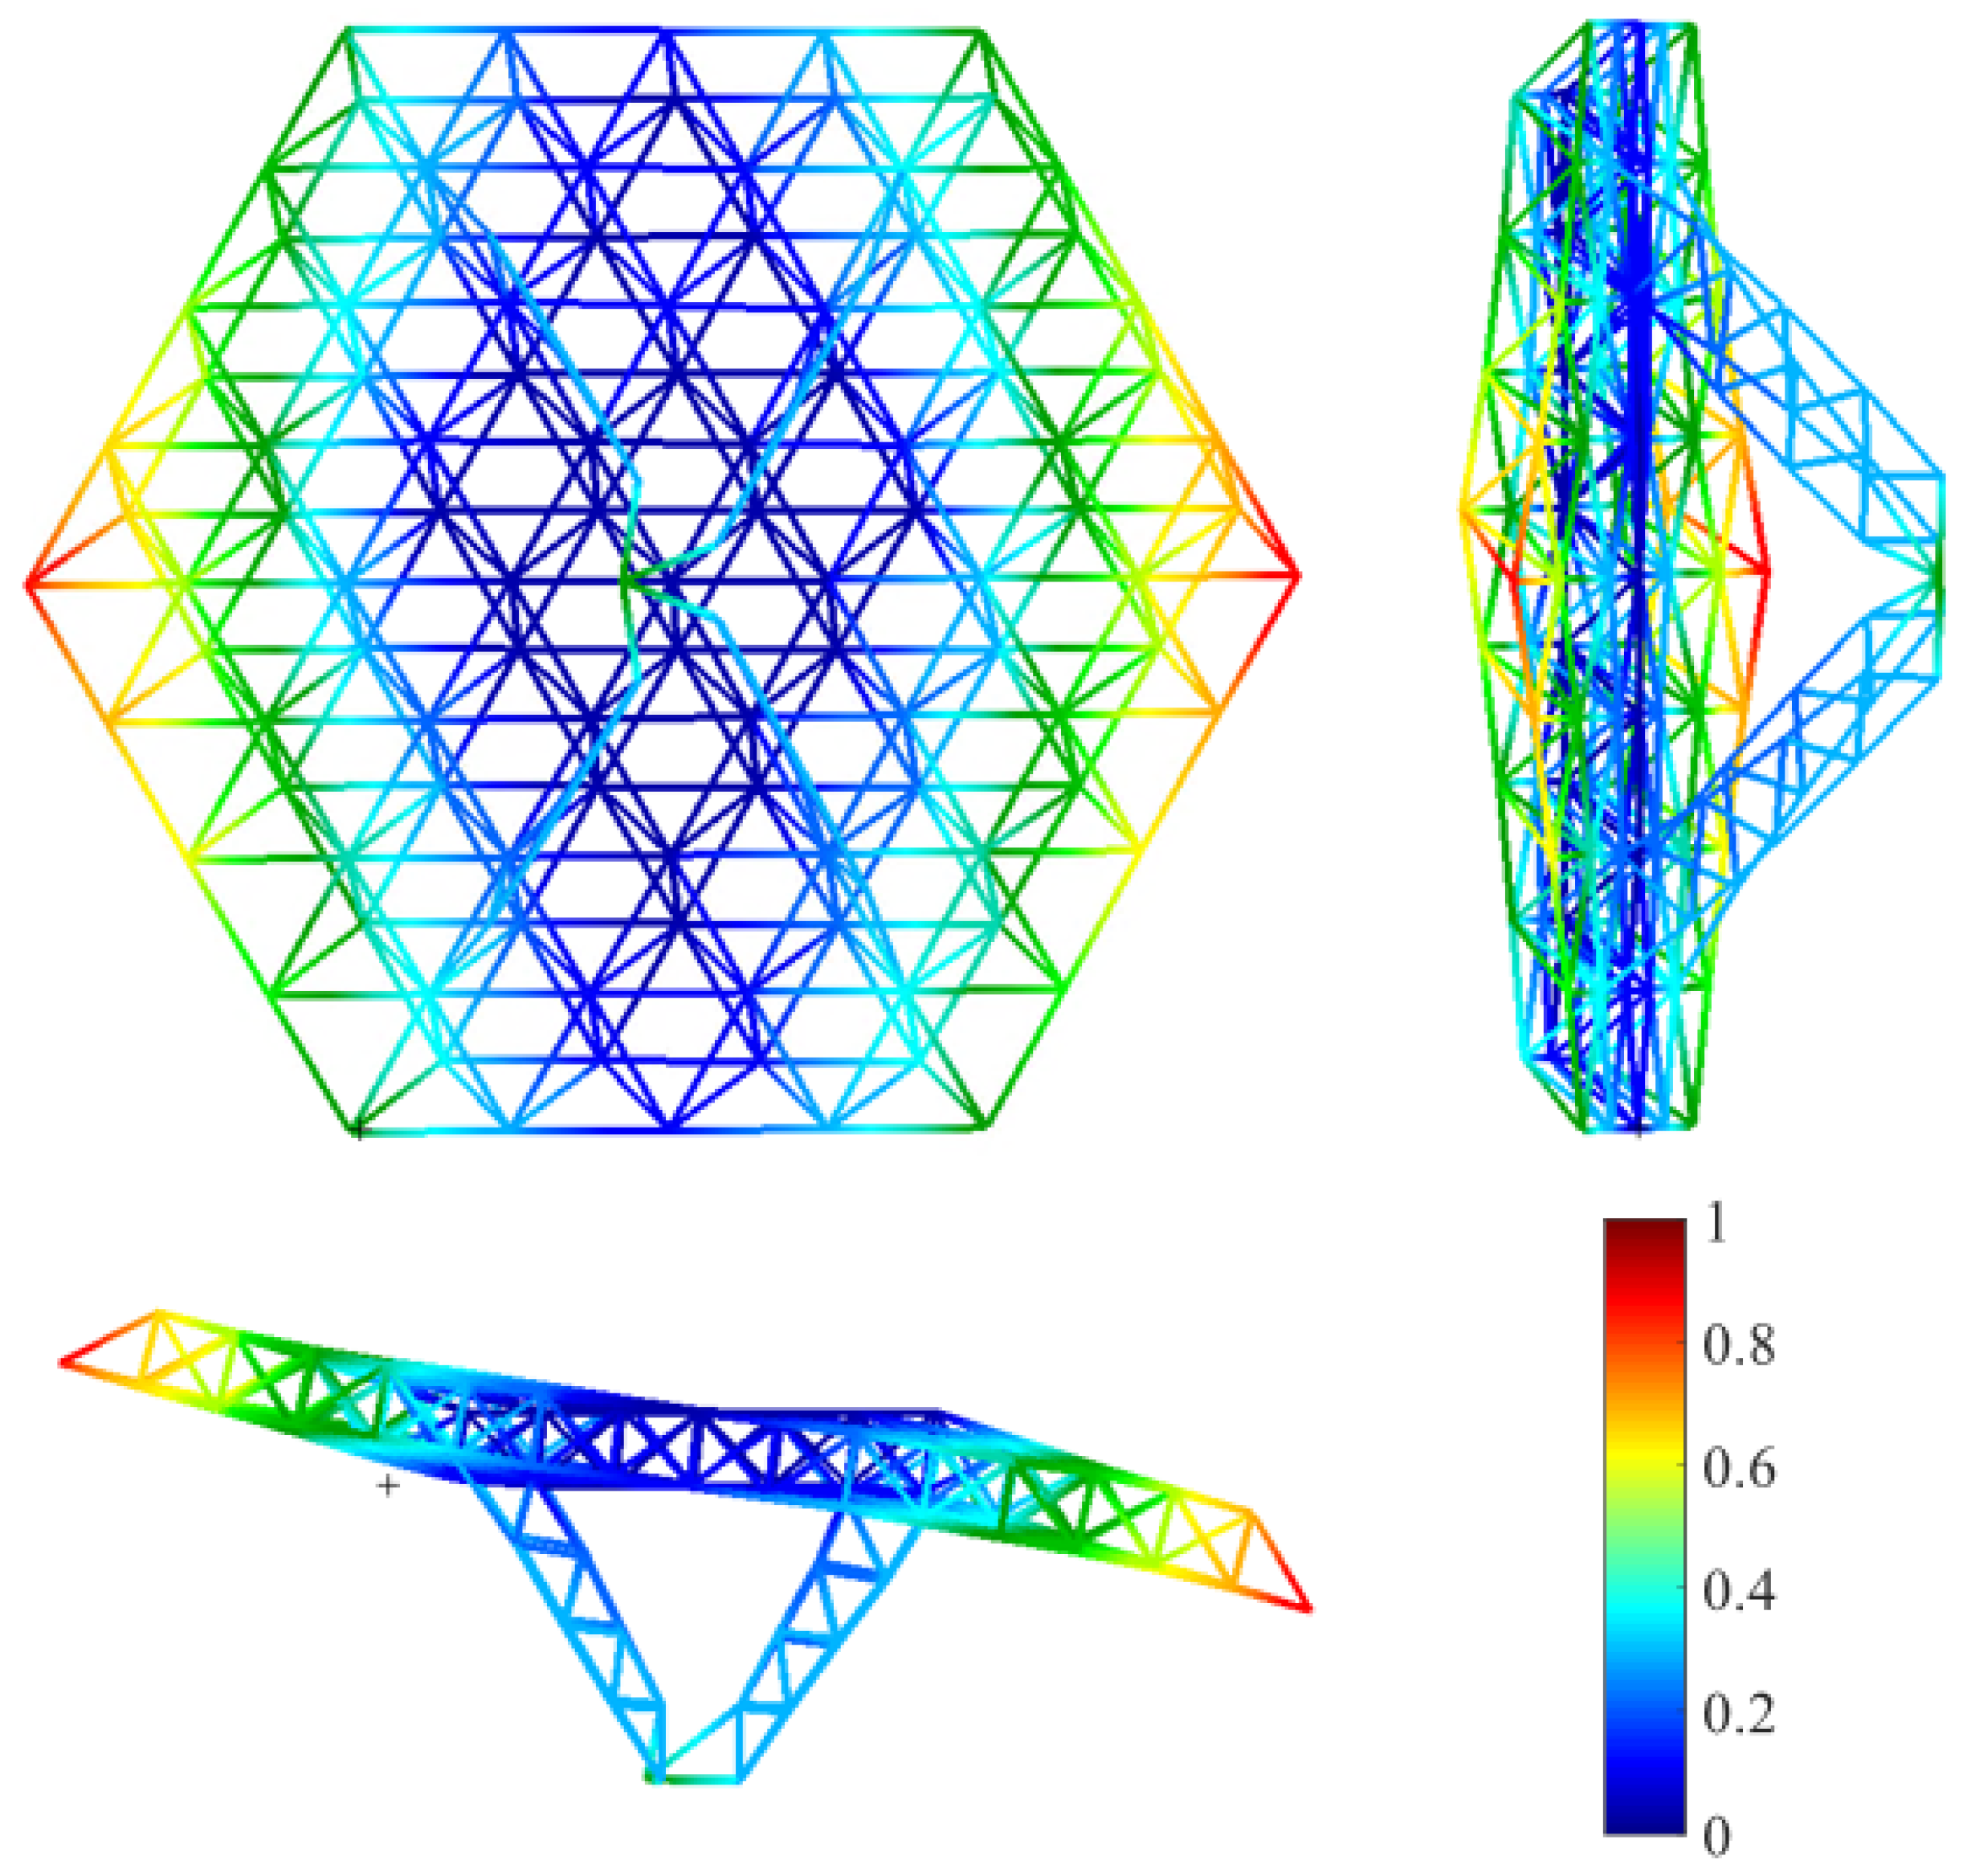
3.1. FE Model of a Truss-Like Antenna Structure
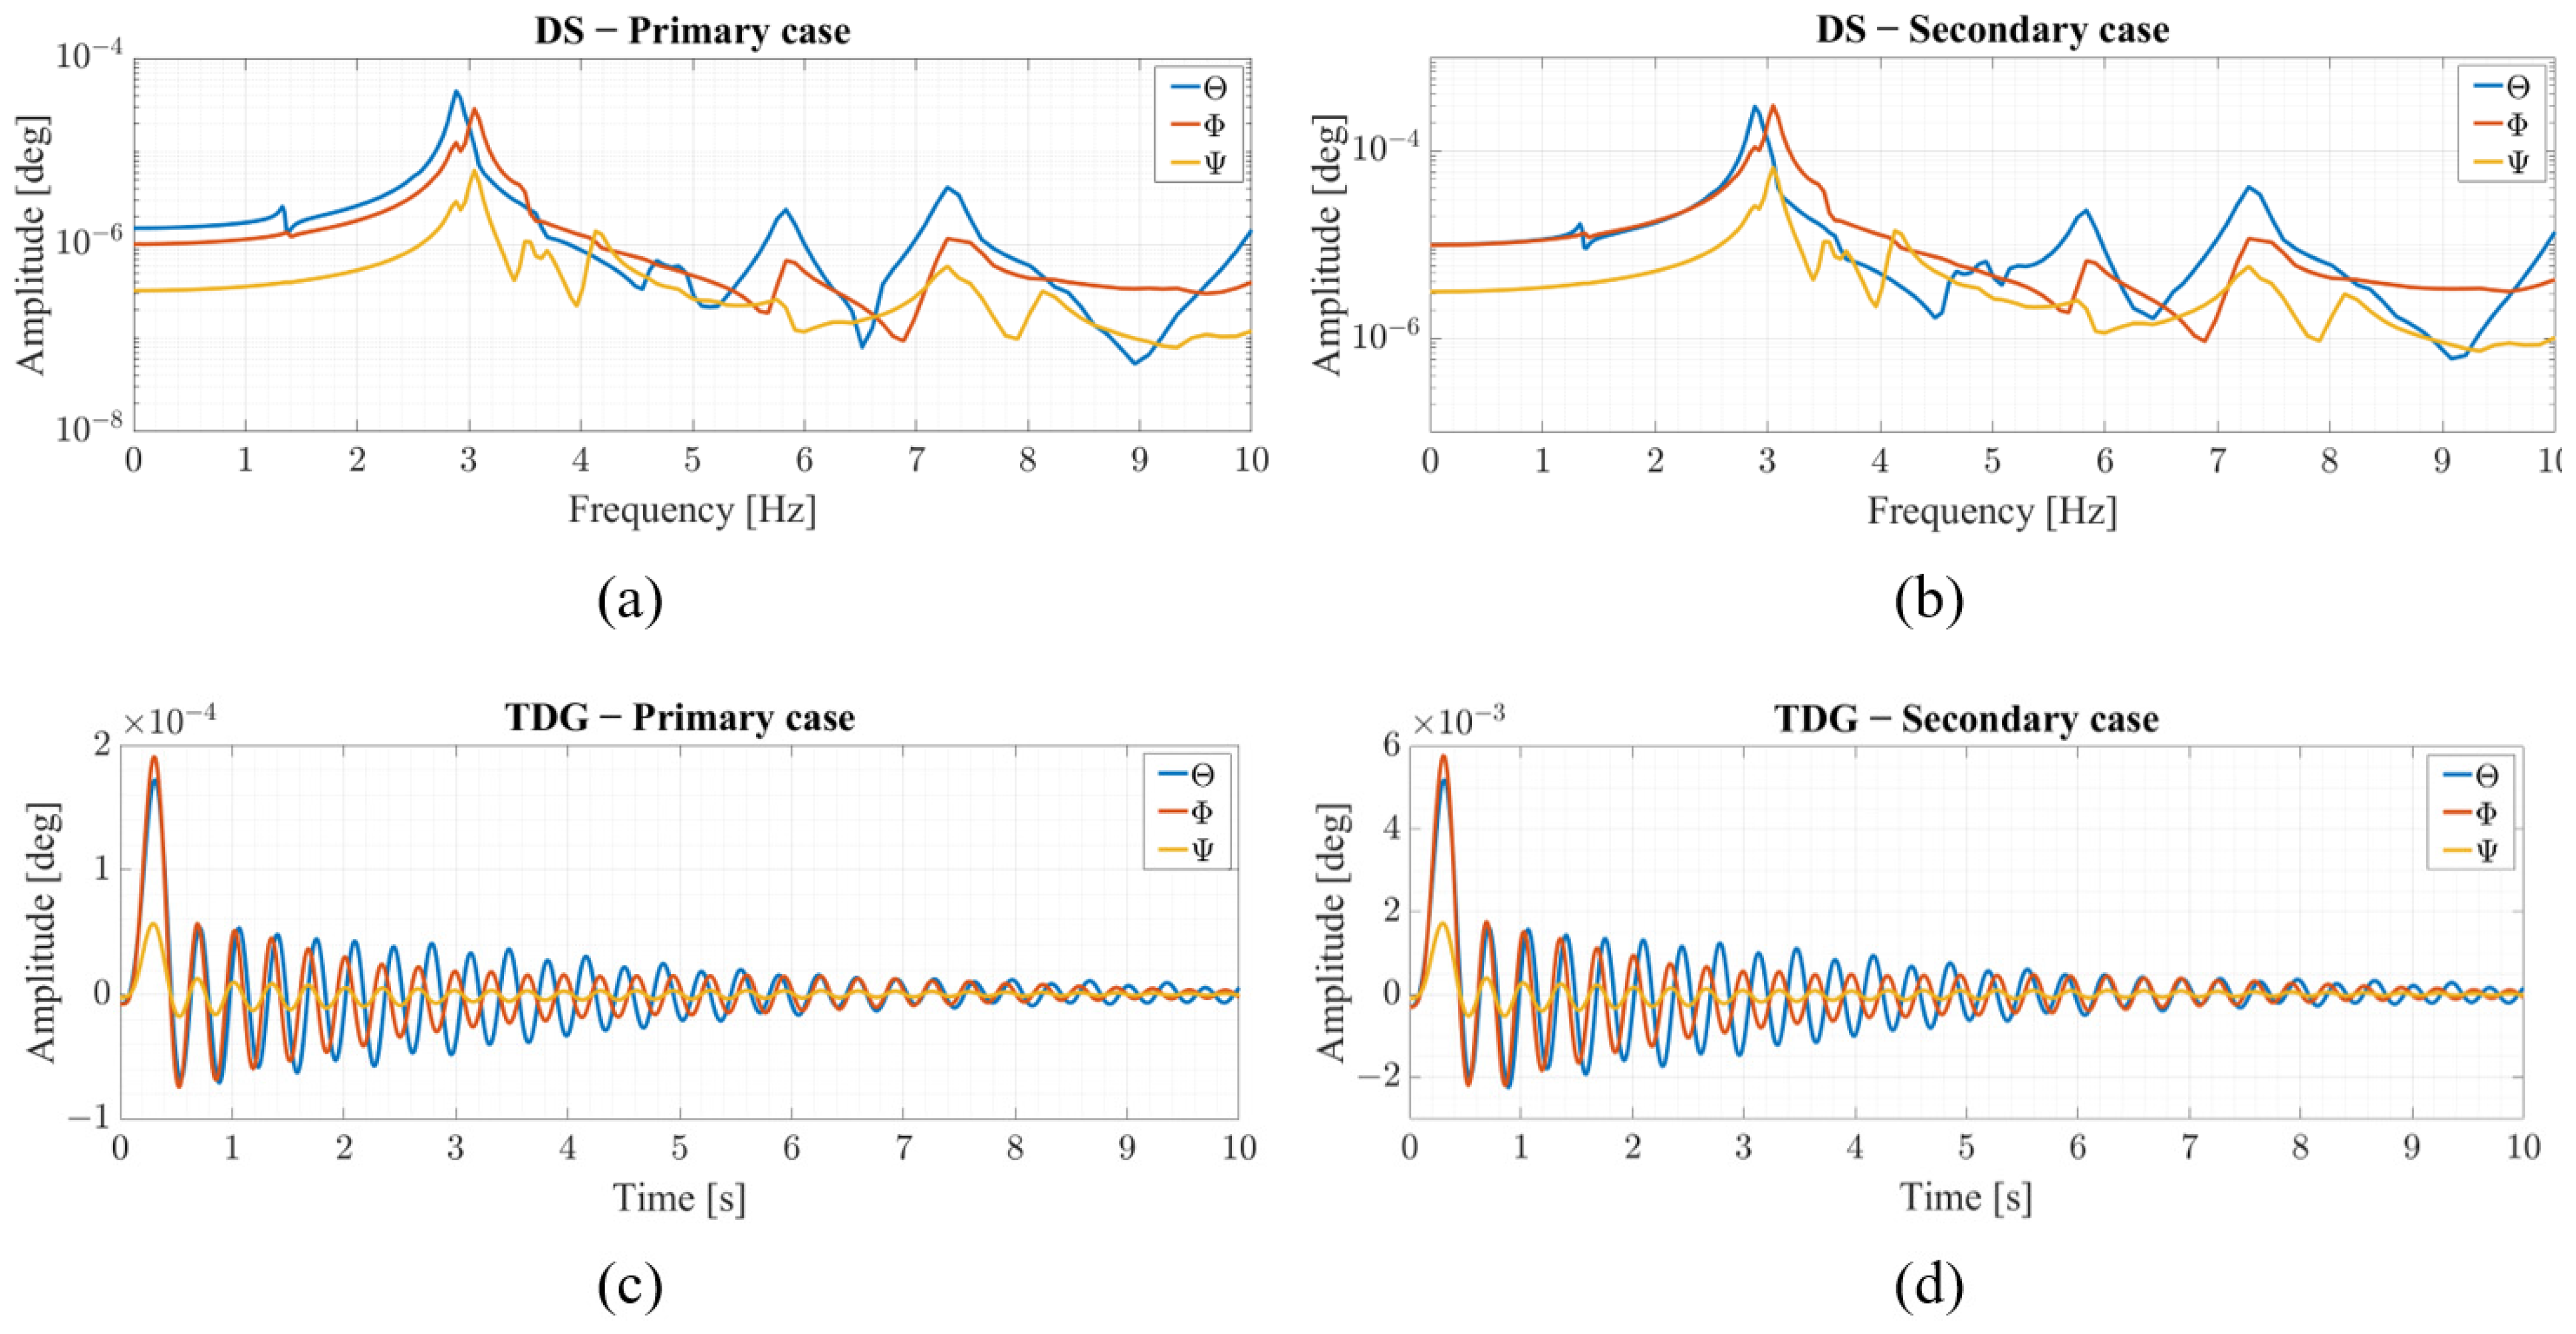
3.2. Aeroelastic Response of the Uncontrolled Model
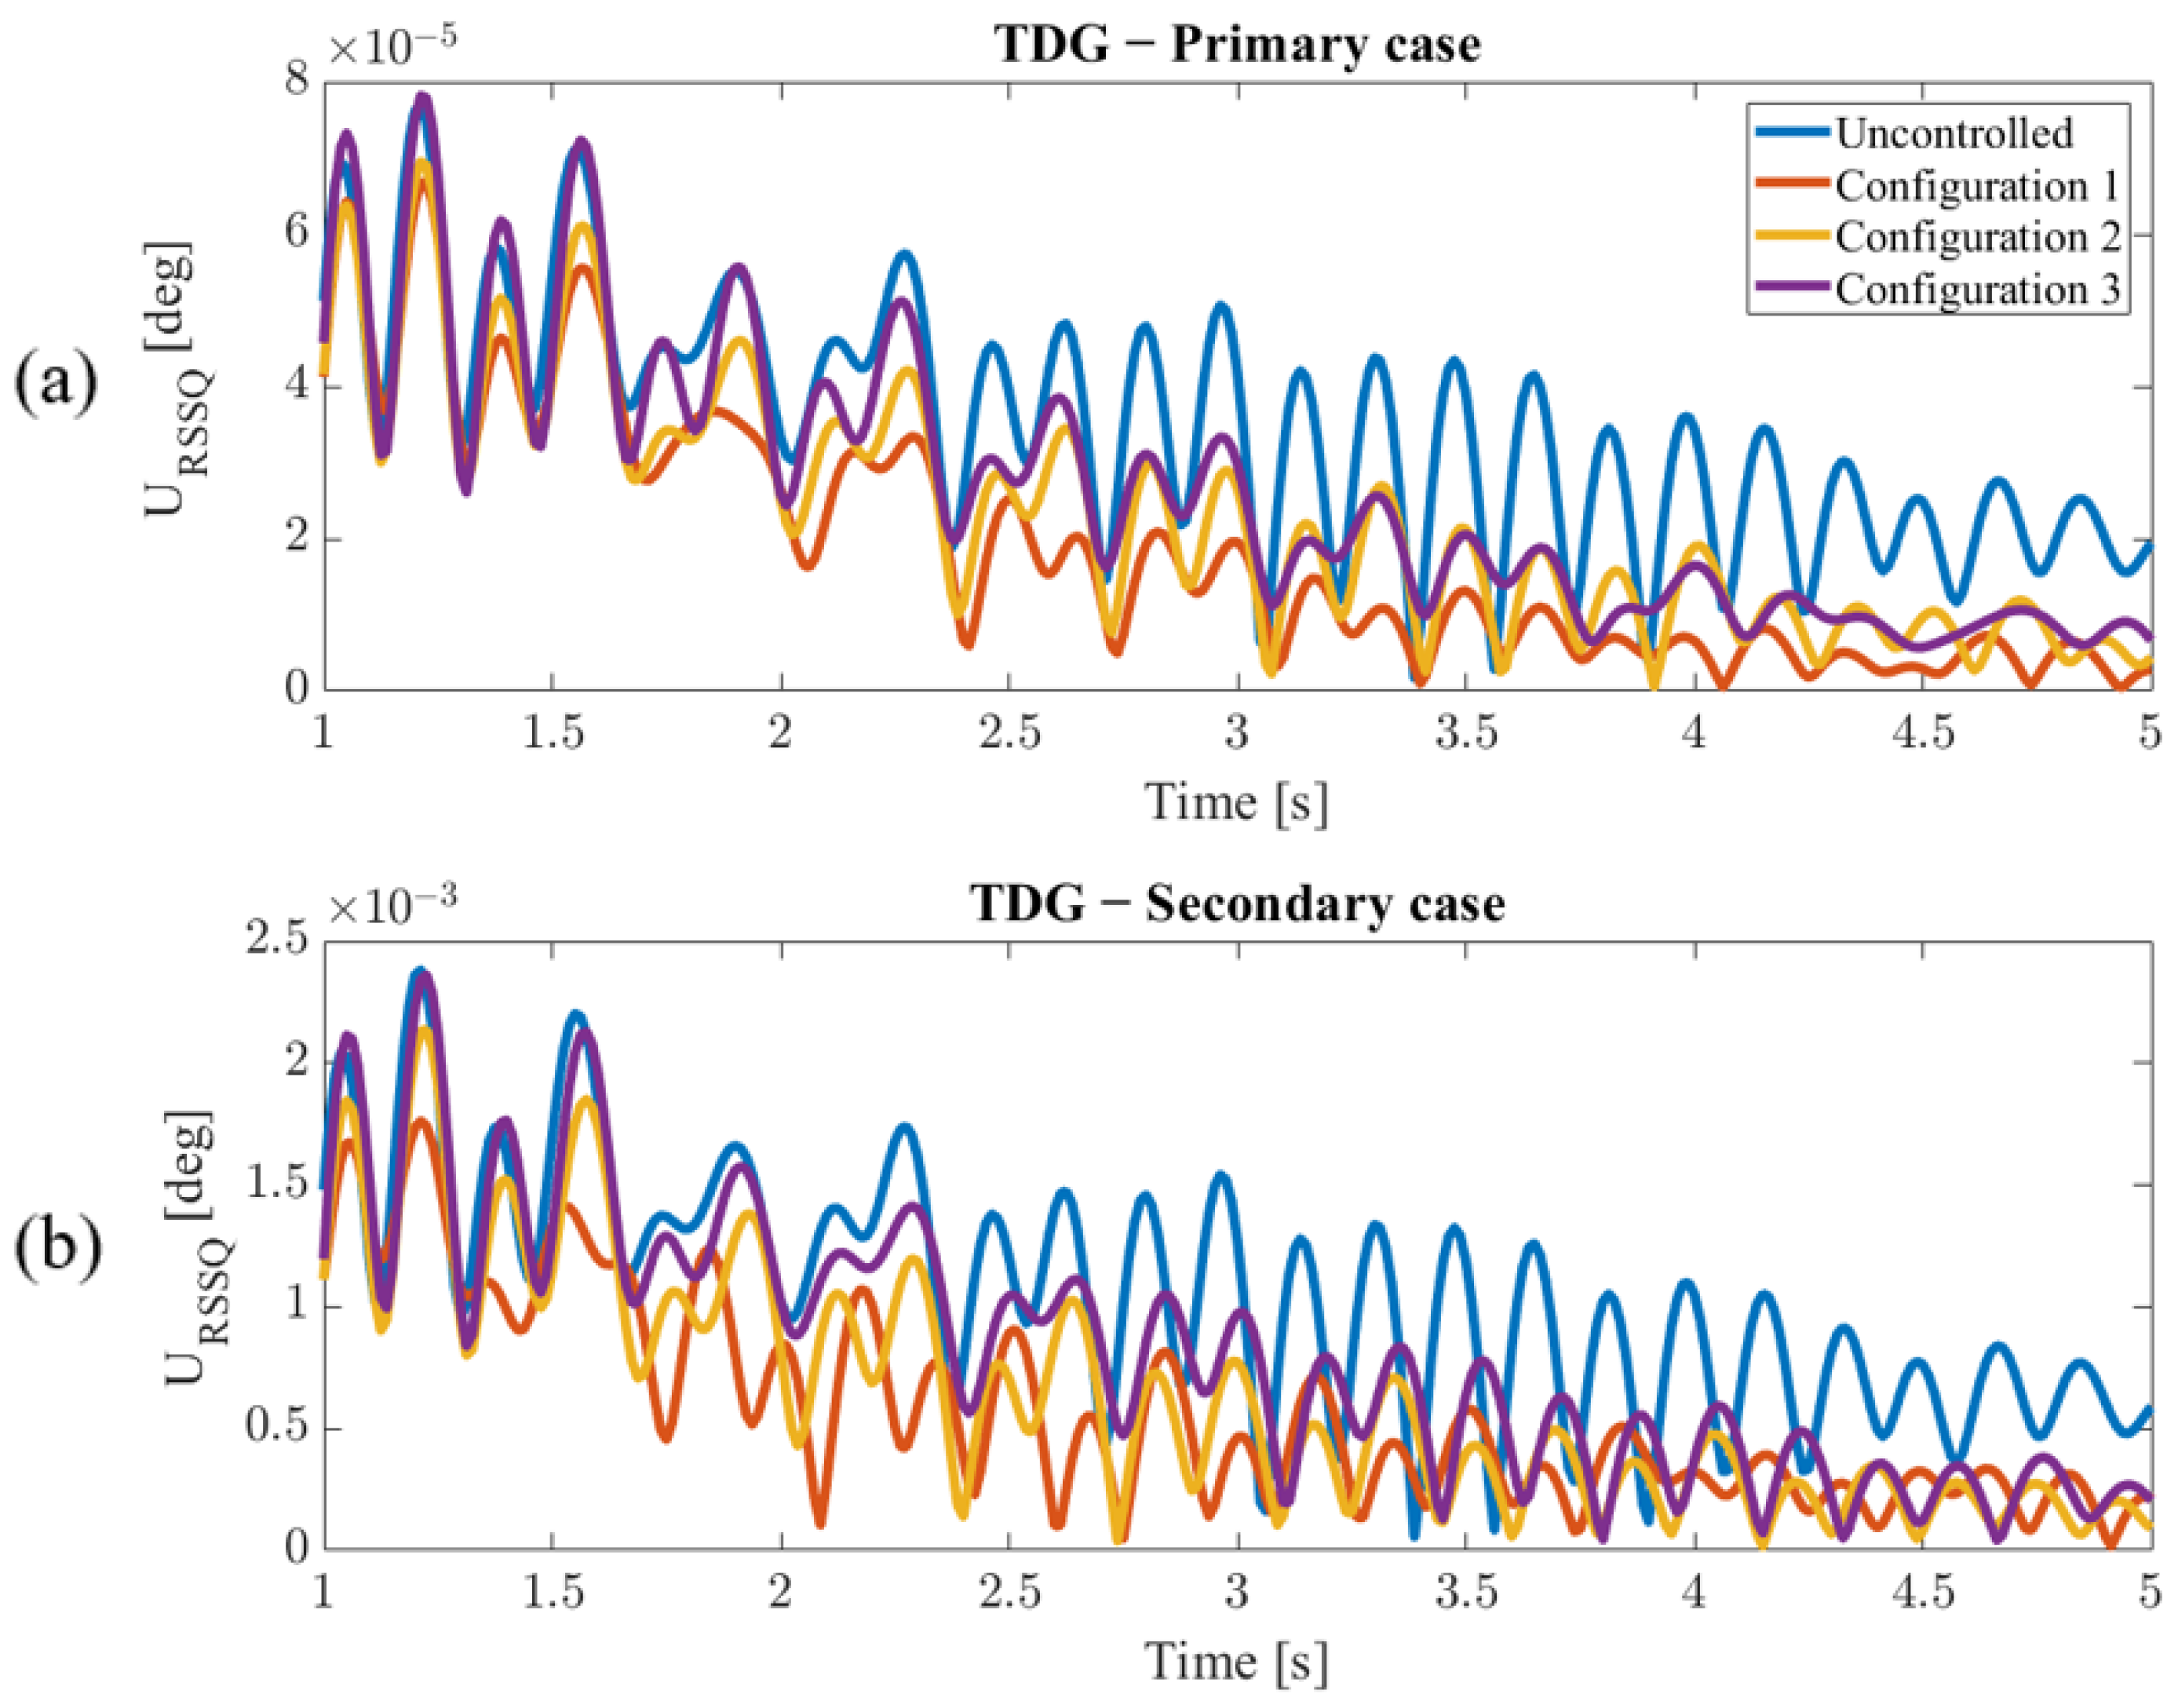
3.3. Aeroelastic Response Attenuation Using Optimal MTMD
- Maximum number of generations: 30;
- Population size: 300;
- Crossover fraction: 80%;
- Elitism probability: 2%;
- Migration factor: 20%;
- Migration interval: 20;
- Pareto fraction: 35%.
4. Conclusions
Author Contributions
Funding
Data Availability Statement
Acknowledgments
Conflicts of Interest
Appendix A

| Configuration ID | MTMD ID | Grid Points ID |
|---|---|---|
| 1 | (1:61) | (1:61) |
| 2 | (1:29) | (110:138) |
| 3 | (1:90) | (1:61, 110:138) |

References
- Nieto, M.G.; Thomas, P.V.; ElSayed, M.S.A.; Saad, M.; Brown, G.L.; Hilliard, L.M. Development of Efficient Dynamic Aeroelasticity Model for High Fidelity Pointing Accuracy Assessment of VLBI Earth-Based Radio Antennas. Int. J. Aeronaut. Space Sci. 2020, 21, 693–706. [Google Scholar] [CrossRef]
- Zhang, J.; Huang, J.; Liang, W.; Zhang, Y.; Xu, Q.; Yi, L.; Wang, C. A Correction Method of Estimating the Pointing Error for Reflector Antenna. Shock. Vib. 2018, 2018, 3262869. [Google Scholar] [CrossRef]
- Raja, S. Novel Aeroelastic Approaches for Transonic Flutter and Buffet Clearance of Aerospace Vehicles. Trans. Indian Natl. Acad. Eng. 2021, 6, 243–254. [Google Scholar] [CrossRef]
- Hansen, M.H. Aeroelastic instability problems for wind turbines. Wind. Energy 2007, 10, 551–577. [Google Scholar] [CrossRef]
- Rajpal, D.; Kassapoglou, C.; De Breuker, R. Aeroelastic optimization of composite wings including fatigue loading requirements. Compos. Struct. 2019, 227, 111248. [Google Scholar] [CrossRef]
- Srivatsa, S.M.; Inman, D.J. Characterization of Fatigue in Integrated Tuned Mass-Dampers BT—Special Topics in Structural Dynamics & Experimental Techniques; Epp, D.S., Ed.; Springer International Publishing: Cham, Switzerland, 2021; Volume 5, pp. 25–35. [Google Scholar]
- de Figueiredo, H.V.; Castillo-Zúñiga, D.F.; Costa, N.C.; Saotome, O.; da Silva, R.G.A. Aeroelastic Vibration Measurement Based on Laser and Computer Vision Technique. Exp. Tech. 2021, 45, 95–107. [Google Scholar] [CrossRef]
- Arena, M.; Chiariello, A.; Castaldo, M.; Di Palma, L. Vibration Response Aspects of a Main Landing Gear Composite Door Designed for High-Speed Rotorcraft. Aerospace 2021, 8, 52. [Google Scholar] [CrossRef]
- Mahmoodi, S.N.; Ahmadian, M. Active vibration control with modified positive position feedback. J. Dyn. Syst. Meas. Control Trans. ASME 2009, 131, 041002. [Google Scholar] [CrossRef]
- Keane, A.J.; Bright, A.P. Passive vibration control via unusual geometries: Experiments on model aerospace structures. J. Sound Vib. 1996, 190, 713–719. [Google Scholar] [CrossRef][Green Version]
- Kwak, S.K.; Washington, G.; Yedavalli, R.K. Active and passive vibration control of landing gear components. Am. Soc. Mech. Eng. Aerosp. Div. AD. 1999, 59, 269–275. [Google Scholar] [CrossRef]
- Sales, T.P.; Rade, D.A.; de Souza, L.G.C. Passive vibration control of flexible spacecraft using shunted piezoelectric transducers. Aerosp. Sci. Technol. 2013, 29, 403–412. [Google Scholar] [CrossRef]
- Chatziathanasiou, G.M.; Chrysohoidis, N.A.; Georgopoulos-Bosinas, K.I.; Saravanos, D.A. Semi-active vibration control of aircraft structures. In Proceedings of the AIAA Scitech 2021 Forum, virtual, 11–15 January 2021; pp. 1–10. [Google Scholar] [CrossRef]
- Karnopp, D.; Crosby, M.J.; Harwood, R.A. Vibration Control Using Semi-Active Force Generators. ASME Pap. 1973, 96, 619–626. [Google Scholar] [CrossRef]
- Gao, S.; Liu, J. Adaptive fault-tolerant boundary vibration control for a flexible aircraft wing against actuator and sensor faults. JVC 2021, 28, 1025–1034. [Google Scholar] [CrossRef]
- Zhang, L.; Xu, S.; Zhang, Z.; Cui, N. Active vibration suppression for flexible satellites using a novel component synthesis method. Adv. Space Res. 2021, 67, 1968–1980. [Google Scholar] [CrossRef]
- de Morais, M.V.G.; Lopez, A.A.O.; Martins, J.F.; Pedroso, L.J. Equivalent mechanical model of rectangular container attached to a pendulum compared to experimental data and analytical solution. J. Braz. Soc. Mech. Sci. Eng. 2020, 42, 143. [Google Scholar] [CrossRef]
- WWang, W.; Yang, Z.; Hua, X.; Chen, Z.; Wang, X.; Song, G. Evaluation of a pendulum pounding tuned mass damper for seismic control of structures. Eng. Struct. 2021, 228, 111554. [Google Scholar] [CrossRef]
- Almazán, J.L.; De la Llera, J.C.; Inaudi, J.A.; López-García, D.; Izquierdo, L.E. A bidirectional and homogeneous tuned mass damper: A new device for passive control of vibrations. Eng. Struct. 2007, 29, 1548–1560. [Google Scholar] [CrossRef]
- Elias, S.; Matsagar, V. Distributed Multiple Tuned Mass Dampers for Wind Vibration Response Control of High-Rise Building. J. Eng. 2014, 2014, 198719. [Google Scholar] [CrossRef]
- Suresh, L.; Mini, K.M. Effect of Multiple Tuned Mass Dampers for Vibration Control in High-Rise Buildings. Pract. Period. Struct. Des. Constr. 2019, 24, 04019031. [Google Scholar] [CrossRef]
- Vellar, L.S.; Ontiveros-Pérez, S.P.; Miguel, L.F.F.; Miguel, L.F.F. Robust Optimum Design of Multiple Tuned Mass Dampers for Vibration Control in Buildings Subjected to Seismic Excitation. Shock. Vib. 2019, 2019, 9273714. [Google Scholar] [CrossRef]
- Kolator, B.; Pelc, J. Passive vibration damping in a truss telecommunication tower. Tech. Sci./Univ. Warm. Maz. Olsztyn. 2014, 17, 249–258. [Google Scholar]
- Zhang, Z.; Larsen, T.G. Optimal calibration of the rotational inertia double tuned mass damper (RIDTMD) for rotating wind turbine blades. J. Sound Vib. 2021, 493, 115827. [Google Scholar] [CrossRef]
- Chen, D.; Huang, S.; Huang, C.; Liu, R.; Ouyang, F. Passive control of jacket–type offshore wind turbine vibrations by single and multiple tuned mass dampers. Mar. Struct. 2021, 77, 102938. [Google Scholar] [CrossRef]
- Debnath, N.; Deb, S.K.; Dutta, A. Multi-modal vibration control of truss bridges with tuned mass dampers under general loading. JVC 2016, 22, 4121–4140. [Google Scholar] [CrossRef]
- Daniel, Y.; Lavan, O.; Levy, R. Multiple-Tuned Mass Dampers for Multimodal Control of Pedestrian Bridges. Eng. Struct. 2012, 138, 1173–1178. [Google Scholar] [CrossRef]
- Hagelin, J.S.; Ruegamer, S.K.; Thornton, T.D.; O’Meara, S.C.; Ellis, J.R.; Fred Gylland, J.E. Aeroelastic Tuned Mass Damper. U.S. Patent US20130092489A1, 18 April 2013. [Google Scholar]
- Lee, Y.R.; Kim, H.S.; Kang, J.W. Seismic Response Control Performance Evaluation of Tuned Mass Dampers for a Retractable-Roof Spatial Structure. Int. J. Steel Struct. 2020, 21, 213–224. [Google Scholar] [CrossRef]
- Liu, Z.; Wang, Y.; Hua, X.; Zhu, H.; Zhu, Z. Optimization of wind turbine TMD under real wind distribution countering wake effects using GPU acceleration and machine learning technologies. J. Wind. Eng. Ind. Aerodyn. 2021, 208, 104436. [Google Scholar] [CrossRef]
- Rana, R.; Soong, T. Parametric study and simplified design of tuned mass dampers. Eng. Struct. 1998, 20, 193–204. [Google Scholar] [CrossRef]
- Juang, J.N. Optimal design of a passive vibration absorber for a truss beam. J. Guid. Control Dyn. 1984, 7, 733–739. [Google Scholar] [CrossRef]
- Petrini, F.; Giaralis, A.; Wang, Z. Optimal tuned mass-damper-inerter (TMDI) design in wind-excited tall buildings for occupants’ comfort serviceability performance and energy harvesting. Eng. Struct. 2020, 204, 109904. [Google Scholar] [CrossRef]
- Ma, W.; Yu, J.; Yang, Y. Graphical Design Methodology of Multi-Degrees-of-Freedom Tuned Mass Damper for Suppressing Multiple Modes. J. Vib. Acoust. 2020, 143, 011008. [Google Scholar] [CrossRef]
- Zhang, Y.; Zhang, J.; Zhai, G. Vibration isolation platform with multiple tuned mass dampers for reaction wheel on satellites. Math. Probl. Eng. 2013, 2013, 574072. [Google Scholar] [CrossRef][Green Version]
- Meng, F.; Wan, J.; Xia, Y.; Ma, Y.; Yu, J. A multi-degree of freedom tuned mass damper design for vibration mitigation of a suspension bridge. Appl. Sci. 2020, 10, 457. [Google Scholar] [CrossRef]
- Yamaguchi, H.; Harnpornchai, N. Fundamental characteristics of Multiple Tuned Mass Dampers for suppressing harmonically forced oscillations. Earthq. Eng. Struct. Dyn. 1993, 22, 51–62. [Google Scholar] [CrossRef]
- Deb, K. Multi-Objective Optimization Using Evolutionary Algorithms; Wiley: New York, NY, USA, 2001. [Google Scholar]
- Petyt, M. Introduction to Finite Element Vibration Analysis; Cambridge University Press: Cambridge, UK, 1998. [Google Scholar]
- Meirovitch, L. Analytical Methods in Vibrations; Macmillan, Ed.; Pearson: London, UK, 1967; Available online: https://books.google.ca/books?id=sf1QAAAAMAAJ (accessed on 12 September 2020).
- Rodden, W.P. Aerodynamic Influence Coefficients from Strip Theory. J. Aerosp. Sci. 1959, 26, 833–834. [Google Scholar] [CrossRef]
- Konstadinopoulos, P.; Thrasher, D.F.; Mook, D.T.; Nayfeh, A.H.; Watson, L. A vortex-lattice method for general, unsteady aerodynamics. J. Aircr. 1985, 22, 43–49. [Google Scholar] [CrossRef]
- Albano, E.; Rodden, W.P. A doublet-lattice method for calculating lift distributions on oscillating surfaces in subsonic flows. AIAA J. 1969, 7, 279–285. [Google Scholar] [CrossRef]
- Fuller, J.R. Evolution of airplane gust loads design requirements. J. Aircr. 1995, 32, 235–246. [Google Scholar] [CrossRef]
- Wright, J.R.; Cooper, J.E. Introduction to Aircraft Aeroelasticity and Loads; John Wiley: Hoboken, NJ, USA, 2007; Available online: https://books.google.ca/books?id=y7a7kQEACAAJ (accessed on 16 January 2021).
- Davenport, A.G. The spectrum of horizontal gustiness near the ground in high winds. Q. J. R. Meteorol. Soc. 1962, 88, 197–198. [Google Scholar] [CrossRef]
- Davenport, A.G. The Dependence of Wind Load on Meteorological Parameters; University of Toronto Press: Toronto, ON, Canada, 1971; Available online: https://books.google.ca/books?id=vBvLtAEACAAJ (accessed on 21 January 2021).
- Gawronski, W. Modeling wind-gust disturbances for the analysis of antenna pointing accuracy. IEEE Antennas Propag. Mag. 2004, 46, 50–58. [Google Scholar] [CrossRef]
- Gawronski, W.; Bienkiewicz, B.; Hill, R. Wind-induced Dynamics of A Deep Space Network Antenna. J. Sound Vib. 1994, 178, 67–77. [Google Scholar] [CrossRef]
- Gawronski, W.K.; Mellstrom, J.A. Control and dynamics of the deep space network antennas. Control Dyn. Syst. 1994, 63, 289. [Google Scholar]
- Censor, Y. Pareto optimality in multiobjective problems. Appl. Math. Optim. 1977, 4, 41–59. [Google Scholar] [CrossRef]
- Da Cunha, N.; Polak, E. Constrained minimization under vector-valued criteria in finite dimensional spaces. J. Math. Anal. Appl. 1967, 19, 103–124. [Google Scholar] [CrossRef]
- Zadeh, L. Optimality and non-scalar-valued performance criteria. IEEE Trans. Autom. Control 1963, 8, 59–60. [Google Scholar] [CrossRef]
- Kilroy, K. MSC Nastran—Quick Reference Guide; MacNeal-Schwendler Corporation: Newport Beach, CA, USA, 1998; Available online: https://books.google.ca/books?id=sLR_wgEACAAJ (accessed on 10 October 2020).
- Lu, L.; Anderson-Cook, C.M.; Robinson, T.J. Optimization of designed experiments based on multiple criteria utilizing a pareto frontier. Technometrics 2011, 53, 353–365. [Google Scholar] [CrossRef]
- Matweb, Aluminum 6061-T6. 2021. Available online: http://www.matweb.com/search/datasheet.aspx?MatGUID=1b8c06d0ca7c456694c7777d9e10be5b (accessed on 26 March 2021).
- Orban, F. Damping of materials and members in structures. J. Phys. Conf. Ser. 2011, 268, 012022. [Google Scholar] [CrossRef]
- Roughen, K.M.; Baker, M.L.; Fogarty, T. Computational Fluid Dynamics and Doublet-Lattice Calculation of Unsteady Control Surface Aerodynamics. J. Guid. Control Dyn. 2001, 24, 160–166. [Google Scholar] [CrossRef]
- Thomas, P.V.; ElSayed, M.S.; Walch, D. Development of high fidelity reduced order hybrid stick model for aircraft dynamic aeroelasticity analysis. Aerosp. Sci. Technol. 2019, 87, 404–416. [Google Scholar] [CrossRef]
- Thomas, P.V.; ElSayed, M.S.; Walch, D. Review of model order reduction methods and their applications in aeroelasticity loads analysis for design optimization of complex airframes. J. Aerosp. Eng. 2019, 32, 04018156. [Google Scholar] [CrossRef]
- Valente, C.; Wales, C.; Jones, D.; Gaitonde, A.L.; Cooper, J.E.; Lemmens, Y. A doublet-lattice method correction approach for high fidelity gust loads analysis. In Proceedings of the 58th AIAA/ASCE/AHS/ASC Structures, Structural Dynamics, and Materials Conference, Grapevine, TX, USA, 9–13 January 2017. [Google Scholar] [CrossRef]
- Boivin, A.; Boilard, F.; Messier, P.L.; Tremblay, P. MAYA HTT, 12 m VLBI Antenna Structural Simulation; Internal Report; Intertronics Solutions Inc.: Vaudreuil-Dorion, QC, Canada, 2014. [Google Scholar]
- Colherinhas, G.B.; Petrini, F.; de Morais, M.V.G.; Bontempi, F. Optimal design of passive-adaptive pendulum tuned mass damper for the global vibration control of offshore wind turbines. Wind. Energy 2020, 24, 573–595. [Google Scholar] [CrossRef]


| Case Identification | Disturbance Speed (in/s) | Mean Wind Speed (in/s) | Mach Number | Dynamic Pressure (lb/in3) |
|---|---|---|---|---|
| Primary | 109.10 | 346.95 | 0.02615 | 0.005686 |
| Secondary | 339.20 | 1093.61 | 0.08173 | 0.055524 |
| Case ID | DS (deg) | TDG (deg × s) |
|---|---|---|
| Primary | 5.58 × 10⁻⁵ | 2.76 × 10⁻⁴ |
| Secondary | 3.78 × 10⁻⁴ | 8.39 × 10⁻³ |
| Configuration ID | (lb) | (lbf.s/in) | (lbf.s/in) | (lbf/in) | (lbf/in) | |
|---|---|---|---|---|---|---|
| 1 | 61 | 5.0 | 0.29 | 285.50 | 2.86 | 2855 |
| 2 | 29 | 10.0 | 0.29 | 285.50 | 2.86 | 2855 |
| 3 | 90 | 3.3 | 0.29 | 285.50 | 2.86 | 2855 |
| Configuration ID | Primary Case | Secondary Case | ||
|---|---|---|---|---|
| % Mass Inclusion (lb) | Reduction (Deg) | % Mass Inclusion (lb) | Reduction (Deg) | |
| 1 | 5.9 | 62.0 | 4.6 | 51.6 |
| 2 | 2.9 | 43.0 | 3.2 | 50.1 |
| 3 | 4.9 | 60.0 | 4.0 | 39.5 |
| Configuration ID | Primary Case | Secondary Case | ||
|---|---|---|---|---|
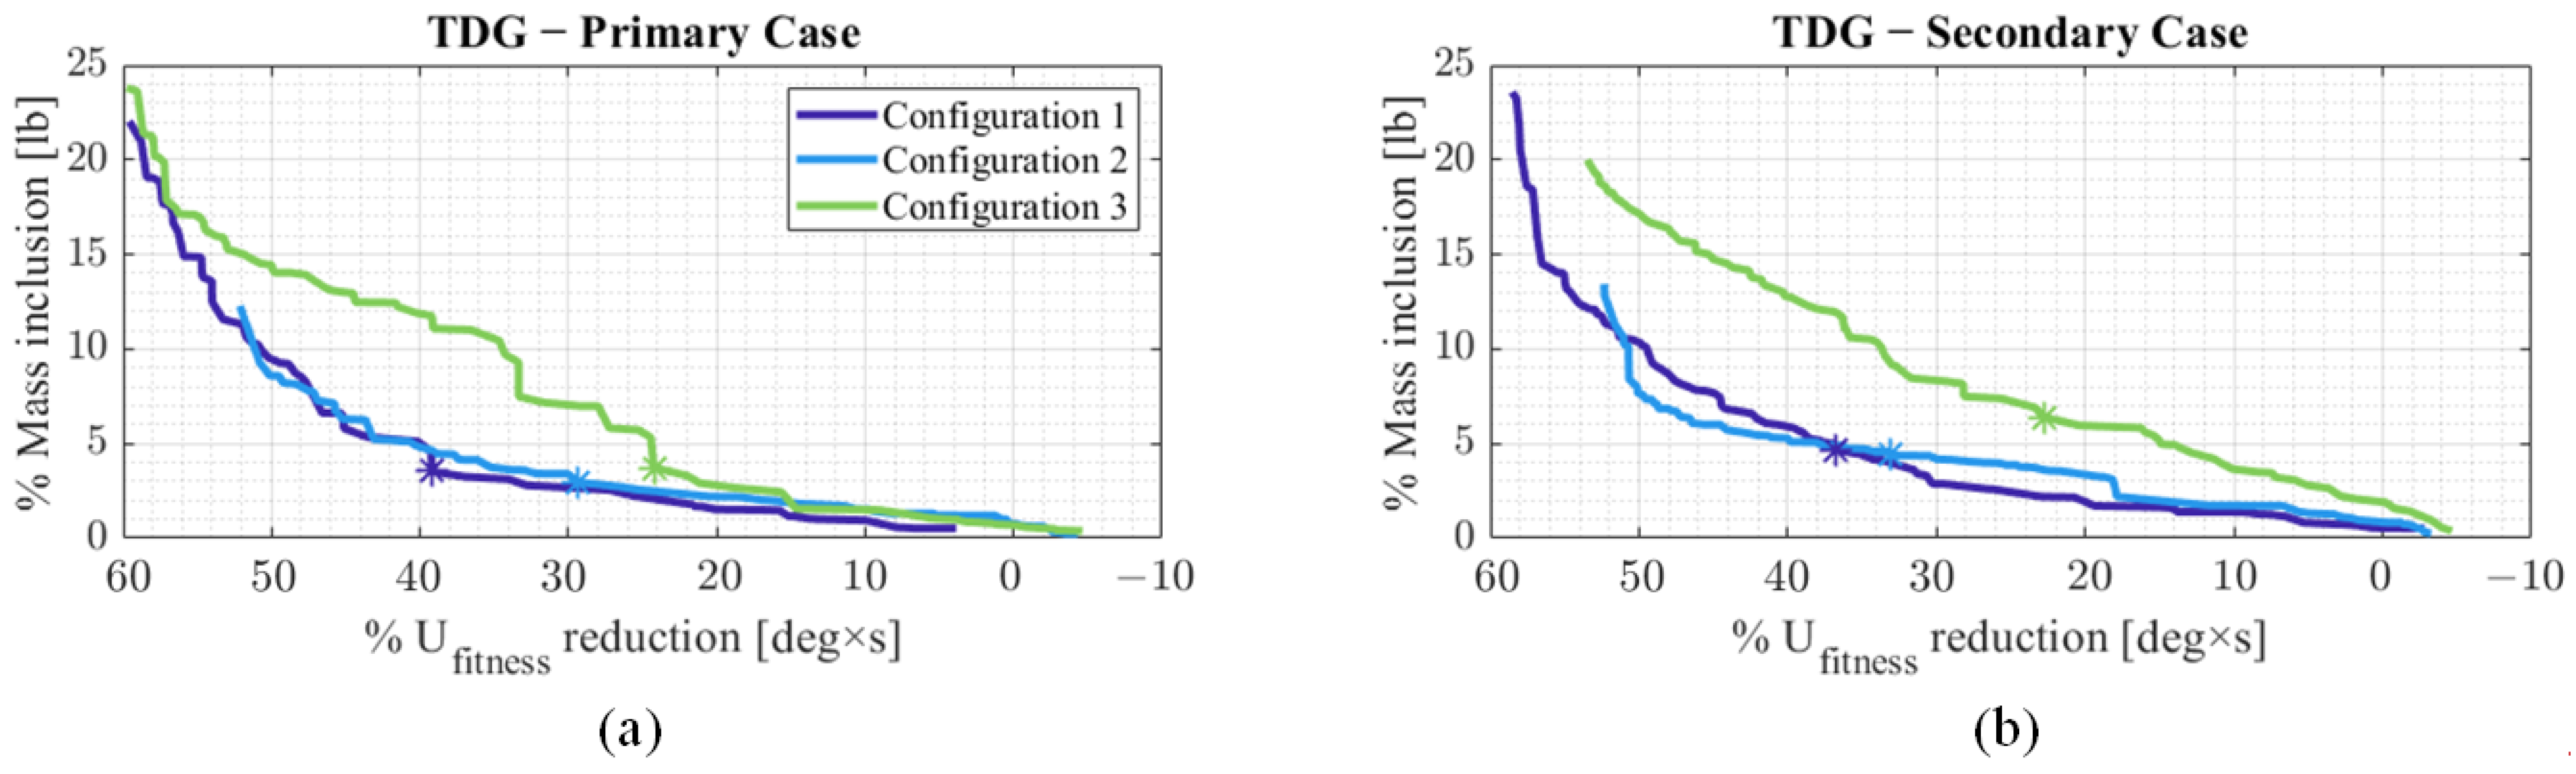
| % Mass Inclusion (lb) | Reduction (Deg × s) | % Mass Inclusion (lb) | Reduction (Deg × s) | |
| 1 | 3.6 | 39.2 | 4.7 | 36.8 |
| 2 | 3.0 | 29.4 | 4.4 | 33.0 |
| 3 | 3.7 | 24.2 | 6.4 | 22.8 |
| Operational Case | Optimal Values for (lb) |
|---|---|
| DS—Primary | 1.14 |
| TDG—Primary | 0.69 |
| DS—Secondary | 0.90 |
| TDG—Secondary | 0.90 |
Disclaimer/Publisher’s Note: The statements, opinions and data contained in all publications are solely those of the individual author(s) and contributor(s) and not of MDPI and/or the editor(s). MDPI and/or the editor(s) disclaim responsibility for any injury to people or property resulting from any ideas, methods, instructions or products referred to in the content. |
© 2023 by the authors. Licensee MDPI, Basel, Switzerland. This article is an open access article distributed under the terms and conditions of the Creative Commons Attribution (CC BY) license (https://creativecommons.org/licenses/by/4.0/).
Share and Cite
Gasparetto, V.E.L.; Reid, J.; Parsons, W.P.; ElSayed, M.S.A.; Saad, M.; Shieldand, S.; Brown, G.L.; Hilliard, L.M. Multi-Objective Design Optimization of Multiple Tuned Mass Dampers for Attenuation of Dynamic Aeroelastic Response of Aerospace Structures. Aerospace 2023, 10, 235. https://doi.org/10.3390/aerospace10030235
Gasparetto VEL, Reid J, Parsons WP, ElSayed MSA, Saad M, Shieldand S, Brown GL, Hilliard LM. Multi-Objective Design Optimization of Multiple Tuned Mass Dampers for Attenuation of Dynamic Aeroelastic Response of Aerospace Structures. Aerospace. 2023; 10(3):235. https://doi.org/10.3390/aerospace10030235
Chicago/Turabian StyleGasparetto, Victor E. L., Jackson Reid, William P. Parsons, Mostafa S. A. ElSayed, Mohamed Saad, Stephen Shieldand, Gary L. Brown, and Lawrence M. Hilliard. 2023. "Multi-Objective Design Optimization of Multiple Tuned Mass Dampers for Attenuation of Dynamic Aeroelastic Response of Aerospace Structures" Aerospace 10, no. 3: 235. https://doi.org/10.3390/aerospace10030235
APA StyleGasparetto, V. E. L., Reid, J., Parsons, W. P., ElSayed, M. S. A., Saad, M., Shieldand, S., Brown, G. L., & Hilliard, L. M. (2023). Multi-Objective Design Optimization of Multiple Tuned Mass Dampers for Attenuation of Dynamic Aeroelastic Response of Aerospace Structures. Aerospace, 10(3), 235. https://doi.org/10.3390/aerospace10030235