Abstract
As a key component of the solid rocket motor, nozzle ablation is very important to the performance of the motor. In order to study the influence of the law of nozzle ablation on motor performance, a two-dimensional axisymmetric model of a ground state nozzle and vacuum state nozzle before and after ablation was constructed on the basis of a reference profile, and the change law of pressure, temperature and velocity with ablation were studied. The comprehensive performance of the nozzle before and after ablation was calculated to evaluate the influence of ablation on motor performance. It was found that the profile ablation changed the shock wave distribution in the flow field of the expansion section, and the appearance of the ablation step also led to a new internal shock wave. The gas was compressed, and the flow direction, velocity, pressure, temperature, etc., were changed. After the ablation, the temperature and pressure of the nozzle outlet location increased, the velocity decreased, and the total thrust and specific impulse decreased.
1. Introduction
The nozzle is the energy conversion device of the solid rocket motor, which converts the heat energy of high temperature and high-pressure gas into kinetic energy to produce thrust. The profile of the nozzle divergent section affects the gas flow and wall pressure, and is related to motor thrust efficiency [1,2,3]. Particles (mass fraction up to 30%) generated after solid rocket motor propellant combustion cause severe nozzle ablation [3,4], and parameters such as gas temperature and pressure change greatly in the nozzle. The rich flow field characteristics and mechanism are also worth exploring. Nozzle profile design and thermal protection performance should consider motor thrust requirements, thermodynamic characteristics of gas, the external environment, and other factors, all of which are at the forefront of solid rocket motor design. Domestic and foreign scholars have carried out much research in this area.
The nozzle of the solid rocket motor was originally designed by experiment and empirical formula, but due to the limitations of the size of the motor and research cost, numerical calculation methods gradually began to be applied to nozzle profile design. Rao first adopted the variational method to design a maximum thrust nozzle profile under the condition of certain mass flow rate and nozzle divergent section length, but two-phase flow loss was not considered [5]. Later, Hoffman et al. calculated and analyzed the relationship between nozzle performance and profile, based on various assumptions regarding gas particle two-phase flow theory, and proposed an optimal design method for an axisymmetric nozzle profile, which was not simulated and complex, and was not suitable for engineering application [6,7]. Allman used the direct optimization method to compare the efficiency loss of a series of second-order polynomial nozzles with a constant initial expansion angle. The error was small, but also used the theoretical calculation method [8].
With the development of computers and numerical methods, computational fluid dynamics has been widely applied to nozzle profile design, shortening the research period and saving funds [9]. Wang Chengxuan designed the optimal inner profile of a solid rocket motor with the shortest nozzle divergent section by calculating one-dimensional two-phase equilibrium flow, and the research mainly focused on theoretical analysis [10]. By numerical calculation of the flow field of the solid rocket motor nozzle, Chen Linquan studied the influence of the convergent nozzle section and throat on the flow rate, and the influence of length–diameter ratio of the nozzle divergent section on the specific impulse of the motor [11,12]. Wang Yibai and others studied the influence of the initial expansion arc radius, inlet angle and outlet angle on flow separation of the parabolic nozzle [13], and conducted a detailed analysis of flow field characteristics.
The above research put forward various optimization methods for profile design, explored the variation rules of flow field parameters of nozzles with different profiles, provided solid theoretical basis and design criteria for nozzle design of a solid rocket motor, and has important reference value for engineering applications. However, the influence of nozzle ablation characteristics on nozzle performance has not been considered, which has certain limitations [14].
Temperature and pressure of fuel gas in the nozzle are high, and some components may react with the wall, causing thermochemical ablation; the condensed phase particles collide with the wall, causing mechanical erosion of the wall. Ablation changes the nozzle profile, which, in turn, affects gas expansion, flow field structure, and wall temperature and pressure distribution of the nozzle, and affects thrust and other types of performance [15,16]. In this paper, the influence of nozzle profile ablation on its performance is studied through flow field simulation. In view of the profile before and after ablation of a nozzle, the circumferential deviation of the profile ablation rate is not considered. A two-dimensional axisymmetric model is established to simulate the flow field and performance of the nozzle before and after ablation, and to study the influence of axial profile ablation on the motor performance.
2. Calculation Model and Method
2.1. Physical Model
According to the simulation and actual working conditions, the axial component of the gas parameters in the nozzle was much larger than the radial and circumferential components, and there was little difference in the flow field distribution and outlet parameters between the three-dimensional symmetric model and the two-dimensional axisymmetric model. In order to improve the computational efficiency, the two-dimensional axisymmetric model was selected for research and analysis. The geometry of a nozzle is a classical elliptic–cubic curve profile, and the elliptic parameters in the convergent nozzle section are length and convergence ratio. The parameters of a throat cylinder are diameter and length; the divergent section of nozzle is divided into an initial divergent section and a main divergent section, and the initial divergent section is an arc. The main divergent section is a cubic curve, and the variables include an initial expansion half-angle, an expansion half-angle of exit, a length–diameter ratio and an expansion ratio. The actual profile parameters of the nozzle are shown in Figure 1 and Table 1. The ablation of the motor during operation is shown in Figure 2.
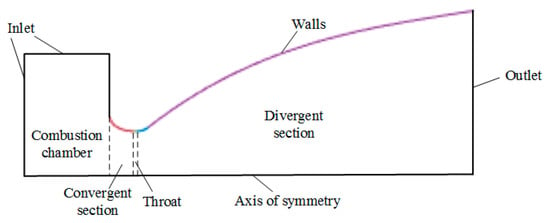
Figure 1.
Original geometric model of nozzle.

Table 1.
Reference standard contour parameters.
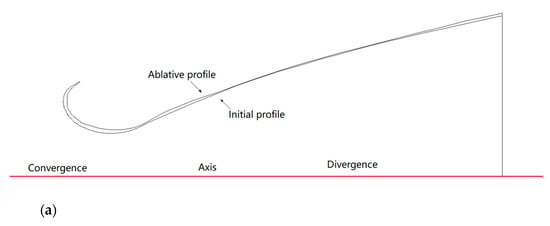
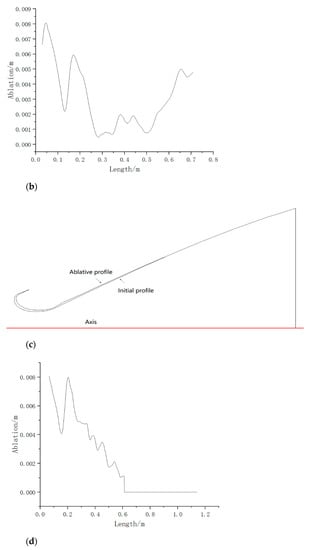
Figure 2.
The profile of nozzle ablation after the experiment: (a) schematic diagram of ground state nozzle ablation; (b) the ablation of the ground state nozzle; (c) schematic diagram of vacuum state nozzle ablation; (d) the ablation of the vacuum state nozzle.
The profile of ground state nozzle and vacuum state nozzle before and after ablation were taken as the research object, and the geometry is shown in Figure 2. The nozzle convergent section and throat were severely ablated. The ablation of the nozzle divergent section was mainly in the initial divergent section at the downstream of the throat and the wall near the nozzle outlet location. The “step” appeared at the place where the ablation was serious at the downstream of the throat. The ablation rate increased sharply, affecting the flow field structure, wall temperature and pressure distribution, etc.
The thermal conductivity of gas is calculated by kinetic energy theory, and the viscosity coefficient is calculated by three-coefficient Sutherland law. The particles of the two-phase flow were inertial particles, whose initial temperature and velocity were the same as those of the inlet fluid. The diameter followed Rosin–Rammler distribution, and the uniformity index was set at 3.5. The maximum, minimum and average diameters were 100 , 1 and 50 , respectively. The probability density distribution of particle diameter is shown in Figure 3.
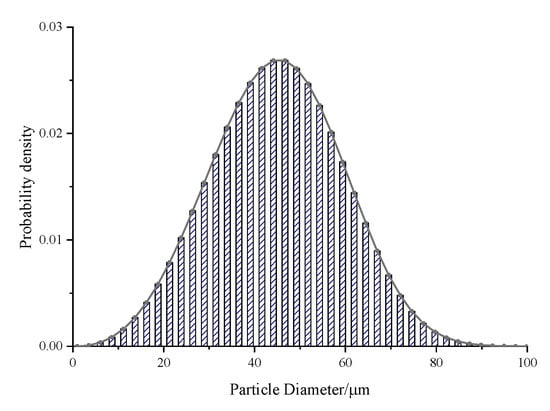
Figure 3.
Probability density distribution of diameter of particles.
2.2. Governing Equation
The two-phase flow field was solved by the Eulerian–Lagrangian method, and the gas phase was solved based on the Reynolds-averaged N–S equation in Euler coordinates.
Equation of continuity:
Momentum equation:
where, represents the Reynolds mean velocity component without the mean sign, is the density, is the pressure, is the fluctuation velocity, and is the stress tensor component.
The particle phase was solved by DPM model under the Lagrange coordinate system. The force equilibrium equation of unit mass particles in the X direction is:
where:
is drag force; , are velocity of gas phase and particle, respectively; , are density of gas phase and particle, respectively; and is additional force.
2.3. Computational Methods and Boundary Conditions
The calculation was solved by using the pressure-based solver, pressure-velocity was solved by Coupled algorithm, and the discrete scheme of the variables such as pressure, density and energy were adopted as the second order upwind scheme, which was conducive to improving the calculation accuracy. The turbulence was solved by the standard k-ε equation model and the standard wall function. In the DPM model, the stochastic orbit model was used to consider the turbulent dispersion of particles, while the interaction between particles and the influence of particles on eddy in the flow field were ignored. The magnitude analysis showed that the additional mass force, pressure gradient force and gravity of the particles were negligible compared with the drag force.
Standard k-ε equation model:
where:
where, PK is the generation term of turbulent kinetic energy K caused by average velocity gradient; and Gb is the generation term of turbulent kinetic energy K caused by buoyancy. For incompressible fluid,; −ρε is a dissipation item; YM is the compressibility correction term, which is the contribution of pulsation expansion in compressible turbulence; is the generated item of ; is the buoyancy correction term; is the dissipation term; and are the source terms of K equation and ε equation, respectively; is the speed of sound; and is the coefficient of thermal expansion.
In the standard k-ε model, the typical value of empirical constant is:
where, is the buoyancy-related coefficient in the calculation of compressible flow. When the main flow direction is parallel to gravity, = 1.0; when the main stream is perpendicular to the gravity direction, = 0.
Standard wall function:
In order to reflect the impact of turbulence fluctuation, the definitions of u+ and y+ needed to be extended:
Dimensionless temperature was introduced:
where, T is the temperature of the first inner node P adjacent to the wall; Tw is the wall temperature; and qw is the wall heat flux. The logarithmic law of velocity and temperature is expressed as:
In Equations (12) and (13), F is the parameters related to the molecular Prandtl number (Pr) and the turbulent Prandtl number () sorted out from the experimental results:
Equation (10) was substituted into Equation (12), and Equations (10) and (11) were substituted into Equation (13):
The and were obtained:
where, is the molecular viscosity coefficient, is the molecular thermal conductivity, and Pr is the molecular Prandtl number.
The wall function method is mainly used to determine the turbulent viscosity coefficient mut and the turbulent thermal conductivity coefficient on the wall, so as to determine the wall shear stress and the heat flow density .
Where is given according to the equation, and the boundary condition is taken as ,
is calculated by the following formula:
Under high altitude flight conditions, the corresponding flow field boundary conditions were included:
(1) Mass flow inlet: The total temperature was 3700 K, the mass flow rate of pure gas phase and gas in two-phase were 95 kg/s and 66.5 kg/s, respectively. The turbulence intensity was 5.1%, the turbulence viscosity ratio was 3.7, the incoming flow direction was perpendicular to the inlet boundary, and the discrete phase boundary type was escape;
(2) Pressure outlet: the static pressure was 22 Pa, the turbulence intensity was 6.0%, the turbulence viscosity ratio was 270.3, the reflux direction was perpendicular to the outlet boundary, the total reflux temperature was 3700 K, and the discrete phase boundary type was escape.
(3) Wall: there was no slip adiabatic solid wall and discrete phase boundary type was deposition.
(4) Axis: axisymmetric boundary condition.
2.4. Model Verification
2.4.1. Verification of Two-Phase Flow Model
In this section, the numerical simulation of gas particle two-phase flow is carried out for the nozzle in reference [17] and the numerical calculation method of two-phase flow is verified by comparison with the experimental data. Figure 4 shows the geometry and size of the nozzle used in the experiment. ICEM software was used to draw the simulation geometric model and grid.

Figure 4.
Geometry of nozzle model for two-phase flow.
The gas parameters and boundary conditions were consistent with the experimental conditions in the literature. The gas was ideal gas, the particles were impact resistant polystyrene (PS), and the density was . The pressure of nozzle inlet location was 392 kPa, the temperature of nozzle inlet location was 293 K, the injection velocity of particle was 20 m/s, the particle diameter was 545 and 1095; and the pressure of the nozzle outlet location was 101,325 Pa.
The two-phase flow model algorithm and others in the simulation process were consistent with Section 2.3, and the flow field and particle parameter distribution of the nozzle were calculated. The particle velocity distribution on the axis of the nozzle divergent section was extracted as the research object, and comparison with the experimental data is shown in Figure 5. Among them, the dots and five-pointed stars represent the experimental results of particle velocity distribution with diameters of 545 μm and 1095 μm in the original literature, respectively. The solid and dashed lines correspond to the simulation results in this paper, which were in good agreement with each other, verifying the reliability of the model for solving the two-phase flow in the nozzle.
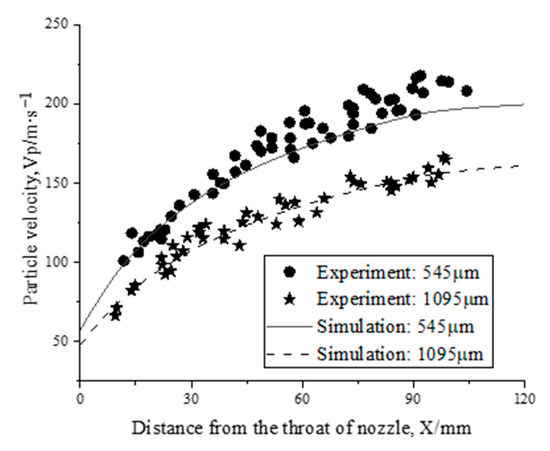
Figure 5.
Comparison of particle velocity distribution.
2.4.2. Verification of Grid Independence
In order to determine reasonable calculation grid distribution and take into account calculation accuracy and efficiency, this section takes an elliptic-cubic curvilinear nozzle profile as the research object to draw multiple grids of different scales, with the same distribution of nodes and a certain proportion increase in number. The variations of nozzle flow field parameters and performance with grid numbers were studied to select the appropriate grid scale, as shown in Figure 6.
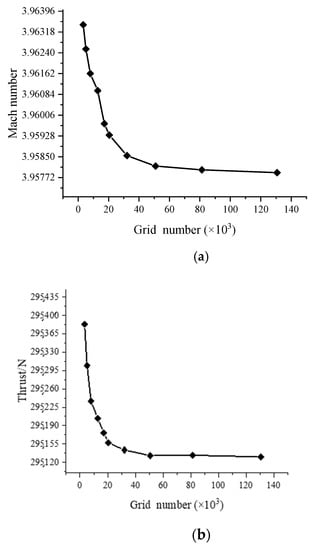
Figure 6.
Curve of different parameters changing with grid number: (a) Mach number; (b) thrust.
With the increase in the number of grids, the Mach number and thrust at the nozzle outlet location gradually decreased and become stable. When the number of grids exceeded 80,000, the Mach number and thrust changed little, and the flow field distribution of different grids also became quite close (Figure 7 shows the comparison of the Mach number cloud map). Within the allowable range of calculation error, the grid independence of simulation results can be proved. Considering the computational efficiency, the number of subsequent grids was set at about 80,000, which had small errors and good convergence. The adopted grids were all structured grids (the division was complicated, but it was convenient to encrypt specific areas, and the computational convergence speed and accuracy were high), and encrypted near the wall. The grid quality could basically reach 0.98, meeting the simulation requirements.
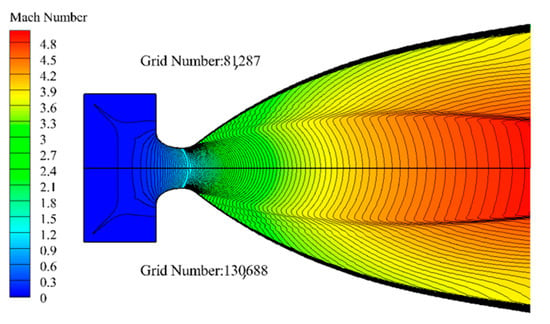
Figure 7.
Comparison of Mach number distribution in flow field with two types of grids.
3. Analysis of Calculation Results
3.1. Analysis of Nozzle Ablation under Ground Condition
The ablative rate of nozzle profile is shown in Figure 2. The ablative rate of the convergent section and throat was serious, and the ablative rate of the divergent section was mainly in the initial divergent section of the downstream throat and the wall near the outlet. In the downstream throat, where the ablative rate was serious, the step appeared, and the ablative rate increased sharply, which affected the flow field structure, wall temperature and pressure distribution, etc.
- (1)
- Influence of profile ablation on velocity field
Figure 8 shows the Mach number nephogram of the nozzle before and after ablation. Although the convergent section also had a large profile ablation, the Mach number distribution of the flow field before the sound speed line was less different, and the flow field structure was also the same. However, the change of the throat and divergent section, especially the ablation step at the downstream of the throat, changed the direction of gas flow, which greatly affected the flow field structure and was very different from the flow field of the initial design profile. In addition to the shock wave in the flow field due to the expansion of the cubic curve, after the ablation occurred, the profile generated internal shock waves of different strengths near the throat and the ablated step, which compressed the gas to varying degrees, thus, changing the Mach number distribution of the flow field in the divergent section and further affecting the momentum thrust of the nozzle.
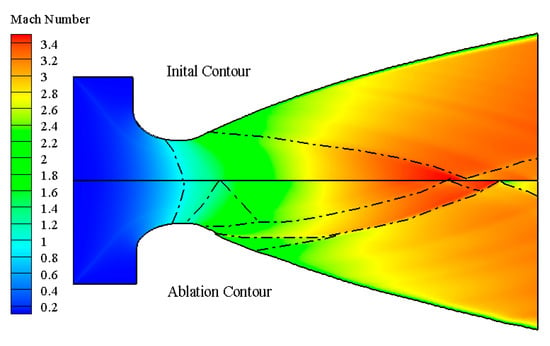
Figure 8.
Mach number distribution of the ground state nozzle before and after ablation.
Figure 9 shows the Mach number distribution on the axis before and after the nozzle ablation. The difference of axial velocity of the convergent section was small, and the velocity increase along the axis was also close. In the convergent section, ablation affected the smoothness of the profile. At the intersection of the shock wave and the axis, the gas velocity suddenly dropped at the divergent section. In addition, the intensity of the shock wave in the ablation profile was greater, resulting in a greater drop in the gas velocity, which reduced the velocity of outlet location by 4.69% compared with the initial profile.
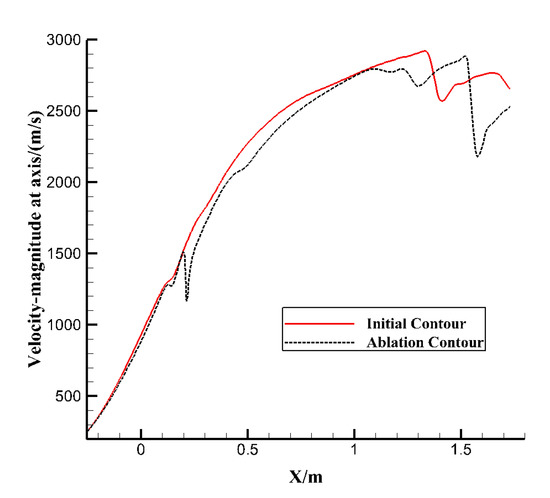
Figure 9.
Axial velocity distribution of the ground state nozzle before and after ablation.
- (2)
- Influence of profile ablation on the pressure field
Profile ablation also affects the pressure field of the nozzle, affects the wall force on the nozzle, and further affects the thrust performance of the nozzle. Figure 10a compares the pressure distribution of the nozzle before and after ablation. The impact of profile ablation on the pressure was mainly in the combustion chamber, the nozzle convergent section and the upstream part of the throat. The average pressure difference of the inlet section was 13.68%. The reduction in working pressure led to a reduction in nozzle performance. Figure 10b shows the pressure ratio distribution of the axis before and after ablation of the nozzle. The pressure ratio at the convergent section had little difference. The pressure ratio at the ablation step at the downstream of the throat suddenly increased, then decreased. The pressure ratio at the intersection of the shock wave and the axis near the outlet location increased. The distribution at other locations had slight fluctuations, but the overall difference was not significant.
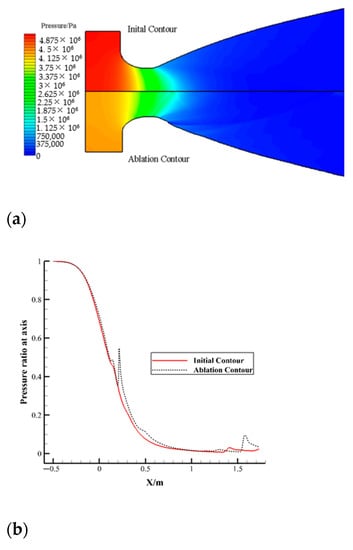
Figure 10.
Comparison of pressure before and after nozzle ablation: (a) pressure distribution of ground state nozzle before and after ablation; (b) distribution of ground axis pressure ratio before and after ablation.
- (3)
- Influence of profile ablation on the temperature field
Figure 11 shows the temperature distribution of the nozzle before and after ablation. It can be seen that the temperature difference was mainly in the divergent section. The numerical change was opposite to the velocity field. The flow field structure, such as shock wave, was also the same. The flow field temperature gradient of the ablation profile was larger, indicating that the ablation of the profile had a greater impact on the nozzle temperature.
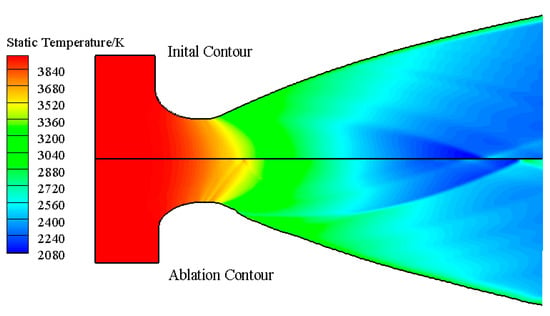
Figure 11.
Temperature distribution of ground state nozzle before and after ablation.
- (4)
- Influence of profile ablation on nozzle performance
The nozzle outlet location parameters were obtained by numerical simulation, and the thrust, specific impulse and other properties were calculated. The performance of the nozzle before and after ablation was compared, as shown in Table 2. After the ablation, the temperature and pressure at the outlet location increased and the velocity decreased, resulting in an increase in the static thrust and a decrease in the momentum thrust. Although the change rate of the static thrust was larger, the total thrust and specific impulse decreased after the ablation because the momentum thrust accounted for a relatively large proportion of the total thrust. The specific impulse calculation in this paper did not represent the true energy level of the propellant, but only served as a reference for analyzing the impact of nozzle ablation on the specific impulse.

Table 2.
Comparison of ground state nozzle performance parameters before and after ablation.
3.2. Analysis on the Influence of Nozzle Ablation at Vacuum State
The gas phase flow field on the profile before and after ablation of the vacuum state nozzle was compared, as shown in Figure 12. The pressure distribution trend was the same, and the numerical difference was also mainly in the combustor and convergent section. In the divergent section, there were obvious differences in the distribution of temperature, velocity and Mach number. After the ablation occurred, the obvious ablative step was formed on the upstream wall of the divergent section, and a shock wave was generated at the step and intersected at the axis. The ablation also increased the intensity of shock waves in the original flow field and changed the location of shock waves. The change of flow field parameter structure affected the parameter distribution of the outlet location and led to the loss of nozzle performance.
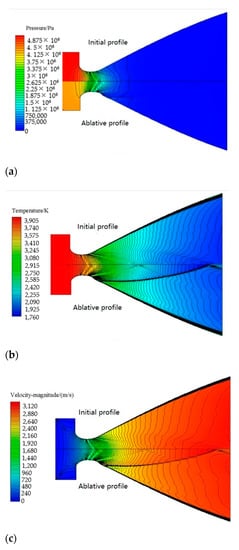
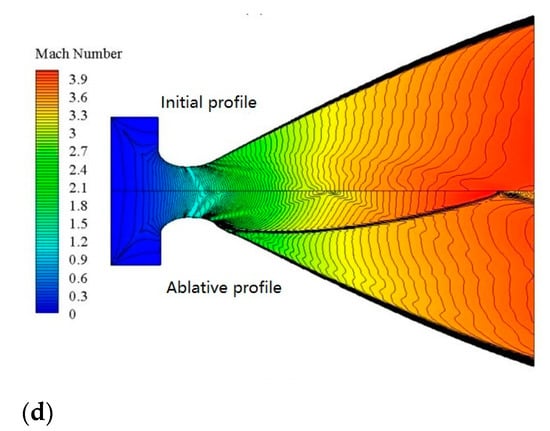
Figure 12.
Comparison of flow field nephogram before and after ablation of vacuum state nozzle: (a) static pressure; (b) static temperature; (c) speed; (d) Mach number.
From the distribution of gas axial velocity (Figure 13), it can be seen that after the ablation occurred, at the intersection of the shock wave and the axis, the axial velocity of the flow field decreased in varying degrees because of the changes of shock wave structure in the flow field. Especially near the outlet location, after the ablation occurred, the shock wave strength of flow field was large, and the gas velocity decreased greatly, so the axial velocity at the outlet location was small.
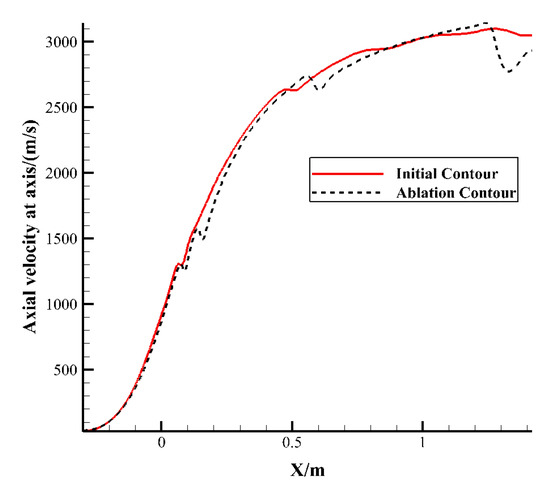
Figure 13.
Axial velocity distribution on the axis of the vacuum state nozzle before and after ablation.
The performance parameters of the nozzle before and after ablation were calculated, as shown in Table 3. From the simulation results, it can be seen that the specific impulse decreased by 0.775%, indicating that the ablation of the profile had a large impact on the specific impulse performance of the nozzle. According to the change of thrust force, the performance loss was mainly caused by momentum loss, because the influence of profile ablation on the velocity distribution of the outlet location was greater than that of the pressure distribution. Under the influence of profile ablation, the static temperature of the outlet location also changed. The specific impulse calculation in this paper did not represent the true energy level of the propellant, but only served as a reference for analyzing the impact of nozzle ablation on the specific impulse.

Table 3.
Comparison of performance parameters of vacuum state nozzle before and after ablation.
4. Conclusions
In this paper, based on the standard k-epsilon model and the standard wall function, the DPM model in Lagrange coordinate system was used to solve the particle phase, the model before and after the ablation of the ground state nozzle was calculated, the vacuum state nozzle was established, and the influence of the profile ablation of the nozzle on its performance and flow field structure was simulated and analyzed.
The laws of the ground state nozzle and the vacuum state nozzle were basically the same. Due to the ablation, the throat and divergent section of the nozzle were changed, especially the ablative step at the downstream of the throat, and shock waves of different strengths were generated nearby, changing the direction of gas flow. The flow field structure was greatly affected, mainly in the following aspects:
(1) At the intersection of the internal shock wave and the axis, the gas velocity showed a trough of sudden decline in the divergent section, and the intensity of the shock wave in the profile ablation was larger, which led to a large decrease in the gas velocity, thus, reducing the velocity of the outlet location and the dynamic thrust of the nozzle;
(2) The ablation of the profile had a significant influence on the nozzle pressure distribution field. The ablation resulted in a larger throat area and a lower pressure in the combustion chamber, the nozzle convergence section, and the upper throat. The wall pressure in the expansion section increased slightly, resulting in a slight increase in the static thrust of the nozzle;
(3) The influence of profile ablation on the flow field temperature in the nozzle was mainly in the expansion section. The numerical change of temperature was opposite to that of the velocity field. The flow field structure, such as internal shock wave, was the same, and the temperature gradient of the flow field in the profile ablation was larger;
(4) After the ablation, the temperature and pressure of the nozzle outlet location were increased and the velocity was decreased, resulting in an increase in static thrust and a decrease in momentum thrust. However, since momentum thrust accounts for a relatively large proportion of total thrust, the total thrust was decreased after ablation, resulting in a decrease in specific impulse.
Author Contributions
Conceptualization, W.H., C.W. and W.T.; methodology, C.W.; software, W.H., C.W., K.Z.; validation, Z.W. and W.H.; formal analysis, W.H., C.W.; investigation, W.T., K.Z.; resources, W.H.; data curation, W.H., C.W. and W.T.; writing—original draft preparation, W.H.; writing—review and editing, W.H., C.W. and Z.W.; visualization, K.Z.; supervision, W.T.; project administration, W.H., C.W. All authors have read and agreed to the published version of the manuscript.
Funding
This research received no external funding.
Institutional Review Board Statement
Not applicable.
Informed Consent Statement
Not applicable.
Data Availability Statement
The data presented in this study are available upon request from the corresponding author.
Conflicts of Interest
The authors declare that there is no conflict of interest regarding the publication of this paper.
References
- Helong, J.; Ruyi, T.; Hao, W. Research on flow field characteristics of nozzle plume for a solid rocket motor. J. Phys. Conf. Ser. 2022, 2336, 012013. [Google Scholar]
- Yang, L.; Hai-feng, W.; Dong, M.; Yong-gang, G.; Wei, Z. Numerical investigation of surface roughness effects on non-equilibrium flow in expansion section of rocket nozzle. Aerosp. Sci. Technol. 2022, 124, 107523. [Google Scholar]
- Zhao, S.; Tian, H.; Wang, P.; Yu, N.; Cai, G. Steady-state coupled analysis of flowfields and thermochemical erosion of C/C nozzles in hybrid rocket motors. Sci. Chin3.3Technol. Sci. 2015, 58, 574–586. [Google Scholar] [CrossRef]
- Wu, X.; Chen, J.; Wang, D. Numerical Simulation of Working Process of Solid Rocket Motor; Higher Education Press: Beijing, China, 2006. [Google Scholar]
- Rao, G.V.R. Exhaust Nozzle Contour for Optimum Thrust. J. Jet Propuls. 1958, 28, 377–382. [Google Scholar] [CrossRef]
- Lorenc, S.A.; Hoffman, J.D. Correlation of performance of conical and contoured nozzles for gas-particle flow. AIAA J. 1966, 4, 169–171. [Google Scholar] [CrossRef]
- Hoffman, J.D.; Thompson, H.D. Optimum thrust-nozzle contours for gas-particle flows. AIAA J. 1967, 5, 1886–1887. [Google Scholar] [CrossRef]
- Allman, J.G.; Hoffman, J.D. Design of Maximum Thrust Nozzle Contours by Direct Optimization Methods. AIAA J. 2012, 19, 750–751. [Google Scholar] [CrossRef]
- Liu, B.; Fang, D.; Xia, Z. Optimal design of rocket nozzle parameters with consideration of gas-particle two-phase flow effect. J. Propuls. Technol. 2013, 34, 8–14. [Google Scholar]
- Yu, K.; Yang, X.; Mo, Z. Profile Design and Multifidelity Optimization of Solid Rocket Motor Nozzle. J. Fluids Mot. 2014, 136, 031104. [Google Scholar] [CrossRef]
- Wang, C. Optimal design of internal contour of solid motor nozzle. J. Astronaut. 1996, 17, 64–67. [Google Scholar]
- Chen, L.; Li, Y.; Hou, X. Effects of nozzle contour in convergent section and throat on mass flow rate. J. Solid Rocket. Technol. 2002, 25, 10–11. [Google Scholar]
- Chen, L.; Li, Y.; Wang, J.; Hou, X. Effects of the nozzle divergent cone contour on solid rocket motor performance. J. Solid 2004, 27, 9–11. [Google Scholar]
- Wang, Y.; Liang, Y.; Zhao, Y. Numerical simulation of effect of parabolic nozzle contour parameters on flow separation. J. Aerosp. Power 2017, 32, 196–201. [Google Scholar]
- Mu, X.; Tian, W.; Dong, X. Study on the effect of divergence contour parameters on performance of solid rocke motor nozzle. J. Solid Rocket. 2021, 44, 254–263. [Google Scholar]
- Liu, R.; Chen, X.; Zhou, C.; Li, Y. Devolopment of interpolation Method for conjugate heat transfer in non-orthogonal interface. J. Propuls. Technol. 2016, 37, 90–97. [Google Scholar]
- Okuda, S.; Choi, W.S. Gas-particle mixture flow in various types of convergent-divergent nozzle. J. Chem. Eng. Jpn. 1978, 11, 432–438. [Google Scholar] [CrossRef]
Disclaimer/Publisher’s Note: The statements, opinions and data contained in all publications are solely those of the individual author(s) and contributor(s) and not of MDPI and/or the editor(s). MDPI and/or the editor(s) disclaim responsibility for any injury to people or property resulting from any ideas, methods, instructions or products referred to in the content. |
© 2023 by the authors. Licensee MDPI, Basel, Switzerland. This article is an open access article distributed under the terms and conditions of the Creative Commons Attribution (CC BY) license (https://creativecommons.org/licenses/by/4.0/).