1. Introduction
Every day, people living in towns and cities make a wide variety of decisions about the weather. Climate change is increasing rapid fluctuations in weather conditions, producing more extremes, thereby raising the number and magnitude of potential risks and hazards that can seriously impact people’s lives. Thus, identifying and understanding local climate risks is a long but essential process for defining adaptation strategies, and these strategies must be translated into ways to reduce the damage when unpredicted events occur [
1].
However, the process of achieving climate adaptation is comprised of a range of difficulties associated with uncertainty in climate predictions, including the reluctance to implement policies, and the distrust of citizens’ engagement. In addition to observing the behaviour of each of the climatic elements and their implications for people’s wellbeing and health, it is necessary to assess the nature of the bioclimatic comfort conditions for human beings residing in or using a certain space [
2].
Adaptation, although being apparently quite a simple concept—adjusting behaviors, actions, and decisions within biological, social, and built systems in response to climatic changes [
3]—it is not. It has many complexities. For instance, at the level of the variety of desired basic goals: (1) to increase adaptive capacity, or the ability to respond effectively to changing stresses and shocks to manage or reduce risk [
4]; (2) to increase resilience, or the ability of a social or ecological system to continue functioning when confronted with shock and stress [
5]; and (3) to reduce vulnerability, or the susceptibility to harm when exposed to an external hazard [
6]. Each goal definition motivates a specific set of investigations anchored in particular scientific backgrounds and subsequent approaches, without a systemic view and with a net gap in scale up and down, because they do not fit without a context.
According to the fifth Intergovernmental Panel on Climate Change (IPCC) report (2014), the global average temperature is rising. A good part of the increase observed in recent years may have resulted from the increase in the concentration of greenhouse gases. Without effective mitigation/adaptation measures, this report predicts that the increase in the global average temperature by the end of the 21st century may be in the range between 1.4 and 5.8 °C [
7]. The sixth IPCC assessment report is still underway, but special reports in October 2018 and August 2019 have already underlined the severity of the impact of global warming.
Thus, climate change has been identified as one of the greatest environmental, social, economic, and geopolitical threats facing the planet and humanity today. These changes will affect, for example, the average values of temperature and precipitation and, just as or more importantly, the frequency and intensity of extreme weather events [
8]. Therefore, they constitute a challenge that needs to be tackled and overcome in an intelligent and structured way if we want to prevent its effects, capitalize on its benefits, and reduce risks and losses.
Climate change exposes natural and socioeconomic systems to climate risks that are the result of the combination of the exceptional behaviour of climate elements and the vulnerability of who or what is exposed to them [
9]. These risks are the result of the combined interaction between danger, vulnerability, and exposure [
7]. Given the complexity involved in a participatory system, as well as in innovative approaches to the implementation of governance strategies, it is of the utmost importance to analyze how extreme events can affect people, and the varied ways in which different groups within communities are affected, especially in terms of social vulnerability. Such impacts are complex, dynamic and variable in space and in time [
10].
Some authors [
11,
12,
13,
14] argue that transdisciplinary collaboration and an integrated approach are essential when dealing with climate risks and their impacts, which require an understanding of people’s concerns about climate risk [
15] and ways of dealing with extreme weather events [
16]. Munaretto, Siciliano and Turvani [
14] also stress the relevance of including citizens as a part of the process of governing climate adaptation, highlighting, among other components, social learning (social memory) and participation (citizens’ perspective). Even so, account has to be taken of the difficulties inherent to these processes, arising from the uncertainty and inertia in the way things happen that lead to skepticism among the public and the reluctance of citizens to participate [
15].
Understanding the main impacts of climate change in the various sectors of society in the medium and long term is fundamental for the development of adaptation measures that allow people to prevent and minimize these impacts [
9]. The concept of adaptation is comprised of a list of other complex terms—risk, hazard, vulnerability, susceptibility—and the research already done still has a vast gap in adopting systematic, multidisciplinary, and transdisciplinary views, and, as it is often written, addressing exposure to risk—a symptom of vulnerability—does not, by itself, mean a reduction in vulnerability or an increase in the ability of an individual or a community to reduce risks [
17,
18]. Policy makers and people aim for solutions on a generational time scale and in a specific place; they are able to fund only those that are cost-effective.
This paper will be considered as a supplementary deliverable of a European project—Citizen Sensing: Urban Climate Resilience through Participatory Risk Management System (
https://citizensensing.itn.liu.se.), which develops a participatory system based on citizen sensing and explores the potential for increasing preparedness and the appropriate responses by citizens and authorities for increasing climate resilience. In this context, urban citizens can receive specific recommendations on how to decide and respond to climate-related risks.
Bearing in mind the relevance of informing citizens clearly and in a simple way when extreme events occur in order to minimize the climatic risks and to give them options to protect themselves, this paper intends to propose a methodological approach to guiding citizens’ movement around the city when these extreme temperatures occur, minimizing climatic risks and negative health outcomes, using a very simple method based on Landsat 8 temperature data images at a subsection spatial scale level. This information will be given to citizens via an app named Wayfinder. This supplementary app will be provided with these background maps showing the typical extreme cold and hot surface temperatures in Porto and will allow the citizen to see where they are at a certain moment and decide their way to reach their destination.
2. Remote Sensing and GIS as Tools to Promote and Communicate Climate Risks Prevention and Adaptation
Climate studies of urban areas are a recent aspect of climatology that has increasingly been gaining importance since the significant contributions of [
19,
20,
21] over 40 years ago. Many modern studies have used remote sensing data to detect the thermal characteristics of urban surfaces. This technology provides detailed knowledge of the Earth’s surface and can identify heat sources in urban areas, the development of surface heat islands, and thermal differences between urban and rural areas [
22,
23,
24]. The information available started with the satellite Landsat 6, launched without success on the 5 October 1993, followed by Landsat 7, launched on the 15 April 1999 and working till now, and more recently with images from Landsat 8, initially called Landsat Data Continuity Mission, launched on the 11 February 2013 and working till now. Landsat 8 has two main sensors (operational land imager and thermal infrared), and delivers data recorded with thermal infrared sensors (bands 10 and 11). These sensors enable the apparent surface temperature of targets on earth to be established and facilitate the diagnosis of surface heat and cool islands with a spatial resolution of 30 m in the visible, NIR, and SWIR bands, and of 100 m in the thermal bands [
25]. The main advantage of using remote sensing to study surface heat islands is its ability to enable the visualization of temperatures over large areas, though it is only possible to obtain a panoramic view of the surface temperatures. Landsat becomes a useful tool to solve the lack of information on climatology at the micro scale.
Some impressive studies have used remote sensing data and detection techniques to identify risk areas, geological and geomorphological changes, urban growth, thermal comfort, land use, and land cover, as well as using thermal infrared remote sensing systems to document the effect of urban heat islands [
26,
27,
28,
29]. For instance, Amorim and Monteiro [
23] applied GIS to the mapping of surface temperature distribution patterns according to land cover and land use in the cities of Porto and Presidente Prudente, based on thermal satellite images, in order to understand their contribution to human thermal (dis)comfort, while Lemus-Canovas, Martin-Vide, Moreno-Garcia and Lopez-Bustins [
29] estimated the hot and cold daytime extreme locations within the metropolitan area of Barcelona using the terrestrial surface temperature Landsat 8.
Despite the wide variety of studies involving the use and application of satellite images to assess surface temperatures, investigations applying such mapping to the prevention of risk remain scarce. An exhaustive bibliographic research carried out in August 2020 about climate risks and warning systems explicitly addressed the issue of risk cartography in Web of Science, delivering more than 400 papers dedicated to this topic. However, none of them combine an integrated and local tailored approach to extreme thermal risks or simultaneously offer specific solutions to help common citizens choose the best option to protect themselves in time, and none took advantage of the potential given by satellite imagery to make the diagnosis at the urban subdivision spatial scale.
The awareness thereby created encouraged us to question the role of local mapping in making recommendations on risk preparedness [
30] through the provision of information, enabling citizens to find adequate answers for the risk situations to which they are exposed, whether they be extreme cold or extreme heat.
Our goal, in this exercise, is to explain the utility and simplicity of producing maps that really help people to make individual decisions when faced with extreme events. These types of products, as said before, will help human beings to evaluate their individual risk and decide the best way to protect themselves.
3. Materials and Methods
3.1. Description of the Study Area
The study area, the city of Porto, is the second most important city in Portugal, 41.42 km2 in area, with 263,131 inhabitants and a density of 5736 inhabitants/km2, being the centre of the Porto metropolitan area (INE, 2011).
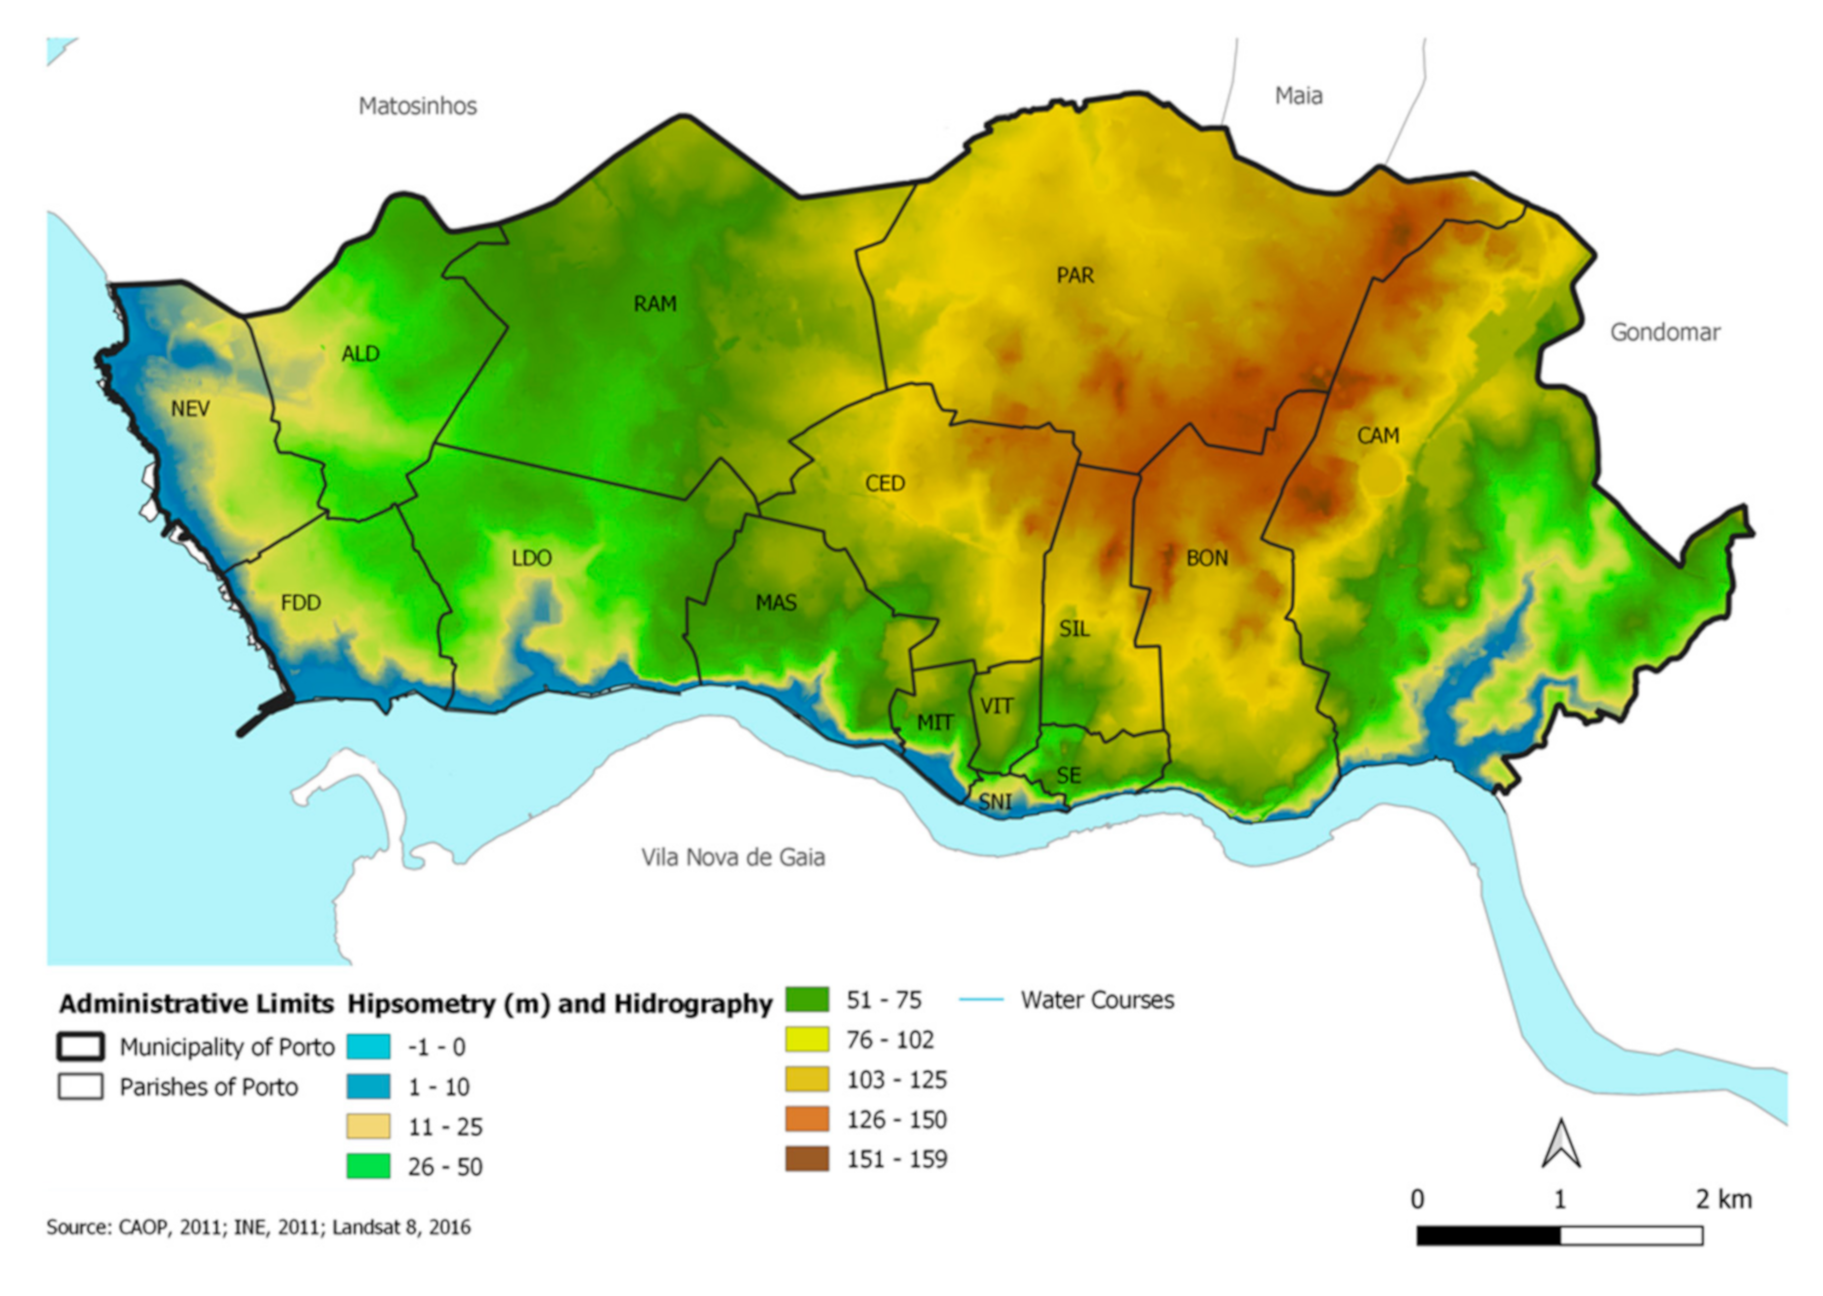
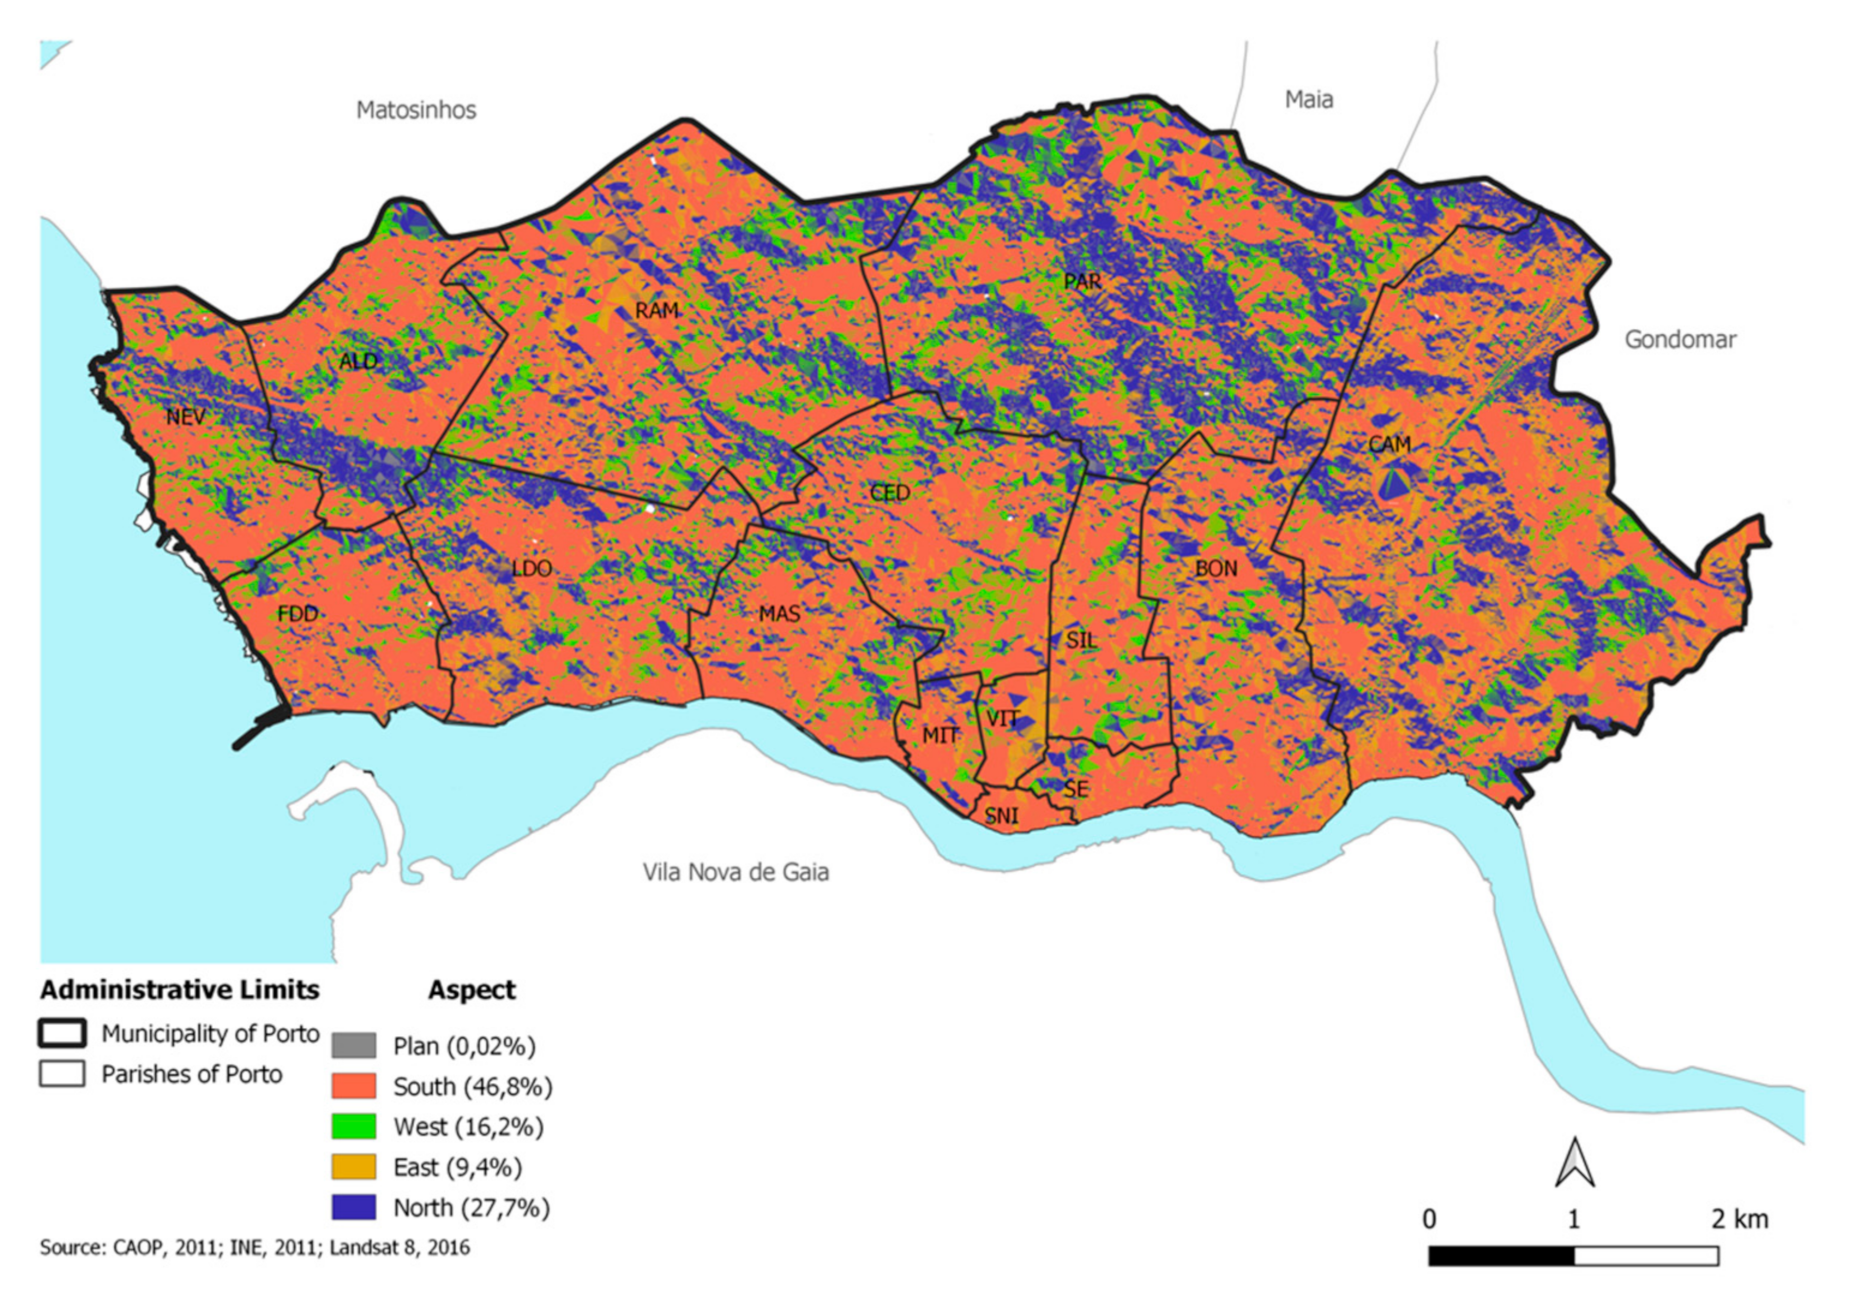
Porto has a temperate climate throughout the year due to its position on the Atlantic coast of Iberia (
Figure 1 and
Figure 2). The position in relation to the zonal flow from the west, after a long journey over the Atlantic; the latitudinal situation in the range of the polar and tropical air mass; the presence close to the anticyclonic barometric apparatus of the Azores; the proximity to the sea and the river; and the local topography together impose conditions of outdoor thermal discomfort, both due to cold and to heat, on most days of the year [
31].
In Greater Porto, mean monthly outdoor temperatures vary between 10 °C in January and December and 21 °C in July and August, mean minimum temperatures between 5 °C in January and December and 16 °C in July and August, and mean maxima between 14 °C in January and December and 26 °C in July and August. Precipitation occurs in all months of the year with a rainier period between October and February (150–180 mm average monthly total) and a drier period between July and August (20–30 mm average monthly total). The relative humidity is always very high (>70%). The average wind speed is, on average, 15–20 km/h (4.2–5.5 m/s) with predominant ESE winds all year round, except in the period from May to August when it is WNW. The proximity to the sea and the river explains the conditions of discomfort, even at night, during the summer season as a result of the combination of lower temperatures and high ventilation and humidity, as well as frequent advection fogs close to the ground and around the city, especially during late night and early mornings [
13].
Over the years, official meteorological station records show a secular climatological trend with very robust signs of seasonal disorganization with an increase in temperature; an increasing number of extreme heat and cold events; a change in the annual distribution of precipitation; and a higher frequency of paroxysmal episodes, both of precipitation (intense precipitation and drought), and the wind [
13].
In addition to observing trends of individual climatic elements in Porto, it is important to assess the bioclimatic comfort conditions for human beings who live or work in Greater Porto. It is necessary to combine all the climatic elements when considering the human beings’ profiles that are targeted by this momentary air envelope [
31].
It should also be noted that the magnitude of climatic risks results from both the weather at any particular time and the state of any exposed individual (physical, mental, social, cultural, socioeconomic, and perception) at that time [
31,
32]. Therefore, it is important to assess bioclimatic (dis)comfort as well as the climatic conditions. Each human being has the ability to adapt their body to the climatic context in which they live. However, their adaptability is not unlimited. It depends on their physical and psychological condition, and there are thresholds that, when exceeded, can cause severe health damage that can even lead to death.
The physiological equivalent temperature (PET) is one of the indicators being used internationally to measure the bioclimatic comfort of humans that takes into account the behaviour of a diverse range of climatic variables, but also specific characteristics of individuals, such as age, sex, height, weight, clothing, and diet [
31,
32].
Although not yet taken into account in Portugal by those responsible for issuing weather warnings and notices, these individual vulnerability characteristics are highly important, because the climatic risk depends substantially on the perception that each individual has of bioclimatic (dis)comfort and, consequently, of the valuation it attributes to the risk. This will certainly influence how individuals will respond to the risks.
In the case of Porto, a PET calculation was performed using the RayMan software provided by Andreas Matzarakis [
31,
33] in 2000 using the daily records of temperature, relative humidity, wind speed, and solar radiation from Porto–Pedras Rubras; the metabolic rate, in accordance with ISO 8896, at 165 W/m
2; and personal data relating to the height, weight, and age of men and women established according to ISO 8896 (
Figure 3).
It appears that in Porto, thermal comfort (PET) from 2002 to 2016 was predominantly uncomfortable throughout the year, with a more than 70% probability of quite inhospitable days outdoors (
Figure 3). It was only in April, May, and October that there were days that were mostly comfortable (30%). In the remaining months, thermal stress conditions prevailed, with days being cold to very cold between November and February and hot or very hot between June and September.
3.2. The New Methodological Approach—To Go or Not to Go
The methodological approach—to go or not to go—is based on the use and application of satellite images, and ultimately aims to inform citizens about the surface temperatures and the approximate real thermal environment experienced under the canopy layer. It involves in two main steps: (1) the acquisition of the Landsat 8, band 10 satellite image, corresponding to the thermal infrared/TIRS 1 channel band, with a spectral resolution of 10.6–11.19 μm and a spatial resolution of 100 m, treated and made available with a 30 m pixel by the USGS (United States Geological Survey) [
34]; and (2) the calculation of the average temperature in degrees Celsius in each statistical subsection using the ArcGis Zonal Statistics as Table tool.
The procedures for estimating temperatures, with atmospheric correction, in degrees Celsius (°C) is performed using Landsat 8 satellite images in ArcGis 10.4 software, adopting some fixed parameters for converting gray levels from the image to radiance afterwards for Kelvin temperature (based on Equations (1) and (2)), and lastly the transformation to degrees Celsius [
35].
Lλ: aperture sensor spectral radiance in watts, ML: multiplying band resizing factor 10 = 3.3420 × 10
−4, AL: band specific additive resizing factor 10 = 0.10000, Qcal: quantized pixel-calibrated value in DN = band image 10.
T: effective satellite temperature in Kelvin (K), K2: calibration constant 2 = 1.321.08 (K), KL: calibration constant 1 = 774.89 (K), Lλ: spectral radiance in watts.
To calculate heat/cold islands and to determine places as “go or not to go”, we calculated the average temperature in degrees Celsius in each statistical subsection using the ArcGis Zonal Statistics as Table tool.
Additionally, some vector information (in points) was added to the Porto city map in order to diagnose the potential protected areas. For this purpose, we considered as relevant: shopping malls, metro stations, primary care health centres, public and private hospitals, gardens and parks, and fountains. This information was acquired and geo-referenced through Google Earth Pro 7.3.
To analyse the temperature differences of the targets, images should be selected as representative of extreme conditions—rainy and cold season and hot and dry period—according to the US Geological Survey (thermal infrared sensor (TIRS), 11:22 am (local time)). Previous researches have shown the accuracy of radiance conversion into temperature, as well as the contribution of the surface temperatures, in estimating the nearby air temperatures [
36].
In the case of Porto, the most serious climatic risks are mainly due to heat and cold extremes, although the seasonal disorganization of rainfall is also a cause for concern. Thus, the images available for Porto provide ground temperatures for the area between 11:13 am and 11:19 am at 16-day intervals. As is well known, this is not the time of day when the effects of additional energy inputs on the climatic subsystems of urban spaces are most marked, and so the results obtained are likely to underestimate the contribution of the urban fabric of the city to the Porto energy balance. After analyzing more than 50 satellite images, we decided to use 2 satellite images in this exercise to prepare risk magnitude and useful recommendations: one of summer (14 July 2016) and another one of winter (5 December 2016). They were selected bearing in mind their seasonal weather representativeness over the Porto area in several criteria (temperature, wind speed and direction, humidity, weather type, etc.).
4. Results and Discussion
The results obtained indicate the places of higher climatic risks under the same weather conditions, as well as some of the potential places that people can use to protect themselves.
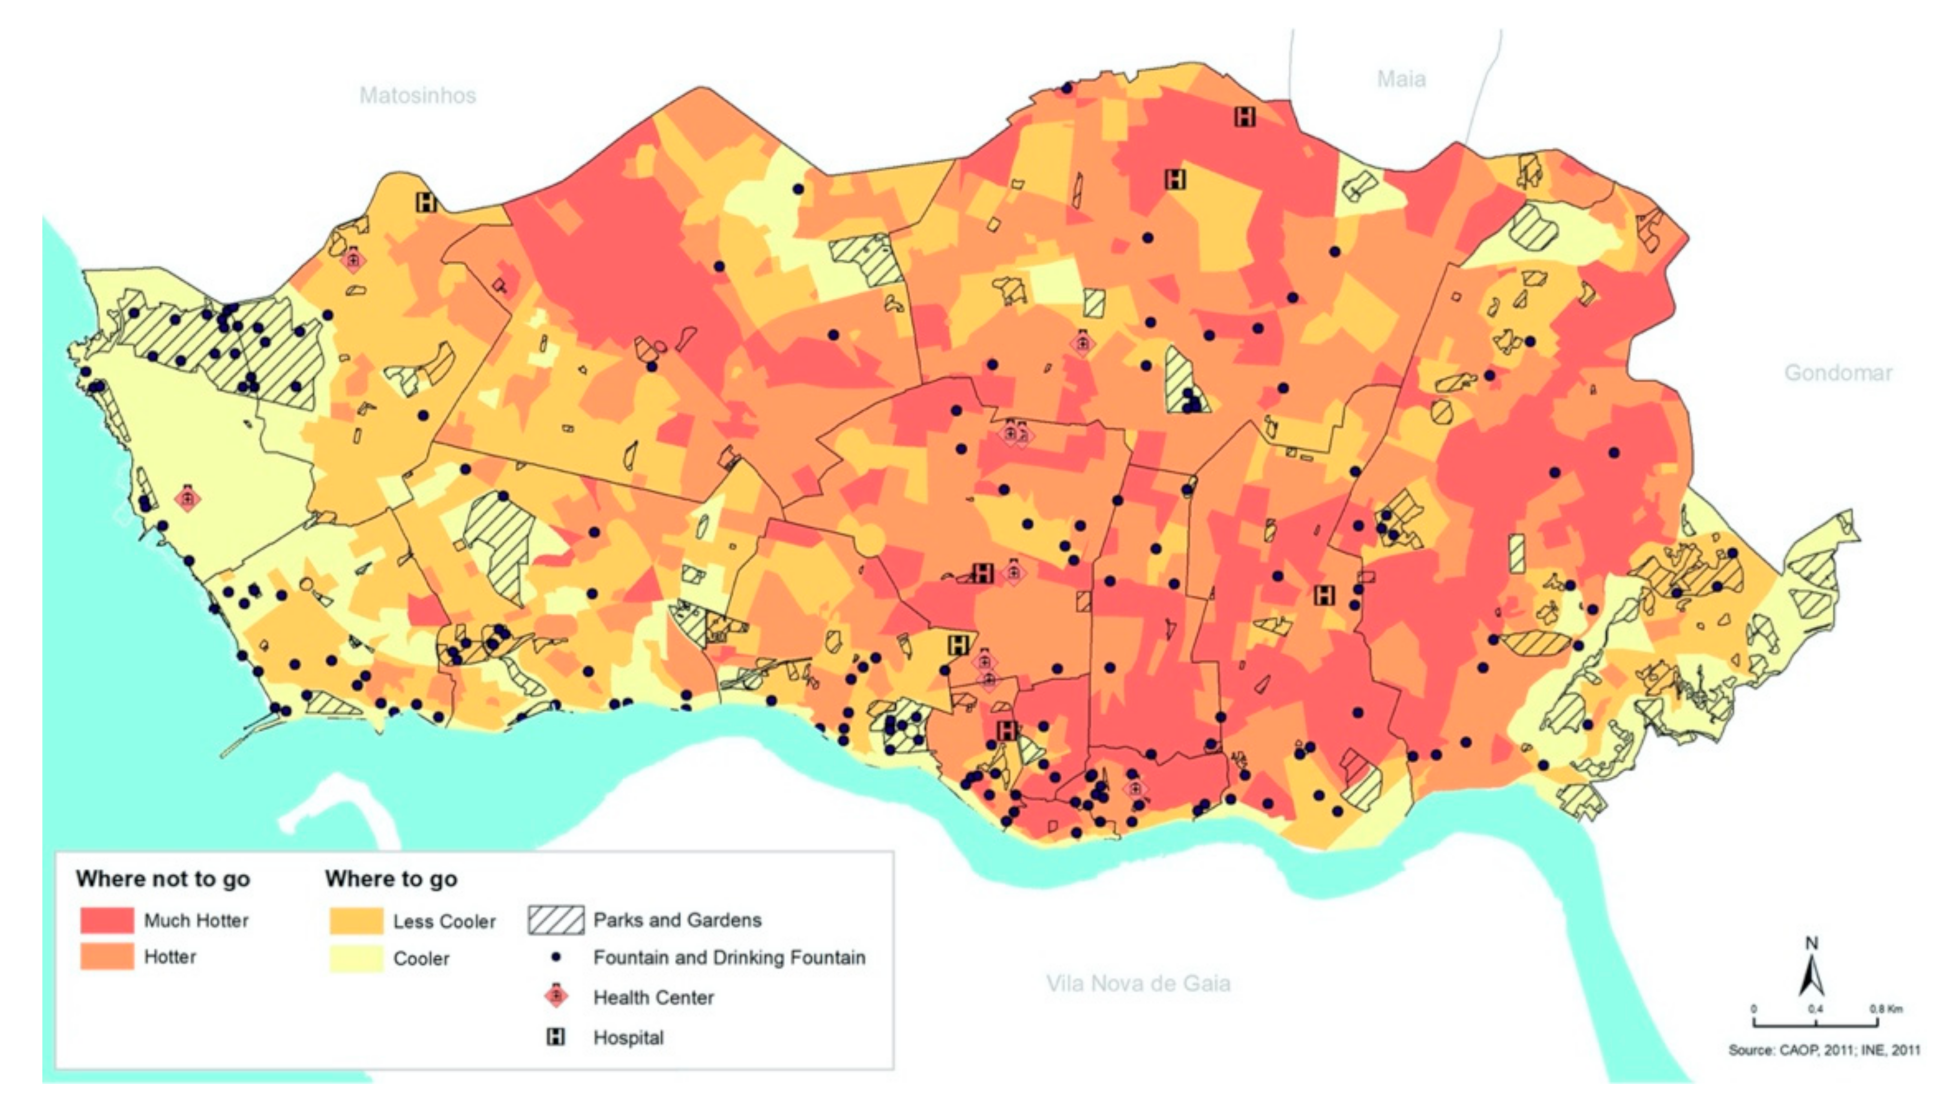
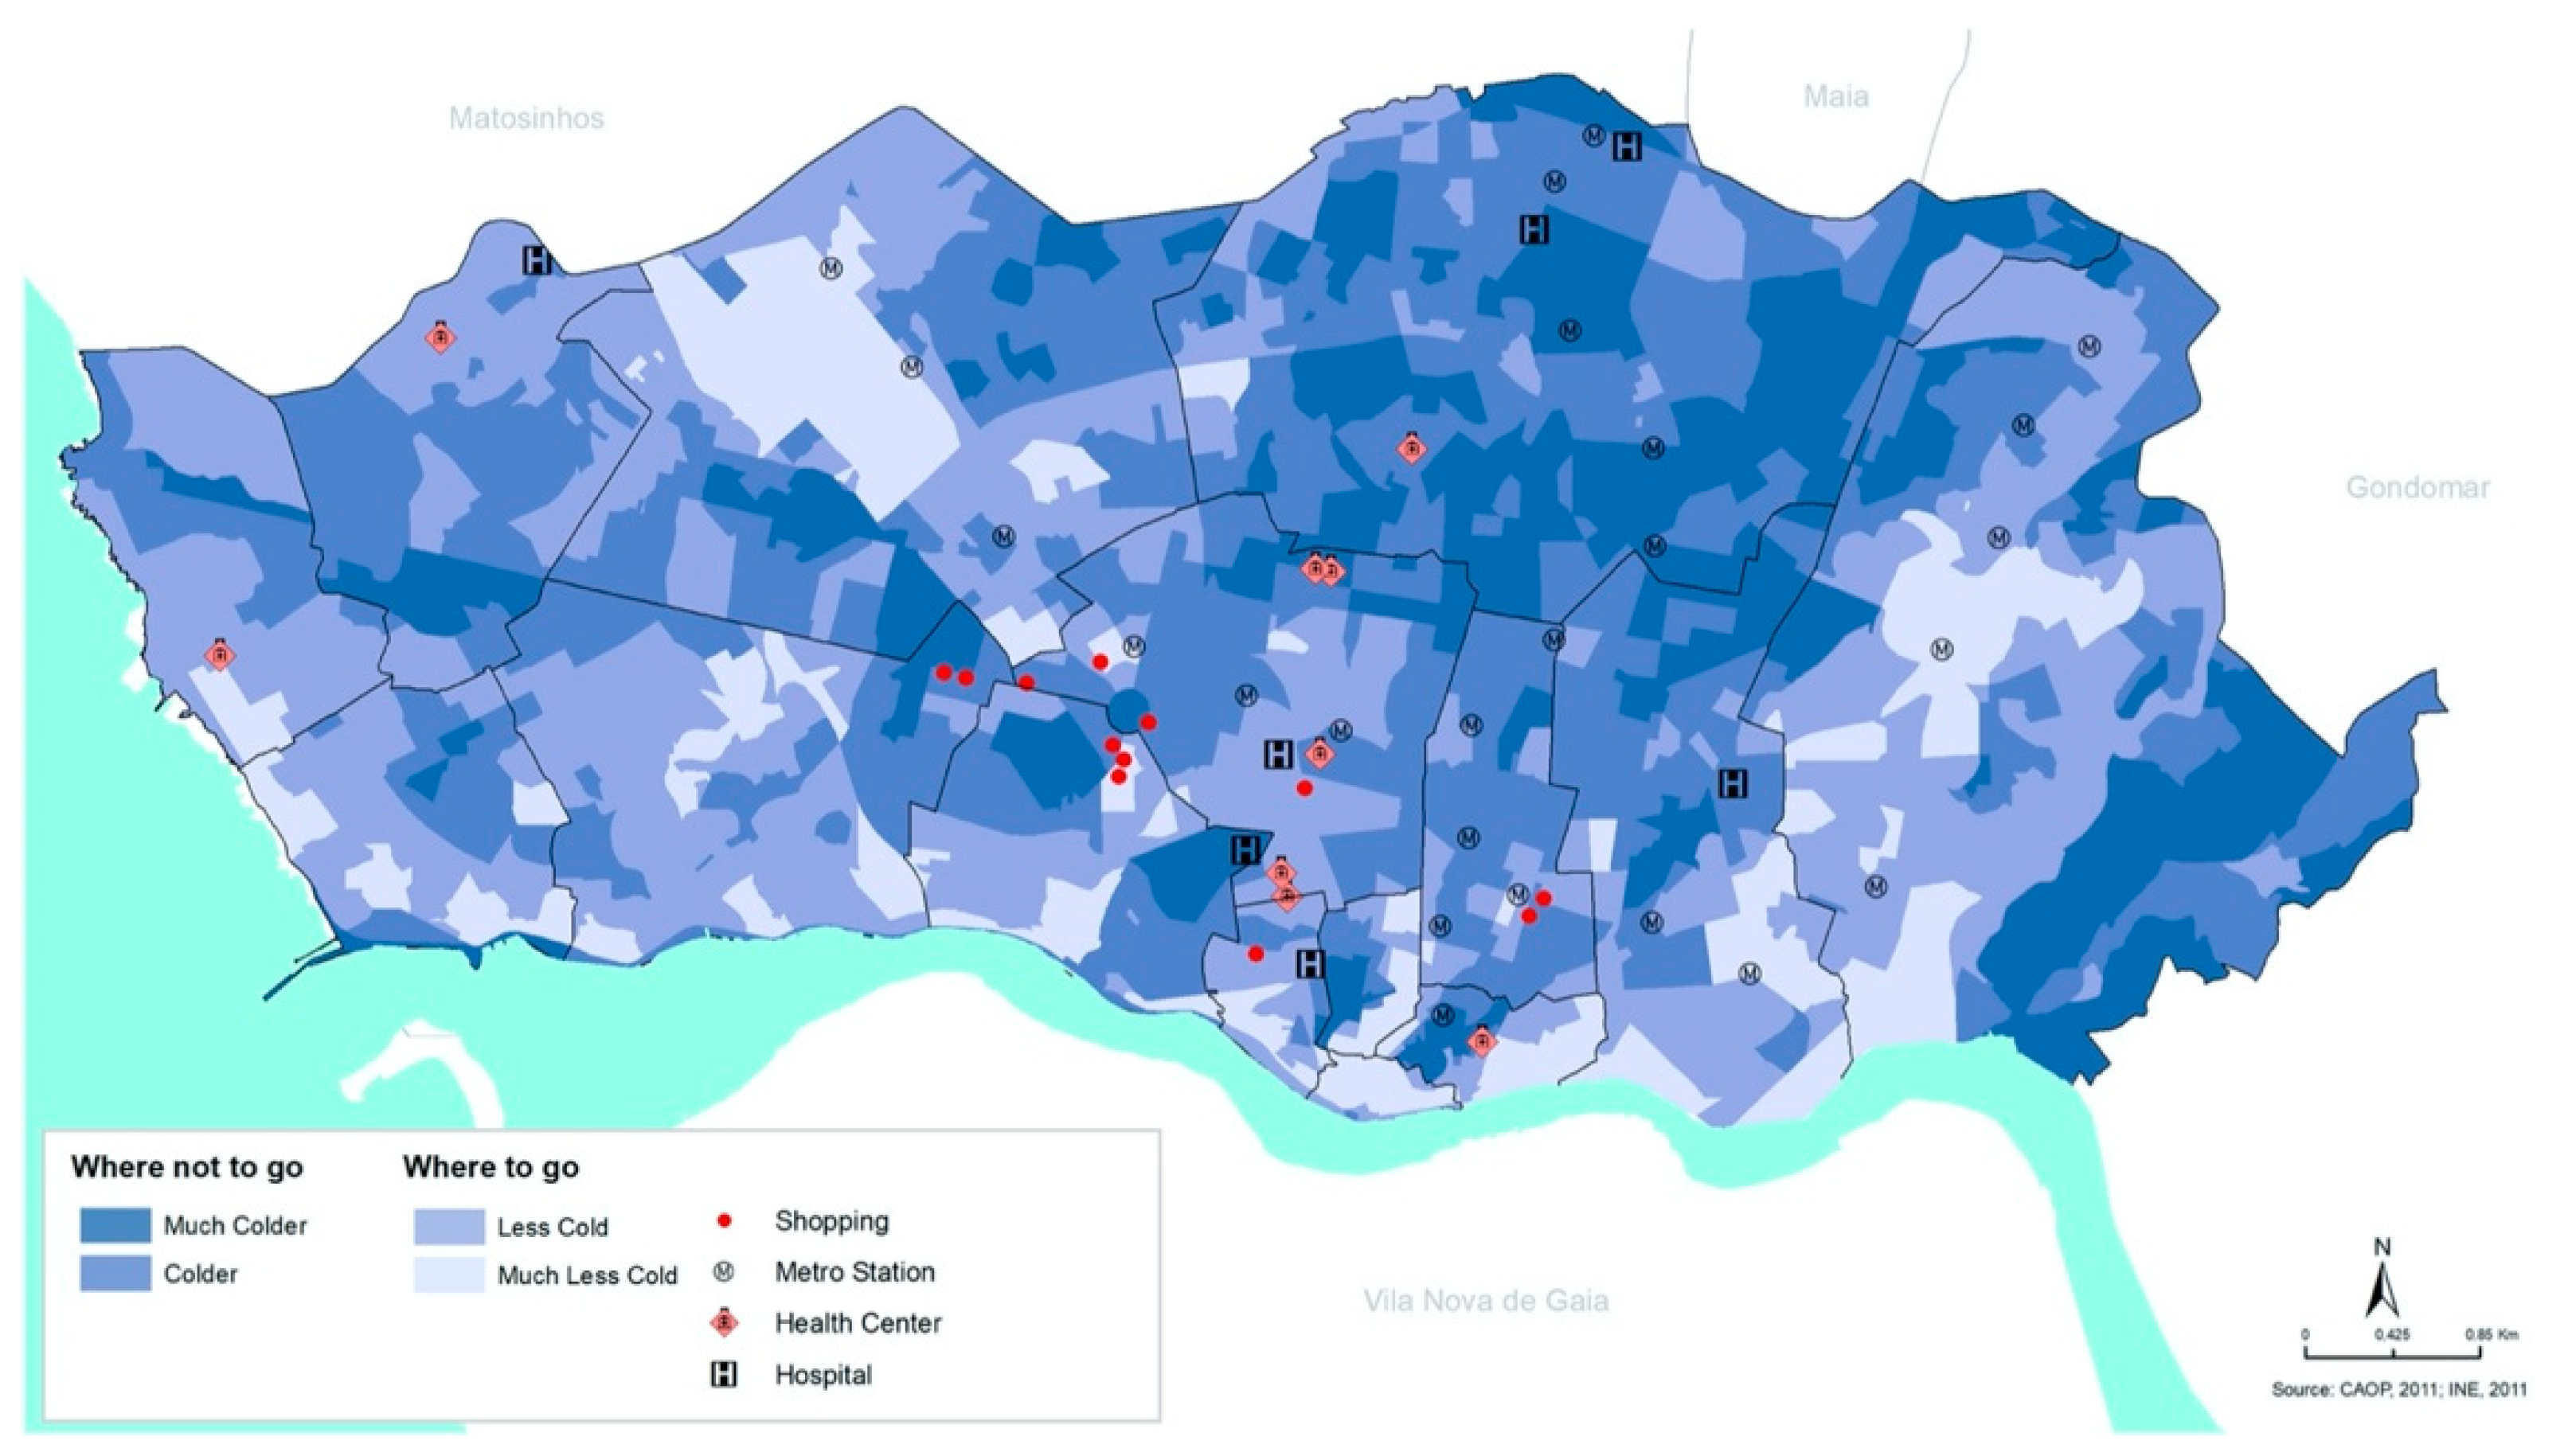
Figure 4 and
Figure 5 show, in Porto city, the areas considered to be the hottest and the coolest within the city of Porto on days of extremely high or low temperatures. These maps, if a person is able to put themself in place, simultaneously show the probable thermal (dis)comfort felt at that moment, where to go nearby to feel more comfortable, and also the location of available equipment and health care services.
In extreme heat events, the hottest areas correspond to the places to be avoided (“where not to go”). At the same time, we deliver information of the most suitable places to go to (“where to go”) in order to protect themselves. For example, during extremely high temperatures, we suggest that people should go to public parks and gardens, as well as to places close to fountains and drinking fountains distributed throughout the city. One of the most important recommendations is that citizens should drink plenty of water and protect themselves from the sun, looking for shady places as well as public or private hospitals or primary health care centers.
In extremely cold events, we map the coldest and mildest areas in Porto city and provide information about the places where people, particularly the most vulnerable (children, the elderly, and people with respiratory and circulatory diseases), should go (i.e., the “where to go” places) in order to protect themselves. Thus, we include in our maps the metro stations and shopping centres, as well as public or private hospitals or primary health care centers. The coldest areas are, thus, the places to avoid when walking around the city.
While the mapping option has been tried and tested in several other cities, so far, we have not found the combination of information that we provide in our Porto study. We emphasize that the average citizen needs information about the risk and about what they can do to avoid its impacts at the same time. The risk message alone is insufficient for prompting easy and fast individual decisions, even when people are fully familiar with their locality. Thus, these maps provide information on the places where people should or should not go during extreme weather events (e.g., a heat wave, cold wave, strong winds, marine storm surges, and/or intense precipitation). In fact, climate risks can only be dealt with by three approaches: risk management, mitigation, or adaptation [
15,
35,
37,
38,
39,
40,
41,
42,
43]. In the first and second cases, we need to implement actions that reduce all types of risks related to climate change in regard to the diversity of people and place combinations in each neighbourhood. In the third option, adaptation can reduce the impacts of danger and exposure if we properly and accurately anticipate the vulnerability of the targets.
Although the findings of this study provide insights into new methodological approaches aiming to minimize the climatic risks and give people information to decide on how to select the best places to walk around the city and thus protect themselves, some limitations should be pointed out. The Landsat 8 satellite has a revisit cycle of 16 days and a visit time of 11:22 a.m. (local time), which limits the direct applicability of the proposed method. This limitation might be overcome, for instance, by previous detailed knowledge of typical weather types in a certain local area, as we did before choosing the two thermal extreme days. Moreover, Landsat 8 satellite data may sometimes be unusable due to too much cloud cover. This limitation is somewhat mitigated on extremely cold days, as they happened under stable atmospheric conditions. However, it is not possible to solve this gap on extremely hot days when humidity increases the bioclimatic discomfort. Despite these limitations, this resource, free of charge, has been widely used as a source of information in the identification of anthropic impacts in climatic subsystems, especially in the urban ones, as it is witnessed by Wulder, et al. [
44] and Chen, et al. [
45].
5. Conclusions and Potential Outcomes
This work demonstrates the value of mapping climatic factors using the information provided by Landsat 8 satellite images and profiting from the tools of Geographical Information Systems to make detailed estimates of surface temperatures at a local scale (e.g., Porto city), and deliver tailored and accurate maps with the places suitable for alleviating bioclimatic stresses and the ones that should be avoided.
Nowadays, there is extraordinary concern for adaptation to climate change, namely to extreme temperatures and air pollution, among policy makers; economists; public health actors; climatologists; planners; the media; people in general; and, naturally, scientists. Although these diverse groups need to come together to solve problems, their wide-ranging and miscellaneous group backgrounds make conceptual strengthening and consolidation difficult. This is of particular concern as the timelines of research and action are very different and many questions remain unanswered.
In the present study we follow the idea that, “in human systems, the process of adjustment to actual or expected climate and its effects, in order to moderate harm or exploit beneficial opportunities. In natural systems, the process of adjustment to actual climate and its effects; human intervention may facilitate adjustment to expected climate and its effects” [
46], and as Biagini, et al. [
47] summarize, adaptation strategies can range in timing relative to stimulus (anticipatory, concurrent, reactive), intent (autonomous—without coordinated planning from individuals or communities and usually reactive, planned—usually involving deliberate policy actions that are based on anticipated climate risks), spatial scope (local, regional, national), form (e.g., technological, behavioural, financial, institutional), and degree of necessary change (incremental, transformational). These issues were the focus of our technique: create stimulus to facilitate autonomous decisions in a moment of crisis. We also sought to provide useful information to decision makers and urban planners in order to offer a wide range of adaptation strategies and measures suitable for the increased awareness of temperature extremes and their impact on wellbeing and public health (mortality and morbidity).
The urban planners’ actions and measures for increasing heat and cool preparedness and response during extreme episodes should include much more than “ready-to-use” policy actions, plans, health warning systems, or educational programs. Moreover, due to the close interconnections between temperature patterns and built environment characteristics, the answers should bear in mind the puzzle of different people and places, and involve as many actors as possible [
48]. Urban planning and design in Porto should take advantage of this timely warning in order to take innovative steps towards adapting the city to cope with the serious risks triggered by climate change. The geography of existing thermal comfort illustrates well the attenuating or amplifying effect of the urban design choices made for this territory.
Finally, in the context of the Citizen Sensing Project, further research is being developed regarding the integration of these temperature maps into a mobile application through a Wayfinder approach. This way, users of the app will be able to walk round the city of Porto with information on the gradients of surface temperatures under extreme conditions. They will be able to decide on where they should go, and the urban spaces they should avoid. The feedback of these users will be of upmost interest, and hopefully prove the relevance and usefulness of our method.


