Review

Rainfall: Features and Variations over Saudi Arabia, A Review

Center of Excellence for Climate Change Research, Deptment of Meteorology, King Abdulaziz University, P. O. Box 80208, Jeddah 21589, Saudi Arabia
*
Author to whom correspondence should be addressed.
Climate 2015, 3(3), 578-626; https://doi.org/10.3390/cli3030578
Submission received: 29 May 2015 / Accepted: 31 July 2015 / Published: 12 August 2015

Abstract

:
The Saudi Arabia (SA) climate varies greatly, depending on the geography and the season. According to Köppen and Geiger, the climates of SA is “desert climate”. The analysis of the seasonal rainfall detects that spring and winter seasons have the highestrainfall incidence, respectively. Through the summer,small quantities of precipitation are observed, while autumn received more precipitation more than summer season considering the total annual rainfall. In all seasons, the SW area receives rainfall, with a maximum in spring, whereas in the summer season, the NE and NW areas receive very little quantities of precipitation. The Rub Al-Khali (the SE region) is almost totally dry. The maximum amount of annual rainfall does not always happen at the highest elevation. Therefore, the elevation is not the only factor in rainfall distribution.A great inter-annual change in the rainfall over the SA for the period (1978–2009) is observed. In addition, in the same period, a linear decreasing trend is found in the observed rainfall, whilst in the recent past (1994–2009) a statistically significant negative trend is observed. In the Southern part of the Arabian Peninsula (AP) and along the coast of the Red Sea, it is interesting to note that rainfall increased, whilst it decreased over most areas of SA during the 2000–2009 decade, compared to 1980–1989.Statistical and numerical models are used to predict rainfall over Saudi Arabia (SA). The statistical models based on stochastic models of ARIMA and numerical models based on Providing Regional Climates for Impact Studies of Hadley Centre (PRECIS). Climate and its qualitative character and quantified range of possible future changes are investigated. The annual total rainfall decreases in most regions of the SA and only increases in the south. The summertime precipitation will be the highest between other seasons over the southern, the southwestern provinces and Asir mountains, while the wintertime rainfall will remain the lowest.The climate in the SA is instructed by the El Niño Southern Oscillation (ENSO) and other circulations such as centers of high and low pressure, the North Atlantic Oscillation (NAO) and SOI. Strength and oscillation of subtropical jet stream play a big role in pulling hot, dry air masses of SA.

1. Introduction

Scientific knowledge and literature relating to the climate and climate change of the SA is scattered, incomplete and limited. In spite of the fact that the Mediterranean and neighboring areas have been extensively explored throughout the last few decades [1,2,3,4], the SA region has received little attention. Brief and sound climatological information on the Arabian Peninsula (AP) was provided by [5,6,7], and they demonstrate that there is a wide climatic spectrum on the AP, from the snows of the Asir Province in SA to the over powering humidity of the Arabian Gulf, from the searing heat of the Rub Al Khali to the monsoon precipitation in the Qara mountains in Dhofar. SA is characterized by a complex topographical surface and covers vast areas (approximately 2,250,000 km2), occupying nearly eighty percent of the AP. SA stretches from 15.5°N to 32.5°N in latitude and from 32°E to 55°E in longitude (Figure 1). The Rub Al-Khali (Empty Quarter) is situated in the eastern and southeastern regions of SA, and is the largest continuous expanse of sand desert in the world.
Figure 1. Names and locations of Saudi Arabia stations [8].
Climate 03 00578 g001
The country is characterized by distinct climatic regions, due to high spatial and temporal temperature variability. According to the Köppen classification the major parts of SA are hot and dry [9], where precipitation is infrequent and temperature is high [10,11]. On the other hand, the southwestern area of the SA is classified as semi-arid [9]. Irregular, heavy rainstorms happen on only a few days in a year and only in some areas of the SA. Therefore, the SA is considered one of the driest countries in the world. With the exclusion of the southwestern coast, the SA climate is described by extreme heat throughout the day, a sudden fall in temperature at night, and little, irregular precipitation. The aridity index classifies the study region as having desert conditions and a water deficit except the mountainous regions, which can be described as semiarid [12]. For a better understanding of the climates of SA, Aurhors in [10,13] used a multivariate technique. The southwestern region of SA is studied by [14,15]. They discussed the aridness of the region and the rainy seasons. The southwestern area is described by having precipitation during the year, wherever the geography increases local convective precipitation [15,16].
The precipitation in most areas of the SA is scarce, infrequent, and generally falling from October through April [17]. Throughout other months, there is almost no precipitation with the exception of thesouthwestern region of Saudi Arabia [18]. The spatial variation of the precipitation in the southwestern region is high due to mountainous regions. The southwestern region of SA is characterized by rainfall events during the entire year due to the topographically driven convective rain [14,16]. The annual total precipitation in the north of this region, mainly in Jeddah (21.71°N, 39.18°E), ranges from50 to 100 mm, happening principally through the wintertime. In this semi-arid region, only a few precipitation events are sufficient to produce this amount [9].
The prediction and description of precipitation variability in time and/or space are primary requirements for a wide variety of water project designs and human activities. The climate of the Arabian Peninsula represents an issue of particular concern within the context of regional climate change and variability.
Regional and local climate is affected by both surface featuresand large-scale atmospheric circulation. Furthermore, atmospheric circulation changes and fluctuations are important aspects of the climate. Regional and local variations or changes in the character of rainfall depend a great deal on atmospheric circulation patterns determined by the North Atlantic Oscillation (NAO), El Niño Southern Oscillation (ENSO), and other patterns of variability. A shift in the rainstorm track creates some regions wetter and some drier is associated with the changes in the atmospheric circulation patterns.
In this paper, we review the rainfall variability and mechanisms over SA as derived from the historical literature and summarize the scientific contributions to the subject. The climatology of rainfall on a seasonal and annual basis is presented in Section 2 before embarking on the study of the variability of the rainfall (Section 3). Two different variability aspects are discussed; the variability with altitude, and the variability with the region in Section 3.2 and Section 3.3, respectively. Moreover, after review of the rainfall variability over SA, one needs to know in the future, is the rainfall going to increase or decrease?Thus, a review of the rainfall prediction is presented in Section 4. The rainfall mechanisms over SA occupy the important part of this work. The influence of the large scale circulation patterns such as ENSO and NAO is reviewed in Section 5, and the effect of the surface pressure system, including the Subtropical and Siberian high pressure systems. The Icelandic and Sudan lows are also reviewed. The role of the jet streams on the surface, cyclogenesis, and rainfall is discussed in Section 5.4. The conclusion is presented in Section 6.

2. Seasonal and Annual Rainfall Climatology

The seasonal distribution is shown as the proportion of the annual precipitation that falls in each of the four seasons. This distribution is clarified by the prevalence of one or another weather classification at different times of the year. The wintertime precipitation pattern is influenced throughout North Africa, Europe, West Asia, and Central Asia. Springtime precipitation mainly linked to the westerly systems for the central landmass of the AP. Indian monsoons affect the area in summer season with peaks in the highlands of Yemen and the Dhofar region in southern Oman. Except in the northern Red Sea coast area, autumn does not contribute much precipitation.
Usually, during the wet season, a great quantity of precipitation is found on the northern rim of the AP and through the dry season above the southern regions; a result obtained depended on the short-term climatology of precipitation from the TRMM dataset throughout the period from 1998 to 2009 [19]. Over the southwestern area of SA, the seasonal rainfall distribution is limited as described by [16]. Due to topographically-driven convective events, rainfall in southwestern SA is described by rain episodes during the entire year [14,16]. However, Authors in [20] studied the seasonal precipitation pattern for the AP using long term datasets in detail (CMAP and CRU gridded datasets).
The wet season rainfall patterns obtained from observed data sets averaged over the period from 1979 to 2009, CMAP, and the CRU are displayed in Figure 2. To avoid any interpolation, the observed dataset for each station location is displayed (Figure 2c). Two belts of heavy-rain in the AP region are shown in Figure 2a.The first occurs above 30°N in the north and the second exists below 15°N in the south. A northern belt tongue extends from central SA into the northern Arabian Gulf. Moreover, a similar southern tongue extends from western and central SA into Ethiopia/Eritrea. In addition, from Figure 2a, one can clearly see two light rain areas. The first is above the Rub Al-Khali while the other is above Egypt and its surroundings, extending to northwestern SA. Similarly, from Figure 2b, one can also see heavy-rain belts in the data of CRU. Conversely, the southern belt is narrower. The light rain area is also very clear above the Rub Al-Khali in the CRU dataset. Inside SA, the relatively heavy precipitation regions are along the southwestern coast and the SW to NE inclined precipitation band, which passes above the middle region of the SA. The station datasets (Figure 2c) verify the relatively higher quantities over the southwestern coast and in the middle of the SA and the low precipitation quantities in the NW region. For the wet season, the maximum observed precipitation is 144.8 mm was recorded at Abha station in the southwestern region (Table 1). There are no stations in the southeastern region. On the other hand, the station adjacent to that area indicates a small quantity of precipitation. Authors in [21] explains that Sudan low, as well as the Mediterranean climate conditions, impact the wet season precipitation climatology of SA, which increases the precipitation.
Figure 3 displays the dry season precipitation averaged over the period from 1979 to 2009. The dataset of CMAP (Figure 3a) explains no precipitation over the major areas of Egypt and an east to west dry zone (precipitation 20 mm) among 20°N and 33°N. The dry region is also obviously noticeable in the dataset of CRU (Figure 3b). Both of the CRU and CMAP datasets illustrate small precipitation over SA, except in the southwestern coastal region. The observed dataset (Figure 3c) gives a like situation. The open circles represent precipitation below 1 mm throughout the dry season (Figure 3c). Hence, the Sudan low and the Indian monsoon impact the dry season precipitation over SA. Weather situations of the Mediterranean do not affect the dry season precipitation of the SA [21] due to the precipitation changes significantly in time and space [18,22]. Because of high resolution, the TRMM dataset is more reliable in terms of obtaining the precipitation climatology.
Table 1. The surface observation station information and the corresponding rainfall amounts (mm) over Saudi Arabia during the period 1979–2009. The wet season is November to April and the dry season is June to September. In the first column, the asterisk (*) after the station name indicates that the dataset is available from 1985. The last row provides the national average rainfall values averaged over all the stations [19].
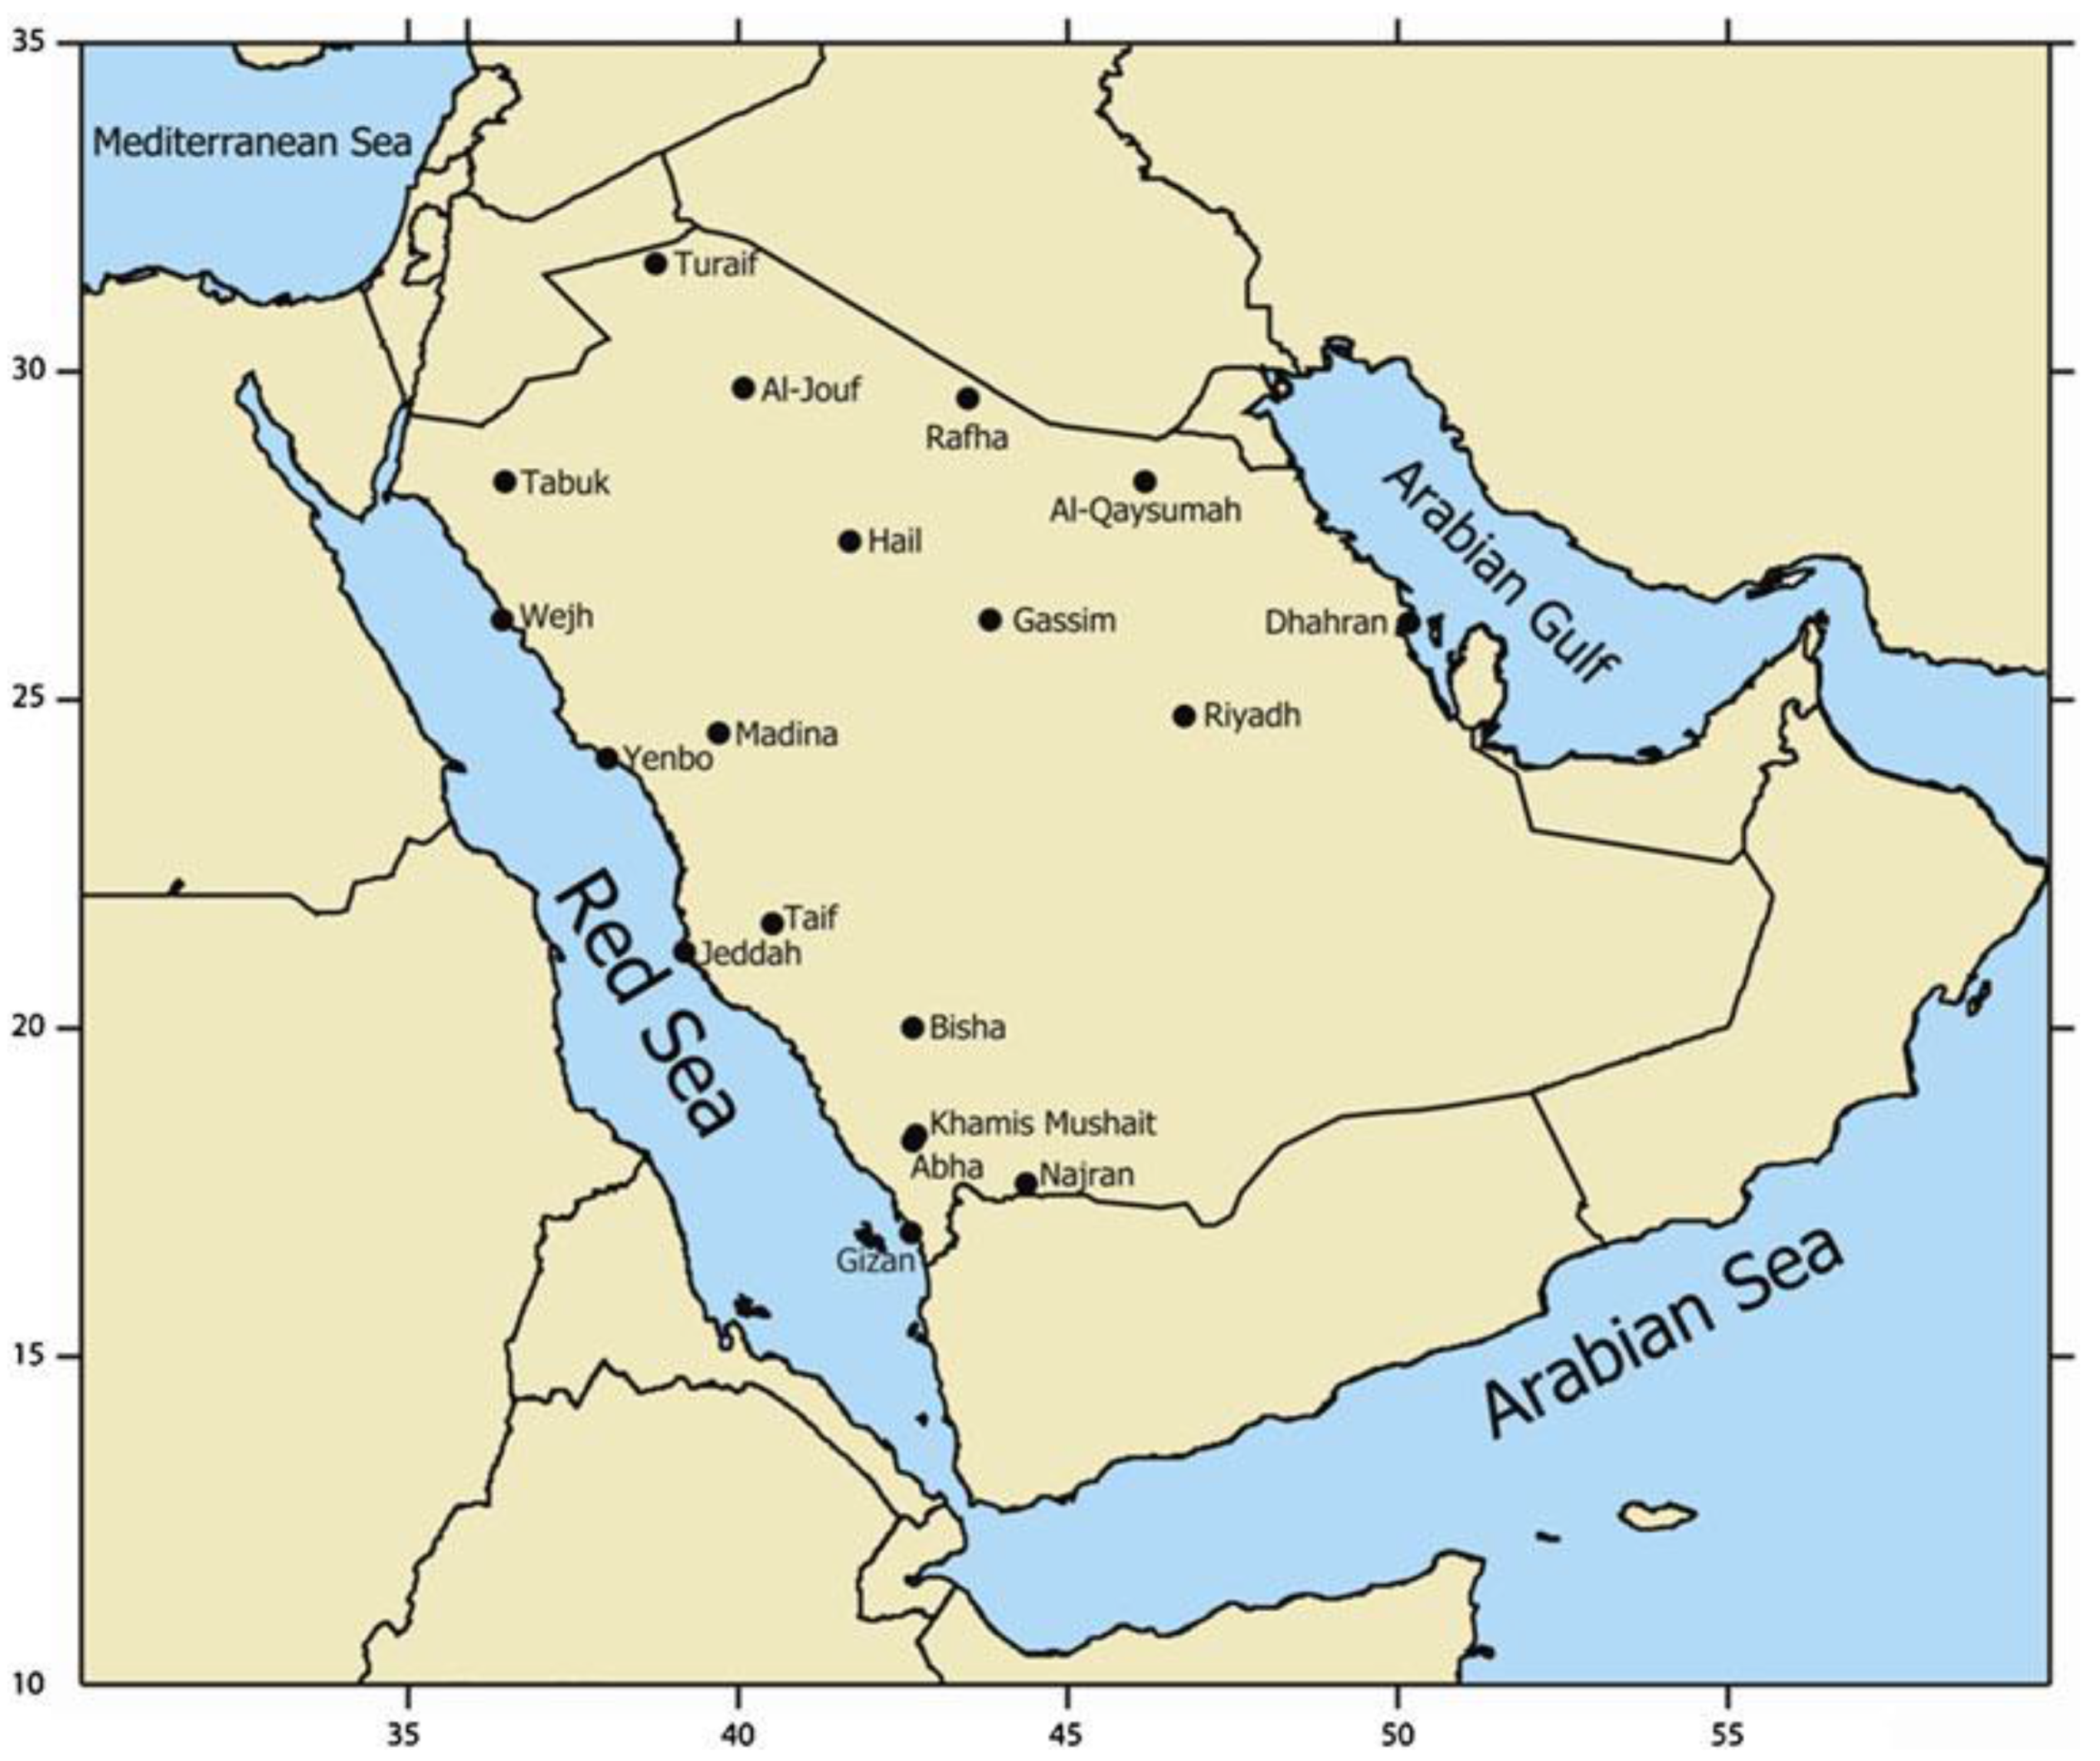
Station Information Rainfall (mm)
Station NameLat (°N)Long (°E)Altitude (m)AnnualWet SeasonDry Season
Turaif31.6838.7385285.573.90.4
Guriat31.4037.2850446.740.50.1
Arar30.9041.1455058.651.10.1
Al-Jouf29.7840.1067056.445.90.9
Rafha29.6243.4944586.975.90.1
Tabuk28.3736.6077029.320.71.0
Hail27.4441.691000116.495.30.5
Wejh26.2036.472025.324.10.1
Gassim26.3043.77648145.6125.60.3
Madina24.5439.7063064.749.84.5
Yenbo24.1438.06831.024.90.1
Al-Qaysumah28.3346.12360126.5115.10.3
Dhahran26.2650.162292.589.80.0
Al-Ahsa25.3049.4918084.879.80.8
Riyadh New24.9246.72612110.6104.60.0
Riyadh Old24.7146.7361088.981.20.3
Jeddah21.7139.181851.247.80.5
Makkah21.4339.79273110.681.611.5
Taif21.4840.551455174.687.231.7
Al-Baha20.2941.641655142.679.429.8
Bisha19.9942.61116788.562.46.6
Wadi-Aldawasser20.3045.1261726.124.22.8
Abha18.2342.662100230.3144.850.3
Khamis-Mushait18.2942.802047189.385.167.0
Najran17.6144.41121360.136.813.1
Sharurah17.4747.1272770.343.020.4
Gizan16.9042.584131.866.740.5
Country normal 93.566.810.6
Figure 2. Spatial distribution of the wet season rainfall (mm) averaged for the period 1979–2009 obtained from the (a) CMAP; (b) CRU; and (c) station datasets [19].
Climate 03 00578 g002
Figure 4 displays the wet season precipitation pattern over the period from 1998 to 2009 gained from the measurement, CMAP, CRU, and TRMM datasets. For the same duration, authors in [18] used the TRMM dataset. Like the pattern of precipitation climatology for the period from 1979 to 2009 discussed earlier (see Figure 2), there are again two light precipitation areas in the CMAP (Figure 4a), CRU (Figure 4b) and TRMM (Figure 4c) datasets throughout the period from 1998 to 2009 over the AP. The first is above the Egypt prolongation to northwestern SA and the second is over the Rub Al-Khali. A relatively heavy precipitation zone from southwest to northeast across SA is observed. A heavy rain belt above 28°–30°N remains the same over the northern part of AP. On the other hand, the southern rain belt of AP is shifted to the south and it is situated below 10°N. A similar pattern of wet season precipitation gained from the stations dataset (Figure 4d). For both the CRU and CMAP datasets, the spatial pattern of precipitation over SA is more or less similar to that obtained for the period 1979–2009 (see Figure 2). This means that the gained precipitation pattern persisted throughout the wet season in this area, but the quantities might vary due to the varying lengths of the analysis period.
Figure 3. Spatial distribution of the dry season rainfall (mm) averaged for the period 1979–2009 obtained from the (a) CMAP, (b) CRU, and (c) station datasets. In panel (c), the open circles indicate rainfall amounts less than 1 mm [19].
Climate 03 00578 g003
Figure 5 represents the dry season precipitation short-term climatology averaged above the period from 1998 to 2009. In this season, as discussed earlier (see Figure 3a), there is no rain belt that extends up to the Arabian Gulf for CMAP (Figure 5a), and a similar pattern in the data of TRMM (Figure 5c). The heavy precipitation band in the southern AP remains the same for the period from 1979 to 2009 as obtained earlier. In the southeastern coastal region, the relatively heavy rain is a unique feature, as gained from the TRMM, CRU, CMAP and observed datasets, and suitable with the long-term CRU, CMAP and observed datasets. This reveals that irrespective of the length of the analysis period. Consequently, one concluded that the present precipitation distribution pattern for the dry and wet seasons represent the precipitation climatology of the SA.From Figure 2, Figure 3, Figure 4 and Figure 5, one can notice that the CRU dataset over SA is approximately equal to the measurement station data. However, due to TRMM's high resolution and CMAP’s coarse resolution, the TRMM dataset is better than CMAP, compared with the measurement data. The mean annual precipitation for the AP gained from the CMAP, CRU and observed datasets for the period from 1979 to 2009 is analyzed by [20]. The rainfall is also low (under 60 mm) over the world’s greatest sand desert (Rub Al-Khali).
Figure 4. Spatial distribution of the wet season rainfall (mm) averaged over the period 1998–2009 obtained from the (a) CMAP; (b) CRU; (c) TRMM; and (d) station datasets [19].
Climate 03 00578 g004
On an annual basis, the presence of the subtropical high pressure contributes to decreasing the precipitation quantities between 15° and 30°N. However, in the middle-to-north of SA, a moderately heavy precipitation (80–150 mm) area is found and in the extreme southwestern corner of the AP (i.e., in Yemen) that extends up to southwestern SA and may extend into southern Oman heavier precipitation (> 150 mm) is evident. Heavy rainfall results in the southwest of SA are harmonizing with the obtainable information (e.g., [14,15]). Similar to the period 1979–2009 discussed earlier, the short-term annual precipitation climatology over the AP for the period from 1998 to 2009 (Figure 6) explained that heavy mean annual rainfall (>150 mm) occurred periodically over the southwestern area of the AP, which contains the SW of SA, while in the central parts of SA moderate heavy precipitation (80–150 mm) is also noticeable. In this short-term climatology, the dry (0–40 mm) and moderately dry (40–80 mm) zones to the west of the AP and over the Rub Al-Khali are also obvious. For both short-term and long-term mean annual precipitation climatology, the moderately dry region over the Rub Al-Khali, with a moderately wet region over the southwest of the SA is found. Authors in [20] concluded that the Rub Al-Khali, the southeastern region of the AP, received the lowest annual rainfall throughout the period (1979–2009) while the SW region of the AP received the highest annual precipitation throughout the same period.
Figure 5. Spatial distribution of the dry season rainfall (mm) averaged over the period 1998–2009obtained from the (a) CMAP; (b) CRU; (c) TRMM; and (d) station datasets. In panel (d), the open circles indicate rainfall amounts less than 1 mm [19].
Climate 03 00578 g005
Figure 6. The spatial distribution of the mean annual rainfall (mm) obtained from the (a) CMAP; (b) CRU; (c) TRMM; and (d) observed datasets, averaged over 1998–2009 [20].
Climate 03 00578 g006

3. Climate Changein Rainfall over Saudi Arabia

The definition of climate change is any change in climate over time, as a result of human activity or as the natural variability [23]. Increases in concentrations of greenhouse gas, mostly owing to human activity, are causing the Earth’s surface to warm. Particularly, atmospheric concentrations of CO2, have increased to levels that are higher than previously as seen in reliable recorded history. Global warming influences will likely include increases of surface and ocean temperature, glacial melt, sea level rise, and more extreme weather events, such as floods, droughts and less rainfall in some regions, including in the SA, with greater desertification.
Simulations of the climate model propose that anthropogenic influences (greenhouse gas increases together with aerosol increases) could cause a noteworthy climatic change in this region through the next century. Temperature increases throughout all seasons, and shifting rainfall patterns are likely, though their exact nature is far from certain [24]. Changes of temperature and precipitation have been noted at many locations of the SA. The nature of individual rainstorms is such that they are often of limited spatial extent with substantial gradients in strength and quantity. This suggests that in big areas in the middle of a “rainy season”, the distribution in reality might be one of intense rains unglued by dry conditions or light falls [25].

3.1. Seasonal and Annual Rainfall Variations

The area of Asir is subject to Indian monsoons, ordinarily happening among October and March [26]. During this period, an average of 300 millimeters of precipitation occurs, approximately 60% of the annual total. Additionally, condensation caused by the slopes of higher mountain participates to the total rainfall in Asir and the southern Hijaz. Precipitation is low and erratic for the rest of the country. Despite the fact that the normal precipitation is 79 mm/year [27], entire areas of the country may not experience precipitation for numerous years. When such droughts happen, like they did in the north in the year 1957 and 1958, influenced regions may become unable to sustain either livestock or agriculture.
Authors in [28] investigated wintertime rainfall in the central coastal lowlands of SA. They are situated on the Gulf coast in the SA north in Jubail City. The area is featured by a Mediterranean climate regime displaying a dry and hot summertime season and a cooler wintertime with precipitation. The study of regional climate data depended on the observations of three weather stations throughout three wintertime periods. For more study GMS 5 (col) IR and MET5/7 IR satellite images were used to locate tracks of cyclones and cloud formations. Four different types of rainfall happened throughout the observation period: (1) depressions from the Mediterranean Sea; (2) the formation of new cyclones in front of the Zagros Mountains above eastern Iran and Iraq; (3) currents from equatorial regions in Ethiopia and Sudan; and (4) convection cells. Investigating revealed that apart from the famous Mediterranean cyclone there are at least three more typical weather situations, which may give precipitation for the Eastern Province of SA.
Author in [29] examined thunderstorm days in the period 1985–2003 in different regions of the SA and particularly those regions where lightning strikes are more frequent. Establishing the annual and seasonal thunderstorm days per year (Td/yr) for SA enables transmission and distribution line engineers to compute and improve designing a lightning protection system. Over the southwestern areas of the SA, annual thunderstorms are most frequent, and, in general, decrease towards the west and east. The west coast of the Red Sea recorded is the lowest Td/yr, because its low elevation and less temporal change. In the southeast of the central area of the SA, a secondary maximum Td/yr is noticeable. In general, thunderstorm frequency does not appear to vary in any consistent way with precipitation. The southern area, generally, and especially the cities of Al-Baha, Taif and Abha, has shown greater numbers of thunderstorm days all year round. In addition, this variation did exhibit a higher frequency during the year.
Authors in [30] studied the type of wintertime disturbances related to heavy rainfall over the SA region. A case study of cyclone over SA is on 5 January 2002. They concluded that the greatest of the wintertime precipitation episodes are related to the southeastward-propagating Mediterranean disturbances, creating a sub-synoptic depression over heated land due to such a disturbance. Polar lows above high-latitude oceans, on the polar side of the frontal area in cold periods, have been investigated thoroughly [31,32,33,34]. A small number of abrupt episodes of extreme adverse weather with heavy precipitation and floods affect the SA region during winter.
Authors in [35] studied the rainfall analysis and variability and investigated the relationship among the precipitation prediction over the SA and the atmospheric pressure systems. The most significant findings from this study of monthly, annual and the horizontal distribution of the seasonal average rainfall of each station of SA can be summarized as the following:
(1) Two regions have the maximum annual rainfall, the first is the east of the middle region (Hail, Gassim, HafrAlbaten, Qaisoma, Riyad and Dharan) and the second is the southwest region (Taif, Baha, KhamisMeshiat, Abha, and Gizan). While the lowest rainfall values occur over the north and northwest areas. On the other hand, the southeast area does not contain any meteorological station and it is considered a dry area.
(2) In winter, the maximum rainfall occurs over the north and middle of the eastern areas and over the mountain area in the southwest region. In general, the highest values of precipitation over SA occur during spring season. The summer season is the lowest season of precipitation over SA. However, in the south west area, the amount of rainfall over the other areas is very low. In autumn, only six stations have an average value greater than 10 mm (Hail, HafrElbaten, Qaisoma, Makkah, Taif and Gizan). The northwest and the southwest areas may be considered as drier areas in this season. Authors in [35] summarized the results of the analysis of the coefficient of variation (COV) of annual, winter, spring, summer and autumn rainfall can be summarized as follows:
(a)
In general, the winter rainfall COV value increases gradually from the north to south of SA. The higher COV values take place in the south of SA, particularly at Albaha, Najran and Sharorah stations, whereas, in the middle of SA, the higher values occur at Yanbo and Alahsa.
(b)
COV of the annual rainfall time series appears at the highest values at Alwajh, Yanbo, Jeddah, Najran and Sharorah stations, whereas the lowest values of COV appears at Qaisoma, Albaha and KhamisMeshiat stations.
(c)
The summer rainfall COV values are greater than those corresponding to winter, spring, autumn and annual values.
(d)
In the spring season, higher variability over the western area of SA (Tabouk, Alwajh, Madinah, Yanbo, Jeddah and Makkah) is observed. However, the lowest values of COV at the mountain stations (Taifh, Elbaha, Bisha, Khamis, Abha) are found.
(e)
Autumn rainfall COV value varies from area to area, where the highest values observed over the east in the middle area (Dhahran, Alwajh, Alahsq, Riyadh and at the lowest two stations (Najran, Sharorah).
The trend analysis of the annual and seasonal values of rainfall over the stations of SA was made [35]. At over 16 stations, positive trends are detected, but negative trends are detected over 10 stations—37 (Turaif, Guriat, Arar, Tabouk, Qaisoma, Alahsa, Albaha, Bisha, Khamis Meshiat and Abha) of the 38 annual rainfall time series. From the analysis of rainfall over SA and its relationship with the pressure systems, one can divide the periods of rainfall over SA into two main periods. In the first period, about 80% of the total rainfall over SA occurs during these months from November to May. The second period occurs during the summer season (June, July and August).
A large inter-annual variability in the rainfall over SA for the study period (1978–2009) was found [20]. The observed rainfall in SA revealed a decreasing linear trend of 6.2 mm per decade during the study period (1978–2009), whilst in the recent past (1994–2009), there is a statistically significant decreasing trend of as much as 47.8 mm per decade. In the Southern Peninsula and along the Red Sea coast, it is interesting to note that rainfall increased, whilst it decreased over most parts of SA during the 2000–2009 decade, compared to 1980–1989.
Researchers examined seasonal climate change of rainfall and temperature in the AP using CRU data for the period from 1979 to 2009[19]. Figure 7 represented the spatial distribution pattern of the dry and the wet season precipitation variability (%) for the decade from 1980 to 1989 (top panels), 1990–1999 (middle panels), and 2000–2009 (bottom panels) respecting the base period from 1979 to 2009 for the CRU dataset. The dry seasons are in the right panels, while the wet seasons are in the left panels. Throughout the decade 1980–1989, the wet season precipitation was below the 31-year average over nearly all regions of the AP, while above average over middle and northwestern SA that extends to the northern border of the area (Figure 7a). The excess of above 10% is obvious over northwestern SA. Throughout 1990–1999, the wet season precipitation variability is nearly opposite. Precipitation is above average over the AP region while below average in the inclined SW to the NW region over SA, which extends up to western Iraq and Jordan (Figure 7c).Throughout the first decade of the 21st century (2000–2009), precipitation is beneath the 31-year average over middle SA, which extends to all Gulf countries, but the above average values are sustained over southwestern AP, mainly over Yemen (Figure 7e). This means that the difference of precipitation on the decadal scale is still approximately the same when averaged over the periods 1979–2009 and 1998–2009, as discussed earlier. The precipitation excess over the Red Sea coast for the decade 1990–1999 and also for the decade 2000–2009 is noticeable, which is also obvious for the southern AP (Figure 7c and e). The relative decade percentage change of precipitation during the dry season follows the same distribution obtained for the wet season only for the southern AP since there is approximately no rain in the middle to northern AP. There is a precipitation deficit over Yemen, throughout the dry season, that extends into southern SA and Oman in the period 1980–1989 (Figure 7b). The precipitation excess over all of the southern AP except for a deficit in a small sinus over eastern Oman (Figure 7d) throughout the decade 1990–1999 is observed. Precipitation was above average over the whole AP throughout the decade 2000–2009.
Thus, it was recognized that, over the AP, precipitation enhanced in the relatively heavy rain regions throughout both the dry and the wet seasons in two consecutive decades (1990–1999 and 2000–2009, respectively) compared with 1980–1989 (see Figure 7). On the other hand, the variability of precipitation for any specific year was not obvious from the average image for these three decades. Consequently, the time series of the measured precipitation at the SA station throughout the period 1979–2009 for both the dry and wet seasons are exhibited in Figure 8, along with the results of a linear trend analysis. During the wet season, in general, precipitation has an insignificant decreasing trend of about 6.3 mm per decade. Careful inspection indicates that the wet season rainfall trend is positive (increasing) in the first few years and negative (decreasing) in the last few. One can divide the total analysis period into two halves. The first half is the period from 1979 to 1993 and the other period is from 1994 to 2009. The wet season precipitation demonstrates a significant negative (decreasing) trend (at the 95% level) at a rate of 35.1 mm per decade throughout the second half period 1994–2009 (with a standard deviation value of 34.0 mm), and it shows an insignificant positive (increasing) trend at a rate of 12.6 mm per decade throughout the first half period 1979–1993 (with the standard deviation value of 4.7 mm). This indicates the impact of the selection of the starting and ending years on the trend assessments, as examined by [36].
Figure 7. Spatial distribution of the wet rainfall change (%) for the decade (a,b)1980–1989, (c,d) 1990–1999, and (e,f)2000–2009 with respect to the base period (1979–2009) for the CRU dataset (left panels: (a,c,e)) and the dry season (right panels: (b,d,f)) [19].
Climate 03 00578 g007
On the contrary, the wet season precipitation through the dry season over SA is low and mostly restricted to the southwest region, as described earlier. Through the dry season, the precipitation is insignificantly positive (increasing) at a rate of 0.4 mm per decade for the whole period from 1979 to 2009, with a standard deviation value of 7.4 mm (not shown). Although in the dry season the positive trend is small, it is differing in nature relative to the wet season trend. The nature of the trends is mostly determined by the extreme year of 1992 (37.1 mm). The results explain an insignificant positive trend at a rate of 2.0 mm per decade through the first period (1979–1993), with a standard deviation value of 8.4 mm, while it is a significant (above the 90% level) negative trend at 5.5 mm per decade through the second period (1994–2009), with a standard deviation value of 5.9 mm. Irrespective of the season, the positive trends in the first half of the period are smaller compared with the negative trends in the second half. Therefore, the recent precipitation trends over SA have decreased; these might be related to the extended droughts, which have happened across the entire AP in the last decade.
Figure 8. Time sequences of the observed (a) wet season and (b) dry season rainfall (mm) during the period 1979–2009 over Saudi Arabia. The seasonal trends are displayed for the first (1979–1993) and second (1994–2009) periods. For the wet season, the first/second period indicates insignificant/significant increase/decrease in rainfall (12.6/35.1 mm per decade). For the dry season, the first/second period indicates insignificant/significant increase/decrease in rainfall (2.0/5.5 mm per decade) [19].
Climate 03 00578 g008

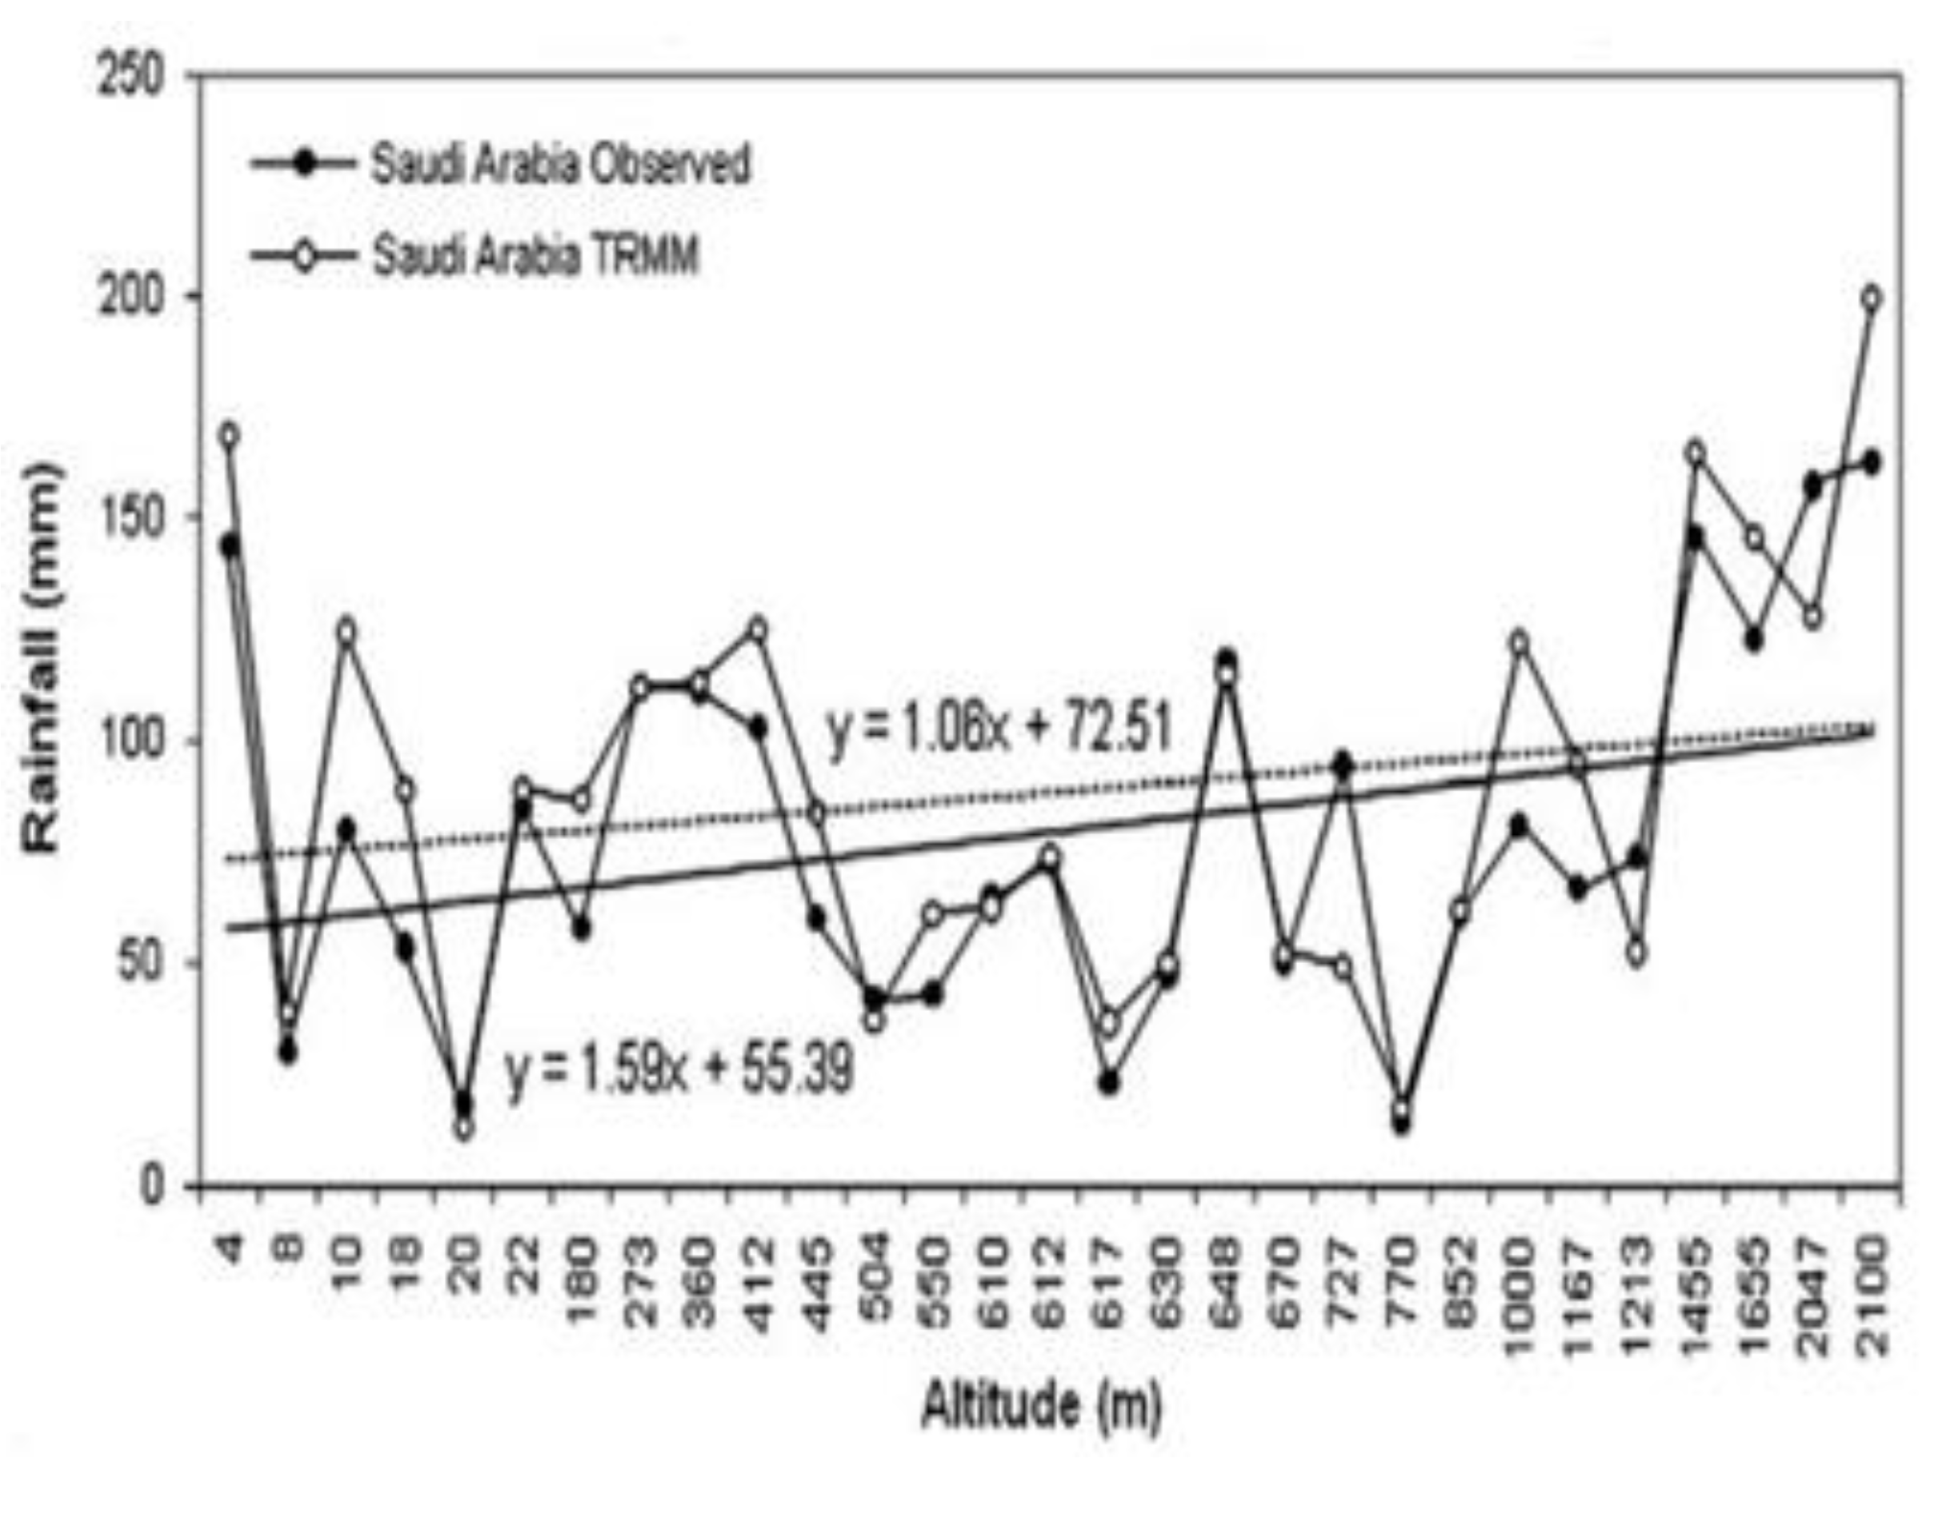
3.2. Precipitation Variations with Altitude

Great environmental contrasts occur within short distances as a result of the diverse topography and the highly variable nature of the energy and moisture fluxes within the system. This is especially true in the western part of the SA and along the Red Sea coastal areas, where adjacent to the Tihamah, the rather flat coastal area about 50 km in width, there is a sharply rising mountain chain that reaches elevations greater than 1500 m, especially in the north where the Hijaz Mountains lie [12]. Due to the different morphological units in the western part of the SA, Tihamah, foothills, and mountains, the climate recording stations were lumped according to their location and related to one of these three morphological units. Table 2 shows the high variation in the mean rainfall from coastal areas of the mountains (five times).
Table 2. Average rainfall and temperature for the main morphological units in the study area [12].
Topographical UnitsRainfall (mm/Year)Temperature (°C)
Min.MeanMaxMin.MeanMax
Coastal Area1750100243239
Foothill Area103170230222934
Mountain Area70325650162228
Otherwise, the temperatures in the foothills are a little different from coastal areas, whereas the differences are greater between the foothills and the mountains. The spatial variability of rainfall has strongly reflected the impact of topography, where the annual precipitation in general increases with altitude increase (Orographic impact). In general, the eastern part of the area receives a considerably higher amount of precipitation with an average of about 220 mm/year near the Hijaz mountain as compared to the western area having an average of less than 100 mm/year near the Red Sea coast (low lying areas, Tihamah). The general tendency for the rainfall is to be more regular in the highlands than the coastal plain.
The annual rainfall variation with elevation is investigated. A positive relation between rainfall and elevation ( r 2 =   0.5828 ). However, the intensity of the relationship is affected by some outliers as can be seen in Figure 9, which shows that some low elevation stations receive a higher amount of rainfall whereas some high elevation stations receive low amounts. The result shows a strong and significant correlation (r = 0.75) and reflects the variation of rainfall in the study area. In general, the maximum amount of annual rainfall does not always happen at the highest elevation in three regions. Therefore, the elevation is not the only factor in rainfall distribution. Other geographic factors, like temperature, pressure, distance from the source moisture and topography are also important. In this analysis, the time factor (i.e.,seasonality) is found. Hence, the rainfall distribution is not uniform in time or in space; it should be treated and analyzed as spatiotemporal phenomena due to the spatial and temporal variations in rainfall, especially in arid and semiarid regions.
The mean annual rainfall distribution cannot give a clear idea about the different mechanism of climate conditions. Isoheight maps are prepared on a seasonal basis since seasonal figures are more practical than annual ones. The seasonal isoheight maps can be interpreted as follows:
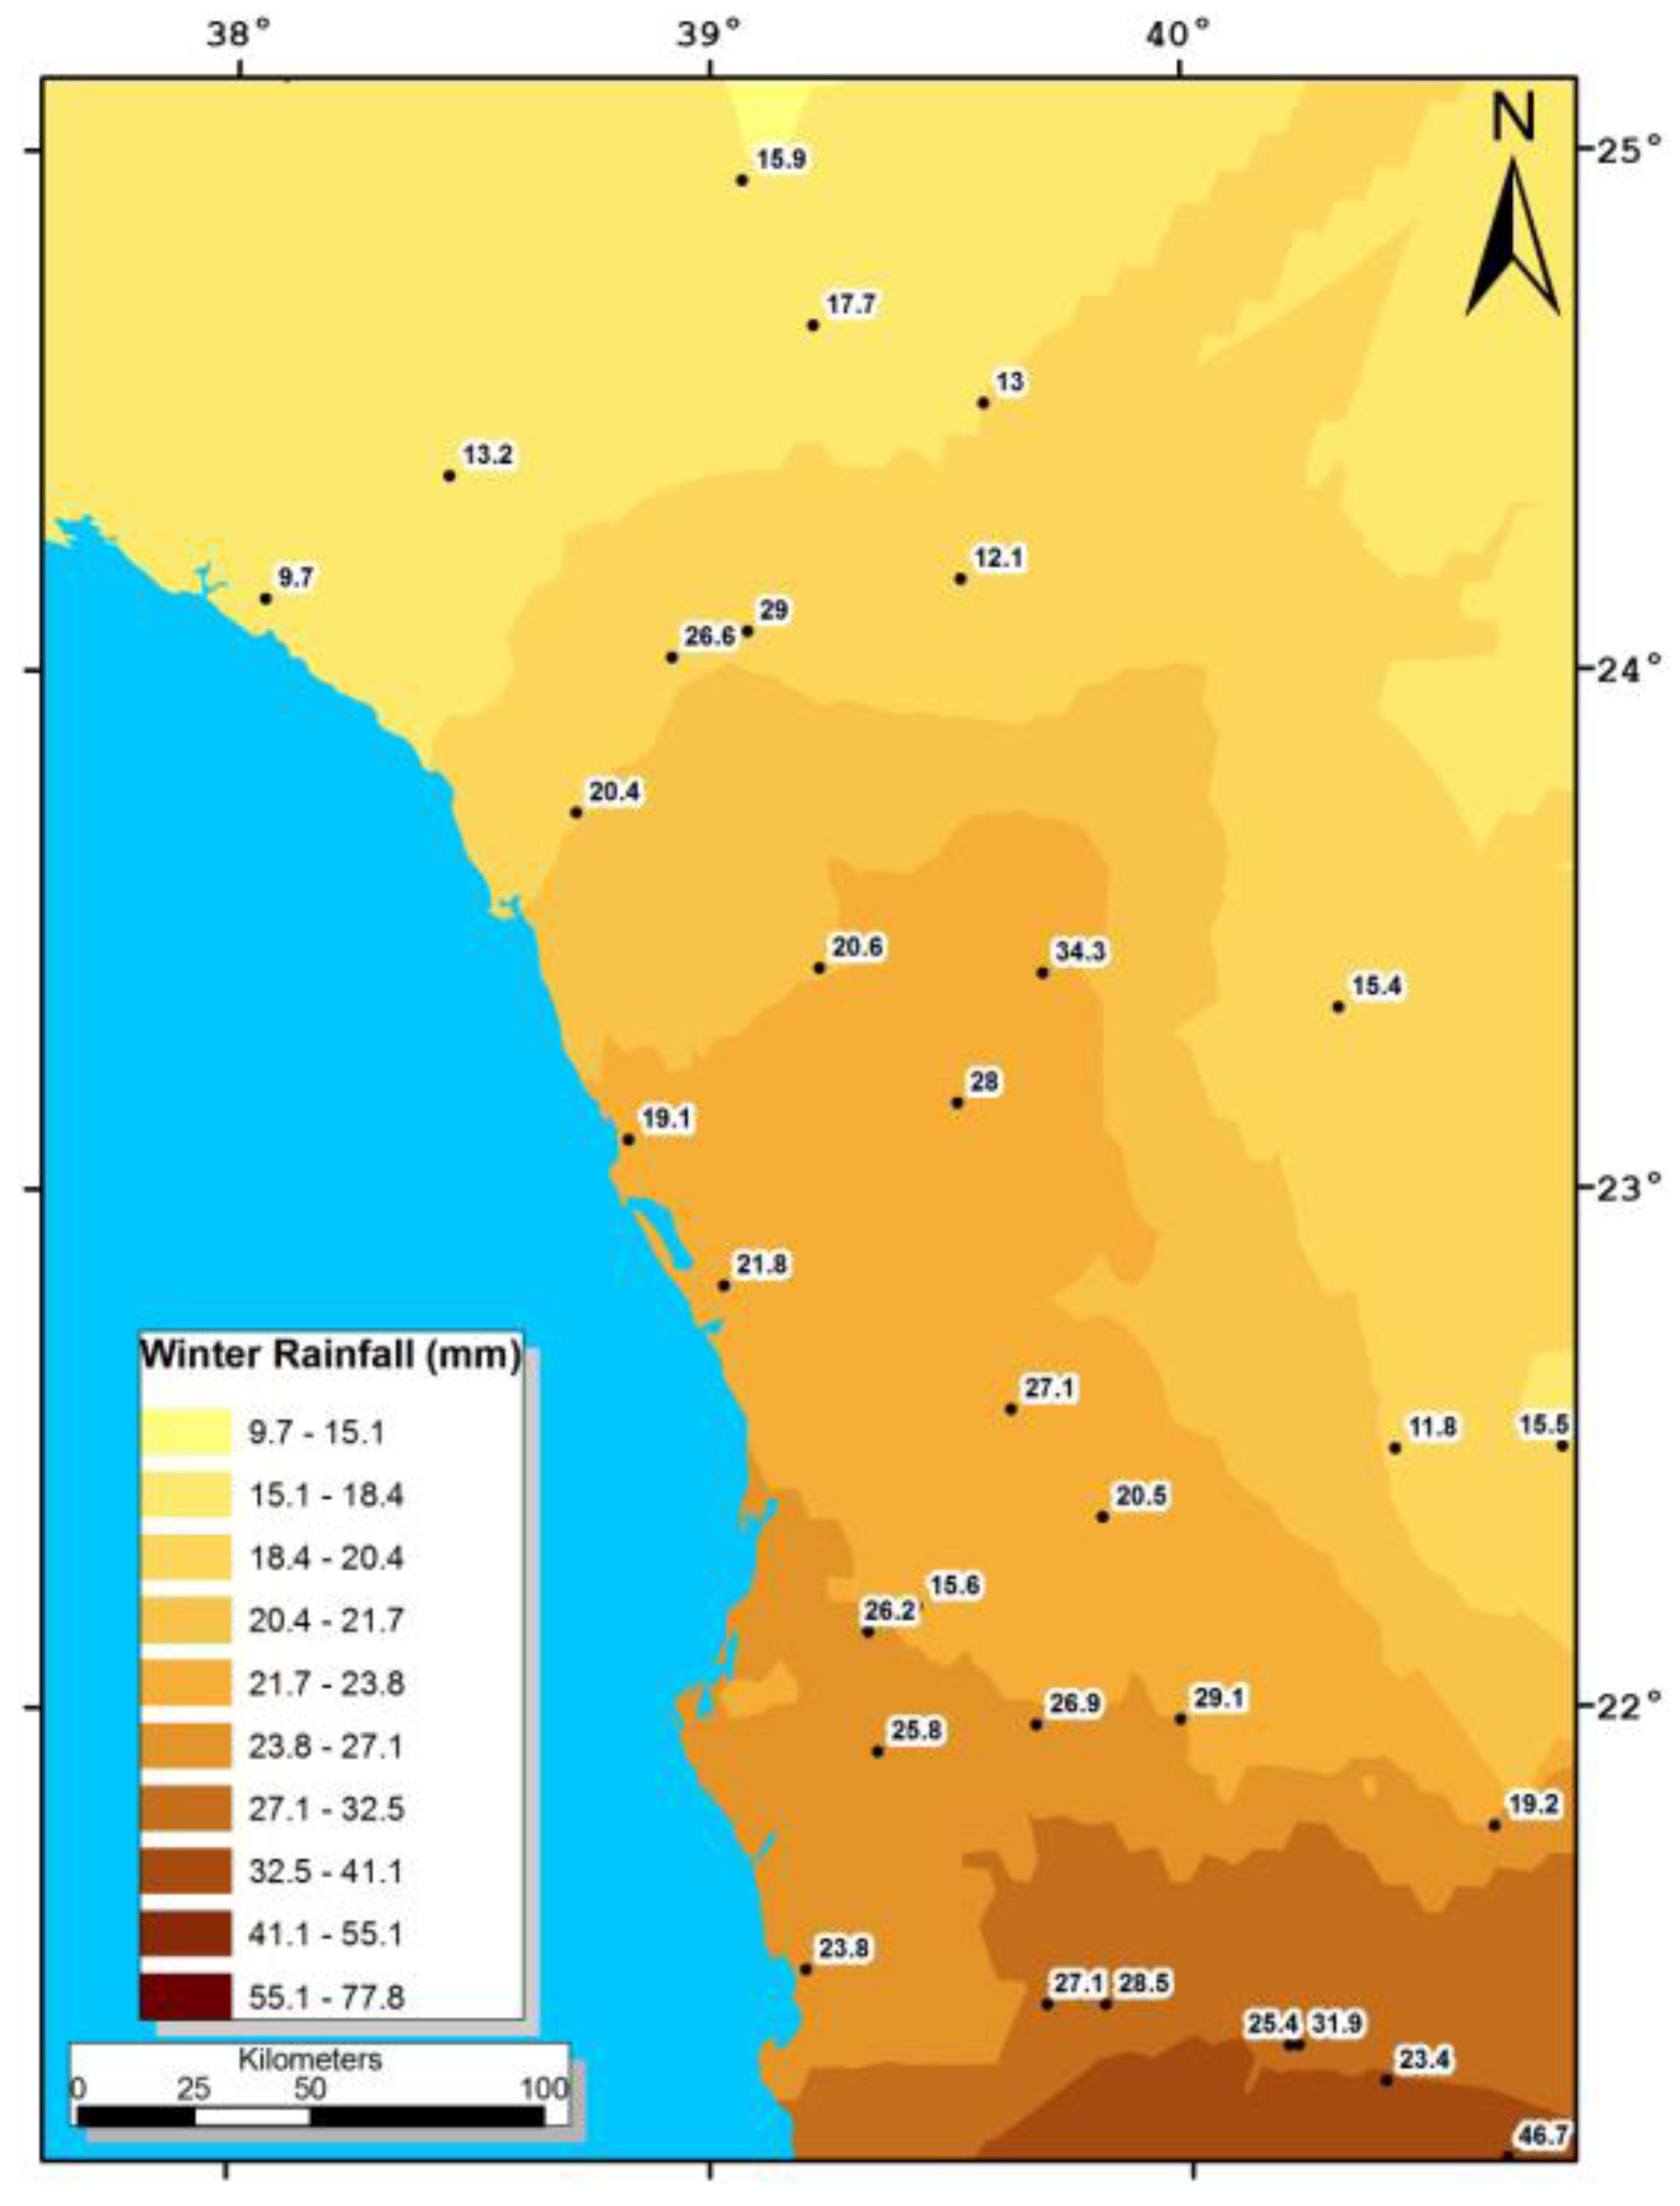
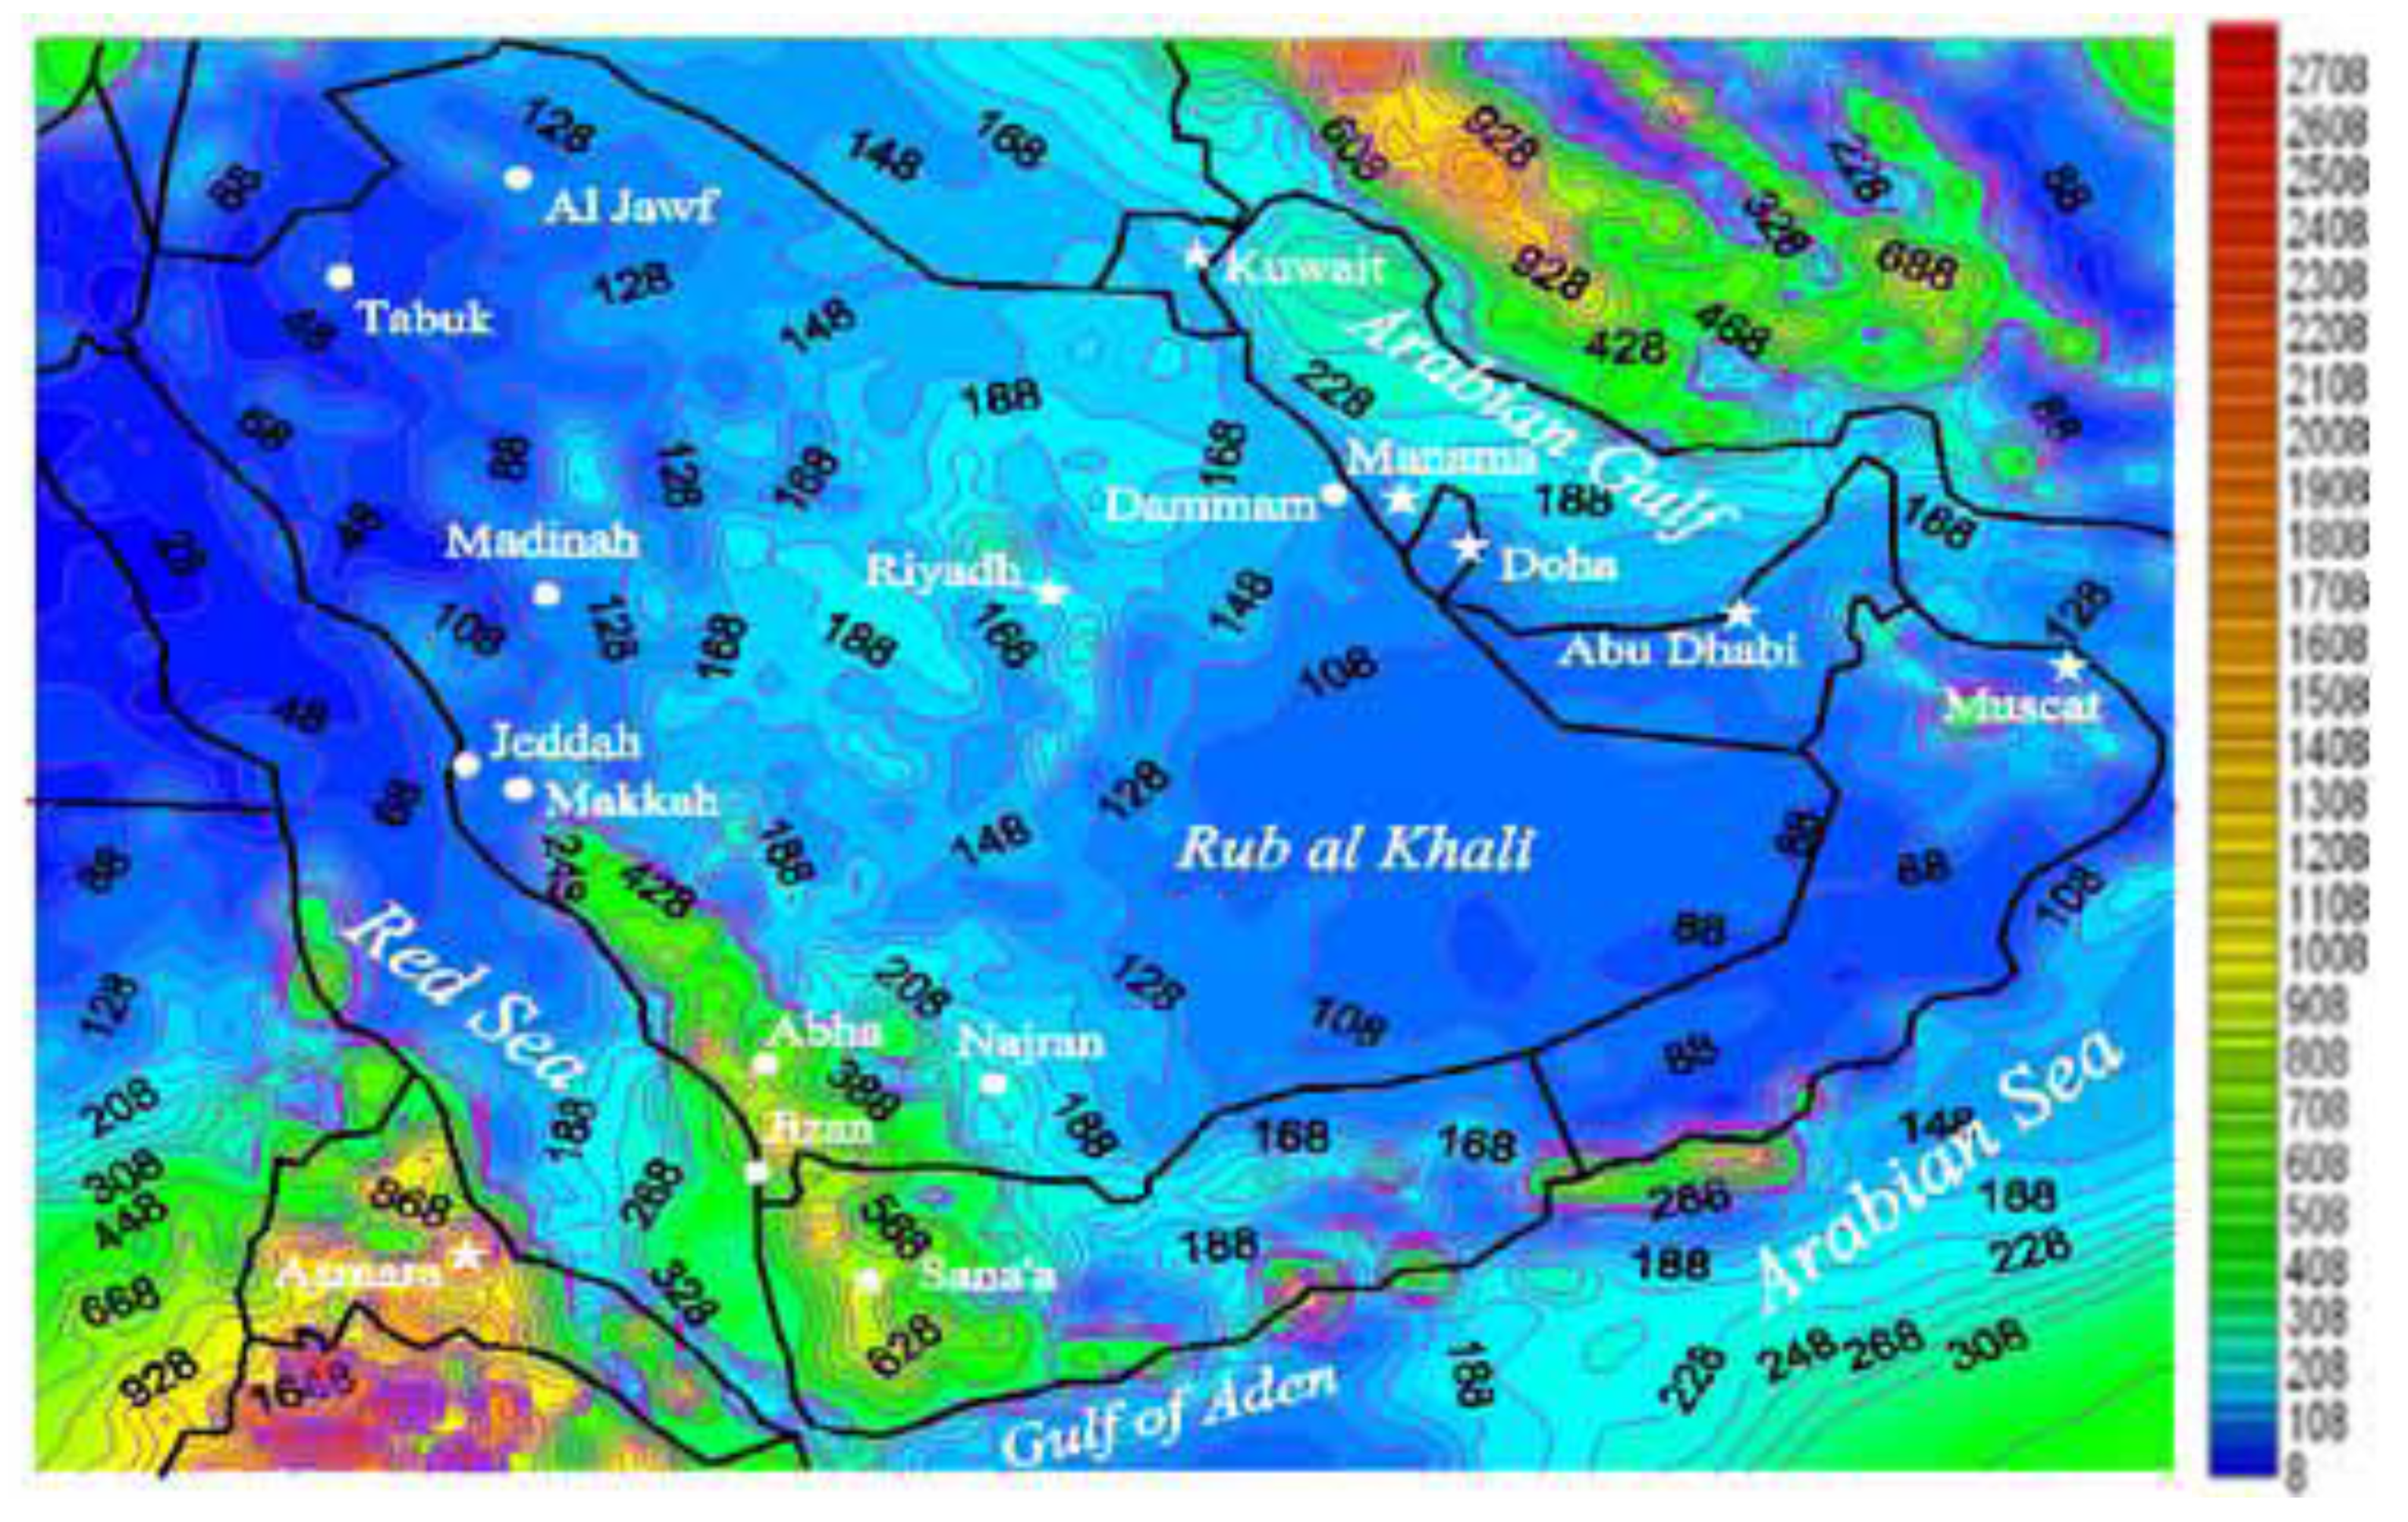
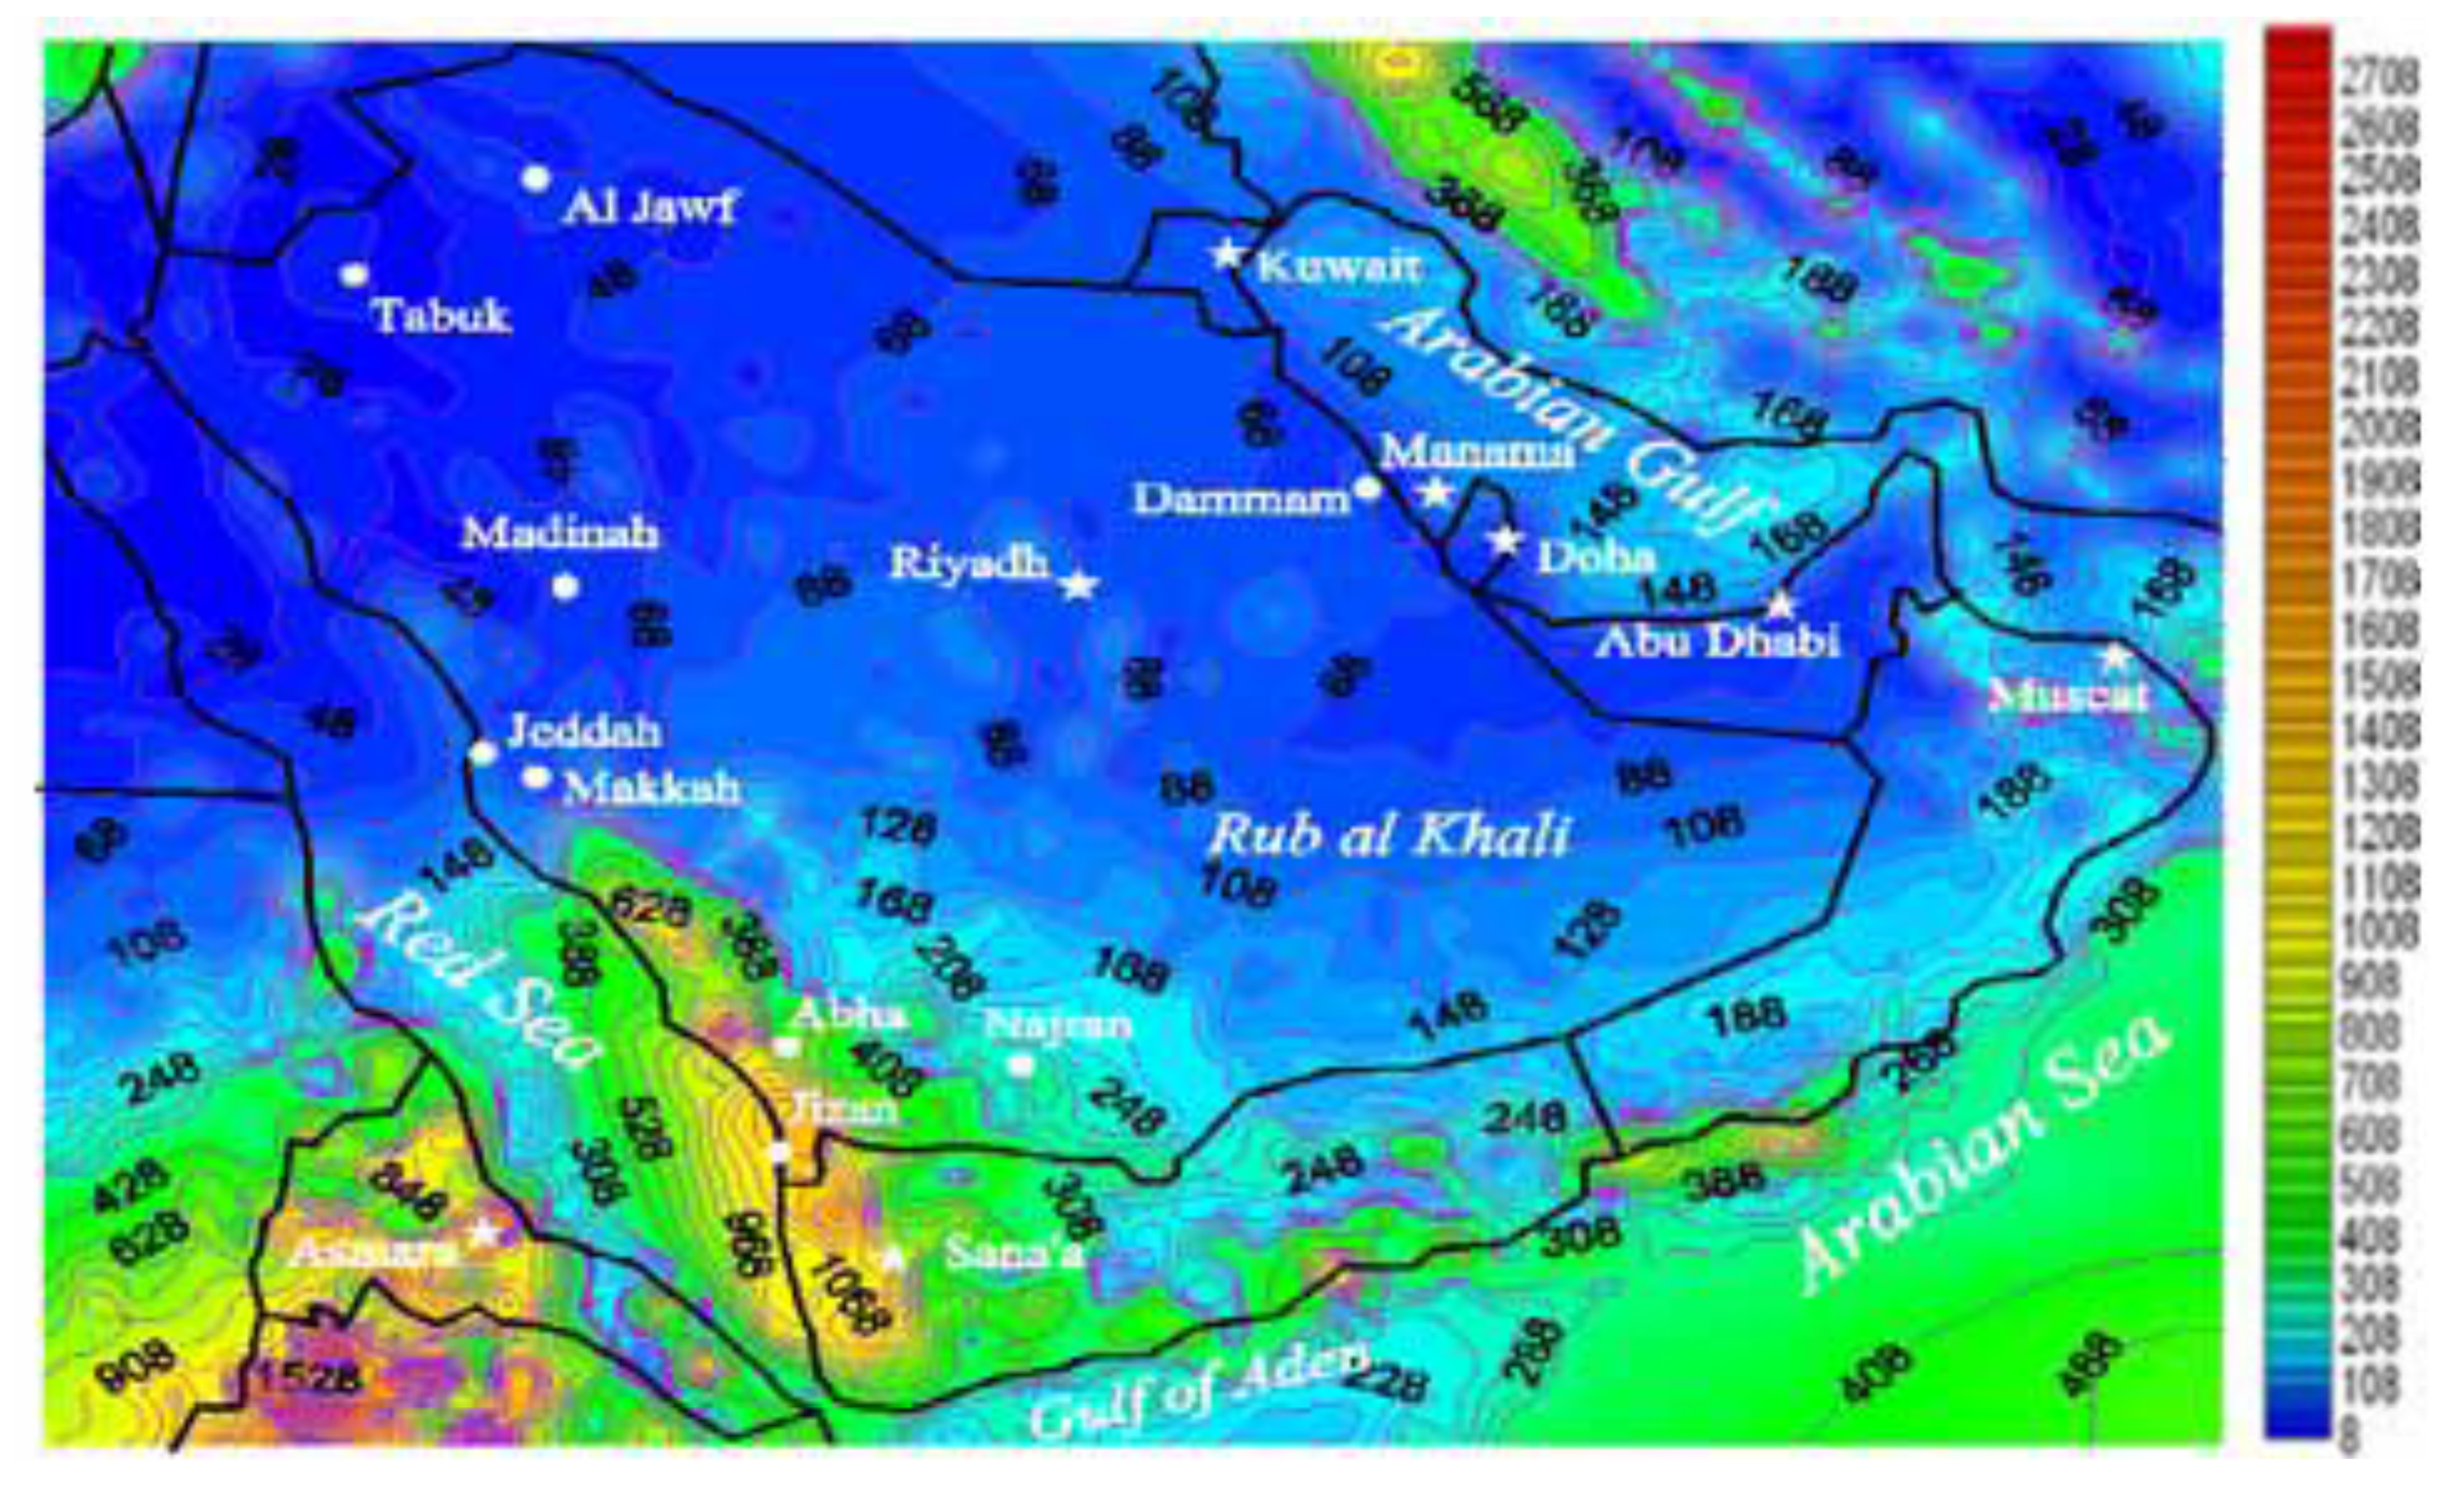
  • During winter (December–February): precipitation amounts increase towards the south due to the topography (Figure 10). The highest precipitation (47 mm) is near the high mountains close to the Taif City over the Escarpment in the south and decreases gradually towards the north. Precipitation is usually associated with weak influxes of moist cold air of westerly Mediterranean origin, which is coupled with the local effects of the Red Sea and Escarpment with orographic rainfall occurrences. In addition, the Red Sea coastal area receives a significant amount of rainfall that decreases from south to north (from 24 to 10 mm). Areas within more than 20 mm, isoheight are relevant for groundwater recharge. The study area receives the highest amount of rainfall during the winter and the basins are subject to flooding.
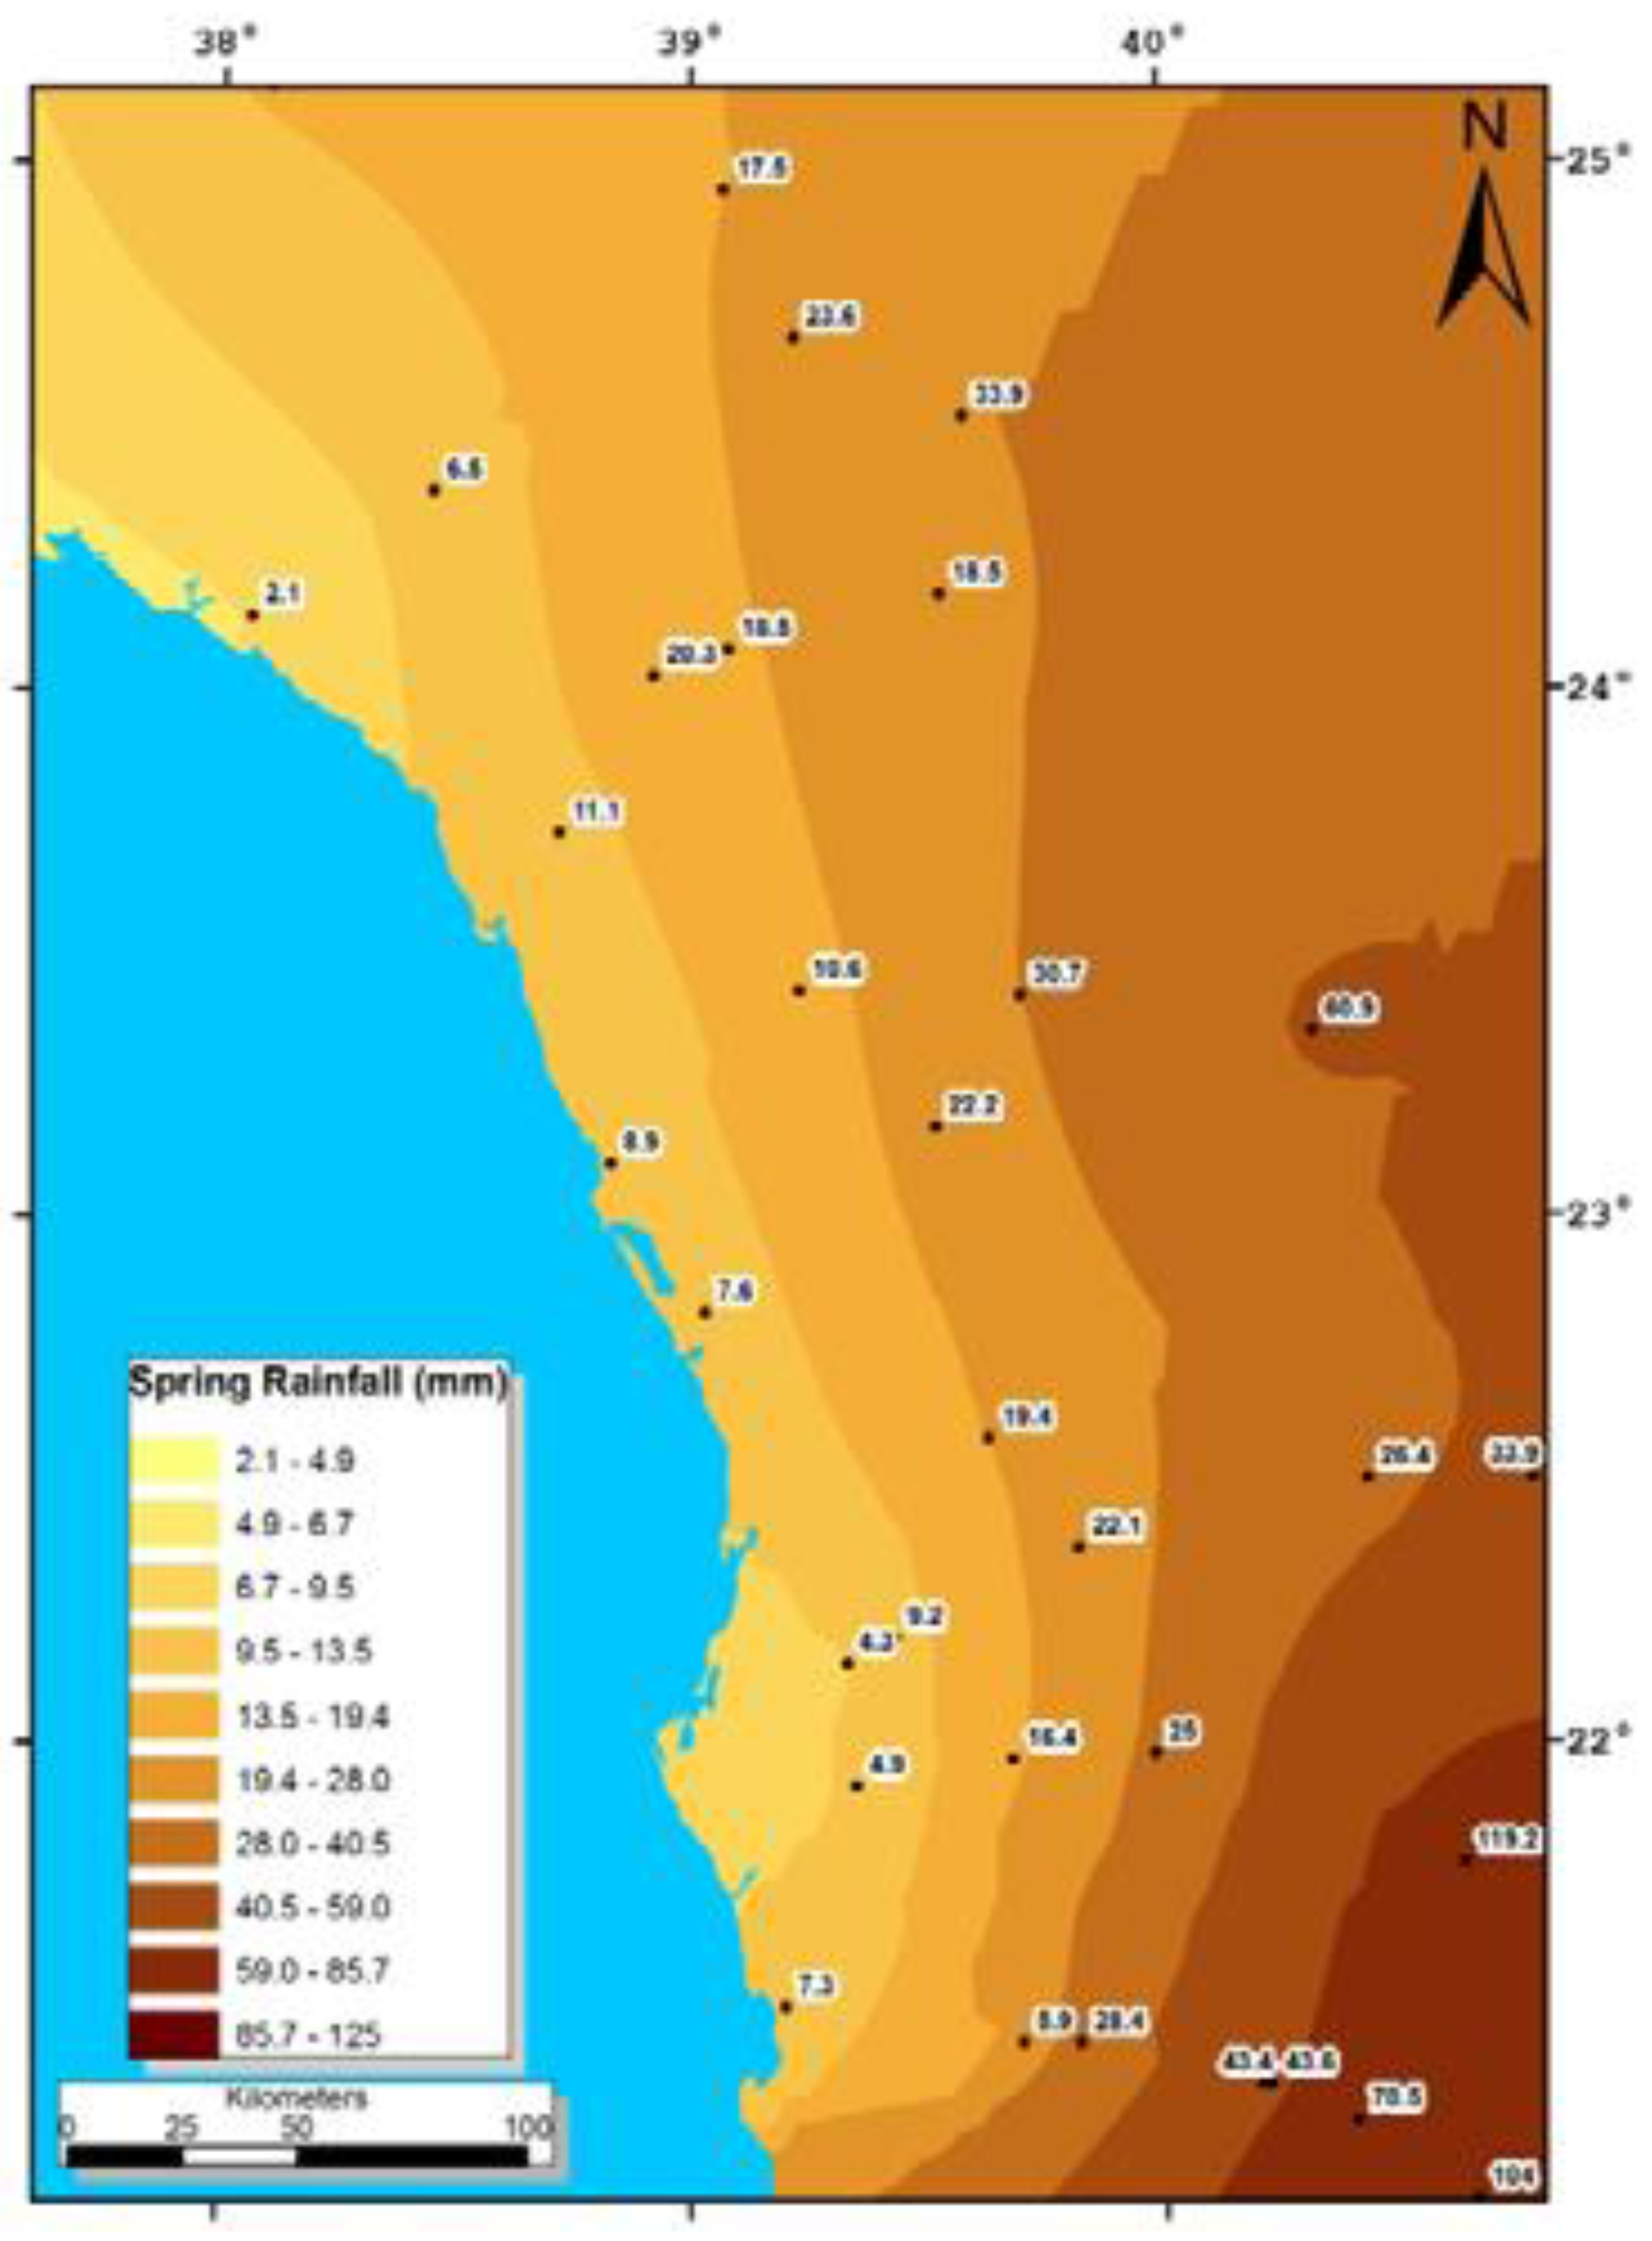
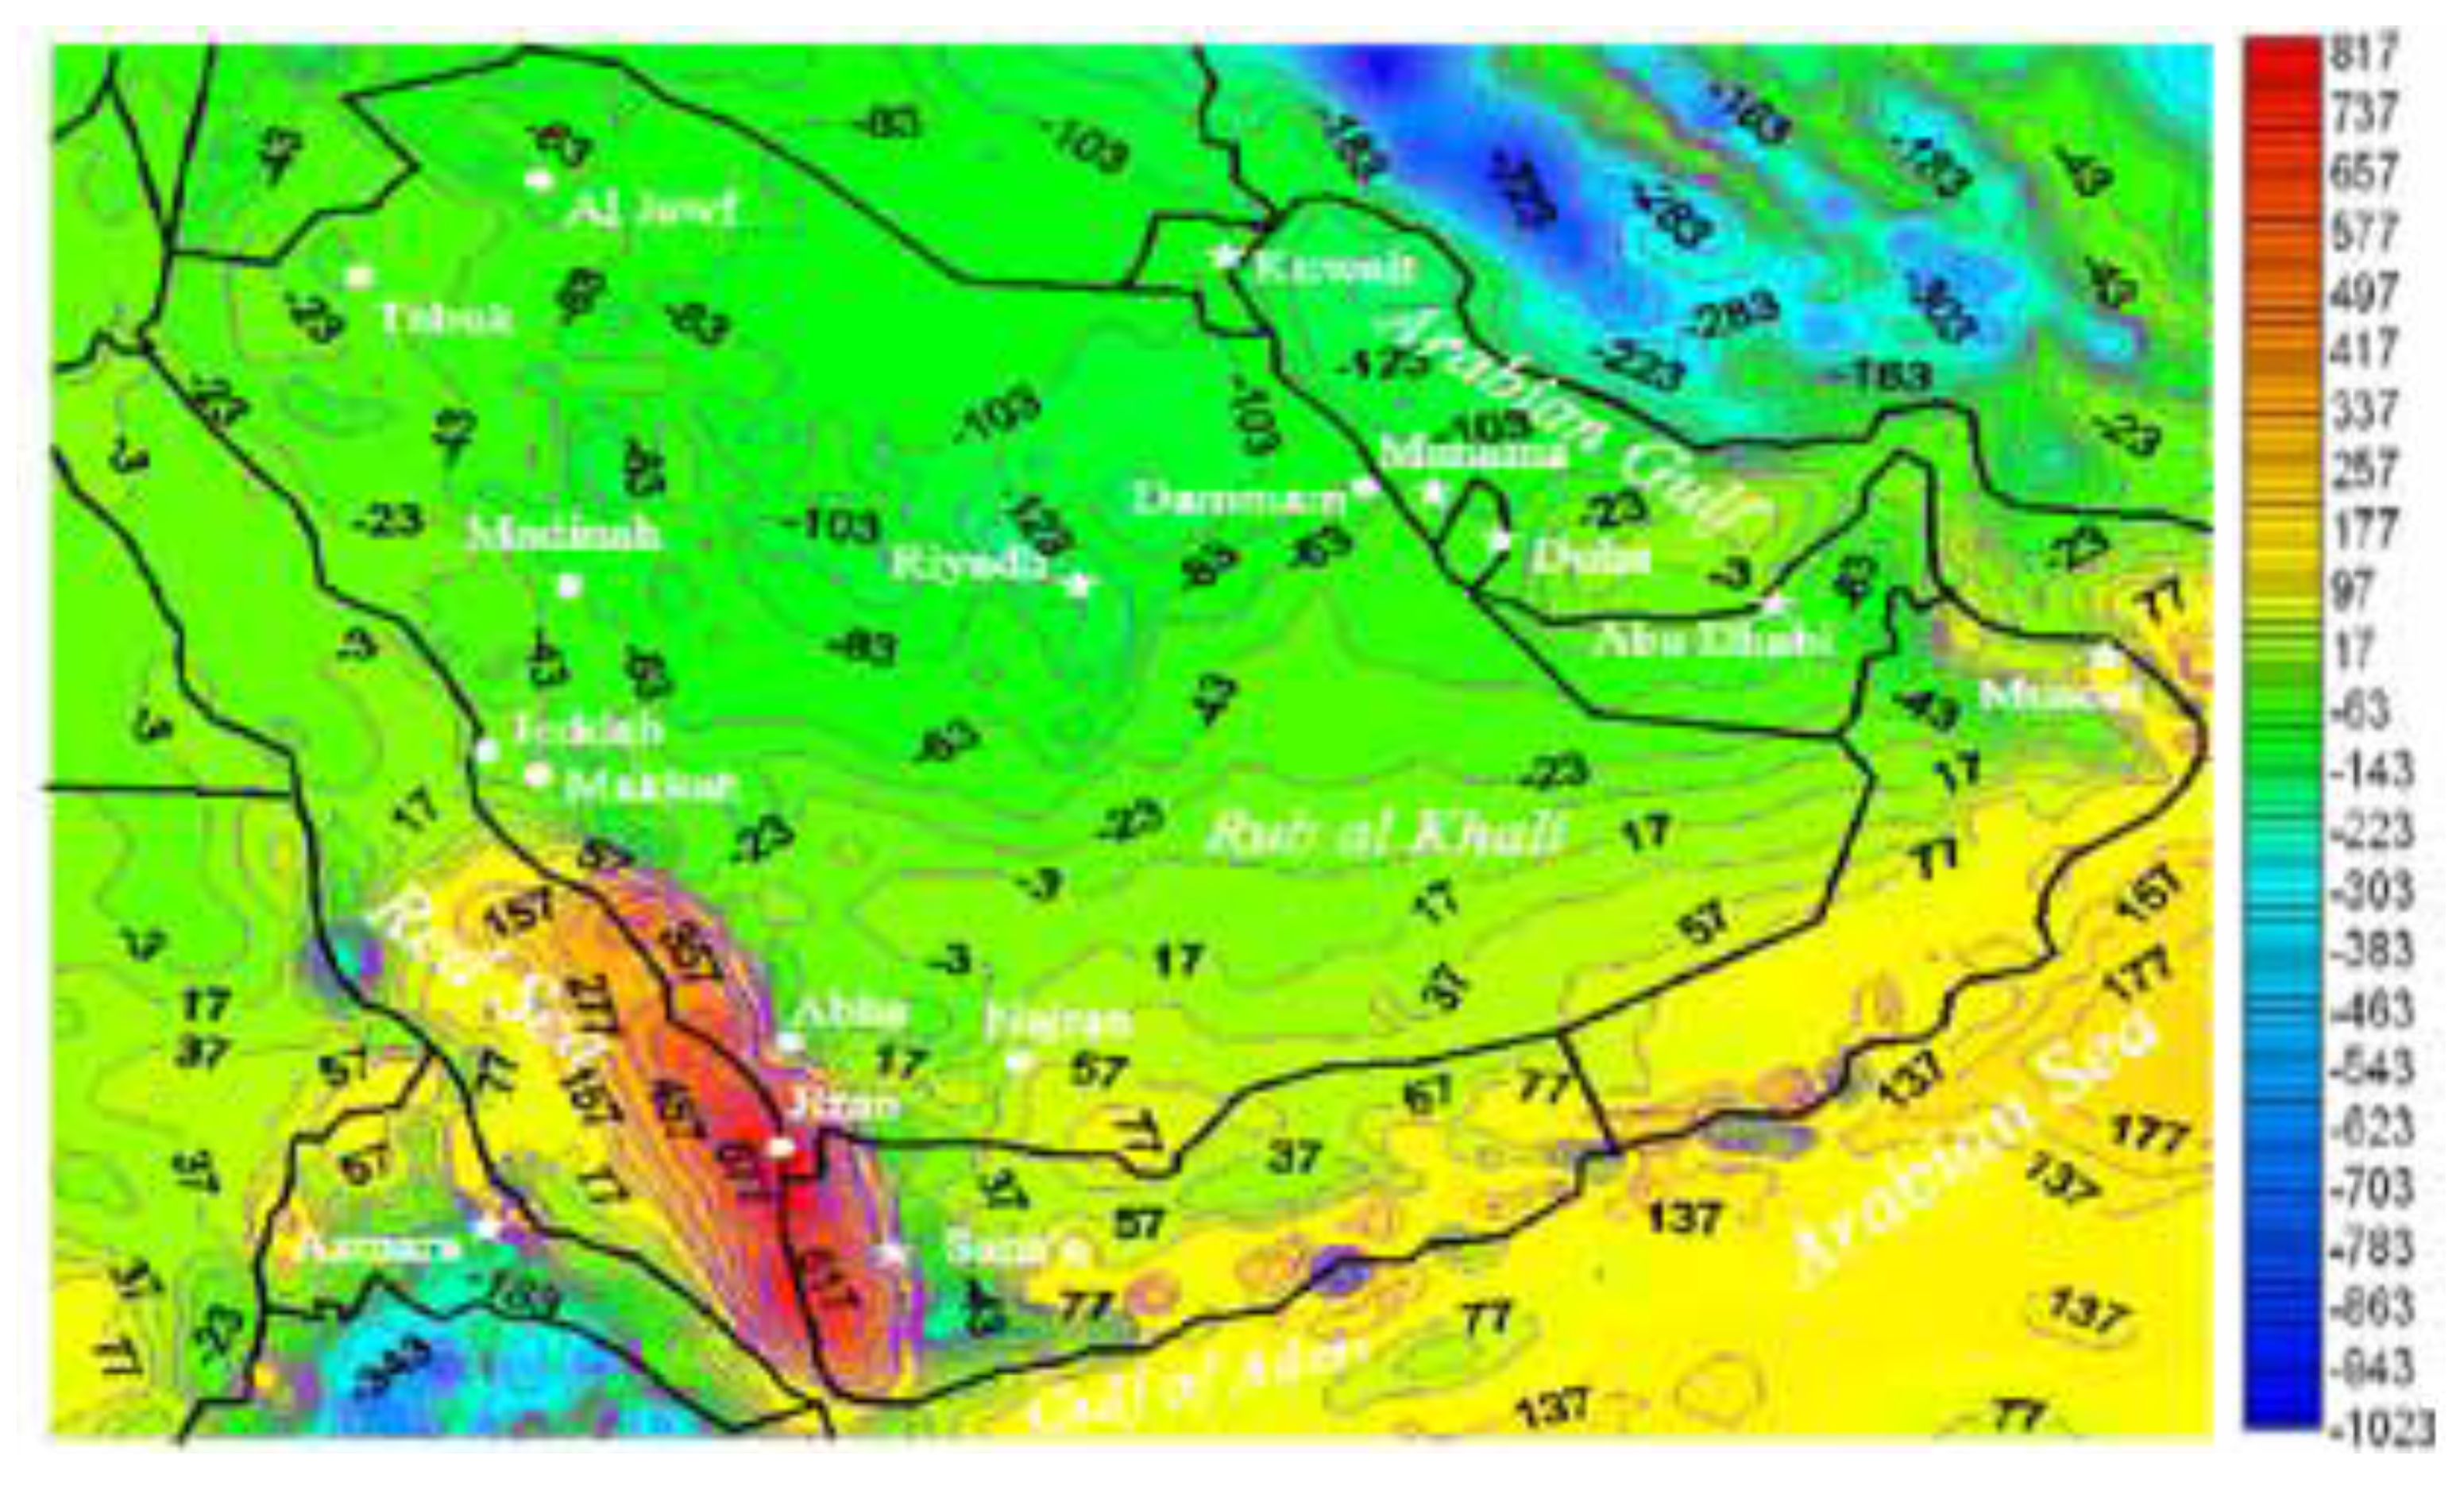
  • During spring (March–May): Figure 11 shows a different rainfall pattern. The maximum rainfall (100 mm) is in the high mountains near Taif city and decreases gradually from the west towards the east. The equal spacing of the isoheights indicates that the spatial variation in rainfall is less thanin the winter season. This is due to the Red Sea convergence zone and the Mediterranean depression, which distribute rainfall all over the region with good potential for groundwater recharge.
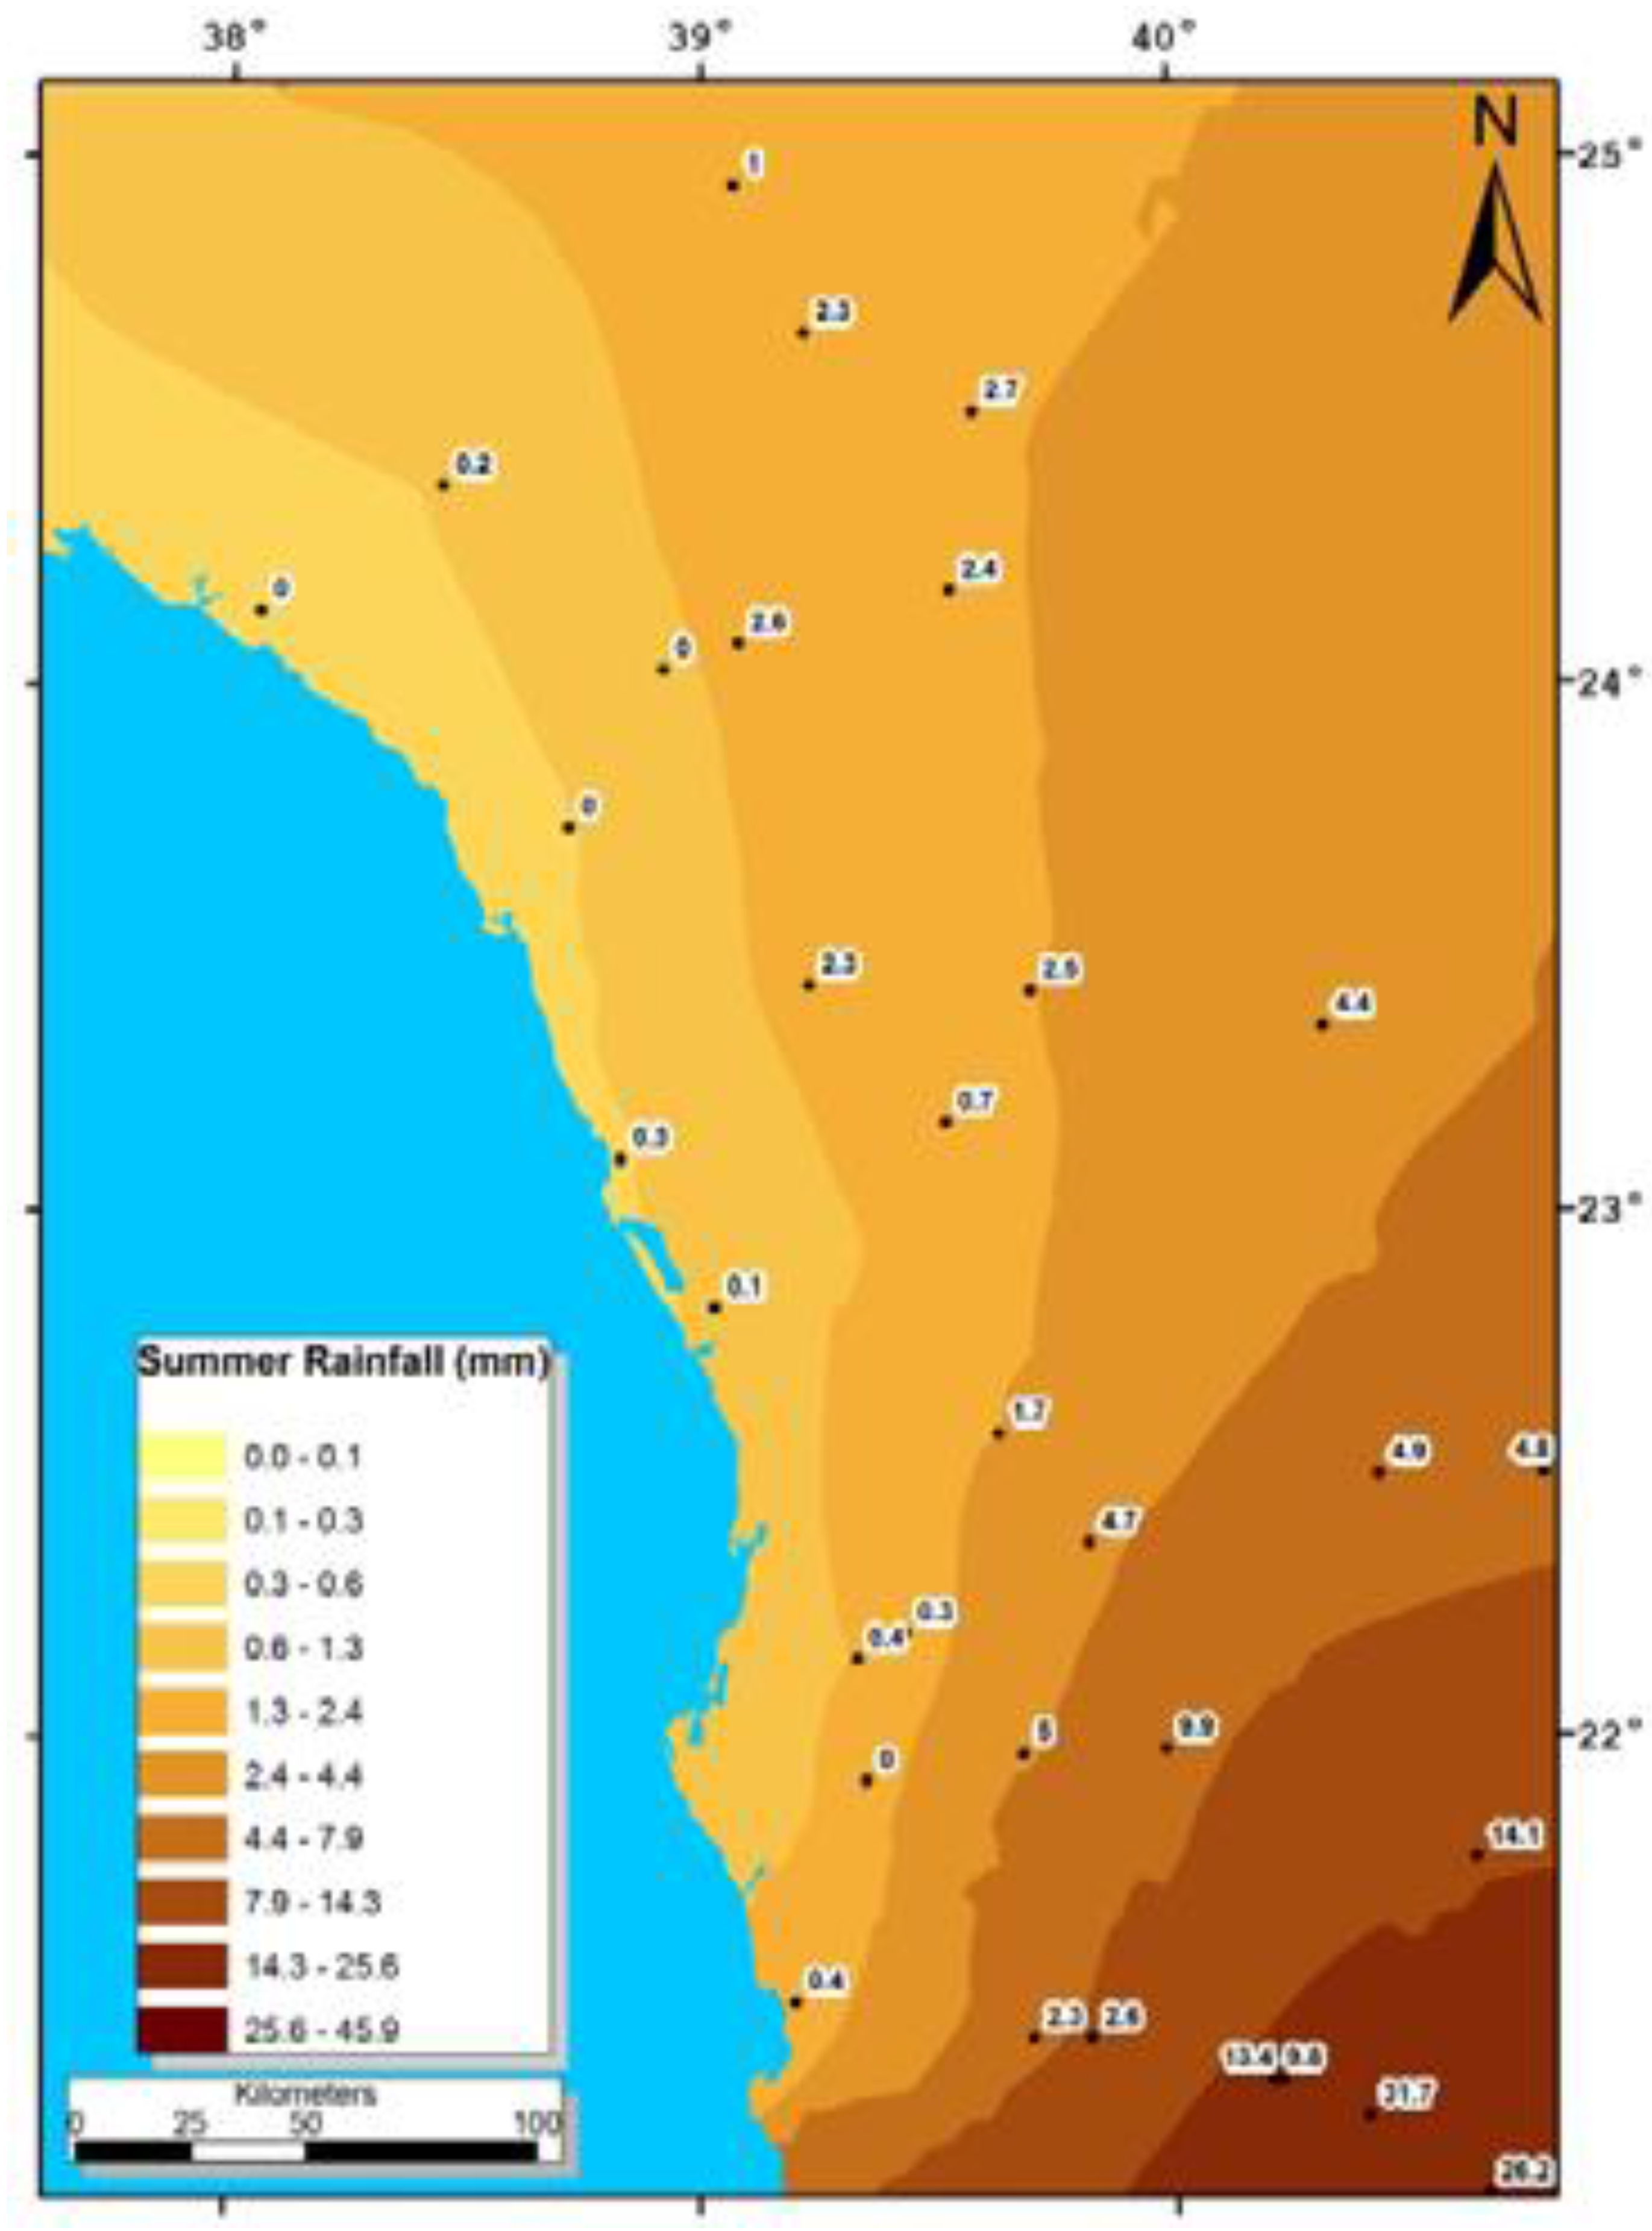
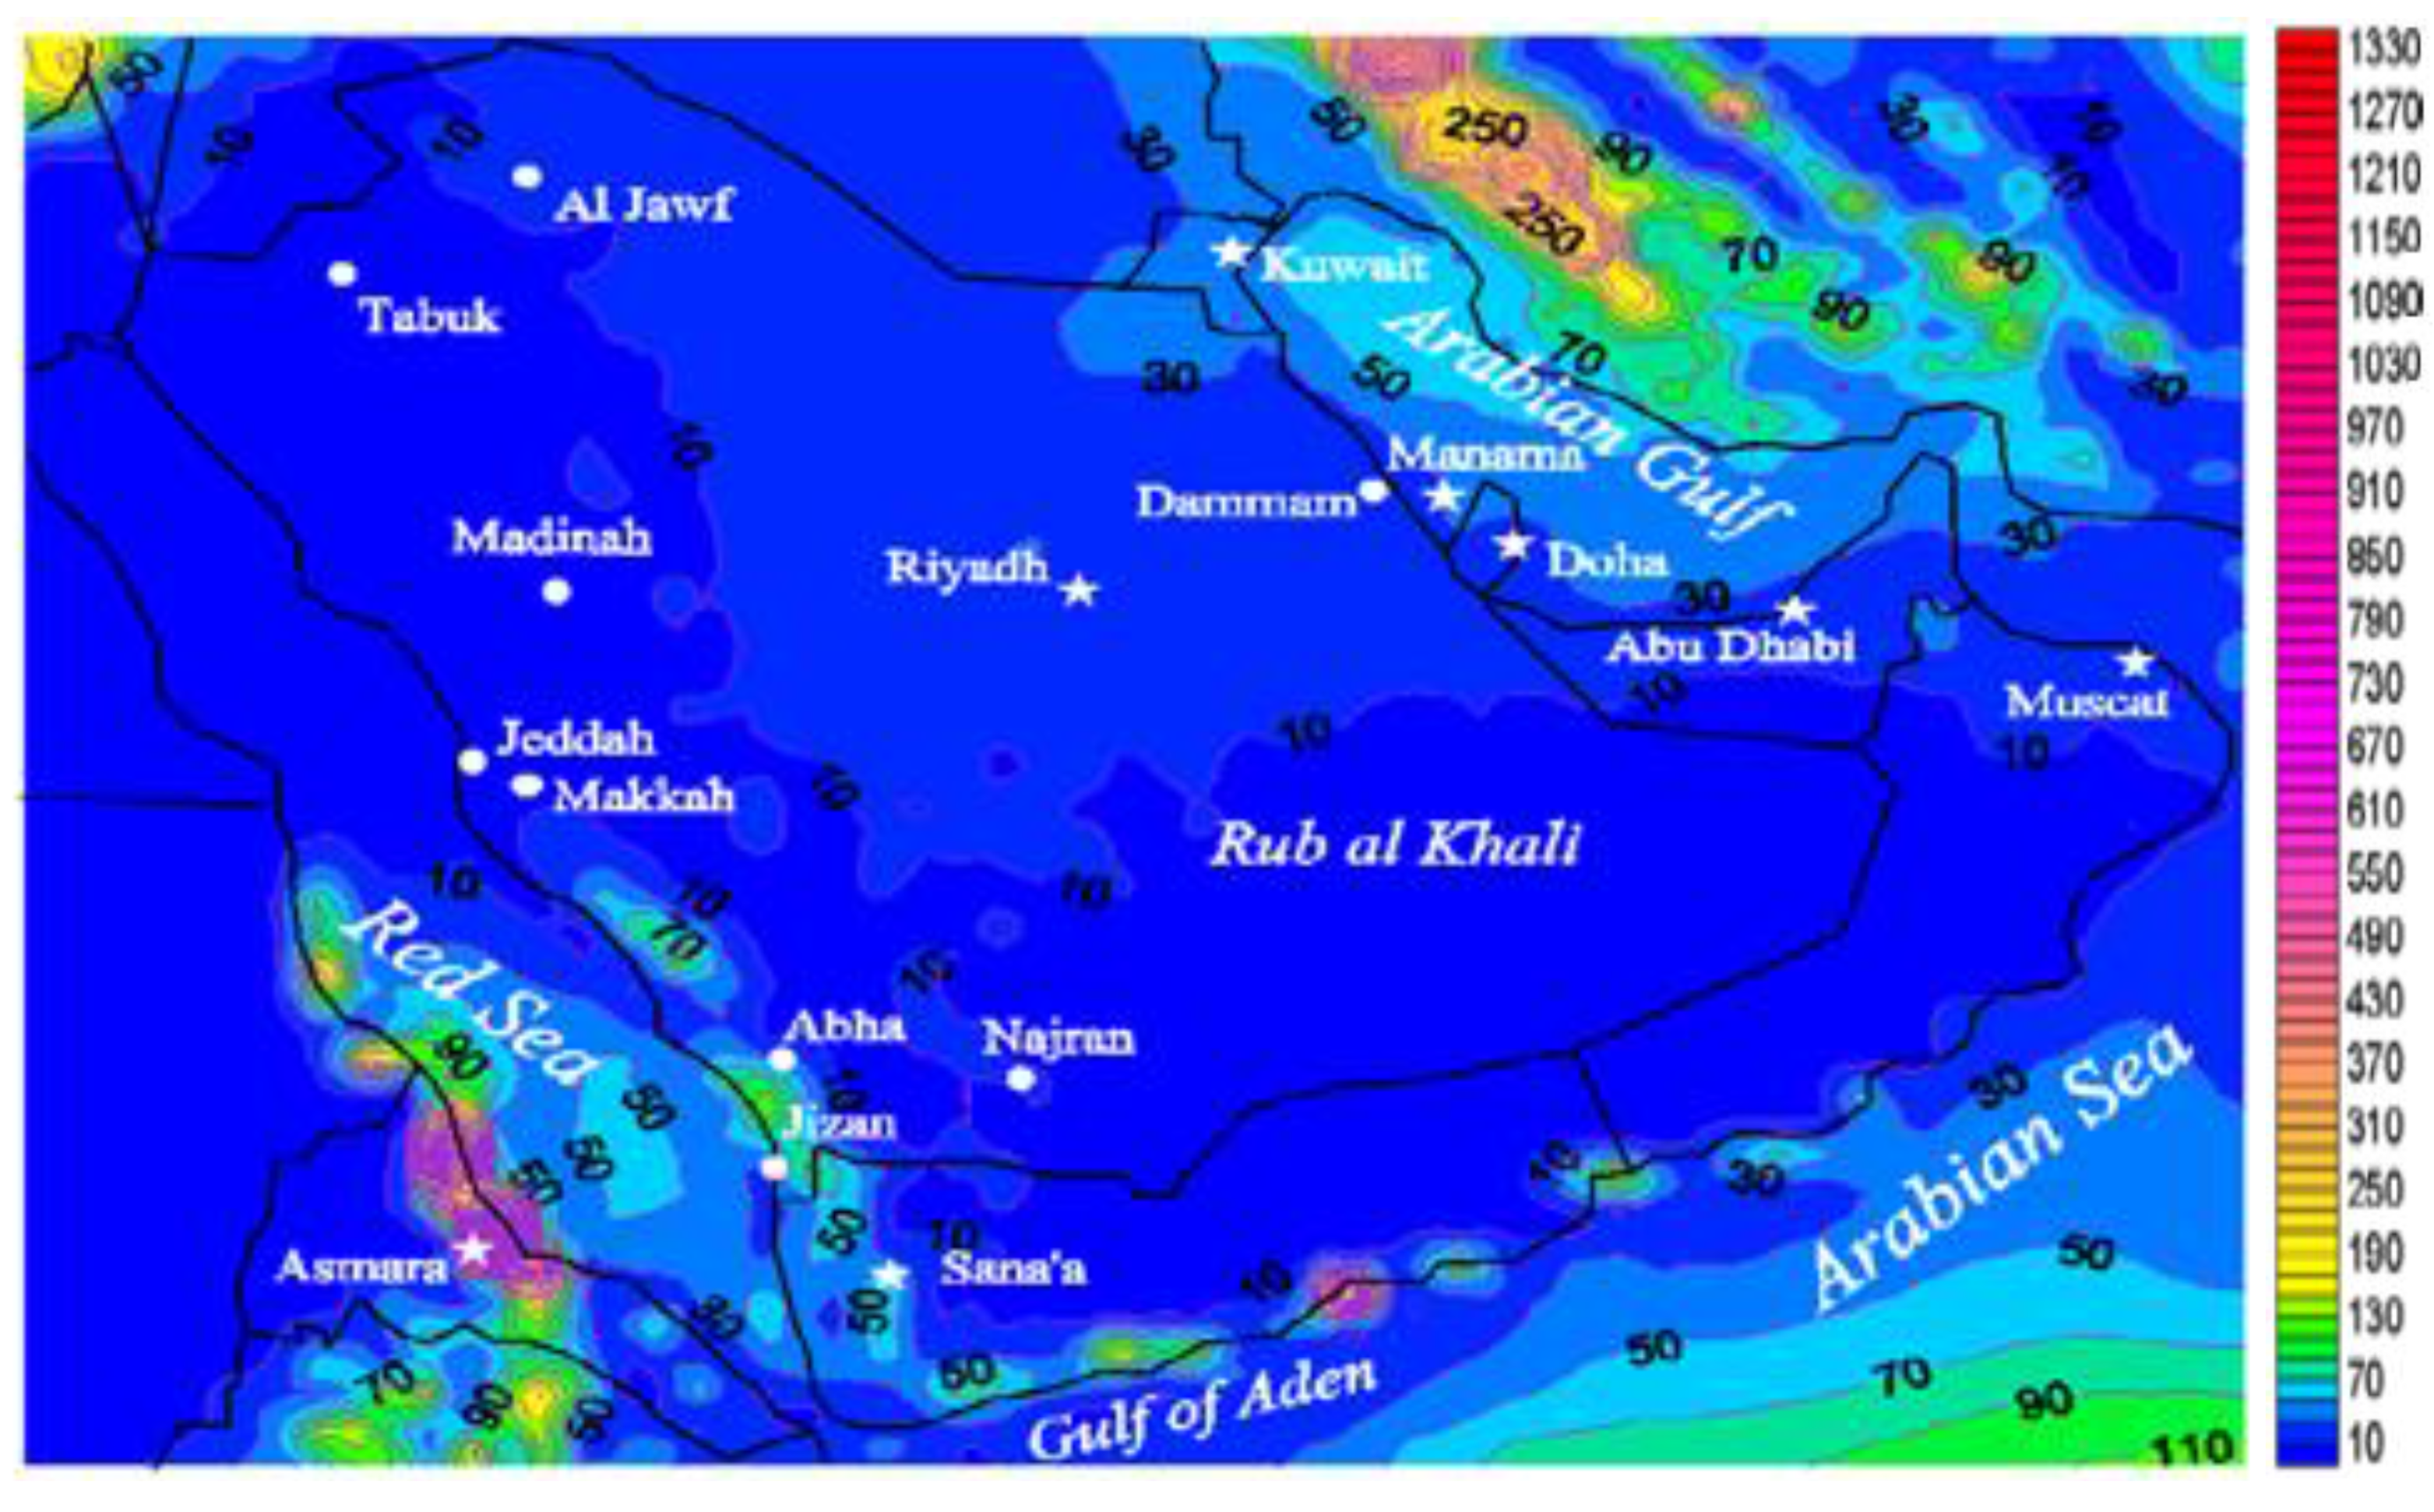
  • During summer (June–August): Figure 12 shows that, during the summer season, there is very little rainfall with the exception of the Taif scarp mountains where rainfall is about 30 mm due to monsoon conditions, which create thunderstorms along the escarpment and the southern part of the Red Sea coast. There is no significant impact of rainfall on the recharge mechanism.
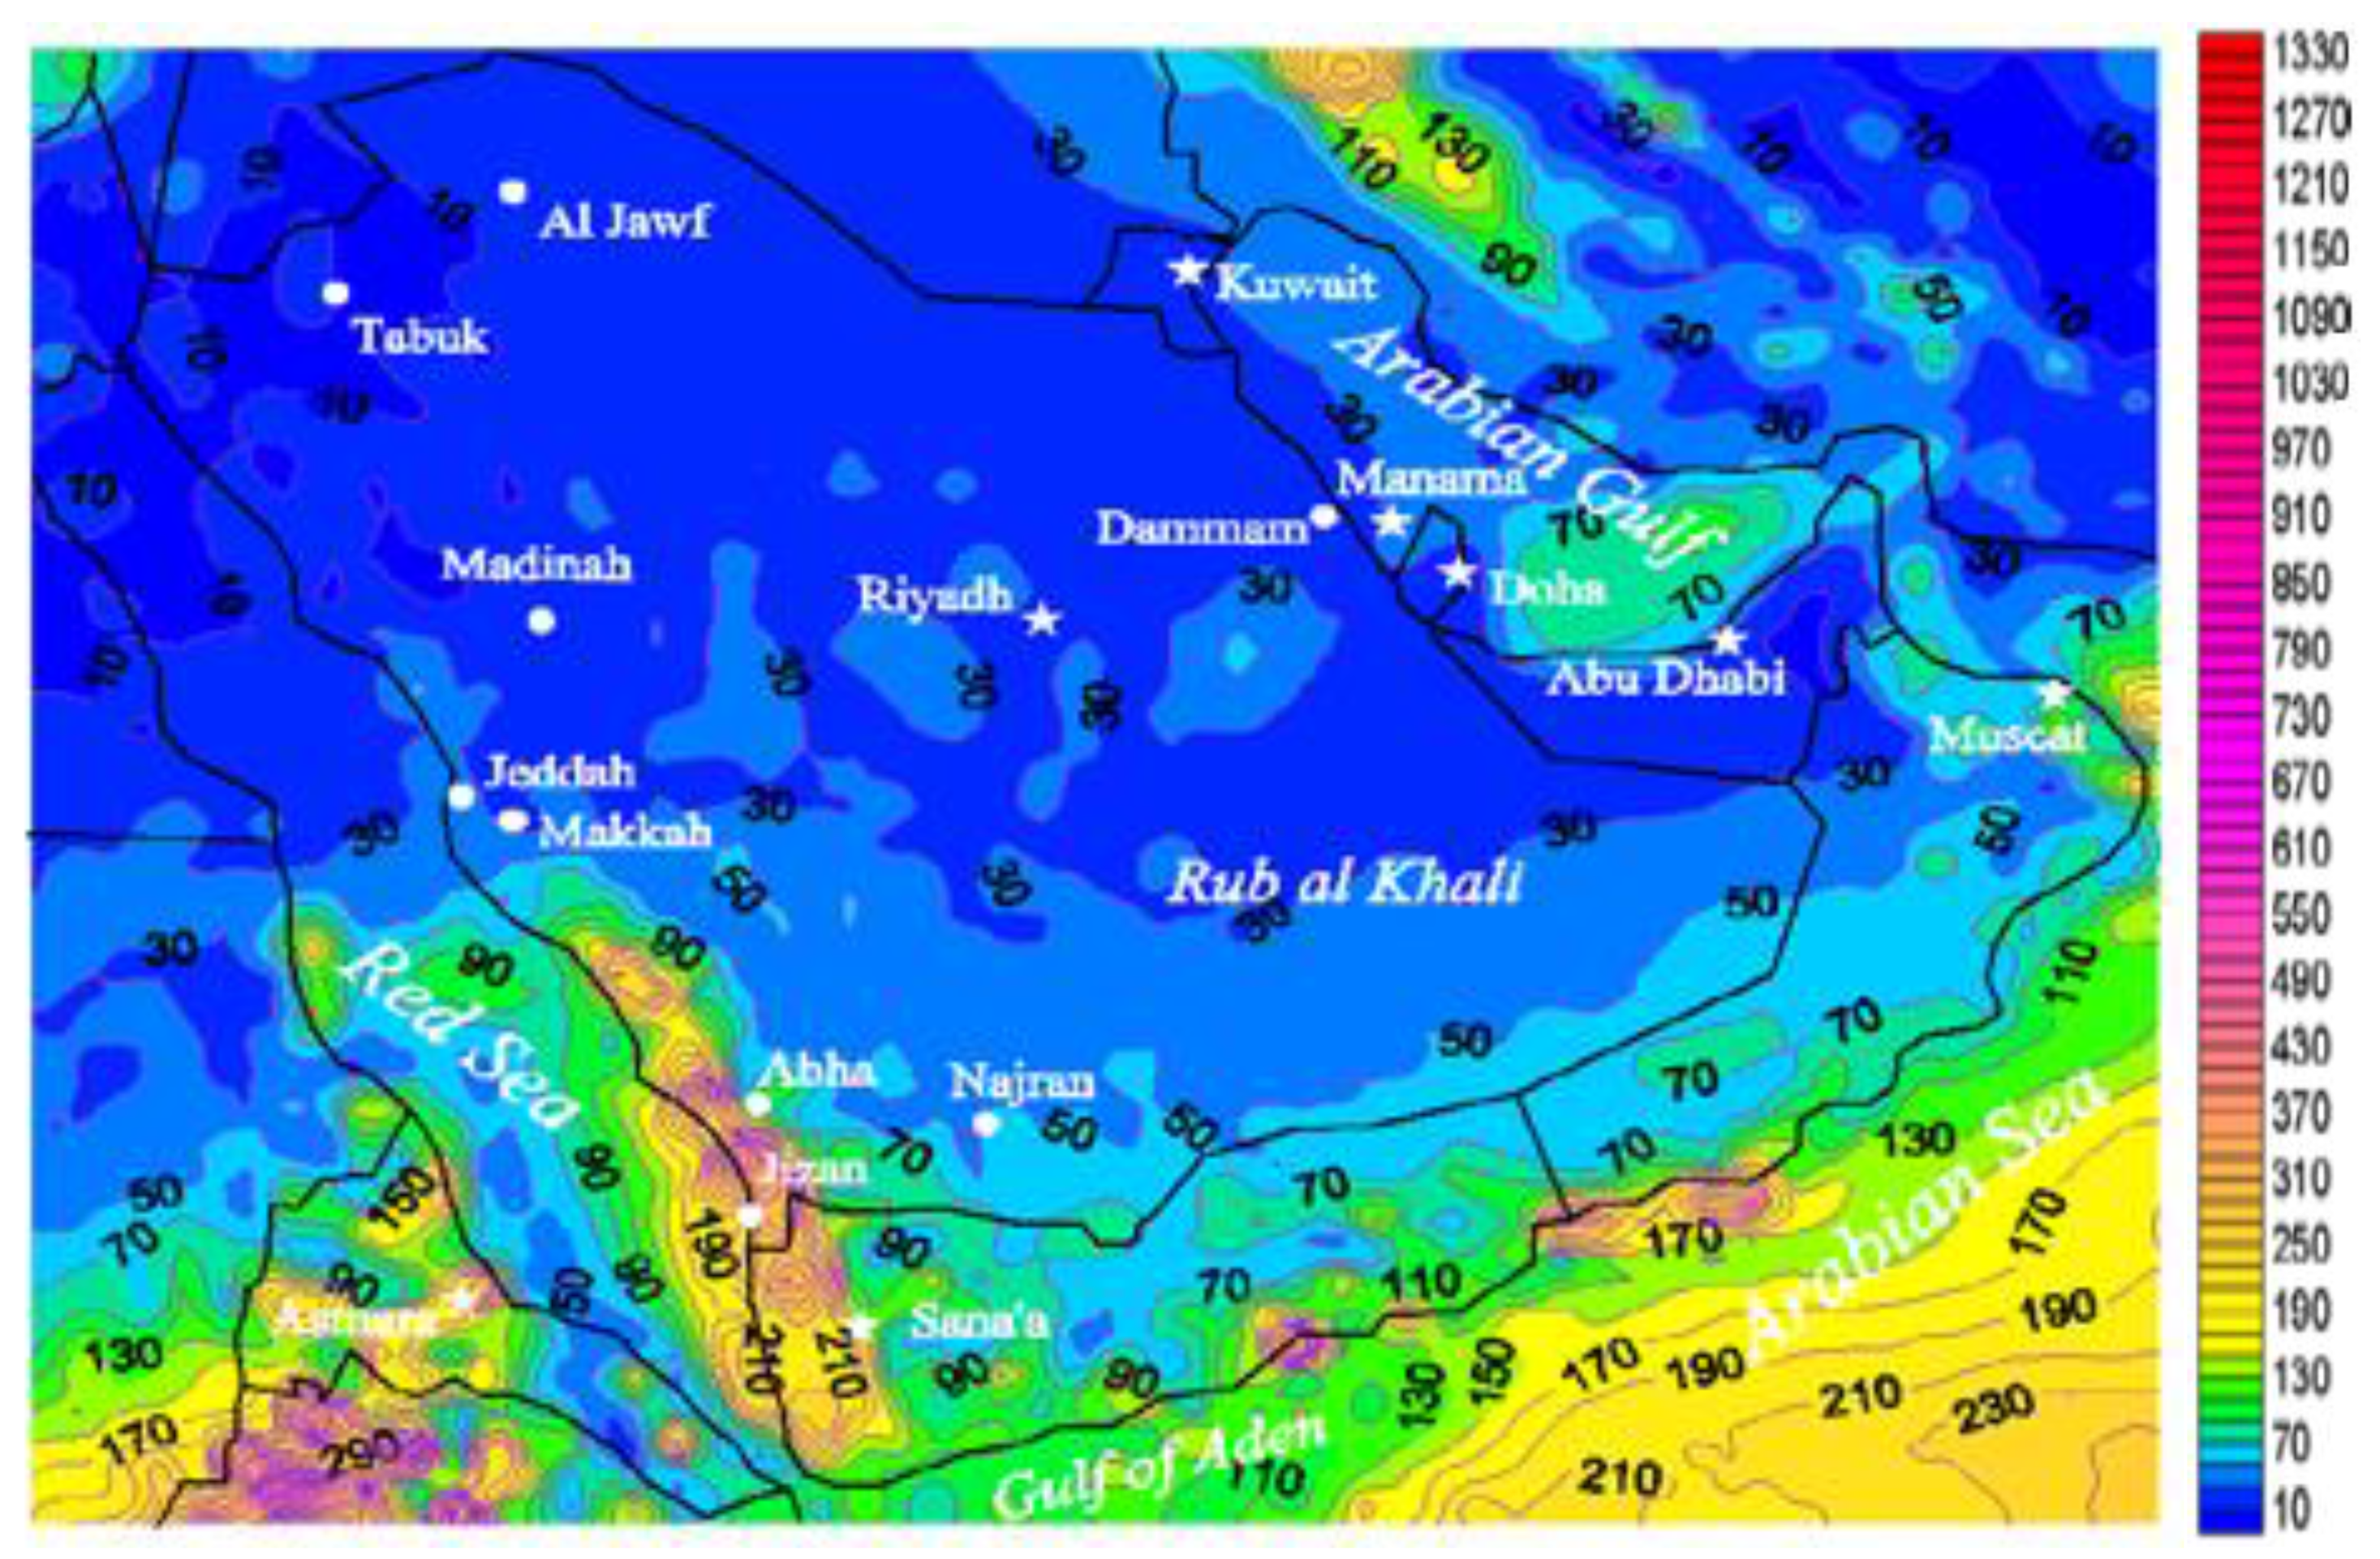
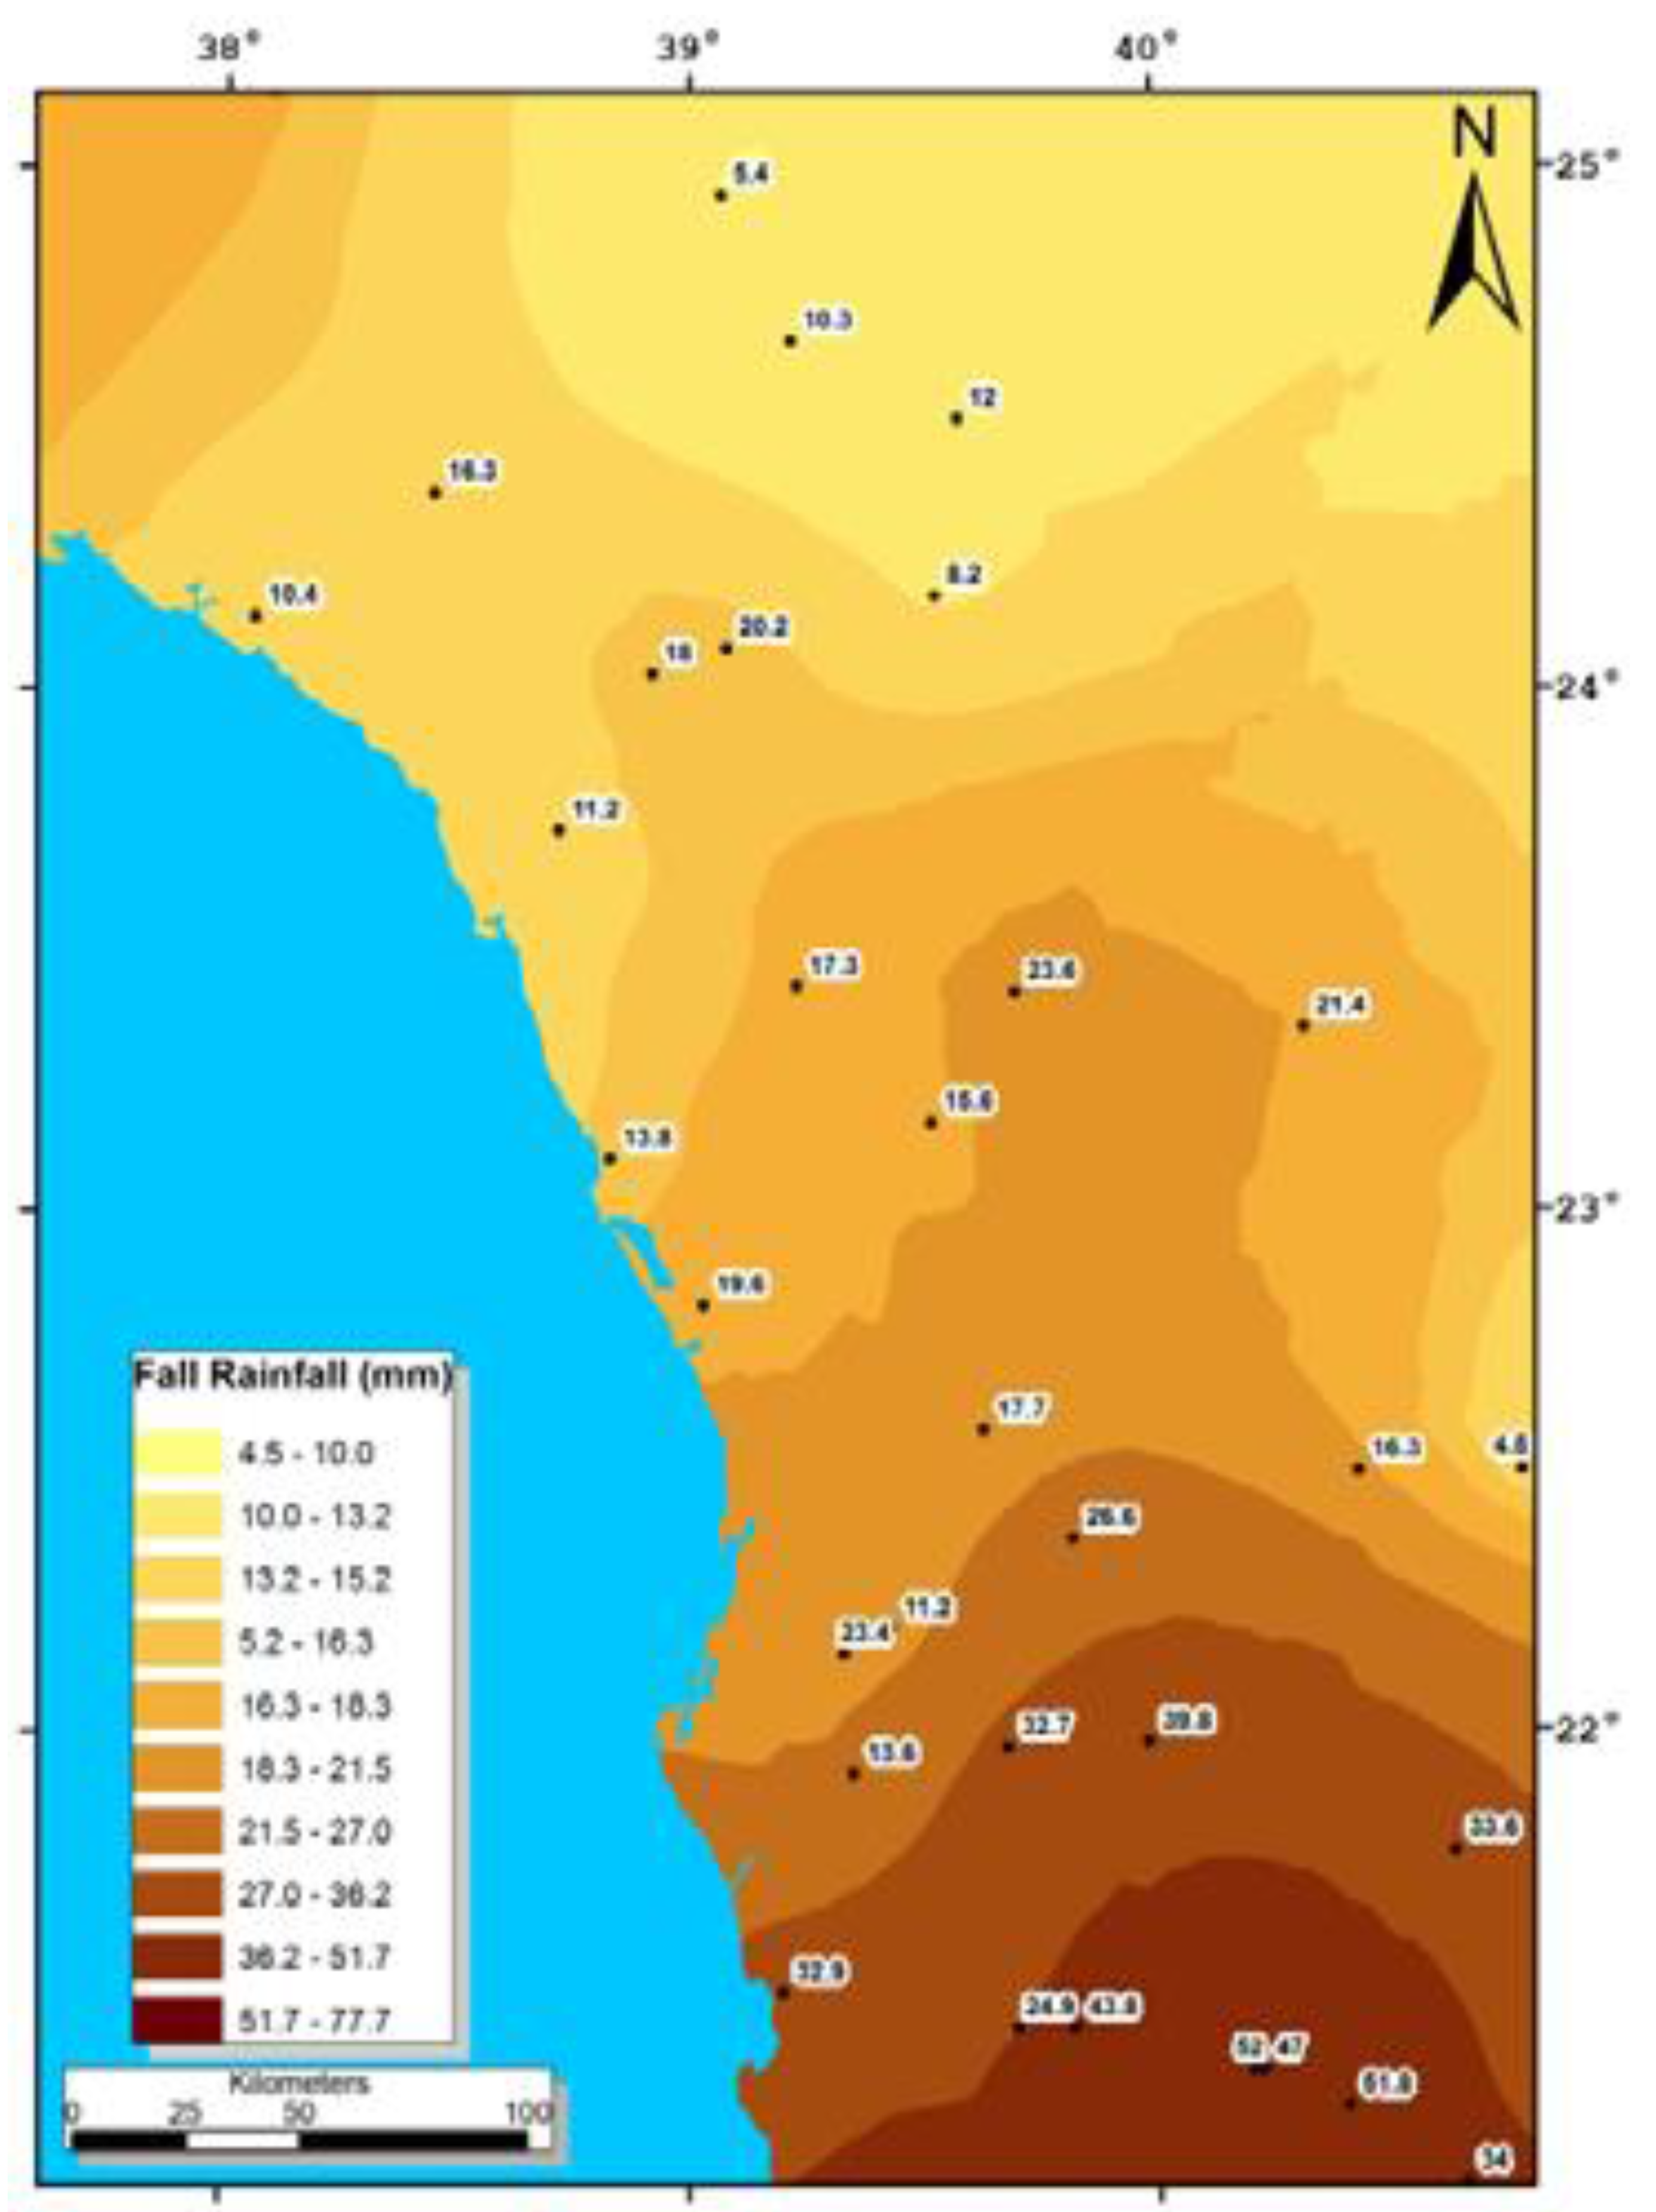
  • During fall (September–November): the pattern of rainfall (Figure 13) is similar to that of winter, because the southeasterly air stream weakens as a result of increasing outbreaks of northwesterly air streams. The highest rainfall (50 mm) is in the scarp mountain areas of the Taif area and decreases gradually towards the north. The Red Sea coastal area receives (Figure 13) a good amount of rainfall decreasing from south to north (from 30 to 10 mm). Areas within more than 20 mm isoheight are relevant for less groundwater recharge due to the previous dry summer season. However, the area is also subject to flooding.
Figure 9. Rainfall-elevation relation in the study area [12].
Climate 03 00578 g009
Figure 10. Isohyetal map for winter rainfall [12].
Climate 03 00578 g010
Authors in [18] examined variation of precipitation with altitude. Topographic variation can be quite noticeable in some regions of SA (Figure 14). Figure 15 represents the upward trend of precipitation with elevation. Najran station altitude is 1213 m; however, low rainfall is observed (No. 28, Table 3). This may be due to the location of this site on the leeward side of a mountain (No. 28, Figure 14).
Figure 11. Isohyetal map for spring rainfall [12].
Climate 03 00578 g011
Other towering stations—for instance, Al-Baha, Taif, Abha and KhamisMushait—receive great quantities of precipitation (Nos. 20, 22, 26 and 27). Gizan altitude is only 4 m above mean sea level, but it receives a large quantity of precipitation. It is situated on the windward side of the southwest tip, through which precipitation systems shift to SA throughout both the wet and the dry seasons.
Figure 12. Isohyetal map for summer rainfall [12].
Climate 03 00578 g012
Al-Qaysumah (No. 7), Hafer-Albaten (No. 8) and Gassim (No. 10) also get great precipitation quantities because their positions, during those systems, move toward SA throughout the wet season. The precipitation rises with the rise in elevation in general [18]. This feature is differing to the precipitation change in elevation in Nepal [22]. Therefore, SA precipitation at the higher altitude is heavier than at the lower altitude, and this is reflected in the small quantities of precipitation in the eastern regions of the SA (Figure 6c). In addition, there was very little rain in the Rub Al-Khali. Comparing Figure 6c with Figure 16, one can find a general decrease in rainfall over SA, especially in the southwest region.
Figure 13. Isohyetal map for fall rainfall [12].
Climate 03 00578 g013
Authors in [37] studied the relationships between precipitation and height of the land in SA. In the period between 1971 and 2005 for 180 rain stations, the precipitation monthly data were modeled and the results were compared and critically evaluated. The global ordinary least square results could account for about 54% of the variation for springtime precipitation, but for the annual and other seasonal data set only accounting for less than 11% of the variation the results were unsatisfactory. Conversely, the local geographically weighted regression could account much better for the annual and seasonal rainfall, which the spatial variation is 64% to 83%. In the southwest region along the escarpment ridge of the Asir Mountains, in the western region along the Hijaz Escarpment and through a moderate relationship along the Tuwayq Mountains, the positive association between altitude and precipitation was most marked. In northern, northeastern and central regions, the model was not such a good fit because much of the variance remained unexplained in those regions, and other variables would have to be introduced into the model to get better results. The stations at higher altitudes do not always receive more precipitation; some places with low altitude receive more precipitation such as the eastern and northeastern areas during the wintertime where the rainfall is primarily due to the influence of the passage of cyclones coming from the Mediterranean Sea.
Figure 14. Rain-gauge locations over Saudi Arabia (asterisks marks). The number represents serial of observation site as per Table 3. Horizontal and vertical dashed lines make the NE, NW, SE and SW zones (counter-clockwise) used in the regional analysis [18].
Climate 03 00578 g014
Authors in [37] concluded that, in terms of spatial estimation and prediction, a global model such as global ordinary least square gave a less better account than using a non-stationary local model such as GWR. In addition, the results could have significant inferences for rainfall-runoff studies in the SA. Further research on this topic in Saudi Arabia should therefore focus on including more independent variables such as proximity to moisture source, air mass movements and wind direction, temperature, and pressure.
Figure 15. The variation of rainfall (mm) with altitude in Saudi Arabia. The rainfall values are averaged over 1998–2009 [18].
Climate 03 00578 g015

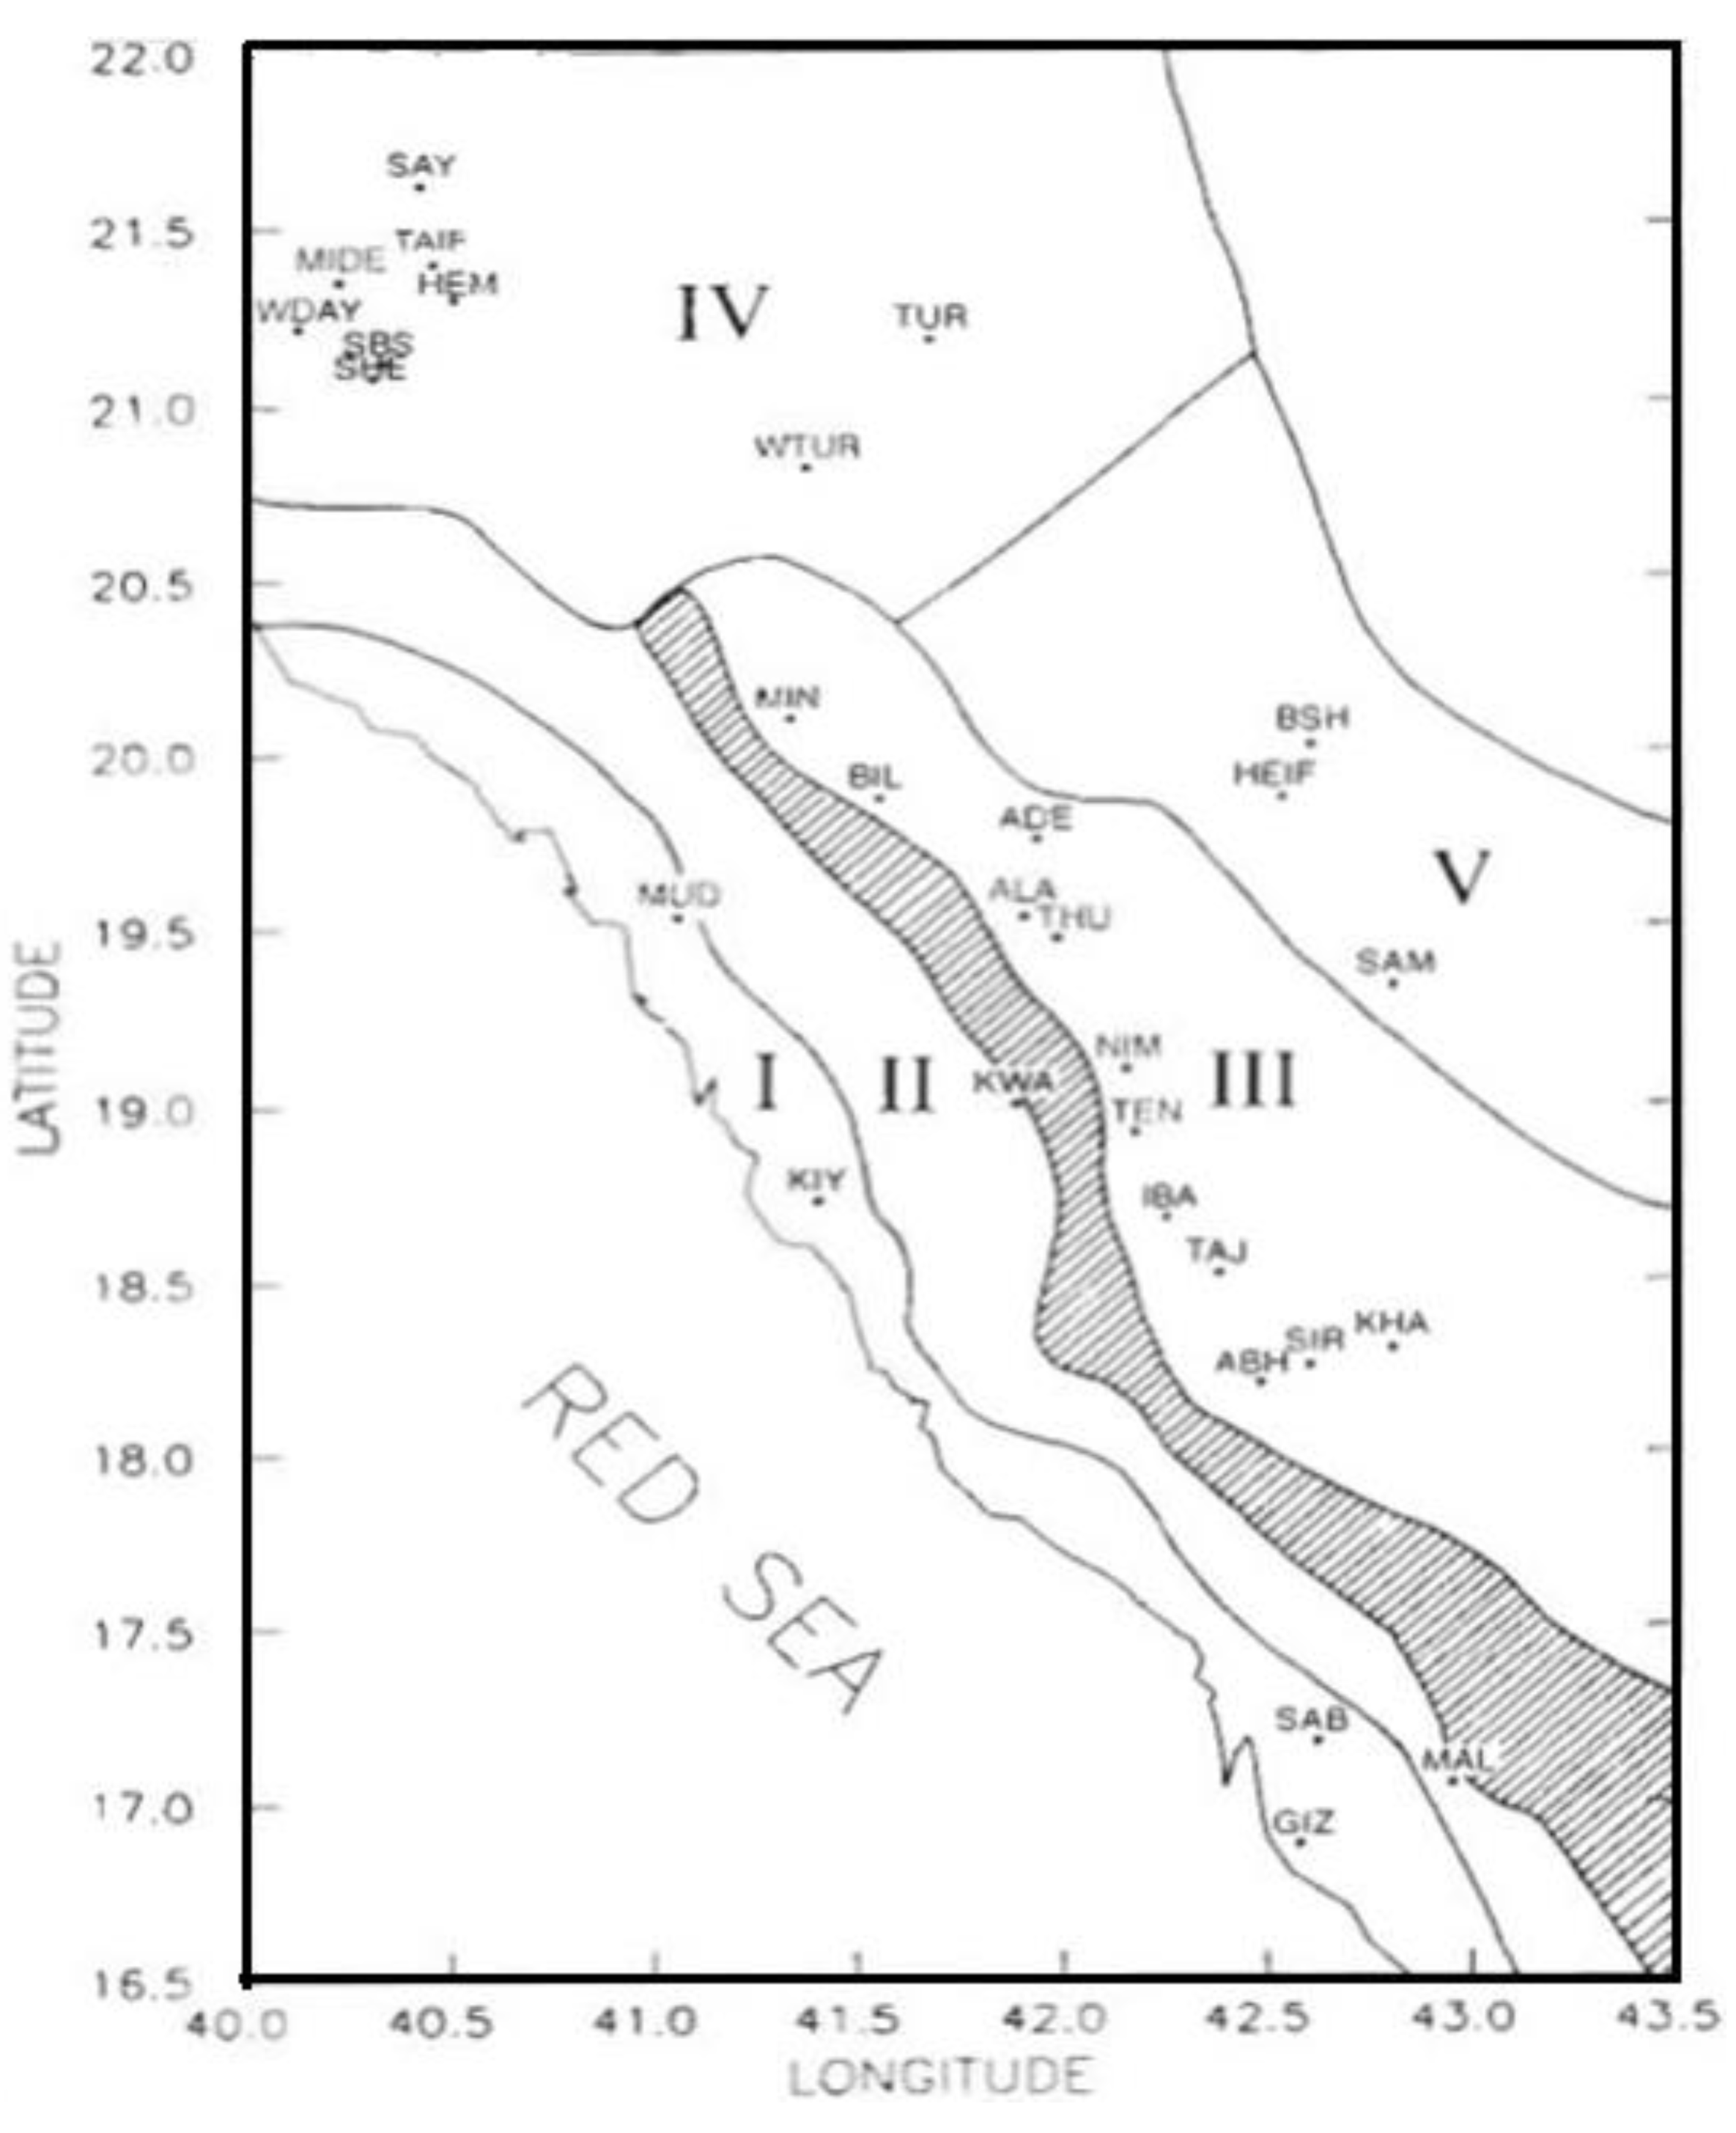
3.3. Precipitation Variations with Regions

Rainfall variability in the different regions of the SA is studied by [18]. Thus, the four regions, named northeast, northwest, northeast and northwest, are defined in Figure 14. In the northeast areas, precipitation chiefly happens through the wintertime (December to February) and springtime (March to May), that results in great quantities of precipitation in the wet season, approximately 95% compared to only a few millimeters of precipitation in the dry season, approximately 2% (Figure 16a). In the northwest region (Figure 16b), the impact of the different seasons is similar to the northeast area; the dry and the wet seasons receive about 4% and 82% of the total quantity, respectively. In the southwest region, the precipitation features differ from the other regions; all seasons participate in the total quantity of this area's precipitation (Figure 16c). The Tropical Rainfall Measuring Mission (TRMM) overvalued the precipitation in each of the four seasons except winter compared with the observed 29 weather stations, which was affected by an underestimation for the wet season. Furthermore, in all seasons, the quantities computed by the TRMM follow the trends of the observed data. The northeast area received the greatest quantity of precipitation in the wet season (approximately 95%), and the southwest area received the greatest quantity in the springtime season (approximately 43%) in general. The TRMM observed data for the annual precipitation is as follows: 32.58 (33.39%) in the northeast, 21.95 (22.18%) in the northwest and 45.47 (44.43%) in the southwest areas.
Rainfall analysis of the southwestern region of SA is investigated by [14]. They found that the whole area of the country can be classified as having a hot desert climate according to Köppen classification. The southwestern area is an exemption wherever a mild steppe climate prevails. In this area, precipitation is more frequent in wintertime and springtime than in summertime and autumn time. The influence of topography on precipitation and temperature is very diverse. Consequently, the southwestern region of SA is characterized by distinctive climatic and topographic features. It receives more precipitation than any other region. The distribution of the wintertime precipitation exhibits steadily decreases in the lowlands on the eastern and western sides. Meanwhile, maximum values in the northern region of the flat terrain are found. In addition, coastal and low-altitude stations receive little amounts of precipitation. According to the altitude above mean sea level and the mean annual precipitation (Figure 17), one can classify the southwestern region of SA into five areas. In the study area, the normal and the gamma distributions are generally best described to the rainfal1 distributions. The inter-annual fluctuation illustrates that precipitation distribution above the southwestern area is not homogeneous [14]. Many factors influence precipitation irregularity, such as orientation, topographic pattern and elevation. Precipitation fluctuation in the study region is high [38]. Over sixty-three representative stations throughout the southwest region for a twenty-one year period that covering different micro-climate conditions, high fluctuations in regional precipitation evaluation happens in the mountainous regions, whereas the variance decreases in shadow regions in all seasons. The fluctuation of the precipitation evaluation accuracy decreases from wintertime to autumn time [15].
Table 3. The station names with latitude, longitude, altitude and annual rainfall. Serial number (No.) of stations is used [25].
No.Station NameLat (°N)Lon (°E)Altitude (m)Annual Rainfall (mm)
1Turaif31.6838.7385284.17
2Guriat31.4037.2850446.66
3Arar30.9041.1455058.60
4Al-Jouf29.7840.1067054.63
5Rafha29.6243.4944585.07
6Tabuk28.3736.6077028.70
7Al-Qaysumah28.3346.12360125.53
8Hafer-Albaten27.9045.53412123.10
9Hail27.4441.691000113.72
10Gassim26.3043.77648143.88
11Dammam26.5049.801080.29
12Dhahran26.2650.162290.23
13Wejh26.2036.472024.96
14Al-Ahsa25.3049.4918084.78
15Riyadh New24.9246.72612110.59
16Riyadh Old24.7146.7361086.79
17Madina24.5439.7063063.63
18Yenbo24.1438.06830.26
19Jeddah21.7139.181852.06
20Taif21.4840.551455172.17
21Makkah21.4339.79273110.63
22Al-Baha20.2941.641655142.61
23Bisha19.9942.61116788.68
24Wadi-Aldawasser20.3045.1261725.46
25Sulayel20.2845.37616Not used
26KhamisMushait18.2942.802047190.55
27Abha18.2342.662100229.14
28Najran17.6144.41121360.43
29Sharurah17.4747.1272770.29
30Gizan16.9042.58128.644
Figure 16. The comparison of the TRMM and the observed rainfall (mm) in the different seasons for (a) NE region, (b) NW region, and (c) SW region [18].
Climate 03 00578 g016
Figure 17. The five climatic regions in the southwestern part of Saudi Arabia, classified according to height above mean sea level [14].
Climate 03 00578 g017

4. Rainfall Prediction over Saudi Arabia

Authors in [39] used PRECIS Regional Model to predict the elements of climate such as temperature, and rainfall. Two runs of the PRECIS model were accomplished, the first one was for the period 1972–2001 (Figure 18) and the second for the period 2070–2100 (Figure 19). From the results of the two runs, one can conclude that: generally, for the period 1972–2001, the spatial distribution of the annual total rainfall differs from that for the period 2070–2100 (Figure 19), particularly above the central and northeastern areas wherever lower values prevailed. On the other hand, no change in the distribution has been observed above the northwest province and the empty quarter (low values) and above the southwestern mountain range (high values). From Figure 19, one can depict the spatial pattern of the mean annual total rainfall changes after 100 years of the baseline period, three quarters of the SA (chiefly northern, eastern and central areas) will undergo extreme dryness. The rise in precipitation will be limited only to the southern (Sharourah), the southwestern (Jizan) provinces and to Asir mountains (Abha). A comparison between the above findings with the trends of the total annual rainfall distributions of the baseline period (1978–2003) and the change occurred in the total annual rainfall after 50 years as obtained in the [40], a clear gradual expansion of the rain reduction areas toward the south is found. This reflects the continuous mode of this change leading eventually to the 2070–2100 distribution.
The changes of relative rainfall on an average annual basis from 2070 to 2100 are shown in Figure 20. The precipitation will decrease from December to June in the entire SA. However, between July and November, a decrease in rainfall in the northern region and an increase in rainfall in the southern region of the SA is predicted. The central area close to the Arabian Gulf has the highest decrease in rainfall during the wintertime season from 30 to 12 mm, and in other areas of the SA, the decrease remains among10 and 3 mm. The area of highest decrease appears from the coastal zone in the northeast in that in the southwest. In the central area of the SA, the highest decrease in rainfall is ranging from 30 to 20 mm from March to May, and somewhere else, the decrease in rainfall will be in the range of 12 to 3 mm. In June, approximately no change of rainfall will happen from past to future stages in the whole SA. From July to October, an increase of 3 to 100 mm happens in the south; in July and August, the highest increase is in the southwest coastal zone near Jazan and Abha. In November, an increasing around 3 mm in the south, while in the northern part a decrease around 3 mm is found. The areas with high altitudes have a relatively high decrease of rainfall in wintertime seasons but a high increase in the summertime. The annual total rainfall decreases in most regions of the SA and only increases in the south. The highest increase, from 400 to 600 mm, shows in the southwest coastal zone near Jazan and Abha, whereas the highest decrease, from 100 to 120 mm, is shown in the part around Riyadh. These numbers appear to be unrealistic considering low rainfall in the whole SA.
Figure 18. Annual Total Precipitation from the 1972–2001 run [39].
Climate 03 00578 g018
Figure 19. The spatial distribution pattern of the mean annual total precipitation over the 2070–2100 period [39].
Climate 03 00578 g019
Figure 20. Annual Total Precipitation Change from 2070 to 2100 (mm/yr) [39].
Climate 03 00578 g020
Examination of the spatial patterns of the seasonally averaged rainfall exhibits (as revealed in Figure 21 for wintertime, Figure 22 for springtime, Figure 23 for summertime and Figure 24 for autumn time) that the summertime precipitation will be the highest between other seasons over the southern, the southwestern provinces and Asir mountains, wherever the present rainfall regime is characterized by two crests (one in summertime and another stronger in the springtime). This result has a significant synoptic implication, especially when compared to the springtime value, as rainfall there is a strong relationship with the average position and the north—south movement of the “Inter Tropical Conversion Zone”(ITCZ) above those areas. Compared to other seasons, wintertime rainfall will remain the lowest.
Figure 21. The spatial distribution pattern of the mean total winter precipitation over the 2070-2100 period [39].
Climate 03 00578 g021
Figure 22. The spatial distribution pattern of the mean totalspring precipitation over the 2070–2100 period [39].
Climate 03 00578 g022
Figure 23. The spatial distribution pattern of the mean totalsummer precipitation over the 2070–2100 periodprecipitation [39].
Climate 03 00578 g023
Figure 24. The spatial distribution pattern of the mean total autumn precipitation over the 2070–2100 period [39].
Climate 03 00578 g024
Authors in [41] used the regional climate model (RegCM3) for the simulation of intense rainfall events over the Arabian Peninsula. The RegCM3 results perform well in reproducing the mean seasonal and annual rainfall in addition to the contrast between dry and wet years in terms of the quantities and the sites of the rain bands. RegCM3 model is comparatively well when ERA40 is used at the boundaries in the smaller domain, showing the importance of the strong impact of the boundary forcing needed to capture these intense rainfall events around the region (Jeddah city as an example).
Authors in [42] used the PRECIS model to predict rainfall over SA for the future period from 2021 to 2070 with respect to the base period ECHAM5 A1B data (1971–2000). The results of PRECIS are in good agreement with the IPCC precipitation projection for the Arabian Peninsula (IPCC, 2007). The results exhibit that the northern and central areas tend to be drier, but the southeastern parts are likely to be considerably wetter, which may lead to an increase in the number of extreme events. Moreover, PRECIS-ECHAM5 (for both 2021–2050 and 2041–2070) exhibits increases in precipitation for the Red Sea coast, where Jeddah is located, exposing this city also to an increase in the number of extreme events in the future.
Authors in [43] evaluated the possible influence of climatic change on SA's water supplies and agriculture using climatic change scenarios from GCMs (General Circulation Models). The results indicate that an increase in temperature and a decrease in precipitation could have a major negative influence on water supplies and agriculture in SA.
Decreases in rainfall are projected over SA, in common with the majority of the Middle East using A1B emissions scenario (Met Office [44]. Decreases of up to 20% or higher are projected in the northwest of the country, with strong agreement across CMIP3. Smaller decreases towards the south and east, while increases of up to 20% or more of the far southeast are projected.
Authors in [45] divided SA into five geographical regions: northwestern, southwestern, western, central, and finally, eastern with central and used two techniques derived from the point cumulative semivariogram (PCSV). These methods are applied to data from 21 weather stations in the five regions for a 35-year period from 1970 to 2005. The absolute error between observed values and the predicted values does not exceed 13 %, except in the central region, where the absolute error is 18 % using both methods.
Authors in [35] studied the prediction of autumn rainfall over the western area and winter rainfall over the eastern area of the SA. They used the meteorological height (Z), temperature (T), sea surface temperature (SST) and southern oscillation index (SOI) as independent variables (predictors). The forecasting method of rainfall is based on deducing an empirical formula relating autumn rainfall with these meteorological variables of the preceding august. Rainfall can be predicted by the equation as follows:
R a i n = 2729.98 + 4.53 × Z ( 7 ) 103.48 × S S T ( 7 ) + 40.85 × S O I 20.10 × T ( 2 ) 20.26 × S S T ( 5 ) + 0.85 × Z ( 9 )
where the numbers such as 2, 5, 7, and 9 in the above equation represent the number of steps that the predictor used in each step. Thus, the rainfall over the western area of SA is affected strongly by the position and strengthens of the Siberian and subtropical high pressure and also by the southern oscillation index.
Authors in [46] used the wavelet technique to calculate the climate predictability indices of daily average time series of surface pressure, air temperature, and rainfall for four coastal regions (viz., Dhahran, Gizan, Jeddah, and Yanbu) spread over the east and west coasts of SA. The climate predictability indices of rainfall and wind speed time series were established to be independent of the pressure and temperature. The predictability indices of individual factors were established to have persistence behavior for the whole dataset whereas anti-persistence for wintertime and summertime datasets.

5. Circulation Systems Affect the Climate of Saudi Arabia

Atmospheric circulation variability is the most vigorous factor determining variations in the spatial pattern of temperature, cloudiness, rainfall and other climatic elements. Natural climate fluctuation is itself completely substantial in the area. While ENSO, a central source of inter-annual climate change above a great deal of the globe, seems to have either a conflicting e.g., [47,48] or weak e.g., [48] impact on the climate of the area. The teleconnection of ENSO has in fact elongated its reach into the AP (e.g., [48]. On inter-annual and decadal time scales the NAO atmospheric circulation pattern comes, by contrast, to reveal a clear impact on the climate of the area [49]. The Indian Ocean monsoon is one of the Earth’s major weather systems. The western margin of monsoon circulation influences on the Southern Arabia climate, which controls the amount of precipitation and the wind field effective the terrestrial environments. Local and Regional climate in mid-latitude are effected by both surface features and large-scale atmospheric circulation (e.g.,[50]). As the spatial pattern of surface features is somewhat stable, it would be predictable that large-scale climate plays a significant role in producing variations in local climate. Studies of local climate variability are predominately associated with changes in the atmospheric circulation (e.g.,[51]). An index of large-scale circulation characteristics can be helpful in illustrating variations in climatic elements (e.g.,[52]).
The weather in the AP (including SA) is dictated by the Hadley circulation with superimposed influences of global circulation patterns of the ENSO, designation of origin. NAO, IOO, and PDO type, and seasonally controlled by four air masses. Because these indices never take place in isolation, but are interwoven into a larger fabric of weather functioning of the planet, it is of some practical interest to assess what combinations of them lead to particular weather patterns [53].
Aridity in a mid-latitude or subtropical desert area—for example SA—is frequently linked to large scale subsidence affected by Hadley circulations and a position far away from an oceanic source of moisture [54]. Wintertime synoptic disturbances from the Mediterranean Sea carry moisture to the area, being close to the mid-latitude storm track. A local increase of such disturbances is a major reason for precipitation there in wintertime. On the other hand, the monsoon system in the neighboring Indian Ocean has a strong influence on the summer climate of this area, once most of it is ruled by a surface thermal depression that extends from the depression of Indian monsoon.
Because of tropical and extra-tropical climatic episodes such as ENSO and the Indian Ocean dipole, inter-annual change of seasonal atmospheric moisture above SA is caused by change of global and regional circulation disturbances, [55]. Many authors [56,57,58] discussed the influence of ENSO on the Indian summertime monsoon. The influence ofENSO on the Indian Ocean region through changes in the Walker circulation is explained by [54]. During an El Niño episode the warming of the SST in the central and eastern Pacific reduced easterly trade winds and shifted the tropical convection eastward [54]. Any variation in the Walker circulation above the Indian Ocean can be predicted to impact the moisture supply to the monsoon system as well as to the coast of SA neighboring to the Somalian jet.

5.1. Influence of the ENSO on the Climate of Saudi Arabia

In the Middle East region, including the SA natural climate variability is quite sizable. A central source of inter-annual climate variability over much of the globe is the ENSO events [e.g.,47,48,50]. In recent decades [50,59,60,61,62,63] it has been indicated that the teleconnection of ENSO has indeed extended its reach into the Middle East region. They noted an increase in the impact of El Niño on rainfall patterns in the middleeast.
Autumn (winter) in Southwest Asia (the traditional European names of the Middle East and the Near East) has precipitation above (below) normal during El Nino (La Nina) as observed by [64,65]. Anomalous onshore moisture flux from the Arabian Sea into Southwest Asia during El Nino (La Nina) periods is of above (below) normal precipitation in southwest Asia. In addition, in SWA, rainfall anomalies appear connected to moisture flux anomalies in the Indo-Pacific region and the anomalous circulation over south Asia.
Authors in [63] explained the role of the Indian and Pacific oceans in the climate variability of the Middle East. He lamented that, due to huge amounts of heat inserted into the tropical Pacific atmosphere during periods of higher than normal SSTs, the wind circulation changes from surface to upper levels affecting the whole globe. El Niño conditions weaken the Indian monsoon and warm the Arabian Sea, thus weakening the pressure gradient and decreasing the wind speed and vice versa, bringing more rainfall in the region [63]. However, there is need to study more about the impacts of ENSO on precipitation in different parts of the region.
Over a 40-year period from 1968 to 2007, different scales from seasonal to long term scales [66] investigated the connections between the weather of the Arabian Peninsula and the mid-latitude blocking anticyclone. The Arabian Peninsula surface weather throughout the months from October to December is influenced more by the happening of mid-latitude blocking anticyclones in the existence of all El Niño phase.
The relationship between climatic indices such as NAO, SOI and El Nino 3.4 and the climatic elements over SA in summertime in the period from 1948 to 2012 is investigated [67]. During the period from 1979 to 2011 (Figure 25), it is observed that the rainfall is associated with SOI ( r   =   0.4 ) over SA.
During the period from 1979 to 2011, the precipitation rate is correlated with ENSO ( r   =   0.3 ), as revealed in Figure 26. In addition, results of [68] illustrated that the weather in SA was controlled by two abnormal weather regimes throughout the period of persistence of blocking system over Europe in summer 2010. The first is the European blocking system and negative anomaly of the NAO. The second is the positive anomaly of SOI and negative anomaly of ENSO.
The inter-annual change of moisture flux exhibits that it is strongly modified by a tropical climate phenomenon like positive IOD and warm ENSO episodes [48]. Throughout these climate episodes, the transport of moisture from the Red Sea to the mountainous area of Asir territory is increased, and, as a result, precipitation throughout November to April is enhanced. The influence on the moisture transport to the SA area of the Red Sea side (AB and EF, Figure 27) for both positive IOD and the warm ENSO events is stronger than other sides. The positive IOD and warm ENSO show the highest relationships with moisture flux from the Red Sea side. Numerical experiments by AGCM approve the results from NCEP-NCAR, [68]. In all GCM experiments, the vertically integrated moisture transport anomalies are noticeable throughout November, December and January. It is also obvious that throughout pure positive IOD year, both the South Atlantic Ocean and the North Atlantic Ocean contribute moisture transport to SA, whereas, throughout an ENSO year, the South Atlantic is the main contributor. The inter-annual change of the winter rainfall is related primarily to the teleconnections originating from tropical climate phenomena similar to IOD or El Niño. The main finding of the [54] study is the significance of the impact of a concurrent positive IOD and a warm ENSO event of the inter-annual change of the incoming moisture flux over SA. This is important for the understanding of climate impacts in desert amelioration.
Figure 25. The distribution of the linear correlation coefficient between surface CMAP precipitation (enhanced) over SA and SOI through the period from 1979 to 2011 in summer season [67].
Climate 03 00578 g025
Figure 26. The distribution of the linear correlation coefficient between surface CMAP precipitation (enhanced) over SA and ENSO through the period from 1979 to 2011 in summer season [67].
Climate 03 00578 g026
Figure 27. Domains for moisture budget analysis [30].
Climate 03 00578 g027

5.2. Impact of the North Atlantic Oscillation (NAO) on Saudi ArabianClimate

NAO is strongly impacted on regional and local scales. A simple NAO index defined as the difference between the normalized mean sea level pressure (SLP) anomalies during December-March at the positions representative of the relative strengths of the Subtropical High and Icelandic Cyclone. A lower than normal Icelandic Cyclone and higher than the normal Subtropical High result in an increased pressure gradient and a positive NAO index and vice versa is investigated. Throughout this positive NAO (negative NAO) phase, wintertime storms and surface winds moving from west to east across the North Atlantic are stronger (weaker) than normal [69]. Swings in the NAO produce alterations in wind speed and direction over the Atlantic ocean that significantly alters the transport of moisture and heat [70].
Inter-annual to decadal fluctuation in Middle Eastern temperature, precipitation and streams flow reflect the far-field affect the NAO, a central mode of Atlantic sector climate fluctuation [49]. The fluctuations in the Middle East area and their association with large-scale distribution of climate fluctuation is investigated by [71]. He was able to document the importance of at least two different distributions of the climate of the Middle East. One of these distributions is connected to the NAO and dominated by inter-annual and decadal timescales. The other distribution is different from the NAO and more consistent with the atmospheric response to multi-decadal oceanic fluctuations [72,73,74]. This suggests that patterns not easily resolved in the short instrumental record (in particular, patterns distinct from the NAO) may be of increasing relative importance of progressively longer timescales and are important to understanding climatic variations in the Middle East on multi-decadal and longer timescales.
The relationship between the Northern Hemisphere annular modes (NAO or Arctic Oscillation, AO) and Eastern Mediterranean/Middle East climate variability in past centuriesis found [49,71,75,76,77,78,79]. Throughout the late Holocene and last interglacial period 2900 and approximately 122,000 years ago, respectively, the combined analysis of proxy records derived from fossil corals of the northernmost Red Sea and simulations with a coupled atmosphere-ocean circulation model (ECHO-G) revealed an AO/NAO affect the region’s inter-annual and mean climate [80]. This combined analysis of the proxy record and instrumental climate data revealed that the region’s inter-annual to decadal climate variability is controlled by a high-pressure anomaly over the Mediterranean Sea that is linked to the AO/NAO, especially throughout the winter season. This high-pressure anomaly favors an anti-cyclonic flow of surface winds over the eastern Mediterranean, thereby controlling the advection of relatively cold air from southeastern Europe towards the northern Red Sea [77].
Authors in [67] study the association among the weather elements above SA and climatic indices such as NAO, SOI and El Nino3.4 in summertime seasons in the period (1948–2012). Precipitation is associated with the NAO with significant positive correlation coefficient ( r   =   0.4 ) during the period 1979–2011 as revealed in Figure 28.
Figure 28. The distribution of the linear correlation coefficient between surface CMAP precipitation (enhanced) over SA and NAO through the period from 1979 to 2011 in summer season [67].
Climate 03 00578 g028

5.3. The Role of Pressure System on Saudi Arabian Climate

Changes in pressure system, low Pressure (Indian monsoon low, Sudan low) and high Pressure (Subtropical High and Siberian High Pressure) play an important role in AP Climate. Changes in local climate may be responding to variation/or changes in circulation index strength and may also be because of competing effects from other circulation kinds. Some of the change in the correlation between circulation and temperature may be because of different circulation kinds impact temperature. Whereas zonal circulation ordinarily has a dominant impact on temperature, there were epochs, for example the 1920s, when meridional circulation appeared to have greater impact [81]. Authors in [82] investigated that the variations of the Azores High make changes of the NE trade winds on its southern edge and then impact the tropical North Atlantic SST anomalies. The atmospheric circulation cell variations cause anomalous ascending motion in the tropical North Atlantic. It decreases the sea level pressure and pushes the Azores High northward, then decreases the NE trade winds and latent heat flux. This enhances the tropical North Atlantic SST anomalies. Furthermore, [82] exhibited that the tropical Atlantic meridional gradient mode is related to the fluctuations of the Northern Hemisphere Hadley circulation in the tropical North Atlantic and southern tropical Atlantic.
Connected to the weakening of the westerlies and Trade wind systems, the Asian monsoon troughs deepened significantly, a situation suitable in general to the development of active monsoons. It is believed that the combination of these two features increased continental monsoons and implicit lowered vertical wind shear above the oceans would tend to increase the release of latent heat in the tropics, representing reinforced Walker and Hadley circulations, which may have been at least somewhat accountable for more aridity in subtropical land regions of both hemispheres throughout this period.
The existence of the Azores High pressure participates in decreasing the precipitation quantities (on an annual basis) between 15° and 30°N. However, a moderately heavy precipitation (80–150 mm) area persists in the middle-to-north of SA, and heavier precipitation (>150 mm) is obvious in the part of Yemen that prolongs up to southwestern SA and into southern Oman [19].
Throughout wintertime, the North African high pressure moves westward and the Siberian High makes northeasterly winds through the AP, transporting mild temperatures. The circulation in the Arabian Sea and Indian Ocean is anticlockwise, pushing warm water up the Arabian Gulf, supplying extra moisture for the wintertime precipitation. Whereas infrequent frontal systems from Europe through the Mediterranean and enter the AP, most lose their moisture before incoming Kuwait. Throughout the summertime, the ITCZ migrates north into the Arabian Sea, the Asian high pressure weakens, and a strong depression develops above northern India. The circulation in the Arabian Sea and Indian Ocean becomes clockwise, pushing warm water to the west coast of India. The clockwise circulation of the Azores High above North Africa makes strong westerly winds above the Mediterranean and northwesterly winds above the AP.
Throughout the past numerous years, the influence of monsoon condensational heating on the formation of the Azores High has been documented by many studies,e.g., [83,84,85]. The summertime subtropical circulation in the lower troposphere is featured by continental monsoon precipitations and anticyclones above the oceans. [84] described the duality among the low-level subtropical circulation monsoon and the condensational heating in the sense that either one would be very different without the other. The duration of the rainfall amount depends upon both locations of the ITCZ and the meridional SST gradient in the tropical Atlantic [66]. An obvious duality among the Azores High index and Indian monsoon low pressure index is found [85].
In the study of [35], the analysis of weather charts and observations during the winter season explained that there are some synoptic features that produce rainfall during their passage over our area, it can be summarized as follows:
(1) Travelling Mediterranean depressions from west to east, in connection with upper troughs and active phases of the subtropical jet as well as the polar front jet producing rainfall during their passage. Their potential for producing rain decreases generally from north to south over SA except for mountainous areas where the uplift acts as an exterior factor. Therefore, the distribution of winter rainfall shows maximum values in the northern part of the main plateau and gradually decreases in the lowlands on the eastern and western parts.
(2) The combination of the westerly frontal troughs bringing cold air from the northwest and warm, moist southerly air coming from Ethiopia and Sudan, and so a large amount of cloud develops along the area of convergence. Depending on the intensity of the low level convergence, these clouds can occasionally give the continuous rain for more than 24 hours or heavy showers with associated thunderstorm.
(3) The weather activity throughout the springtime (March–May) is strong over the eastern part of the Mediterranean, where the secondary of the main traveling depressions usually associated with sandstorms that reached and affected the SA area. Sometimes, these secondary Mediterranean depressions cause heavy rainfall in March when the cold air associated with these depressions meets the moist hot southerly air over our area.
During the summer season, there are some synoptic features that produce rainfall, and they can be summarized as follows:
(1) In some cases, the Inter-tropical Convergence Zone (ITCZ) moves northward to reaching 25°N associated with upper trough leads to extensive unstable medium level clouds and rainfall occasionally heavy over the south west of SA.
(2) The mountain ranges concentrate over the southwestern area leads to developing the clouds and thunderstorm activities. It created lifting of the moist air and formed the clouds on the lee side and gave us rainfall. In general, enhanced vertical motions, resulting from the low level lifting of air by orographic barriers, which in turn excite gravity waves (mountain waves), often lead to the formation of clouds and precipitation. The two most important orographic forcing mechanisms are thermal and mechanical in nature. Thermal circulations result from differential heating and cooling, which varies with the diurnal insolation on the mountain, while mechanically forcing produces a wave disturbance when stably stratified air is forced to rise over a topographic barrier. The mountain wave structures depend upon the direction and the speed of the airflow, the mountain height and width dimensions, as well as on the effective heating/cooling changes that occur during the day.
(3) The analysis of convective activity during June–August of the last few years and observing the frequency of occurrence of convective cloud at each day of July and August explained that the dominant pattern associated with the maximum convective activity is as follows:
At surface deep thermal low over SA area, the subtropical high extended more to the east, Siberian highs oscillated to the south, low pressure south west of SA, and maximum solar heating. Whereas inthe upper air: the Subtropical high extends southeastward to reach SA, and there is the existence of low pressure southeast of SA, and low trough over the red sea. These conditions, besides the effect of the mountains and the sea breeze and land breeze circulation, affect rainfall in summer season. As the northerly wind meets the southerly wind, there is a strong convergence, which causes strong vertical motion, and the moist air is forced upward. This causes water vapor to condense, as the air rises and cools, resulting in occurrence of convective clouds and heavy rainfall.
During the autumn months, the rainfall over SA is weak and occurs when the Sudan monsoon low coming from the southeast appears and affects the weather of the SA area. In addition, during this period, the SA area is affected by the early waves invading the Mediterranean. Sometimes these waves (depressions) cause rainfall when the cold air associated with these depressions meets the moist hot southerly air over our area.
Authors in [86,87,88] observed that the climatological pressure systems that dominated in the SA area in winter are the Siberian high, the red sea trough, the subtropical high and the westerly trough. While the pressure systems that dominated in the SA area in summer are the Indian monsoon low, the thermal low and the subtropical high. In the second transitional season (autumn), the pressure system that appeared and dominates are the Red sea trough, the Siberian high and the eastern trough. At upper air levels (500 hPa), the climatological pressure systems that dominate in the SA area during the continuous monthly period from May to October is the subtropical high. While in the other months, the zonal flow appeared and dominated.
Authors in [88] used the NCEP/NCAR global data to illustrate the relationship between climatic elements and the main pressure systems that affect the weather and climate of SA and also to investigate the influence of these pressure systems on surface air temperature and rainfall over SA in the winter season. They found that there are two primary patterns of pressure, which influence the weather and climate of SA. The first occurs in the case of strengthening the Subtropical high, weakening of the Siberian High, deepening of the Icelandic Low or weakening of the Sudaness low. During this pattern, the Subtropical High is joined with the Siberian High and an obvious increase of sea level pressure occurs over the southern European, Mediterranean, North African, and Middle East regions. This belt of high pressure prevents the interaction between middle latitude and extra-tropical systems, which leads to decrease of surface air temperature, relative humidity and rainfall over SA. The second pattern occurs associated with weakening of the Subtropical high, building of the Siberian High, weakening of the Icelandic Low ordeepening of the Sudan Low. The pattern arising in this case leads to an interaction between two different air masses, the first one (cold and moist) associated with the Mediterranean travelling depression from west to east, while the second one (warm and moist) associated with the northward oscillation of the Sudan Low and its inverted V-shape trough. The interaction between these two air masses increases surface air temperature, relative humidityand the probability of rainfall over SA, especially over the northwest and northeast regions.
The key-components of the climatology in the Indian Ocean and the enclosure regions is the movement of the ITCZ and development of the monsoon winds [88]. The movement of the ITCZ in the spring season is northward across the Indian Ocean and reaches its northernmost location throughout the boreal summertime (Figure 29a). During the boreal summer, enhanced low-level monsoonal airflow is produced by a strong pressure gradient among a high-pressure cell above the Southern Indian Ocean and the low-pressure cell above the Tibetan Plateau (Figure 29a). North of the equator, the Somali Jet [89] transports big amounts of moisture that is then released as monsoon rainfall above some areas of southern Arabia and the Indian subcontinent. The latent heat release through condensation of moisture is significant and additional forcing of the Indian summer monsoon as it more reinforces and maintains the surface depression above the Asian landmass [58]. In autumn, the ITCZ then moves back southward and reaches its southernmost location at about 25 °S in January (Figure 29b). Throughout the wintertime, the reversed pressure gradient produces the moderate and dry northeast monsoon.
Authors in [90] found that convective (subsidence) component of Madden-Julian Oscillation in East Indian Ocean leads to below (above) normal precipitation in Southwest Asia including SA. Additionally, upper-level Rossby-Kelvin response to Madden-Julian Oscillation extends over southwest Asia. It is only speculated about how Madden-Julian Oscillation affects low level circulation and moisture transports into southwest Asia including SA.
Figure 29. (a) Boreal summer (Indian Summer Monsoon season) and (b) boreal winter (northeast monsoon season). Bold dashed line marks the location of the ITCZ. Bold arrow marks the location of the Findlater Jet is also known as Somali Jet [85].
Climate 03 00578 g029

5.4. The Role of Jet Streams on Saudi Arabian Rainfall

Authors in [91,92,93,94] investigated the interaction among the subtropical jet stream and polar front jet stream and its role in the surface cyclogenesis not only over the North African area, but also over other subtropical regions. More precisely, it was illustrated that the concurrence of the divergence area in the right side of the jet entrance of a Polar front jet stream with an area to the left of the subtropical jet stream exit participates to the formation of very strong synoptic scale ascending motions. The climate of AP is described by cold-season precipitation originating in the southward spread of the jet stream throughout wintertime, supplemented by a southward shift of surface depression tracks [95], which developed mostly throughout the cold season [96,97].
During the La Niña year, the Tropical Easterly jet stream was enhanced and in El Niño years was weakened accompanying with the wet and dry condition, respectively. Authors in [35,86] investigated the role of subtropical jet stream on temperature and precipitation over SA. They also show that the core of the subtropical jet is stronger throughout the wintertime than the other season and situated near 27.5°N. However, it is weaker throughout the summertime and shifted northward to appear at 43°N. Northward oscillation of subtropical jet stream plays a big role in pulling hot and dry air masses of the AP including SA [98]. During the summer season, “Findlater jet”, after [89], a lower-tropospheric intense jet transport moisture over the western Indian Ocean occurs sheer off the coast of the AP. This alteration in the way of the low-level jet along East Africa and Somali decreases the moisture supply in the inner of SA and in its mountainous area of Asir Province.

6. Conclusions

The quantity of rain received over a region is a significant factor in assessing the quantity of water available to meet the numerous requests of agriculture, manufacturing, and additional human activities. Across the SA, the seasonal precipitation distributions received from the TRMM data are mostly like those based on the measurement dataset. The study explains that spring is the highest (38.93%) and winter is the second highest (32.51%) as precipitation occurring seasons. These contribute significantly towards the large quantities of precipitation, which happen through the wet season (November to May, 75.39%) over all the regions of SA. Only small quantities of rain are observed through the summer (11.46%), and (12.94) in the dry season (from Jun to September) while autumn received about 17.09% of the total annual precipitation. The SW region receives rain in all seasons, with a maximum in spring (44.29%), while the NW and NE regions receive very small quantities of precipitation in summer season(~2%). The SE region is almost totally dry. In general, precipitation increases with higher altitude, at a rateof ~1.93 mm/m in SA.
The spatial distributions of the wet season (November to May) precipitation through the periods from 1979 to 2009 and from 1998 to 2009 indicate that the region of lightest precipitation is situated over the Rub Al-Khali in the SA. The relatively heavy rain zone is inclined southwest to northeast areas of SA. On the contrary, the dry season (June through September) precipitation pattern for these two time periods indicates that the north of SA is almost rainless. During this season, very low precipitation totals were found in the north of SA, but the highest totals were found in the south. Irrespective of the season, significant quantities of rain persist in the southwestern region of SA. About 80% of the total precipitation over SA occurs during these months from November to May. The second period occurs during the summer season (June, July and August).
The results concerned with the relationship between precipitation and altitude exhibited that higher altitudes do not always receive more precipitation; some locations, for example the eastern and northeastern areas with low altitude, receive more rainfall throughout the wintertime, where the precipitation is mainly due to the influence of the passage of cyclones coming from the Mediterranean Sea. In general, the maximum quantity of annual rainfall does not always occur at the highest elevation in three regions. Therefore, the elevation is not the only factor in rainfall distribution. Other geographic factors, like temperature, pressure, distance from the source moisture and topography are also important. The time factor (i.e.,seasonality) is found as one of the important factors. Hence, the rainfall distribution is not uniform in time or in space, and it should be treated and analyzed as spatiotemporal phenomena due to the spatial and temporal changes in precipitation, especially in arid and semiarid regions.
The coefficient of variation (COV) varies from season to another. The summer rainfall COV values are greater than those corresponding to winter, spring, autumn and annual values. The winter rainfall COV value increases gradually from north to south of SA. During the spring season, higher variability is observed over the western area of SA. However, the lowest values of COV at the mountain stations are found. While during autumn, the highest values rainfall COV is observed over the eastern part of the middle region.
For the period 1978–2009, a large inter-annual variability in the precipitation over the SA area is found from the surface measurement data. A linear decreasing trend of 6.2 mm per decade is investigated in the measured precipitation in SA throughout the period 1978–2009, whilst for the recent period (1994–2009),a statistically significant decreasing trend of as much as 47.8 mm per decade is found. It is remarkable to note that precipitation increased in the Southern Peninsula and along the Red Sea coast, whilst it declined over most regions of SA throughout the period from 2000 to 2009 decade, compared to the period from 1980 to 1989.
Statistical and regional climate models are used to predict the rainfall over SA. The results of the two runs of the PRECIS Regional Model, one can conclude that: the spatial distribution of the annual total rainfall for the period 1972–2001 differs from that for the period 2070–2100, in particular above the central and northeastern areas where lower values prevailed. On the other hand, no change in the spatial pattern of the mean annual total rainfall above the northwest province and the empty quarter and above the southwestern mountain range are investigated. The projected rain exhibits that the central and northern areas tend to be drier; however, the southeastern area tends to be in surplus, which may lead to an increase in the number of extreme events. The summer season rainfall will be the highest between other seasons over the southern, the southwestern provinces and Asir mountains. When compared to the springtime value, this result has a significant synoptic implication, as rainfall there is a strong relationship with the average position and the oscillation of the ITCZ over those regions. Compared to other seasons, wintertime rainfall will remain the lowest. During the wintertime season, the central area close to the Arabian Gulf has the highest decrease in rainfall. In addition, the areas with high elevations have a relatively high decrease of rainfall in wintertime seasons. The simulated patterns of precipitations match well with the CRU and CMAP gridded datasets. The simulated rainfall exactly follows the inter-annual and annual cycle variability obtained from the observed data. Additionally, the results of RegCM3 perform well in reproducing the mean seasonal and annual rainfall in addition to the contrast between dry and wet years in terms of the quantities and the sites of the rain bands. Therefore, in climate change impact studies, the use of RegCM3 and calibrated PRECIS-generated scenarios for the period from 2021 to 2070 are found to be more suitable. The results of PRECIS are in good agreement with the IPCC rainfall projection for the SA.
The possible influence of climatic change on SA's water supplies and agriculture using climatic change scenarios from GCMs is investigated. A major negative influence on water supplies and agriculture in SA is due to an increase in temperature and a decrease in precipitation over the region.
Autumn rainfall over the western area and winter rainfall over the eastern area of the SA can be predicted using a stochastic model of ARIMA. The meteorological height, surface air temperature, sea surface temperature and southern oscillation index are used as independent variables (predictors). The rainfall over the western area of SA is affected strongly by the position and strengthens of the Siberian and subtropical high pressure and also by the southern oscillation index.
During the data period 1979–2011, the relationship between precipitation over SA and Southern Oscillation index in summer seasons is negative and statistically significant. Moreover, the precipitation rate is correlated with ENSO with positive correlation coefficient throughout the period 1979–2011. Tropical climate phenomena such warm ENSO events and positive IOD strongly modified the inter-annual variation of moisture flux. During warm ENSO events and positive IOD, the conveyance of moisture from the Red Sea to the mountainous area of Asir Province is increased, and consequently, precipitation from November to April is enhanced. The influence of the moisture conveyed to the SA region of the Red Sea side for both warm ENSO events and the positive IOD is stronger than other sides. In all GCM sensitivity experiments and throughout November, December and January, the vertically integrated moisture conveyance anomalies are notable. The fact that both the South Atlantic Ocean and the North Atlantic Ocean contribute moisture convey to SA is evident during pure positive IOD years, whereas, the South Atlantic is the main contributor throughout an ENSO year. The change of the wintertime precipitation is related mainly to the tropical climate phenomena similar to IOD or El Niño. During summer seasons, the relationship between the precipitation rate and NAO is positive and statistically significant throughout the period from 1979 to 2011.
The influence of the main pressure systems (Subtropical High, Siberian High, Icelandic Low and Sudan Low pressure) on rainfall over SA has been studied in the winter season. The most significant finding is two patterns, the first pattern occurs associated with each one of the following cases: (a) building of Subtropical High;(b) weakening of Siberian High;(c) deepening of Icelandic Low or (d) building of Sudan Low. In this pattern, the Subtropical High is joined with the Siberian High and an obvious increase of sea level pressure occurs over southern Europe, the Mediterranean, North Africa, and the Middle East. This belt of high pressure prevents the interaction between middle latitude and extra-tropical cyclones, which lead to a decrease of rainfall over SA. The second pattern occurs associated with each one of the following: (a) weakening of the Subtropical high;(b) building of the Siberian High;(c) weakening of the Icelandic Low or d) weakening of the Sudan Low. In this case, the pattern arising from a pressure system leads to an interaction between two different air masses, the first one (cold, moist) accompanies the Mediterranean travels depression from west to east, while the second one (warm, moist) accompany to the northward oscillation of the Sudan Low and its inverted V-shape trough. The interaction between these two air masses (pressure systems) increases the probability of rainfall over SA, especially over the northwest and northeast regions. This pattern also leads to increased rainfall over SA. During the spring season, these secondary Mediterranean depressions sometimes cause heavy rainfall in March when the cold air associated with these depressions meets the moist hot southerly air over SA area. During the summer season, the synoptic situation at the surface is: deep thermal low over the SA area (Indian monsoon low), the subtropical high extended more to the east, low pressure south west of SA (Sudan low), while at upper air: the Subtropical high extends southeastward to reach SA, and the existence of a low pressure southeast of SA, and low trough over the Red sea are invaded. These conditions besides the effect of the mountains and the sea breeze and land breeze circulation affect rainfall in the summer season. During the autumn months, the rainfall over SA is weak and occurs when the Sudan monsoon low coming from the southeast appears and affects the weather of SA area. During this period, the SA area is also affected by the early waves invading the Mediterranean. Sometimes these waves (depressions) cause rainfall when the cold air associated with these depressions meets the moist hot southerly air over our area.
The subtropical jet stream is stronger than the other seasons during the winter season where the core is located near 27.5°N, pulling cold and wet air masses to the SA region. While throughout the summer season, it is weaker and shifted northward to appear at 43°N in pulling hot and dry air masses of the SA region. In El Niño years, the Tropical Easterly jet stream was weakened while enhancing throughout La Niña years associated with the dry and wet conditions, respectively, in the area of SA. The alteration in the way of the low-level jet over the East Africa and Somali region decreases the moisture supply in the interior of SA and in the mountainous area of Asir Province.

Acknowledgements

The authors are thankful to Faculty of Meteorology, Environmental and Arid Land Agriculture, King Abdulaziz university for making available the computer and other facilities in this work. Also, thankfull for all colleague of Department of Meteorology for their suggestions and advices. We thank reviewers for comments on earlier versions of this article.

Author Contributions

The authors, Hosny M. Hasanean and Mansour Almazroui, identified the study framework and contributed extensively throughout the whole work. The authors have shared the manuscript preparation. In addition, the authors discussed the results of this manuscript throughout all processes. They all read and approved the final manuscript.

Conflicts of Interest

The authors declare no conflict of interest.

References

  1. Reiter, E.R. Handbook for forecasters in the Mediterranean; Technical Report No.5–75; Navy Environmental Research and Prediction Facility: Monterey, CA, USA, 1975. [Google Scholar]
  2. Hoskins, B.J.; Pedder, M.A. The diagnosis of middle latitude synoptic development. Q. J. R. Meteorol. Soc. 1980, 106, 707–719. [Google Scholar] [CrossRef]
  3. Lee, T.P.; Silberg, S.R.; Bosart, L.F. A case study of a severe winter storm in the Middle East. Quart Q. J. R. Meteorol. Soc. 1988, 114, 61–90. [Google Scholar] [CrossRef]
  4. Trigo, I.F.; Bigg, G.R.; Davis, T.D. Climatology of cyclogenesis mechanisms in the Mediterranean. Mon.Wea. Rev. 2002, 130, 549–569. [Google Scholar] [CrossRef]
  5. Walter, H.; Lieth, H. Klimadiagramm-Weltatlas; VEB Gustav FischerVerlag: Jena, German, 1967. [Google Scholar]
  6. Muller, M.J. Selected climatic data for a global set of standard stations for vegetation science. In Tasks for Vegetation Sciences; Lieth, H., Ed.; Kluwer Academic Publishers Group: Dordrecht, The Netherlands, 1982; pp. 143–285. [Google Scholar]
  7. Moore, E. Gardening in the Middle East; Stacey International: London, UK, 1986; p. 144. [Google Scholar]
  8. Almazroui, M.; Hasanean, H.M.; Al-Khalaf, A.K.; Abdel Basset, H. Detecting climate change signals in Saudi Arabia using meanannual surface air temperatures. TheorApplClimatol. 2013, 113, 585–598. [Google Scholar]
  9. Köppen, W. Das geographisca system der klimate. In Handbuch der Klimatologie; Köppen, W., Geiger, G., Eds.; 1.C. Gebr, Borntraeger: Stuttgart, German, 1936; pp. 1–44. [Google Scholar]
  10. Al-Jerash, M.A. Climatic subdivisions in Saudi Arabia: An application of principal component analysis. Int. J. Climatol. 1985, 5, 307–323. [Google Scholar] [CrossRef]
  11. Al-Taher, A.A. Drought and human adjustment in Saudi Arabia. GeoJournal 1994, 33, 411–422. [Google Scholar]
  12. Subyani, A.M.; Al-Modayan, A.A.; Al-Ahmadi, F.S. Topographic, seasonal and aridity influences on rainfall variability in western Saudi Arabia. J. Environ. Hydrol. 2010, 18, 1–11. [Google Scholar]
  13. Ahmed, B.Y.M. Climatic classification of Saudi Arabia: An application of factor cluster analysis. GeoJournal 1997, 41, 69–84. [Google Scholar] [CrossRef]
  14. Abdullah, M.A.; Al-Mazroui, M.A. Climatological study of the southwestern region of Saudi Arabia. I. Rainfall analysis. Clim. Res. 1998, 9, 213–223. [Google Scholar] [CrossRef]
  15. Subyani, A.M. Geostatistical study of annual and seasonal mean rainfall patterns in southwest Saudi Arabia. Hydrol. Sci. J. 2004, 49, 803–817. [Google Scholar]
  16. Al-Mazroui, M.A. Climatological Study over the Southwestern Region of the Kingdom of Saudi Arabia with Special Reference to Rainfall Distribution. Master Thesis, Department of Meteorology, Faculty of Meteorology, Environment and Arid Land Agriculture, King Abdulaziz University, Jeddah, Saudi Arabia, 1998. [Google Scholar]
  17. The Ministry of Hydrology. Water Atlas of Saudi Arabia; Water Resource Department, Ministry of Agriculture and Water: Riyadh, Saudi Arabia, 1984.
  18. Almazroui, M.A. Calibration of TRMM rainfall climatology over Saudi Arabia during 1998–2009. Atmos. Res. 2011a, 99, 400–414. [Google Scholar] [CrossRef]
  19. Almazroui, M.A.; Islam, M.N.; Jones, P.D.; Athar, H.; Rahman, M.A. Recent climate change in the Arabian Peninsula: Seasonal rainfall and temperature climatology of Saudi Arabia for 1979–2009. Atmos. Res. 2012b, 111, 29–45. [Google Scholar] [CrossRef]
  20. Almazroui, M.A.; Islam, M.N.; Athar, H.; Jones, P.D.; Rahman, M.A. Recent climate change in the Arabian Peninsula: annual rainfall and temperature analysis of Saudi Arabia for 1978–2009. Int. J. Climatol. 2012a, 32, 953–966. [Google Scholar] [CrossRef]
  21. Abdelmola, Y.K. Surface Synoptic Type over Central Sudan during 1994–2003. Ph.D. Thesis, Department of Meteorology and Climatology, Aristotle University, Thessaloniki, Greece, 2009. [Google Scholar]
  22. Islam, M.N.; Das, S.; Uyeda, H. Calibration of TRMM derived rainfall over Nepal during 1998–2007. Open Atmos. Sci. J. 2010, 4, 12–23. [Google Scholar] [CrossRef]
  23. IPCC. Climate Change 2007: Impacts, Adaptation and Vulnerability. Contribution of Working Group II to the Fourth Assessment Report of the Intergovernmental Panel on Climate Change; Cambridge University Press: Cambridge, UK, 2007. [Google Scholar]
  24. IPCC-WGI. Climate change 1995. In The Scienceof Climate Change; Houghton, J.T., MeiraFilho, L.G., Bruce, J., Lee, H., Callander, B.A., Haites, E., Harris, N., Maskell, K., Eds.; Cambridge University Press: Cambridge, UK, 1996. [Google Scholar]
  25. Fisher, M.; Membery, D.A. Climate. In Vegetation of the Arabian Peninsula; Ghazanfar, S.A., Fisher, M., Eds.; Kluwer Academic Press: Dordrecht, The Netherlands, 1998; pp. 5–38. [Google Scholar]
  26. Hasanean, H.M. Middle East Meteorology. Avaliable online: http://www.eolss.net/ (accessed on 7 August 2015).
  27. Qureshi, S.; Khan, N. Estimation of climatic transition in Riyadh (Saudi Arabia) in global warming perspectives. GeoJournal 1994, 33, 423–432. [Google Scholar]
  28. Barthand, H.; rank Steinkohl, F. Origin of winter precipitation in the central coastal lowlands of Saudi Arabia. J. Arid Environ. 2004, 57, 101–115. [Google Scholar] [CrossRef]
  29. Shwehdi, M.H. Thunderstorm distribution and frequency in Saudi Arabia. J. Geophys. Eng. 2005, 2, 252–267. [Google Scholar] [CrossRef]
  30. Chakraborty, A.; Behera, S.K.; Mujumdar, M.; Ohba, R.; Yamagata, T. Diagnosis of tropospheric moisture over Saudi Arabia and influences of IOD and ENSO. Mon. Wea. Rev. 2006a, 134, 598–616. [Google Scholar]
  31. Harley, D.G. Frontal contour analysis of polar low. Meteorol. Meteorol Mag. 1960, 89, 146–147. [Google Scholar]
  32. Businger, S.; Reed, R.J. Cyclogenesis in cold air masses. Weather Forecast. 1989, 4, 133–156. [Google Scholar] [CrossRef]
  33. Yanase, W.; Niino, H.; Saito, K. High-resolution numerical simulation of a polar low. Geophys. Res. Lett. 2002. [Google Scholar] [CrossRef]
  34. Fu, G.; Niino, H.; Kimura, R.; Kato, T. A polar low over the Japan Sea on 21 January 1997, part I: Observational analysis. Mon. Wea. Rev. 2004, 132, 1537–1551. [Google Scholar] [CrossRef]
  35. Alamodi, A.O.; Mashat, A.S.; Abdel Basset, H.M. On the Relation between Atmospheric Pressure Systems and Rainfall Prediction over the Kingdom of Saudi Arabia; Project Number: 302/427; King Abdelaziz University: Jeddah, Saudi Arabia, 2008. [Google Scholar]
  36. Liebmann, B.; Dole, R.M.; Jones, C.; Allured, D.; Blade, I. Influence of choice of time period on global surface temperature trend estimates. Bull. Am. Meteorol. Soc. 2010, 91, 1485–1491. [Google Scholar] [CrossRef]
  37. Al-Ahmadi, K.; Al-Ahmadi, S. Rainfall-altitude Relationship in Saudi Arabia. Adv. Meteorol. 2013. [Google Scholar] [CrossRef]
  38. Abdullah, M.A.; Afeef, M.A.; Azhari, A.A. Climatological Study over Asir for Possible Choice of Weather Modification Site; King Abdul Aziz University: Jeddah, Saudi Arabia, 1992. [Google Scholar]
  39. Second National Communication of Kingdom of Saudi Arabia Report. Available online: http://unfccc.int/resource/docs/natc/saunc2.pdf (accessed on 26 January 2014).
  40. PME First National Communication for the Kingdom of Saudi Arabia. Available online: http://jrcc.sa/reports_files/First_National_Communication_SAUDI_ARABIA.pdf (accessed on 26 January 2014).
  41. Almazroui, M.A. Sensitivity of a regional climate model on the simulationof high intensity rainfall events over the Arabian Peninsulaand around Jeddah (Saudi Arabia). Theor. Appl. Climatol. 2011, 104, 261–276. [Google Scholar] [CrossRef]
  42. Almazroui, M.A. Simulation of present and future climate of Saudi Arabia using a regional climate model (PRECIS). Int. J. Climatol. 2013, 33, 2247–2259. [Google Scholar] [CrossRef]
  43. Alkolibi, F.M. Possible effects of global warming on agriculture and water resources in Saudi Arabia: Impacts and responses. Clim. Chang. 2002, 54, 225–245. [Google Scholar] [CrossRef]
  44. Met Office. Climate: Observations, Projections and Impacts. Available online: http://www.metoffice.gov.uk/media/pdf/j/m/Saudi_Arabia.pdf (accessed on 28 January 2014).
  45. Tarawneh, Q.Y. Spatial variation of Saudi Arabia’s annual rainfall using a regional prediction model. Arabian J. Geosci. 2015, 8, 4147–4160. [Google Scholar] [CrossRef]
  46. Rehman, S.; El Gebiely, M. Study of meteorological parameters of coastal regions of SaudiArabia using wavelets. In Proceedings of the 2nd WSEAS International Conference on Wavelets Theory and Applications in Applied Mathematics, Signal Processing and Modern Science, Istanbul, Turkey, 27–30 May 2008.
  47. Rogers, J.C. The Association between the North Atlantic Oscillation and the Southern Oscillation in the Northern Hemisphere. Mon. Wea. Rev. 1984, 112, 1999–2015. [Google Scholar] [CrossRef]
  48. Ropelewski, C.F.; Halpert, M.S. Global and regional scale precipitation patterns associated with El Nino/Southern Oscillation. Mon.Wea. Rev. 1987, 115, 1606–1626. [Google Scholar]
  49. Cullen, H.M.; Kaplan, A.; Arkin, P.A.; deMenocal, P.B. Impact of the North Atlantic Oscillation on Middle Eastern climate and stream flow. Clim. Chang. 2002, 55, 315–338. [Google Scholar] [CrossRef]
  50. Lolis, C.J.; Bartzokas, A.; Metaxas, D.A. Spatial co-variability of the climatic parameters in the Greek area. Int. J. Climatol. 1999, 19, 185–196. [Google Scholar]
  51. Yarnal, B. The effect of weather map scale on the results of a synoptic climatology. J. Clim. 1984, 4, 481–493. [Google Scholar] [CrossRef]
  52. Kozuchowski, K.M. Variations of hemispheric zonal index since 1899 and its relationships with air temperature. Int. J. Climatol. 1993, 13, 853–864. [Google Scholar] [CrossRef]
  53. Kotwickiand, V.; AlSulaimani, Z. Climates of the Arabian Peninsula—Past, present, future. Int.J. Clim. Chang. Strat. Manag. 2009, 1, 297–310. [Google Scholar] [CrossRef]
  54. Chakraborty, A.; Mujumdar, M.; Behera, S.K.; Ohba, R.; Yamagata, T. A cyclone over Saudi Arabia on 5 January 2002: A case study. Meteorol. Atmos. Phys. 2006b, 93, 115–122. [Google Scholar] [CrossRef]
  55. Webster, P.J.; Magana, V.O.; Palmer, T.N.; Shukla, J.; Tomas, R.A.; Yanai, M.; Yasunari, T. Monsoons: Processes, predictability, and the prospects for prediction. J. Geophys. Res. Oceans 1998, 103, 14451–14510. [Google Scholar]
  56. Walker, G.T. Correlation in seasonal variations of weather. VIII: A preliminary study of world weather. Mem. Indian Meteor. Dept. 1923, 24, 75–131. [Google Scholar]
  57. Shukla, J.; Paolino, D. The Southern Oscillation and long-range forecasting of summer monsoon rainfall over India. Mon. Wea. Rev. 1983, 111, 1830–1837. [Google Scholar] [CrossRef]
  58. Joseph, P.V.; Eischeid, J.K.; Pyle, R.J. Interannual variability of the onset of the Indian summer monsoon and its association with atmospheric features, El Niño, and sea surface temperature anomalies. J. Clim. 1994, 7, 81–105. [Google Scholar] [CrossRef]
  59. Rodo, X.; Baert, E.; Comin, F.A. Variations in seasonal rainfall in southern Europe during the present century: Relationships with the North Atlantic Oscillation and the El Nino Southern Oscillation. Clim. Dyn. Vol. 1997, 13, 275–284. [Google Scholar]
  60. Nazemosadat, M.J.; Cordery, I. On the relationships between ENSO and autumn rainfall in Iran. Int. J. Climatol. 2000a, 1, 47–62. [Google Scholar]
  61. Nazemosadat, M.J.; Cordery, I. The impact of ENSO on winter rainfall in Iran. In Hydro 2000: Interactive Hydrology; Engineers Australia: Canberra, ACT, Australia, 2000; pp. 538–543. [Google Scholar]
  62. Hasanean, H.M. Teleconnection between global climatic events, atmospheric circulation change and stream flow over the River Nile. J. Meteorol. 2003, 28, 161–177. [Google Scholar]
  63. Nazemosadat, M.J.; Samani, N.; Barry, D.A.; Niko, M.M. ENSO forcing on climate change in Iran: Precipitation analysis. Iran. J. Sci. Technol. Trans. B Eng. 2006, 30, 555–565. [Google Scholar]
  64. Mariotti, A.; Zeng, N.; Lau, K-M. Euro-Mediterranean rainfall and ENSO—A seasonally varying relationship. Geophys. Res. Lett. 2002, 29. [Google Scholar] [CrossRef]
  65. Mariotti, A.; Ballabrera-Poy, J.; Zeng, N. Tropical influence on Euro-Asian autumn rainfall. Clim. Dyn. 2005, 24, 511–521. [Google Scholar] [CrossRef]
  66. Athar, H.; Almazroui, M.A.; Islam, M.N.; Adnan Abid, M.; Azhar, E. Effectof mid-latitude blocking anticyclones on the weather of the Arabian Peninsula. Int. J. Climatol. 2012, 33, 585–598. [Google Scholar] [CrossRef]
  67. Hafez, Y.Y.; Almazroui, M.A. The role played by blocking systems over Europe in abnormal weather over Kingdom of Saudi Arabia in Summer 2010. Adv. Meteorol. 2013. [Google Scholar] [CrossRef]
  68. Xieand, P.; Arkin, P.A. Global precipitation: A 17year monthly analysis based on gauge observations, satellite estimates, and numerical model outputs. Bull. Am. Meteorol. Soc. 1997, 78, 2539–2558. [Google Scholar]
  69. North Atlantic Oscillation. Avaliable online: http://www.ldeo.columbia.edu/res/pi/NAO/ (accessed on 7 August 2015).
  70. Hurrell, J.W.K.; Ottersenand, G.; Visbeck, M. The North Atlantic Oscillation climatic significance and environmental impact. Geophys. Monogr. 2003, 134. [Google Scholar] [CrossRef]
  71. Mann, M.E. Large-scale climate variability and connections with the Middle East in past centuries. Clim. Chang. 2002, 55. [Google Scholar] [CrossRef]
  72. Delworth, T.; Manabe, S.; Stouffer, R.J. Interdecadal variations of the thermohalinecirculation in a coupled ocean-atmosphere model. J. Clim. 1993, 6, 1993–2011. [Google Scholar] [CrossRef]
  73. Kushnir, Y. Interdecadal variations in North Atlantic Sea surface temperature and associated atmospheric conditions. J. Clim. 1994, 7, 141–157. [Google Scholar] [CrossRef]
  74. Mann, M.E.; Park, J. Joint spatial-temporal modes of surface temperature and sea level pressure variability in the Northern Hemisphere during the last century. J. Clim. 1996, 9, 2137–2162. [Google Scholar] [CrossRef]
  75. Cullen, H.M.; deMenocal, P.B. North Atlantic influence on Tigris-Euphrates stream flow. Int. J. Climatol. 2000, 20, 853–863. [Google Scholar]
  76. Felis, T.J.; Pätzold, J.; Loya, Y.; Fine, M.; Nawar, A.H.; Wefer, G. A coral oxygen isotoperecord from the northern Red Sea documenting NAO, ENSO, and North Pacific teleconnections on Middle East climate variability since the year 1750. Paleoceanography 2000, 15, 679–694. [Google Scholar]
  77. Rimbu, N.; Lohmann, G.; Felis, T.J.; Patzold, J. Arctic Oscillation signature in a Red Sea coral. Geophys. Res. Lett. 2001, 28, 2959–2962. [Google Scholar] [CrossRef]
  78. Luterbacher, J.; Xoplaki, E. 500-year winter temperature and precipitation variability over the Mediterranean area and its connection to the large-scale atmospheric circulation. In Mediterranean Climate-Variability and Trends; Bolle, H.-J., Ed.; Springer Verlag: Berlin, Germany, 2003; pp. 133–153. [Google Scholar]
  79. Rimbu, N.; Felis, T.J.; Lohmann, G.; Pätzold, J. Winter and summer climate patterns in the European-Middle East during recent centuries as documented in a northernRed Sea coral record. Holocene 2006, 16, 321–330. [Google Scholar]
  80. Felis, T.J.; Lohmann, G.; Kuhnert, H.; Lorenz, S.J.; Scholz, D.; Pätzold, J.; Al-Rousan, S.A.; Al Moghrabi, S.M. Increased seasonality in Middle East temperatures during the last interglacial period. Nature 2004, 429, 164–168. [Google Scholar]
  81. Slonosky, V.C.; Yiou, P. Does the NAO index represent zonal flow?The influence of the NAO on North Atlantic surface temperature. Clim. Dyn. 2002, 19, 17–30. [Google Scholar]
  82. Wang, C. Atlantic climate variability and its associated atmospheric cells. J.Clim. 2002, 15, 1516–1536. [Google Scholar] [CrossRef]
  83. Liu, Y.M.; Wu, G.X.; Liu, H.; Liu, P. Dynamical effects of condensation heating on the subtropical anticyclones in the Eastern Hemisphere. Clim. Dyn. 2001, 17, 327–338. [Google Scholar]
  84. Rodwell, M.R.; Hoskins, B.J. Subtropical anticyclones and monsoons. J. Clim. 2001, 14, 3192–3211. [Google Scholar] [CrossRef]
  85. Fleitmanna, D.; Burnsb, S.J.; Manginic, A.; Mudelseed, M.; Kramersa, J.; Villaa, I.; Neffc, U.; Al-Subbarye, A.A.; Buettnera, A.; Hipplera, D.; Matter, A. Holocene ITCZ and Indian monsoon dynamics recorded in stalagmites from Oman and Yemen (Socotra). Quat. Sci. Rev. 2007, 26, 170–188. [Google Scholar]
  86. Almazroui, M.A.; Al Khalaf, A.K.; Abdel Basset, H.M.; Hasanean, H.M. Detecting Climate Change Signals in Saudi Arabia Using Surface Temperature; King Abdelaziz University: Jeddah, Saudi Arabia, 2009. [Google Scholar]
  87. Hasanean, H.M.; Almazrouia, M.A.; Jonesa, P.D.; Alamoudi, A.A. Siberian High variability and its teleconnections with tropical circulations and surface air temperature over Saudi Arabia. Clim. Dyn. 2013, 41, 2003–2018. [Google Scholar] [CrossRef]
  88. Hasanean, H.M.; Abdel Basset, H.; Hussin, M.A.A. On the relationship between climatic elements and pressure systems over Saudi Arabia in winter season. Adv. Atmos. Sci. 2015, 32, 690–703. [Google Scholar]
  89. Findlater, J. Inter-hemispheric transport of air in lower troposphere over Western Indian Ocean. Q. J. R. Meteorol. Soc. 1969, 95, 362–380. [Google Scholar] [CrossRef]
  90. Vorhees, C.D.; Murphree, T.; Pfeiffer, L.K. Tropical climate variations and their impacts on the Northwest Indian Ocean—Northeast Africa-Southwest Asia Region. In Proceedings of the 27th Conference on Hurricanes and Tropical Meteorology, Monterey, CA, USA, 24 April 2006.
  91. Whitney, L.F. Relationship of the subtropical jet stream to severe local storms. Mon. Wea. Rev. 1977, 105, 398–412. [Google Scholar] [CrossRef]
  92. Uccelliniand, L.W.; Kocin, P.J. The interaction of jet streak circulations during heavy snow events along the east coast of the United States. Wea. Forecast. 1987, 2, 289–308. [Google Scholar] [CrossRef]
  93. Hakim, G.J.; Uccellini, L.W. Diagnosing coupled jet-streak circulations for a NorthernPlains snow band from the operational nested grid model. Wea. Forecast. 1992, 7, 26–48. [Google Scholar] [CrossRef]
  94. Kaplan, M.L.; Lin, Y.; Hamilton, D.W.; Rozumalski, R.A. The numerical simulation of an unbalanced jetlet and its role in the Palm Sunday 1994 Tornado outbreak in Alabama and Georgia. Mon. Wea. Rev. 1998, 126, 2133–2165. [Google Scholar] [CrossRef]
  95. Zangvil, A.; Drulan, P. Upper air trough axis orientation and the spatial distribution of rainfall over Israel. Int. J. Climatol. 1990, 10, 57–62. [Google Scholar] [CrossRef]
  96. Sahsamanoglou, H.S.; Makrogiannis, T.J.; Kallimopoulos, P.D. Some aspect of the basic characteristics of the Siberian anticyclone. Int. J. Climatol. 1991, 11, 827–839. [Google Scholar] [CrossRef]
  97. Sarroni, H.; Bitan, A.; Alpert, P.; Ziv, B. Continental polar outbreaks into the Levant and Eastern Mediterranean. Int. J. Climatol. 1996, 16, 1175–1191. [Google Scholar] [CrossRef]
  98. Nasrallah, H.A.; Nieplova, E.; Ramadan, E. Warm season extreme temperature events in Kuwait. J. Arid. Environ. Vol. 2004, 56, 357–371. [Google Scholar] [CrossRef]

