3.1. Mexico City Wind States (2001–2006)
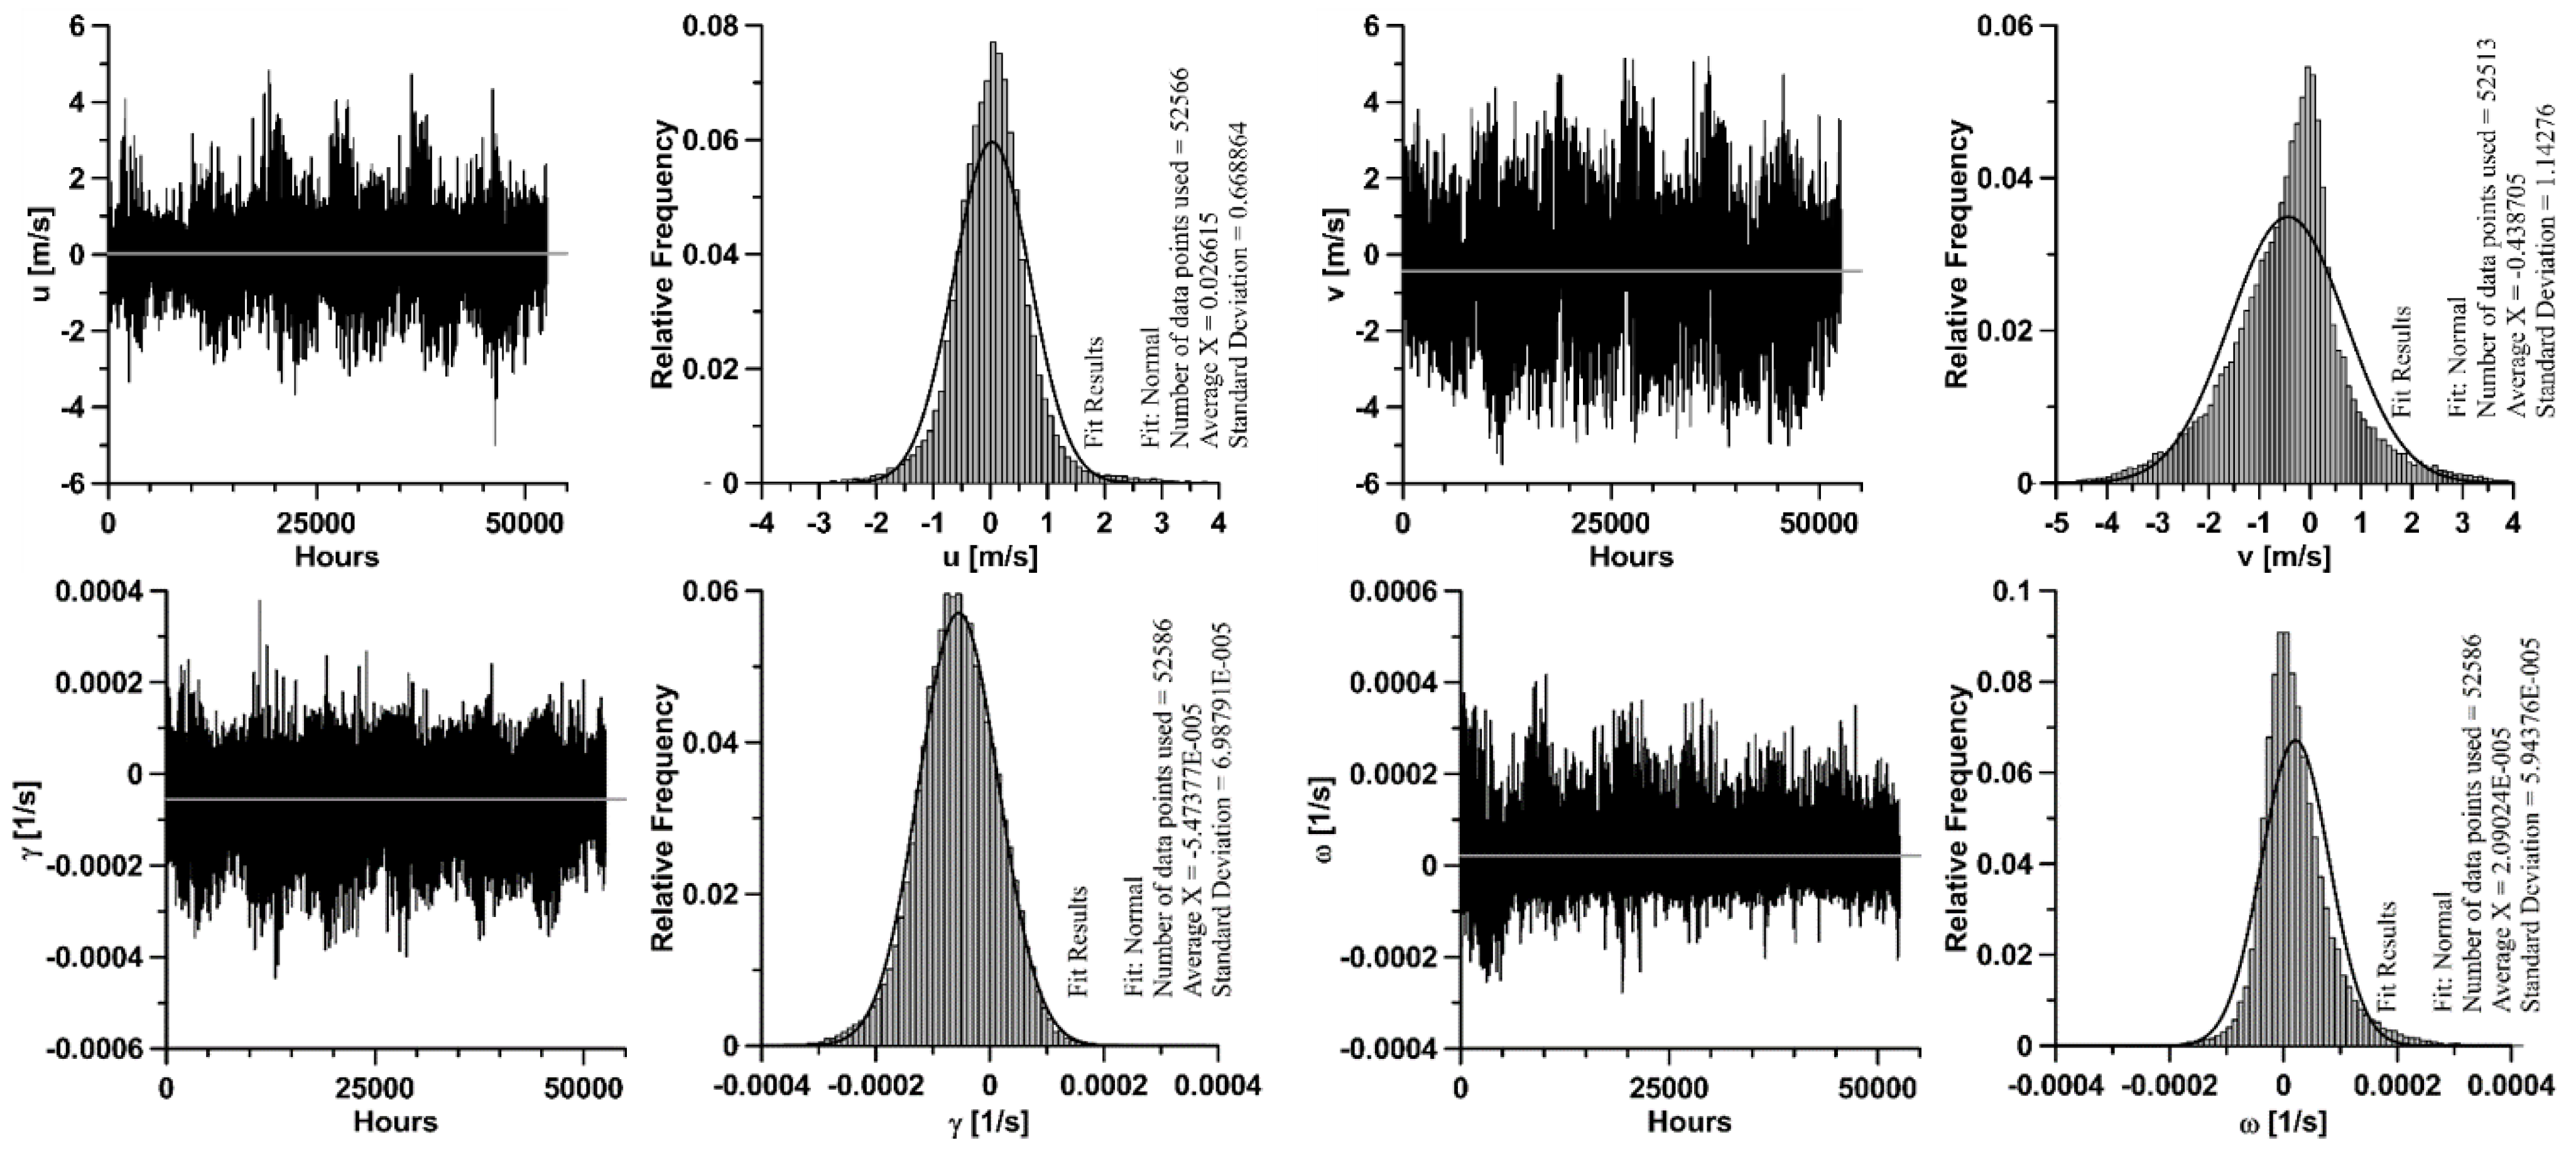
From the standpoint of the 1-cell LWM, the temporal evolution of the wind circulation in Mexico City during the period 2001–2006 is described by the time series of the wind state parameters (u, v, γ, ω) shown in
Figure 4. The frequency distribution of the values of the wind state parameters are also shown in
Figure 4, and their basic statistics are summarized in
Table 5. This table also includes the statistics of wind speed (WSP). These results reflect the following remarkable characteristics of the Mexico City winds:
Mean Wind Velocity Components: The West-to-East wind component (u) was positive for 52% of the hourly wind states, showing a slight predominance of winds from the west sectors of the city flowing to downtown. In turn, the South-to-North wind component (v) was negative for 66% of the hourly wind states, which indicates a clear predominance of winds with a flow component from north. The intensity of the model wind events, in terms of the Beaufort scale categories, was as follows: 9% of the wind events were calm, the 65% were light air, and 26% were light breeze. Higher wind speed values were no reflected by the model wind events.
Table 5.
Statistics of the wind state parameters. Period 2001–2006.
Table 5.
Statistics of the wind state parameters. Period 2001–2006.
| | u (m/s) | v (m/s) | WSP (m/s) | γ (×10−4 1/s) | ω (×10−4 1/s) |
|---|
| Minimum | −4.99 | −5.50 | 0.00 | −4.46 | −2.77 |
| Maximum | 4.82 | 5.17 | 5.89 | 3.78 | 4.17 |
| Mean | 0.03 | −0.43 | 1.11 | −0.55 | 0.21 |
| Mode | 0.14 | 0.02 | 0.42 | −0.69 | −0.15 |
| Std. Dev. | 0.67 | 1.16 | 0.86 | 0.70 | 0.59 |
| Kurtosis | 3.76 | 1.53 | 1.96 | 0.52 | 2.81 |
| Skewness | 0.42 | −0.012 | 1.38 | −0.16 | 0.95 |
Mean Wind Divergence and Vorticity: The wind divergence (γ) was negative for 78% of the model wind events. This indicates that the convergent winds prevailed not only during the nighttime, but also during 50% of the daylight hours, just when one would be expecting that turbulent mixing would weaken the flow induced by the urban heat island [
9,
25]. The wind vorticity (ω), on the other hand, was positive during 61% of the wind events, indicating predominance of cyclonic winds. Given the regional topography, this fact could be partially correlated (at least) with the predominance of winds with a northerly flow component (66%).
Figure 4.
Temporal behavior (left) and frequency distribution (right) of the Mexico City wind state parameters during the period 2001-2006.Top row: velocity components (u, v). Bottom row: divergence (γ) and vorticity (ω). Fittings to normal distributions are shown for comparison purposes.
Figure 4.
Temporal behavior (left) and frequency distribution (right) of the Mexico City wind state parameters during the period 2001-2006.Top row: velocity components (u, v). Bottom row: divergence (γ) and vorticity (ω). Fittings to normal distributions are shown for comparison purposes.
The mean values presented in this table describe the mean winds of Mexico City: low intensity, northerly winds with slightly convergent and cyclonic features. This may be illustrated as in
Figure 5.
Figure 5.
Schematic illustration of the mean wind circulation mode in Mexico City (2001–2006).
Figure 5.
Schematic illustration of the mean wind circulation mode in Mexico City (2001–2006).
3.2. Mexico City Discrete Wind States (2001–2006)
On the other hand,
Figure 6 and
Table 6 summarize the results that we obtained for the occurrence frequencies of the discrete wind states (DWS) from the standpoint of the 1-cell model of Mexico City.
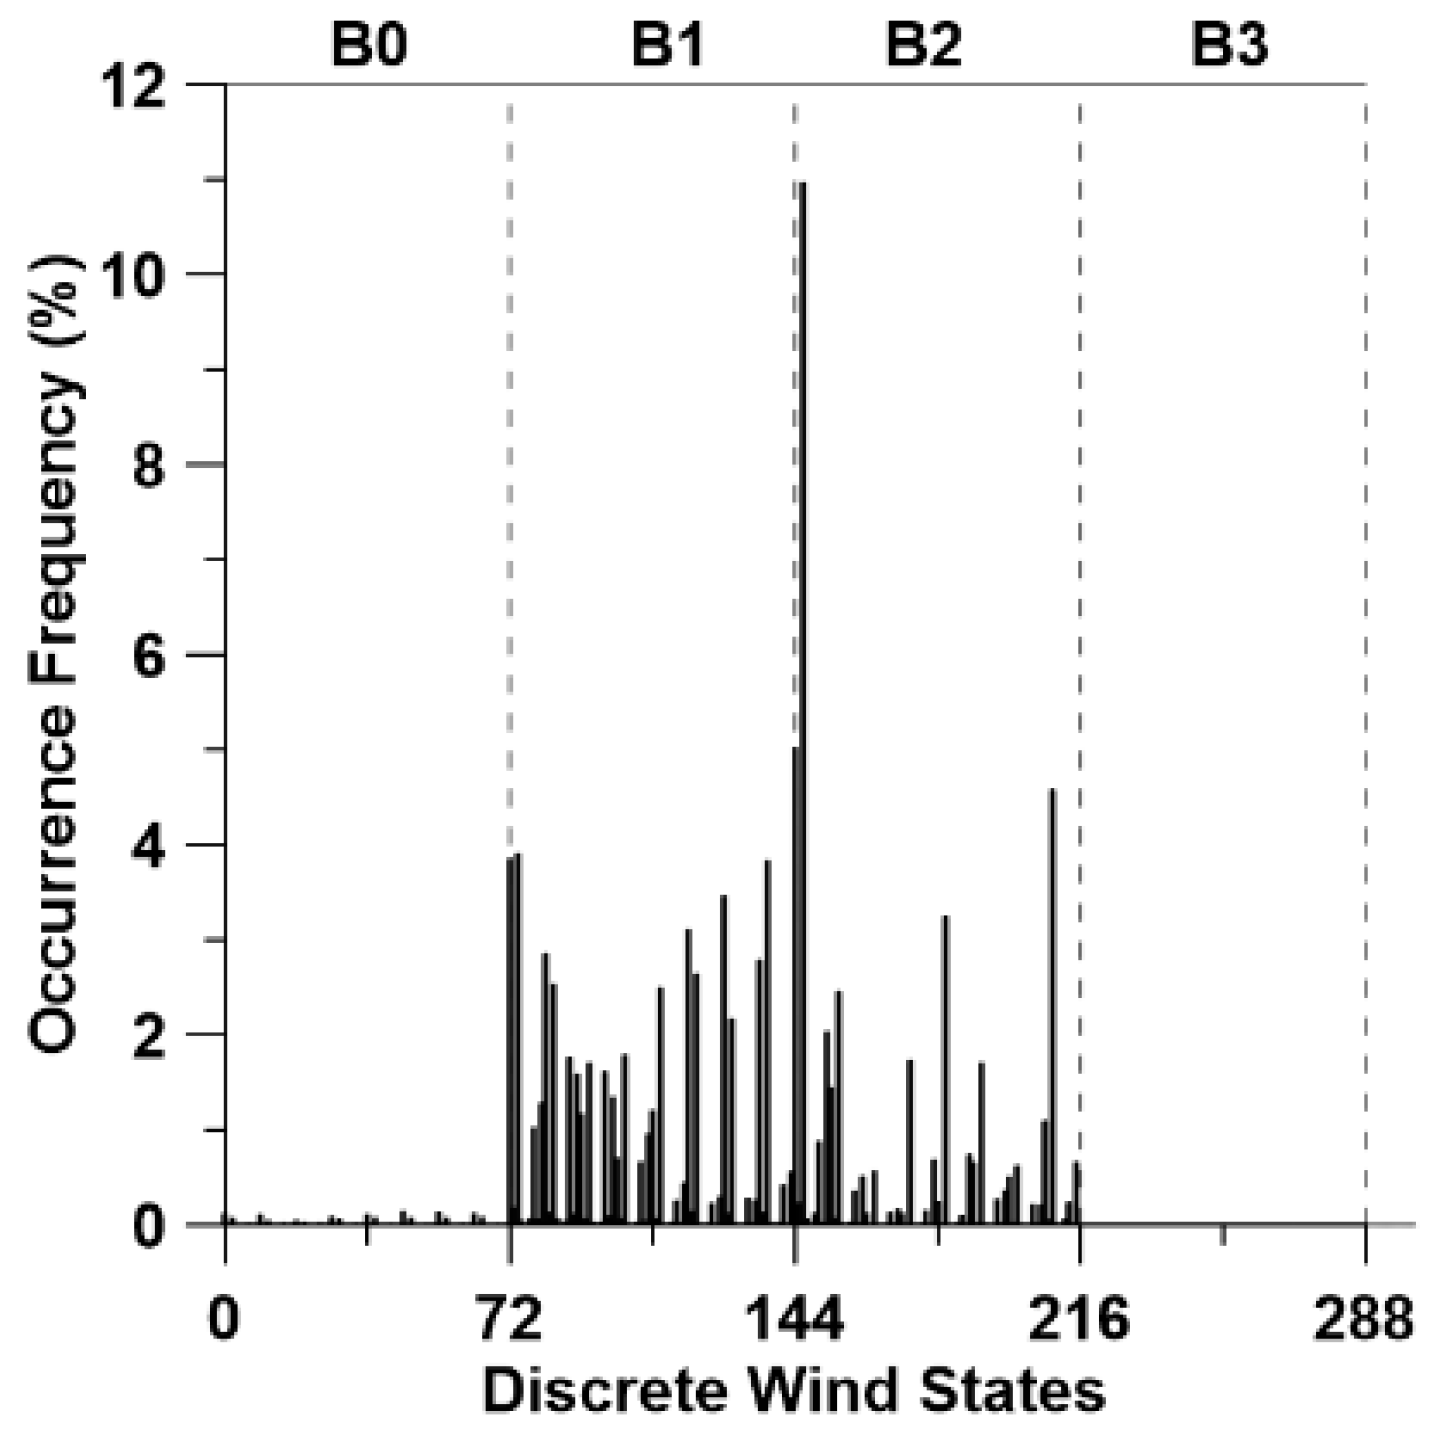
Figure 6 shows that, in the period 2001–2006, Mexico City’s discrete wind states had intensities that belong almost exclusively to the second (B1,
light air) and third (B2,
light breeze) categories of the Beaufort scale. It is observed, in fact, that the first three DWSs with the highest frequencies appeared in the B2 category.
Table 6 summarizes the first seventeen discrete wind states of Mexico City with the highest occurrence frequencies throughout 2001–2006. This set comprises the 62% of the discrete wind states of the period. The one with highest occurrence frequency (10.96%) in the period was the 146 (2, 0, 0, 2). This state represents a northerly wind condition with intensities in the third category of Beaufort, and with convergent and cyclonic features. The DWS with the second highest occurrence frequency (5%) was that one identified as 144 (2, 0, 0, 0), which represents winds with the same characteristics as the 146, except the vorticity, which in this case is anticyclonic.
Figure 6.
Distribution of the occurrence frequencies of the discrete wind states.
Figure 6.
Distribution of the occurrence frequencies of the discrete wind states.
Table 6.
Mexico City discrete wind states with the highest occurrence frequencies. Period: 2001–2006.
Table 6.
Mexico City discrete wind states with the highest occurrence frequencies. Period: 2001–2006.
| ID | (U, θ, γ, ω) | Occurrences | Frequency (%) | WSP (m/s) | WDR | DIV | VOR |
|---|
| 146 | ( 2, 0, 0, 2) | 5765 | 10.9634 | 1.5 < v < 3.5 | N | Convergent | Cyclonic |
| 144 | ( 2, 0, 0, 0) | 2635 | 5.0110 | 1.5 < v < 3.5 | N | Convergent | Anticyclonic |
| 209 | ( 2, 7, 0, 2) | 2405 | 4.5736 | 1.5 < v < 3.5 | NW | Convergent | Cyclonic |
| 74 | ( 1, 0, 0, 2) | 2055 | 3.9080 | 0.25 < v < 1.5 | N | Convergent | Cyclonic |
| 72 | ( 1, 0, 0, 0) | 2024 | 3.8491 | 0.25 < v < 1.5 | N | Convergent | Anticyclonic |
| 137 | ( 1, 7, 0, 2) | 2013 | 3.8282 | 0.25 < v < 1.5 | NW | Convergent | Cyclonic |
| 126 | ( 1, 6, 0, 0) | 1820 | 3.4611 | 0.25 < v < 1.5 | W | Convergent | Anticyclonic |
| 182 | ( 2, 4, 0, 2) | 1706 | 3.2443 | 1.5 < v < 3.5 | S | Convergent | Cyclonic |
| 117 | ( 1, 5, 0, 0) | 1631 | 3.1017 | 0.25 < v < 1.5 | SW | Convergent | Anticyclonic |
| 81 | ( 1, 1, 0, 0) | 1499 | 2.8507 | 0.25 < v < 1.5 | NE | Convergent | Anticyclonic |
| 135 | ( 1, 7, 0, 0) | 1466 | 2.7879 | 0.25 < v < 1.5 | NW | Convergent | Anticyclonic |
| 119 | ( 1, 5, 0, 2) | 1389 | 2.6415 | 0.25 < v < 1.5 | SW | Convergent | Cyclonic |
| 83 | ( 1, 1, 0, 2) | 1332 | 2.5331 | 0.25 < v < 1.5 | NE | Convergent | Cyclonic |
| 110 | ( 1, 4, 0, 2) | 1312 | 2.4951 | 0.25 < v < 1.5 | S | Convergent | Cyclonic |
| 155 | ( 2, 1, 0, 2) | 1290 | 2.4532 | 1.5 < v < 3.5 | NE | Convergent | Cyclonic |
| 128 | ( 1, 6, 0, 2) | 1139 | 2.1661 | 0.25 < v < 1.5 | W | Convergent | Cyclonic |
| 152 | ( 2, 0, 2, 2) | 1068 | 2.0310 | 1.5 < v < 3.5 | N | Divergent | Cyclonic |
As shown in
Table 6, the main wind directions of the wind states were N (5/17), NW (3/17), and NE (3/17), and after that SW (2/17) and W (2/17). Their absolute occurrence frequencies were 30%, 15%, 14%, 10% and 8%, respectively. Almost all these wind states represented convergent winds (16/17). It is also shown that the discrete wind states with cyclonic vorticity were the majority (11/17) in this set. Moreover, the states representing winds with intensity in the second category of Beaufort (
light air) were also in the majority (11/17), while the rest (6/17) were
light breezes (winds with intensity in the third category of Beaufort). No wind states representing
calms, neither wind states with intensities in the higher categories of Beaufort were found in this set.
Table 7 summarizes the absolute fractions of the DWSs with some specific discrete values of the wind state parameters. These results indicate that the local winds in Mexico City during the period 2001–2006 were blowing mainly (59%) from the north sectors (NW, N, and NE) of the city, with low intensities (9%
calms, 65%
light air, 24%
light breeze, and 2%
gentle breeze), and with convergent (78%) and cyclonic (61%) features.
Table 7.
Percentages (%) of the wind events for each discrete value of the wind parameters.
Table 7.
Percentages (%) of the wind events for each discrete value of the wind parameters.
| WSP: Beaufort Categories | Wind Direction | DIV< 0 | VOR> 0 |
|---|
| B0 | B1 | B2 | B3 | N | NE | E | SE | S | SW | W | NW |
|---|
| 9 | 65 | 24 | 2 | 30 | 14 | 7 | 7 | 9 | 10 | 8 | 15 | 78 | 61 |
On the other hand, in order to obtain a better description of wind behavior in Mexico City throughout the day, the set of discrete wind states was partitioned and organized into three subsets according to their occurrence hours: early morning (00-07 CST), morning and early afternoon (08-15 CST), and late afternoon and night (16-23 CST). The hour ID (00, 01, 02 …) denotes the beginning of 1 h averaging period of the original wind data. These time windows were selected according to the following criteria. Let us consider
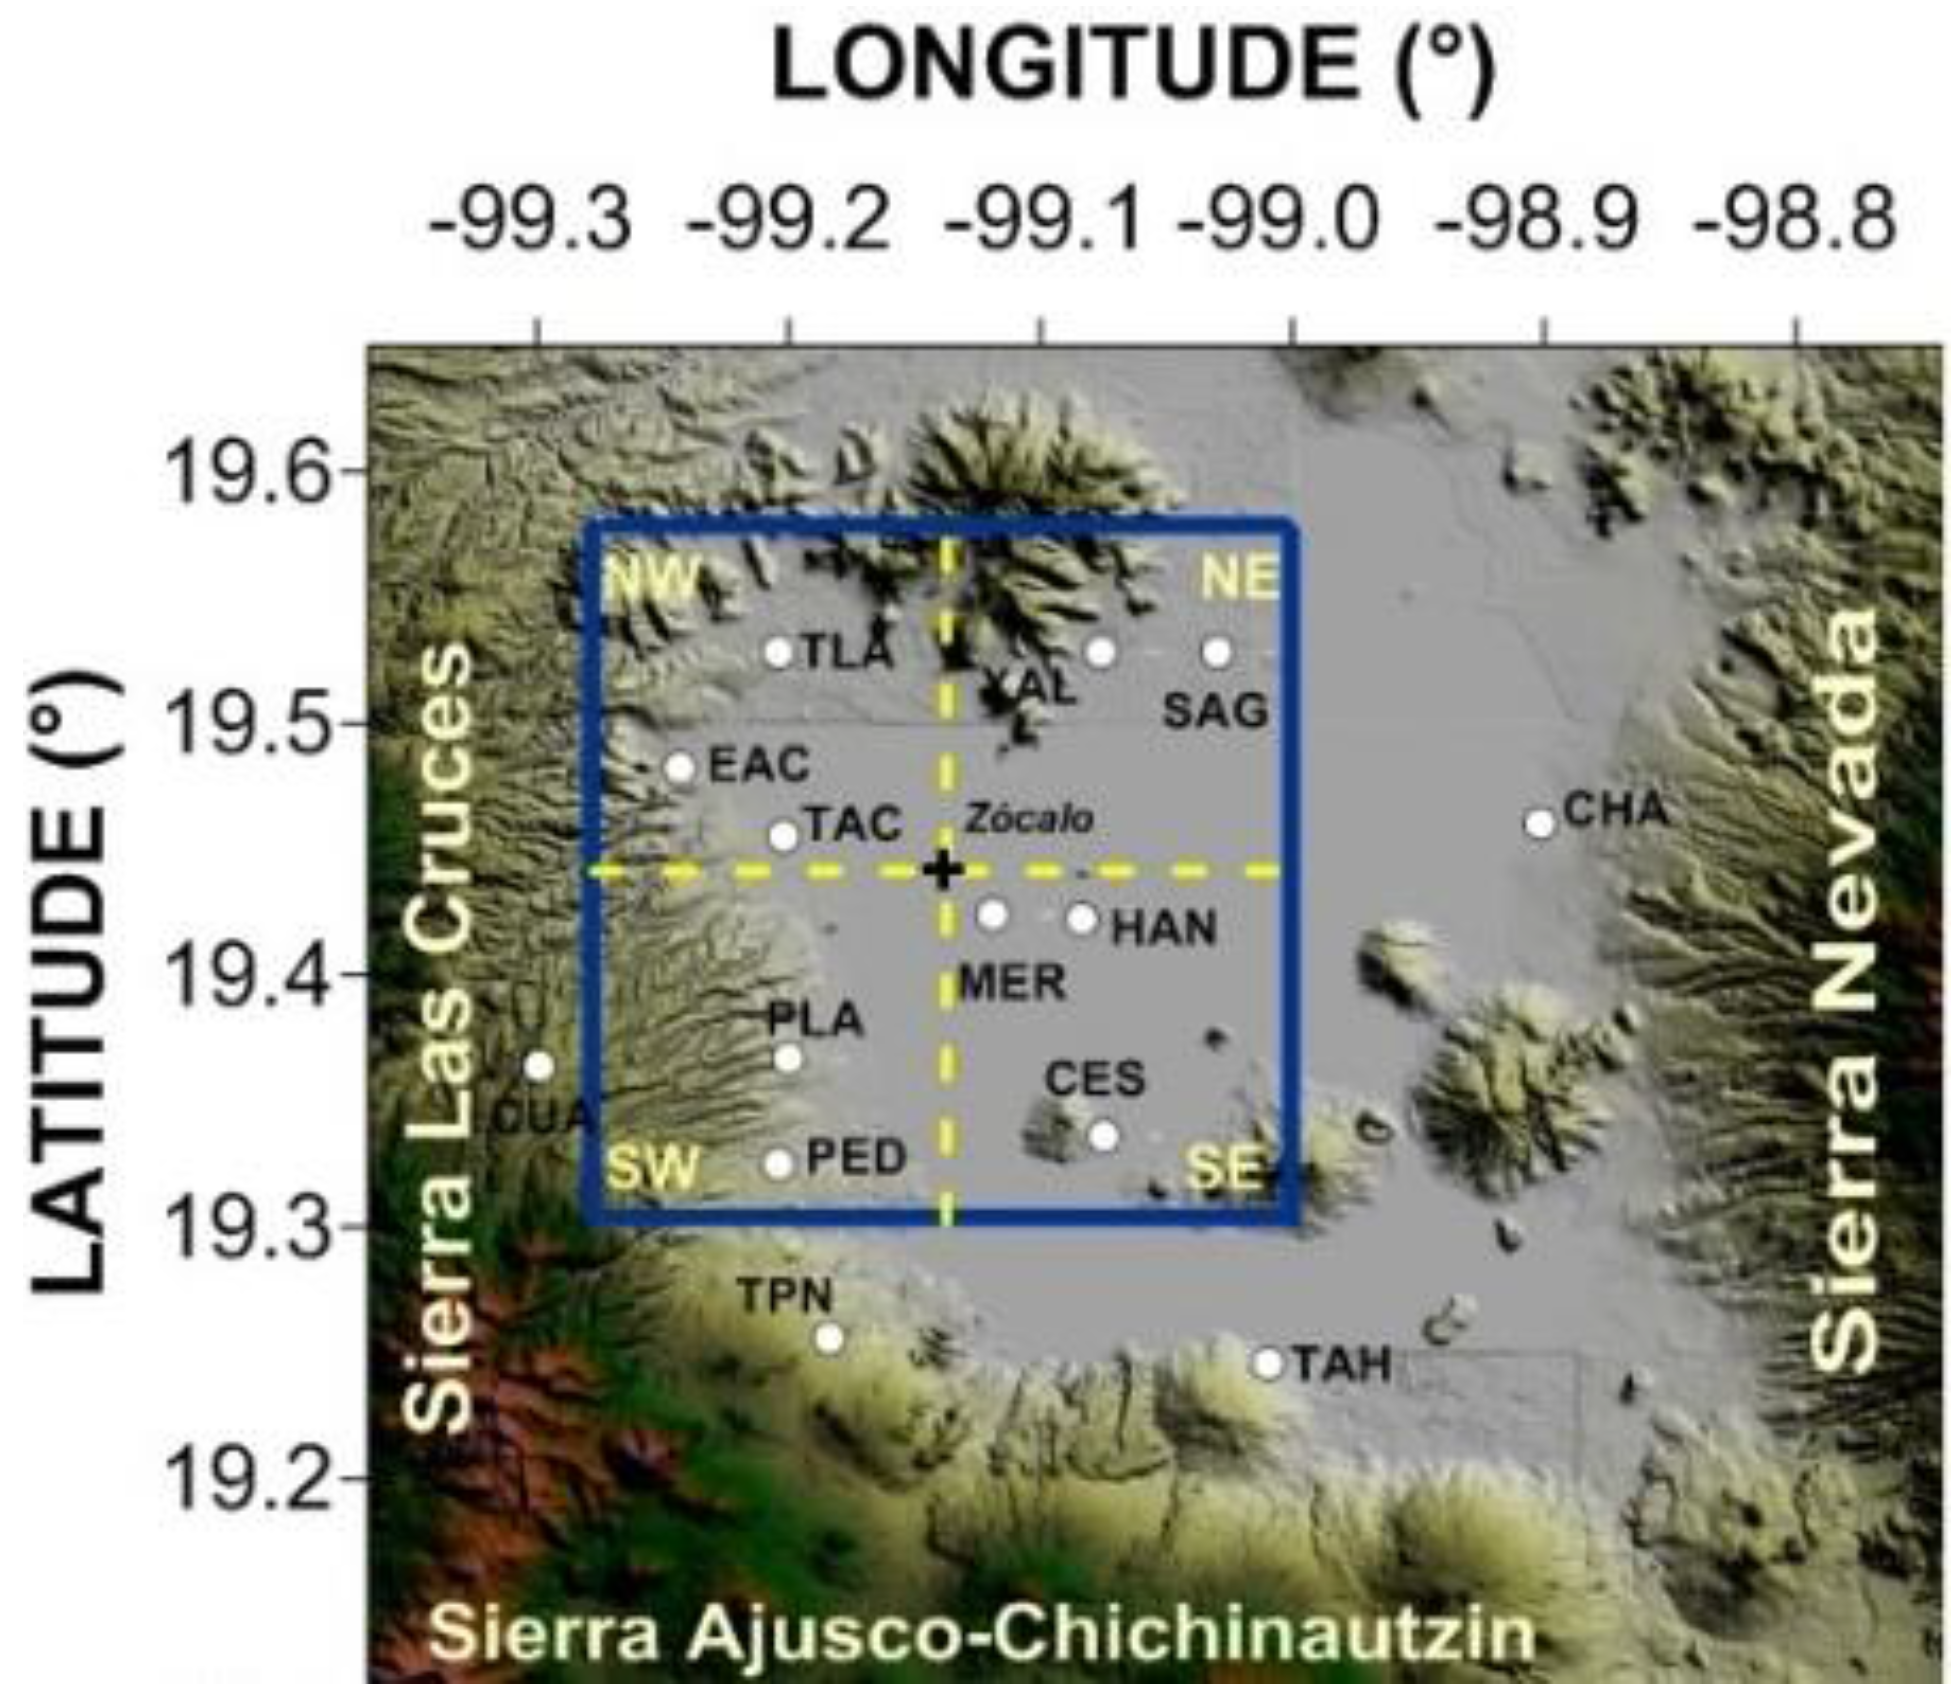
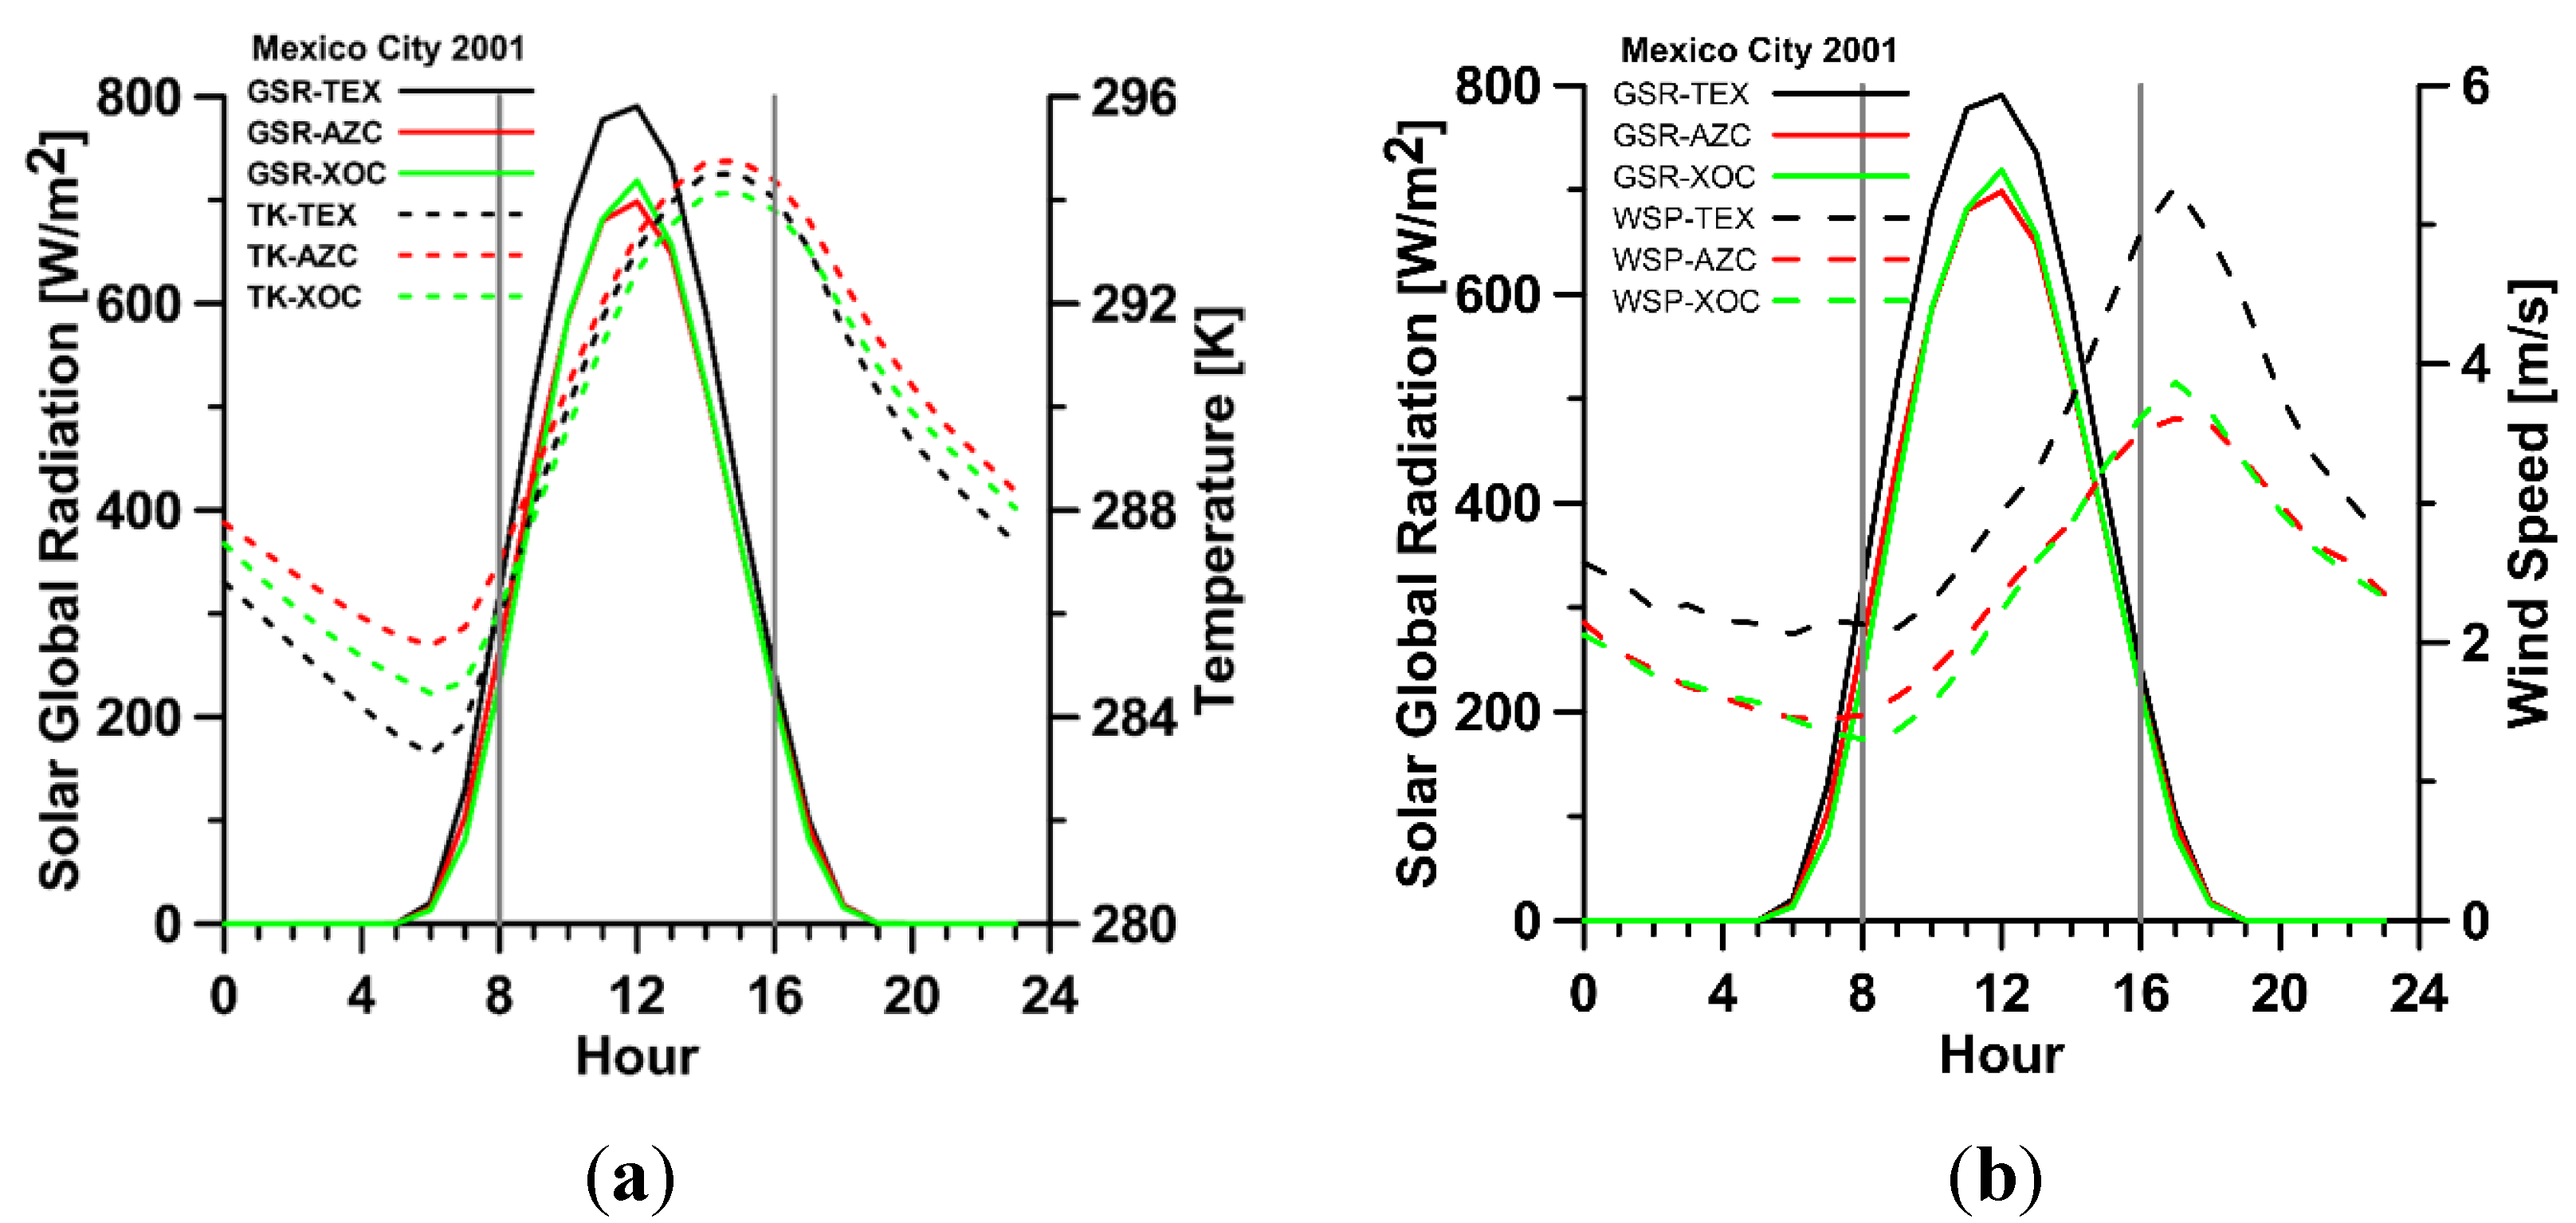
Figure 7. It shows the annual average of the hourly trends of global solar radiation, temperature, and wind speed that were measured in three sites of Mexico City during the first long-term surface micrometeorological campaign (IIE2001) carried out in this region throughout the year 2001 [
21]. The measuring sites, called Texcoco (TEX), Azcapotzalco (AZC), and Xochimilco (XOC), were located in the NE, NW and SE quadrants of the city (
Table 8).
Figure 7.
Annual averages of the hourly trends of global solar radiation (GSR), temperature (TK), and wind speed (WSP) measured in Mexico City at the stations Texcoco (TEX), Azcapotzalco (AZC) and Xochimilco (XOC) during the IIE2001 campaign [
21].
Figure 7.
Annual averages of the hourly trends of global solar radiation (GSR), temperature (TK), and wind speed (WSP) measured in Mexico City at the stations Texcoco (TEX), Azcapotzalco (AZC) and Xochimilco (XOC) during the IIE2001 campaign [
21].
Table 8.
Micrometeorological stations of the IIE2001 campaign.
Table 8.
Micrometeorological stations of the IIE2001 campaign.
| Station | ID | Quadrant | Latitude (N) | Longitude (W) | Altitude (masl) |
|---|
| Texcoco | TEX | NE | 19° 27’ 53.1” | 98° 59’ 54.4” | 2250 |
| Azcapotzalco | AZC | NW | 19° 30’ 9.4” | 99° 11’ 12.2” | 2190 |
| Xochimilco | XOC | SE | 19° 18’ 18.3” | 99° 6’ 6.2” | 2250 |
According to this figure, the first time window (early morning) starts at midnight and finishes two hours after sunrise; this is the coldest period of the day (
Figure 7a), as the temperature decreases from 287 to a minimum of 285 K at sunrise (6:30h CST). As shown in
Figure 7b, a slow decrease in wind speed (with values around 2 m/s) is observed during this period, and it reaches its minimum value around hour 8. Of course, it is expected that fully developed katabatic winds will be observed driven by the Mexico City mountain-valley system during these hours. The second time window (morning and early afternoon) comprises the main part of the daylight hours, starting after sunrise and finishing two hours before sunset; this is the period of maximum solar irradiance and temperature grows and reaches its maximum around hour 15 of the day (
Figure 7a), while wind speed increases and reaches its maximum value around hour 17 (
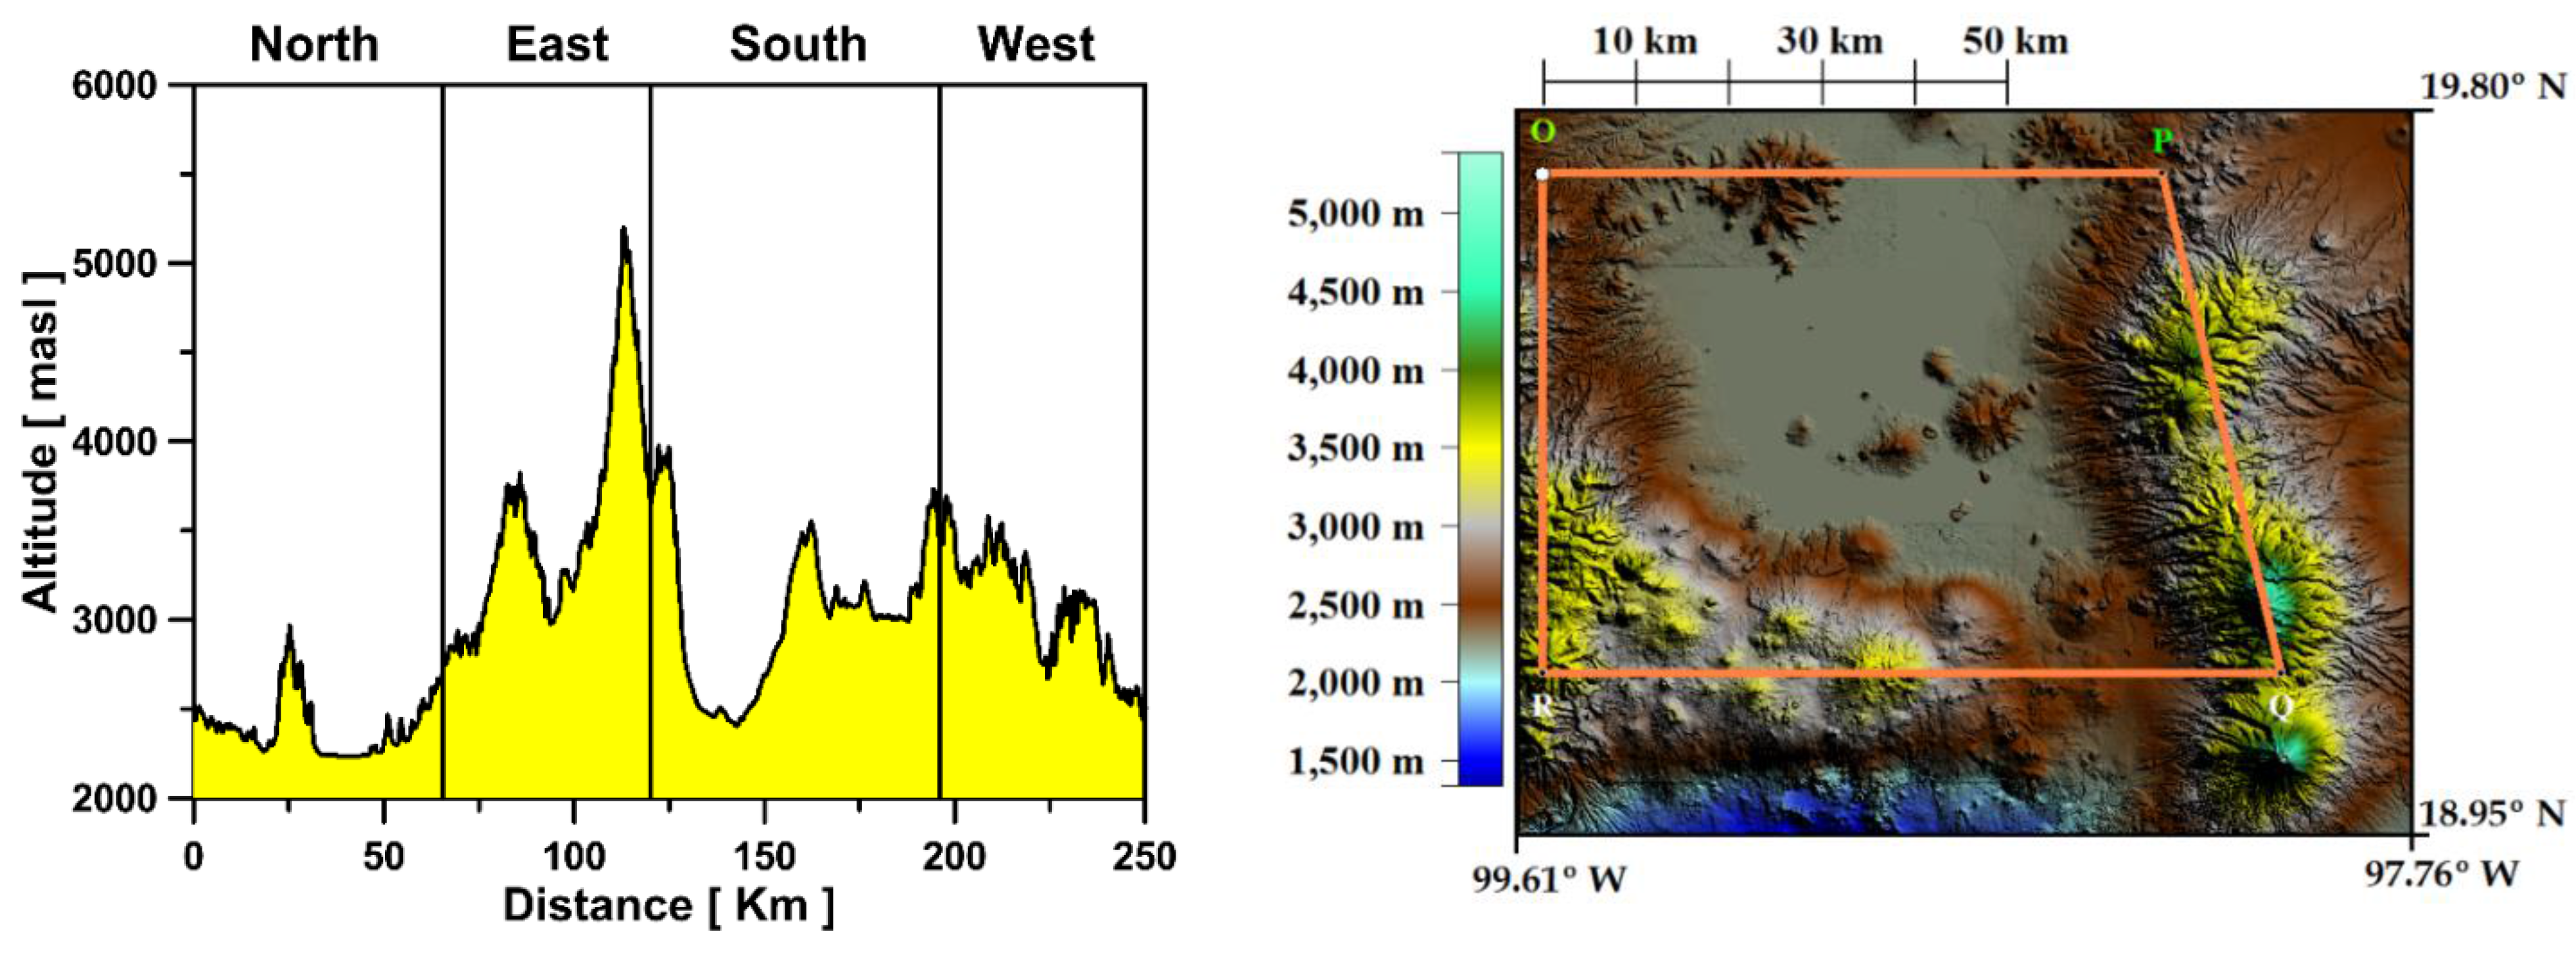
Figure 7b). It can be expected that prevailing local winds in this period are driven by the synoptic circulation and the temperature gradients between the city and its surroundings, also reflecting the effect of the South-North wind channel located at the east side of the city (
Figure 1). The third time window (late afternoon and night) starts one or two hours before sunset and finishes at midnight. This is the cooling period of the day; the global solar radiation drops to zero between hours 18 and 19, temperature decreases from 295 to 288 K (
Figure 7a) and wind speed quickly decreases from 5.5 m/s to 2 m/s, approximately (
Figure 7b). During this period, wind behavior is expected that reflects the superposing of the remaining gap winds of the late afternoon with the start of katabatic wind development, especially close to the mountains located at the west side of the city. These observations suggest that a partition of the day into time windows 8 h long could be appropriate for analyzing the time behavior of Mexico City winds, at least as a first approximation.
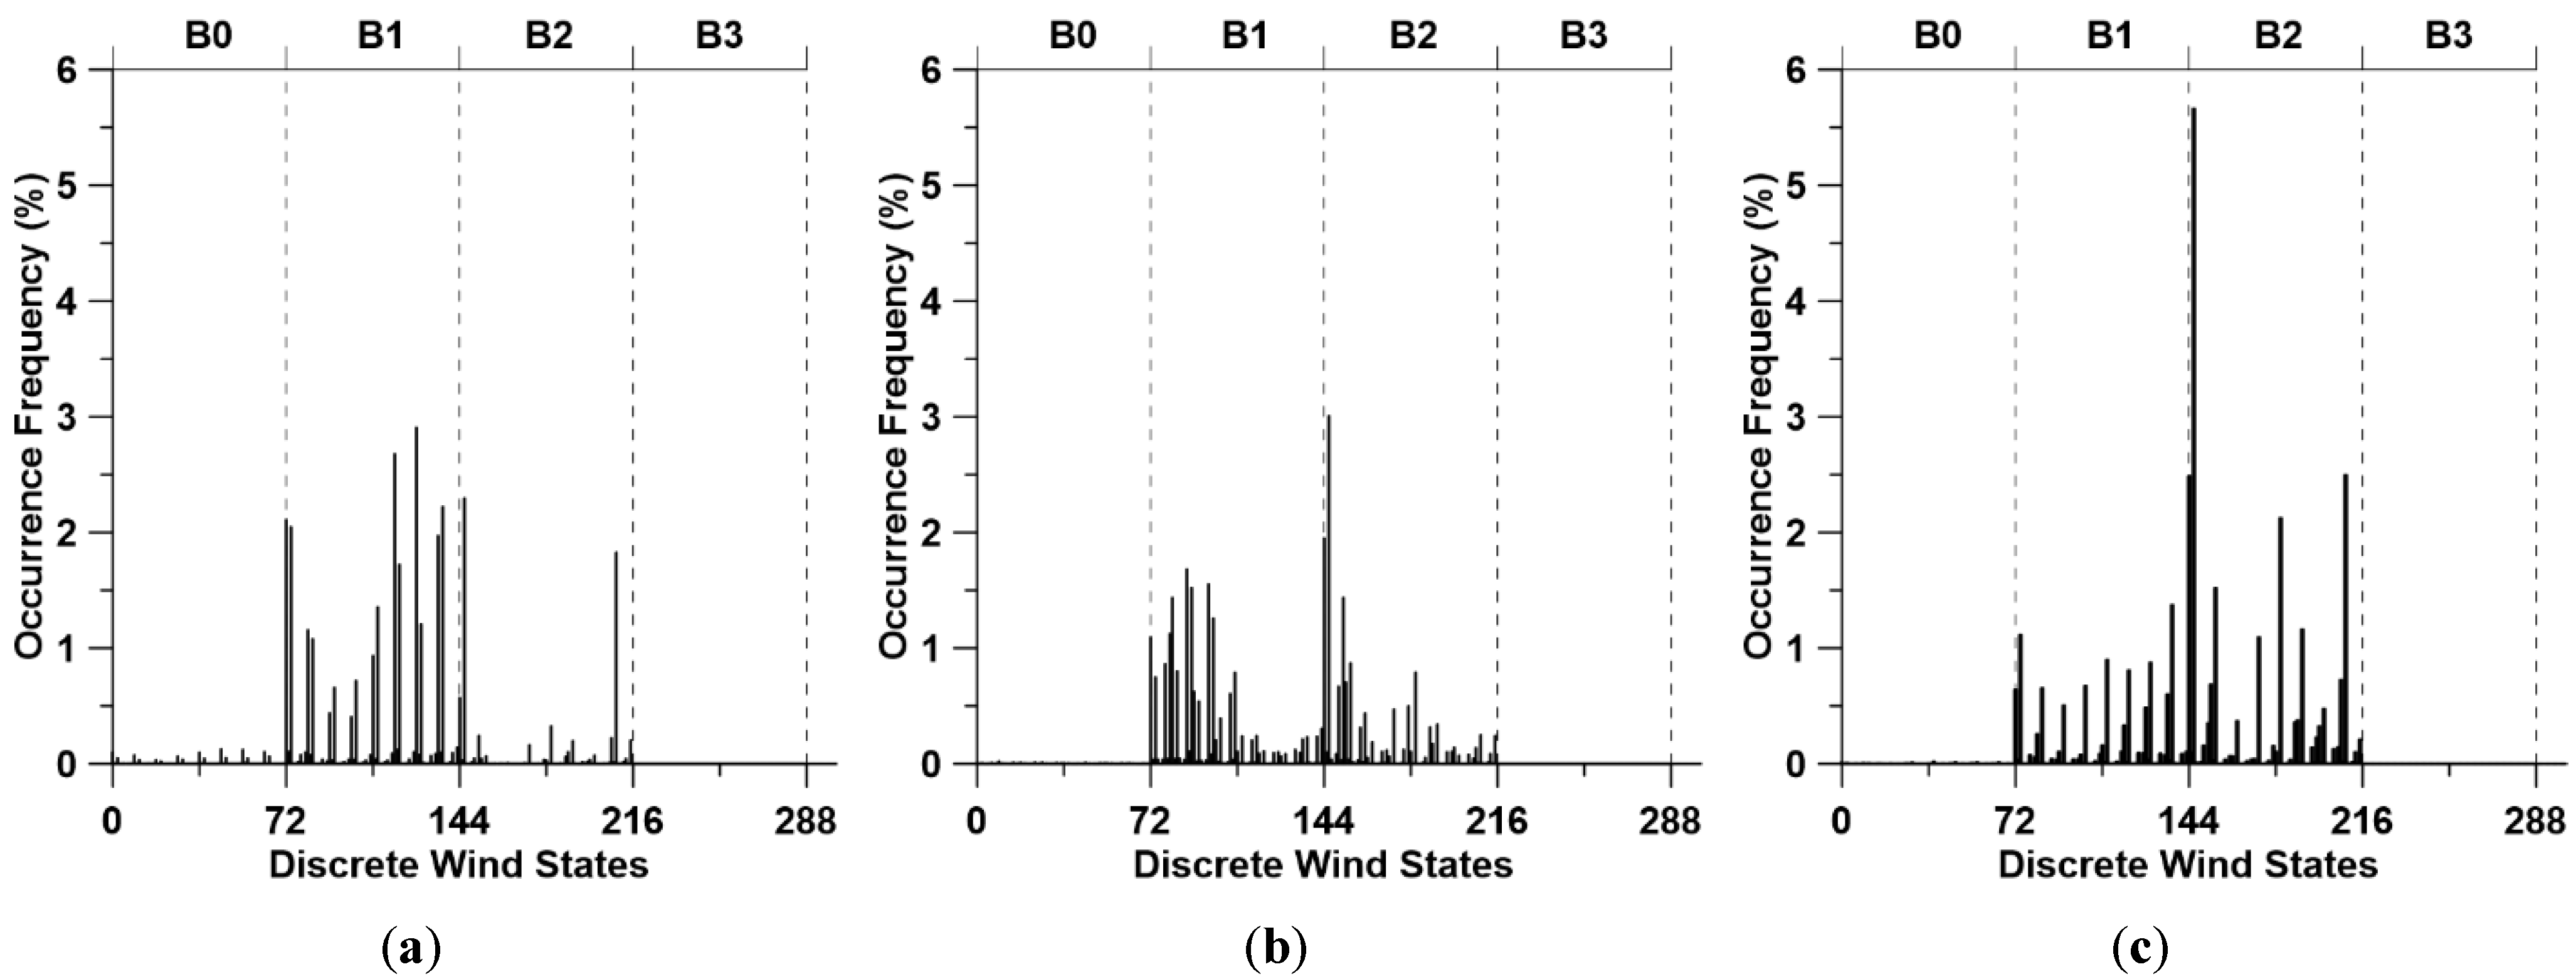
Graphs (a), (b), and (c) in
Figure 8 show the occurrence frequencies of the discrete wind states that belong to the subsets identified by the time windows defined above. The occurrence frequency distributions shown in these figures reflect, qualitatively, the same general features of wind speed shown in
Figure 7b.
Table 9 summarizes the percentages of wind events (relative to the total number of 52,584 events) that occurred, with some specific discrete values of the wind parameters for the same 8h-periods. This table, in terms of the percentages relative to the number of events of the 8h-period over 6 years (17,528), shows that the prevailing winds had the following characteristics: Early morning (00-07 CST): Winds were convergent (93%), had intensities from 0.25 to 1.5 m/s (75%), and were blowing from N, NW, W and SW (75%) with a slight predominance of cyclonic vorticity (54%). Morning and early afternoon (08-15 CST): Winds were blowing from N, NE and E (72%), had intensities from 0.5 to 3.5 m/s, and revealed a slight predominance of convergence (51%) and cyclonic vorticity (57%). Late afternoon and night (16-23 CST): Winds were convergent (90%) and cyclonic (72%), had intensities from 1.5 to 3.5 m/s (66%), and were blowing mainly from N, NW, and S (63%).
Figure 8.
Occurrence frequencies of Mexico City discrete wind states. (a) 00-07 CST (early morning); (b) 08-15 CST (morning and early afternoon); and (c) 16-23 CST (late afternoon and night). Each frequency is the percentage of the number of times one discrete wind state was observed in the city, relative to the total number of wind events that occurred throughout the years 2001–2006.
Table 9.
Absolute percentages of the wind events for discrete values of the wind parameters.
Table 9.
Absolute percentages of the wind events for discrete values of the wind parameters.
| Time Period CST | WSP Beaufort Categories | Wind Direction | DIV < 0 | VOR > 0 |
|---|
| B0 | B1 | B2 | B3 | N | NE | E | SE | S | SW | W | NW |
|---|
| 00-07 | 1 | 25 | 7 | 0 | 8 | 3 | 1 | 2 | 3 | 5 | 5 | 7 | 31 | 18 |
| 08-15 | 0 | 19 | 15 | 0 | 11 | 8 | 5 | 3 | 2 | 1 | 1 | 2 | 17 | 19 |
| 16-23 | 0 | 11 | 22 | 0 | 11 | 3 | 1 | 2 | 4 | 3 | 3 | 6 | 30 | 24 |
| Total | 1 | 55 | 44 | 0 | 30 | 14 | 7 | 7 | 9 | 9 | 9 | 15 | 78 | 61 |
In
Table 10, the characteristics of the first ten highest frequency discrete wind states are described for each one of the 8 h periods. Early Morning (00-07 CST): the main wind states represent convergent low intensity winds (
light air, in the Beaufort scale) blowing mainly from the N and NW (in average) with predominance of cyclonic vorticity. Morning and Early Afternoon (08-15 CST): the main wind states represent divergent, low intensity winds, blowing mainly from the N and NE (in average), with no predominance of any kind of vorticity. Late Afternoon and Night (16-23 CST): the main wind states represent winds with convergent and cyclonic features, blowing mainly from N and NW with speeds in the range of 1.5 to 3.5 m/s (
light breeze, in the Beaufort scale).
3.3. Mexico City Wind Direction States (2001–2006)
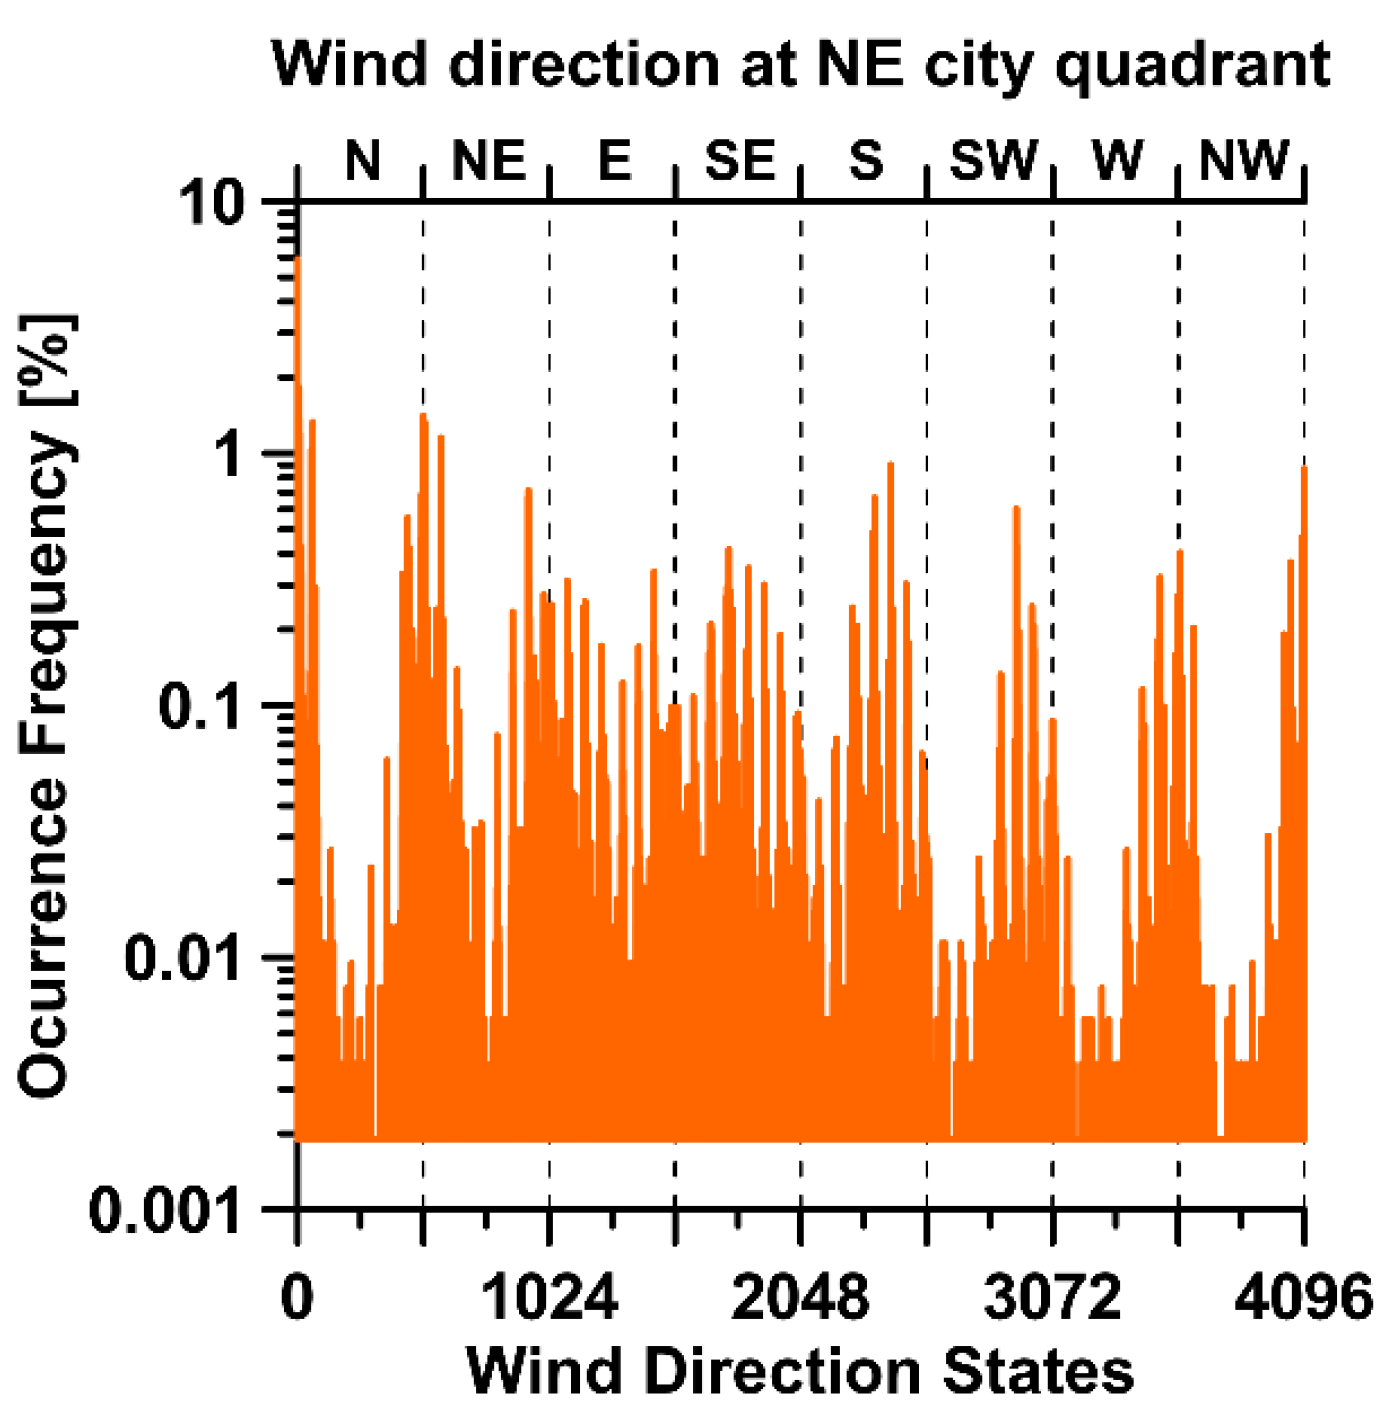
Finally, a schematic view of the wind circulation in Mexico City is given by the WDSs that occurred in the city during the study period.
Figure 9 shows the frequency distribution of the WDS.
Table 11 summarizes the characteristics of the first 20 with the highest frequencies of occurrence.
Table 10.
First ten highest frequency DWS for the time periods 00-07 CST (early morning), 08-15 CST (morning and early afternoon), and 16-23 CST (late afternoon and night).
Table 10.
First ten highest frequency DWS for the time periods 00-07 CST (early morning), 08-15 CST (morning and early afternoon), and 16-23 CST (late afternoon and night).
| Time Period | State ID | (U, θ, γ, ω) | Frequency (%) | WSP (m/s) | WDR | γ | ω |
|---|
| 00-07 CST | 126 | ( 1, 6, 0, 0) | 2.9077 | 0.25 < v < 1.5 | W | Convergent | Anticyclonic |
| 117 | ( 1, 5, 0, 0) | 2.6776 | 0.25 < v < 1.5 | SW | Convergent | Anticyclonic |
| 146 | ( 2, 0, 0, 2) | 2.2954 | 1.5 < v < 3.5 | N | Convergent | Cyclonic |
| 137 | ( 1, 7, 0, 2) | 2.2231 | 0.25 < v < 1.5 | NW | Convergent | Cyclonic |
| 72 | ( 1, 0, 0, 0) | 2.1109 | 0.25 < v < 1.5 | N | Convergent | Anticyclonic |
| 74 | ( 1, 0, 0, 2) | 2.0462 | 0.25 < v < 1.5 | N | Convergent | Cyclonic |
| 135 | ( 1, 7, 0, 0) | 1.9721 | 0.25 < v < 1.5 | NW | Convergent | Anticyclonic |
| 209 | ( 2, 7, 0, 2) | 1.8276 | 1.5 < v < 3.5 | NW | Convergent | Cyclonic |
| 119 | ( 1, 5, 0, 2) | 1.7230 | 0.25 < v < 1.5 | SW | Convergent | Cyclonic |
| 110 | ( 1, 4, 0, 2) | 1.3559 | 0.25 < v < 1.5 | S | Convergent | Cyclonic |
| 08-15 CST | 146 | ( 2, 0, 0, 2) | 3.0066 | 1.5 < v < 3.5 | N | Convergent | Cyclonic |
| 144 | ( 2, 0, 0, 0) | 1.9512 | 1.5 < v < 3.5 | N | Convergent | Anticyclonic |
| 87 | ( 1, 1, 2, 0) | 1.6811 | 0.25 < v < 1.5 | NE | Divergent | Anticyclonic |
| 96 | ( 1, 2, 2, 0) | 1.5518 | 0.25 < v < 1.5 | E | Divergent | Anticyclonic |
| 89 | ( 1, 1, 2, 2) | 1.5195 | 0.25 < v < 1.5 | NE | Divergent | Cyclonic |
| 81 | ( 1, 1, 0, 0) | 1.4358 | 0.25 < v < 1.5 | NE | Convergent | Anticyclonic |
| 152 | ( 2, 0, 2, 2) | 1.4358 | 1.5 < v < 3.5 | N | Divergent | Cyclonic |
| 98 | ( 1, 2, 2, 2) | 1.2589 | 0.25 < v < 1.5 | E | Divergent | Cyclonic |
| 80 | ( 1, 0, 2, 2) | 1.1239 | 0.25 < v < 1.5 | N | Divergent | Cyclonic |
| 72 | ( 1, 0, 0, 0) | 1.0954 | 0.25 < v < 1.5 | N | Convergent | Anticyclonic |
| 16-23 CST | 146 | ( 2, 0, 0, 2) | 5.6614 | 1.5 < v < 3.5 | N | Convergent | Cyclonic |
| 209 | ( 2, 7, 0, 2) | 2.4970 | 1.5 < v < 3.5 | NW | Convergent | Cyclonic |
| 144 | ( 2, 0, 0, 0) | 2.4874 | 1.5 < v < 3.5 | N | Convergent | Anticyclonic |
| 182 | ( 2, 4, 0, 2) | 2.1261 | 1.5 < v < 3.5 | S | Convergent | Cyclonic |
| 155 | ( 2, 1, 0, 2) | 1.5195 | 1.5 < v < 3.5 | NE | Convergent | Cyclonic |
| 137 | ( 1, 7, 0, 2) | 1.3730 | 0.25 < v < 1.5 | NW | Convergent | Cyclonic |
| 191 | ( 2, 5, 0, 2) | 1.1639 | 1.5 < v < 3.5 | SW | Convergent | Cyclonic |
| 74 | ( 1, 0, 0, 2) | 1.1144 | 0.25 < v < 1.5 | N | Convergent | Cyclonic |
| 173 | ( 2, 3, 0, 2) | 1.0954 | 1.5 < v < 3.5 | SE | Convergent | Cyclonic |
| 110 | ( 1, 4, 0, 2) | 0.8995 | 0.25 < v < 1.5 | S | Convergent | Cyclonic |
In
Figure 9, each WDS is identified by the decimal form of its octal ID. The x-axis is divided into 8 blocks; each one comprises the set of WDS for a given wind direction in the NE city quadrant (top axis). By its proper definition, the number of possible WDSs is 4096, but only the 66% of them were observed in the city in the period 2001–2006. The frequencies are expressed as percentages relative to the total number of wind events (52,584) in the study period. The scale of the y-axis has been set as logarithmic to facilitate the visualization of the smaller frequencies. As observed in
Table 11, the occurrence frequency (5.92%) of WDS 0 (0000, northerly wind at all quadrants) is three times larger than WDS 7 (0007, northwesterly wind at SE quadrant, and northerly at other three) with the second-highest frequency (1.83%) and almost ten times larger than the WDS with the smallest frequency in this table.
Figure 9.
Occurrence frequencies of Mexico City wind direction states for the period of 2001–2006.
Figure 9.
Occurrence frequencies of Mexico City wind direction states for the period of 2001–2006.
Table 11.
First 20 highest frequency wind direction states occurred during the years 2001–2006
Table 11.
First 20 highest frequency wind direction states occurred during the years 2001–2006
| WDS (DEC) | WDS (OCT) | Events | Frequency (%) |
|---|
| 0 | 0000 | 3111 | 5.92 |
| 7 | 0007 | 961 | 1.83 |
| 511 | 0777 | 740 | 1.41 |
| 1 | 0001 | 726 | 1.38 |
| 8 | 0010 | 718 | 1.37 |
| 63 | 0077 | 702 | 1.34 |
| 513 | 1001 | 695 | 1.32 |
| 521 | 1011 | 692 | 1.32 |
| 512 | 1000 | 640 | 1.22 |
| 9 | 0011 | 629 | 1.20 |
| 585 | 1111 | 607 | 1.15 |
| 56 | 0070 | 543 | 1.03 |
| 2412 | 4554 | 475 | 0.90 |
| 4095 | 7777 | 459 | 0.87 |
| 4094 | 7776 | 403 | 0.77 |
| 939 | 1653 | 377 | 0.72 |
| 504 | 0770 | 361 | 0.69 |
| 938 | 1652 | 353 | 0.67 |
| 2348 | 4454 | 351 | 0.67 |
| 510 | 0776 | 336 | 0.64 |
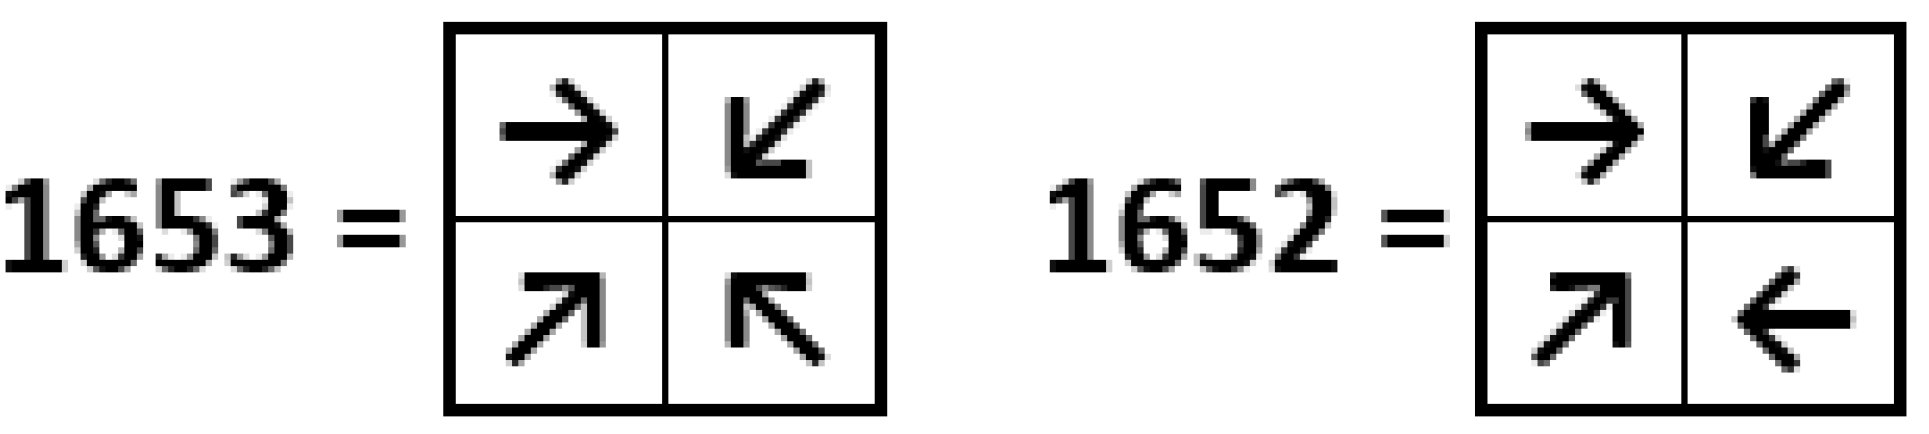
As a whole, the twenty wind direction states summarized in
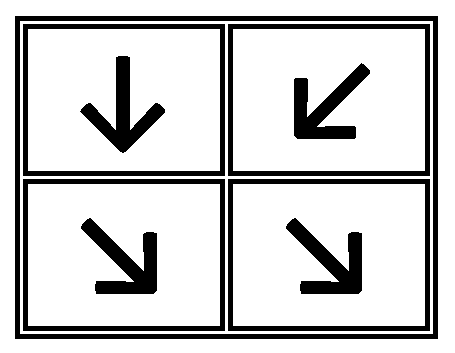
Table 11 make up the 26% of the total number of hourly model wind events. All the WDS presented in this table represent winds with a flow component from north in at least three of the city quadrants, with exception of the wind direction states identified by the octal numbers 4554, 1653, 1652, and 4454. The states 4554 and 4454 represent winds with a flow component from south, while the states 1653 and 1652 represent highly convergent winds toward the city’s downtown (
Figure 10).
Figure 10.
The most frequent highly convergent WDS observed in Mexico City (2001–2006).
Figure 10.
The most frequent highly convergent WDS observed in Mexico City (2001–2006).
Table 12,
Table 13 and
Table 14 summarize the highest-frequency Mexico City wind direction states for the 00-07 CST, 08-15 CST, and 16-23 CST time periods. Each table shows the first fifteen WDS with the highest frequencies for one of the 8h-periods. These frequencies are relative to the total number of wind events in the study period.
Table 12.
00-07 CST.
| WDS (D) | WDS (O) | FREQ (%) | WIND FLOW |
|---|
| 0 | 0000 | 0.8824 | ↓ | ↓ |
| ↓ | ↓ |
| 939 | 1653 | 0.6903 | → | ↙ |
| ↗ | ↖ |
| 938 | 1652 | 0.6504 | → | ↙ |
| ↗ | ← |
| 63 | 0077 | 0.6181 | ↓ | ↓ |
| ↘ | ↘ |
| 511 | 0777 | 0.5933 | ↘ | ↓ |
| ↘ | ↘ |
| 7 | 0007 | 0.5230 | ↓ | ↓ |
| ↓ | ↘ |
| 4094 | 7776 | 0.4032 | ↘ | ↘ |
| ↘ | → |
| 510 | 0776 | 0.3537 | ↘ | ↓ |
| ↘ | → |
| 62 | 0076 | 0.3442 | ↓ | ↓ |
| ↘ | → |
| 427 | 0653 | 0.3195 | → | ↓ |
| ↗ | ↖ |
| 56 | 0070 | 0.3157 | ↓ | ↓ |
| ↘ | ↓ |
| 1451 | 2653 | 0.3081 | → | ← |
| ↗ | ↖ |
| 4095 | 7777 | 0.2929 | ↘ | ↘ |
| ↘ | ↘ |
| 428 | 0654 | 0.2872 | → | ↓ |
| ↗ | ↖ |
| 940 | 1654 | 0.2872 | → | ↓ |
| ↗ | ↑ |
Table 13.
08-15 CST.
| WDS (D) | WDS (O) | FREQ (%) | WIND FLOW |
|---|
| 0 | 0000 | 2.6206 | ↓ | ↓ |
| ↓ | ↓ |
| 8 | 0010 | 0.9490 | ↓ | ↓ |
| ↙ | ↓ |
| 521 | 1011 | 0.8881 | ↓ | ↙ |
| ↙ | ↙ |
| 9 | 0011 | 0.8805 | ↓ | ↓ |
| ↙ | ↙ |
| 7 | 0007 | 0.8539 | ↓ | ↓ |
| ↓ | ↘ |
| 585 | 1111 | 0.8044 | ↙ | ↙ |
| ↙ | ↙ |
| 1 | 0001 | 0.5762 | ↓ | ↓ |
| ↓ | ↙ |
| 512 | 1000 | 0.5268 | ↓ | ↙ |
| ↓ | ↓ |
| 513 | 1001 | 0.4906 | ↓ | ↙ |
| ↓ | ↙ |
| 522 | 1012 | 0.3537 | ↓ | ↙ |
| ↙ | ← |
| 520 | 1010 | 0.3423 | ↓ | ↙ |
| ↙ | ↓ |
| 586 | 1112 | 0.3233 | ↙ | ↙ |
| ↙ | ← |
| 584 | 1110 | 0.2967 | ↙ | ↙ |
| ↙ | ↓ |
| 1098 | 2112 | 0.2891 | ↙ | ← |
| ↙ | ← |
| 1746 | 3322 | 0.2567 | ↖ | ↖ |
| ← | ← |
In
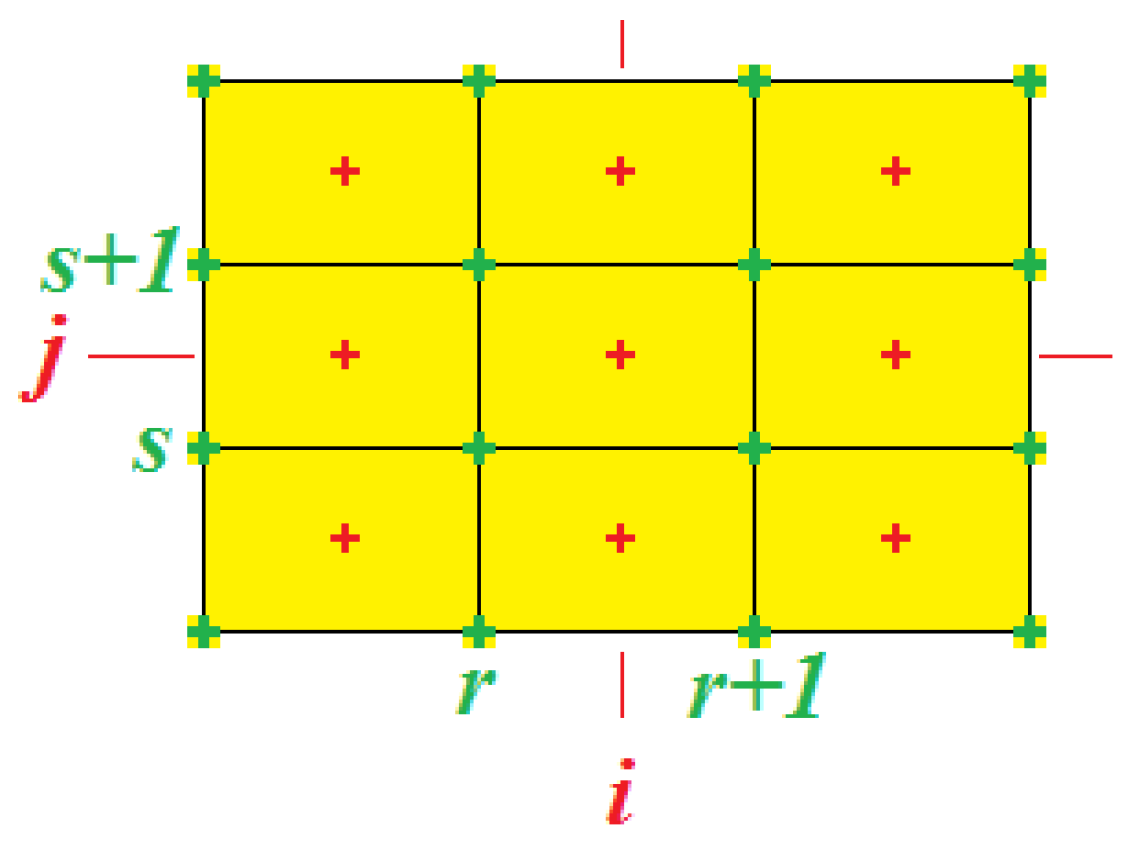
Table 12 (Early Morning), six wind direction states depict highly convergent winds (octal IDs: 1653, 1652, 0653, 2653, 0654, and 1654), seven describe winds with a westerly flow component at the western city quadrants (0077, 0777, 7776, 0776, 0076, 0070 and 7777), and the other two describe northerly winds (0007 and 0000). If we take into account that our lattice domain (
Figure 2) is located relatively far from the eastern mountains (Sierra Nevada), all these states, excepting the last two, suggest katabatic winds blowing down from the surrounding mountains (mainly from Sierra las Cruces and Sierra Ajusco-Chichinautzin) towards the city [
25,
26]. In
Table 13 (Morning and Early Afternoon), five of the wind direction states describe northerly winds (0000, 0010, 0007, 0001 and 1000), seven describe northeasterly winds (1011, 0011, 1111, 1001, 1010, 1112 and 1110), and the other three represent easterly winds (3322, 2112 and 1012). These WDSs represent the well-known Mexico City prevailing winds, which are mainly driven by the trade winds and the Caribbean low level jet [
25,
26,
27]. The wind direction states in
Table 14 (Late Afternoon and Night) describe winds blowing mainly from the north (0000, 1001, 0070, 1000, 0001, 0007 and 0010), northwest (0777, 0077, 7777 and 0770), and northeast (1011 and 1111), although two of the states (4554 and 4454) correspond to winds blowing from S and SW. These WDS resemble the afternoon northerly and southerly gap winds [
28] that are generated primarily by temperature differences between the basin and its surroundings, similar to the wind systems described by Kimura and Kuwagata [
29]; however, because of the time period being considered, these WDSs could be representing gap winds superposed to katabatic winds.
Table 14.
16-23 CST.
| WDS (D) | WDS (O) | FREQ (%) | WIND FLOW |
|---|
| 0 | 0000 | 2.4133 | ↓ | ↓ |
| ↓ | ↓ |
| 511 | 0777 | 0.7055 | ↘ | ↓ |
| ↘ | ↘ |
| 513 | 1001 | 0.6276 | ↓ | ↙ |
| ↓ | ↙ |
| 56 | 0070 | 0.6066 | ↓ | ↓ |
| ↘ | ↓ |
| 63 | 0077 | 0.5705 | ↓ | ↓ |
| ↘ | ↘ |
| 512 | 1000 | 0.5553 | ↓ | ↙ |
| ↓ | ↓ |
| 2412 | 4554 | 0.5325 | ↗ | ↑ |
| ↗ | ↑ |
| 1 | 0001 | 0.5287 | ↓ | ↓ |
| ↓ | ↙ |
| 4095 | 7777 | 0.5059 | ↘ | ↘ |
| ↘ | ↘ |
| 7 | 0007 | 0.4507 | ↓ | ↓ |
| ↓ | ↘ |
| 504 | 0770 | 0.3841 | ↘ | ↓ |
| ↘ | ↓ |
| 2348 | 4454 | 0.3575 | ↑ | ↑ |
| ↗ | ↑ |
| 8 | 0010 | 0.3385 | ↓ | ↓ |
| ↙ | ↓ |
| 521 | 1011 | 0.3271 | ↓ | ↙ |
| ↙ | ↙ |
| 585 | 1111 | 0.3233 | ↙ | ↙ |
| ↙ | ↙ |


 ,
, 

