3.1. ARM Observations
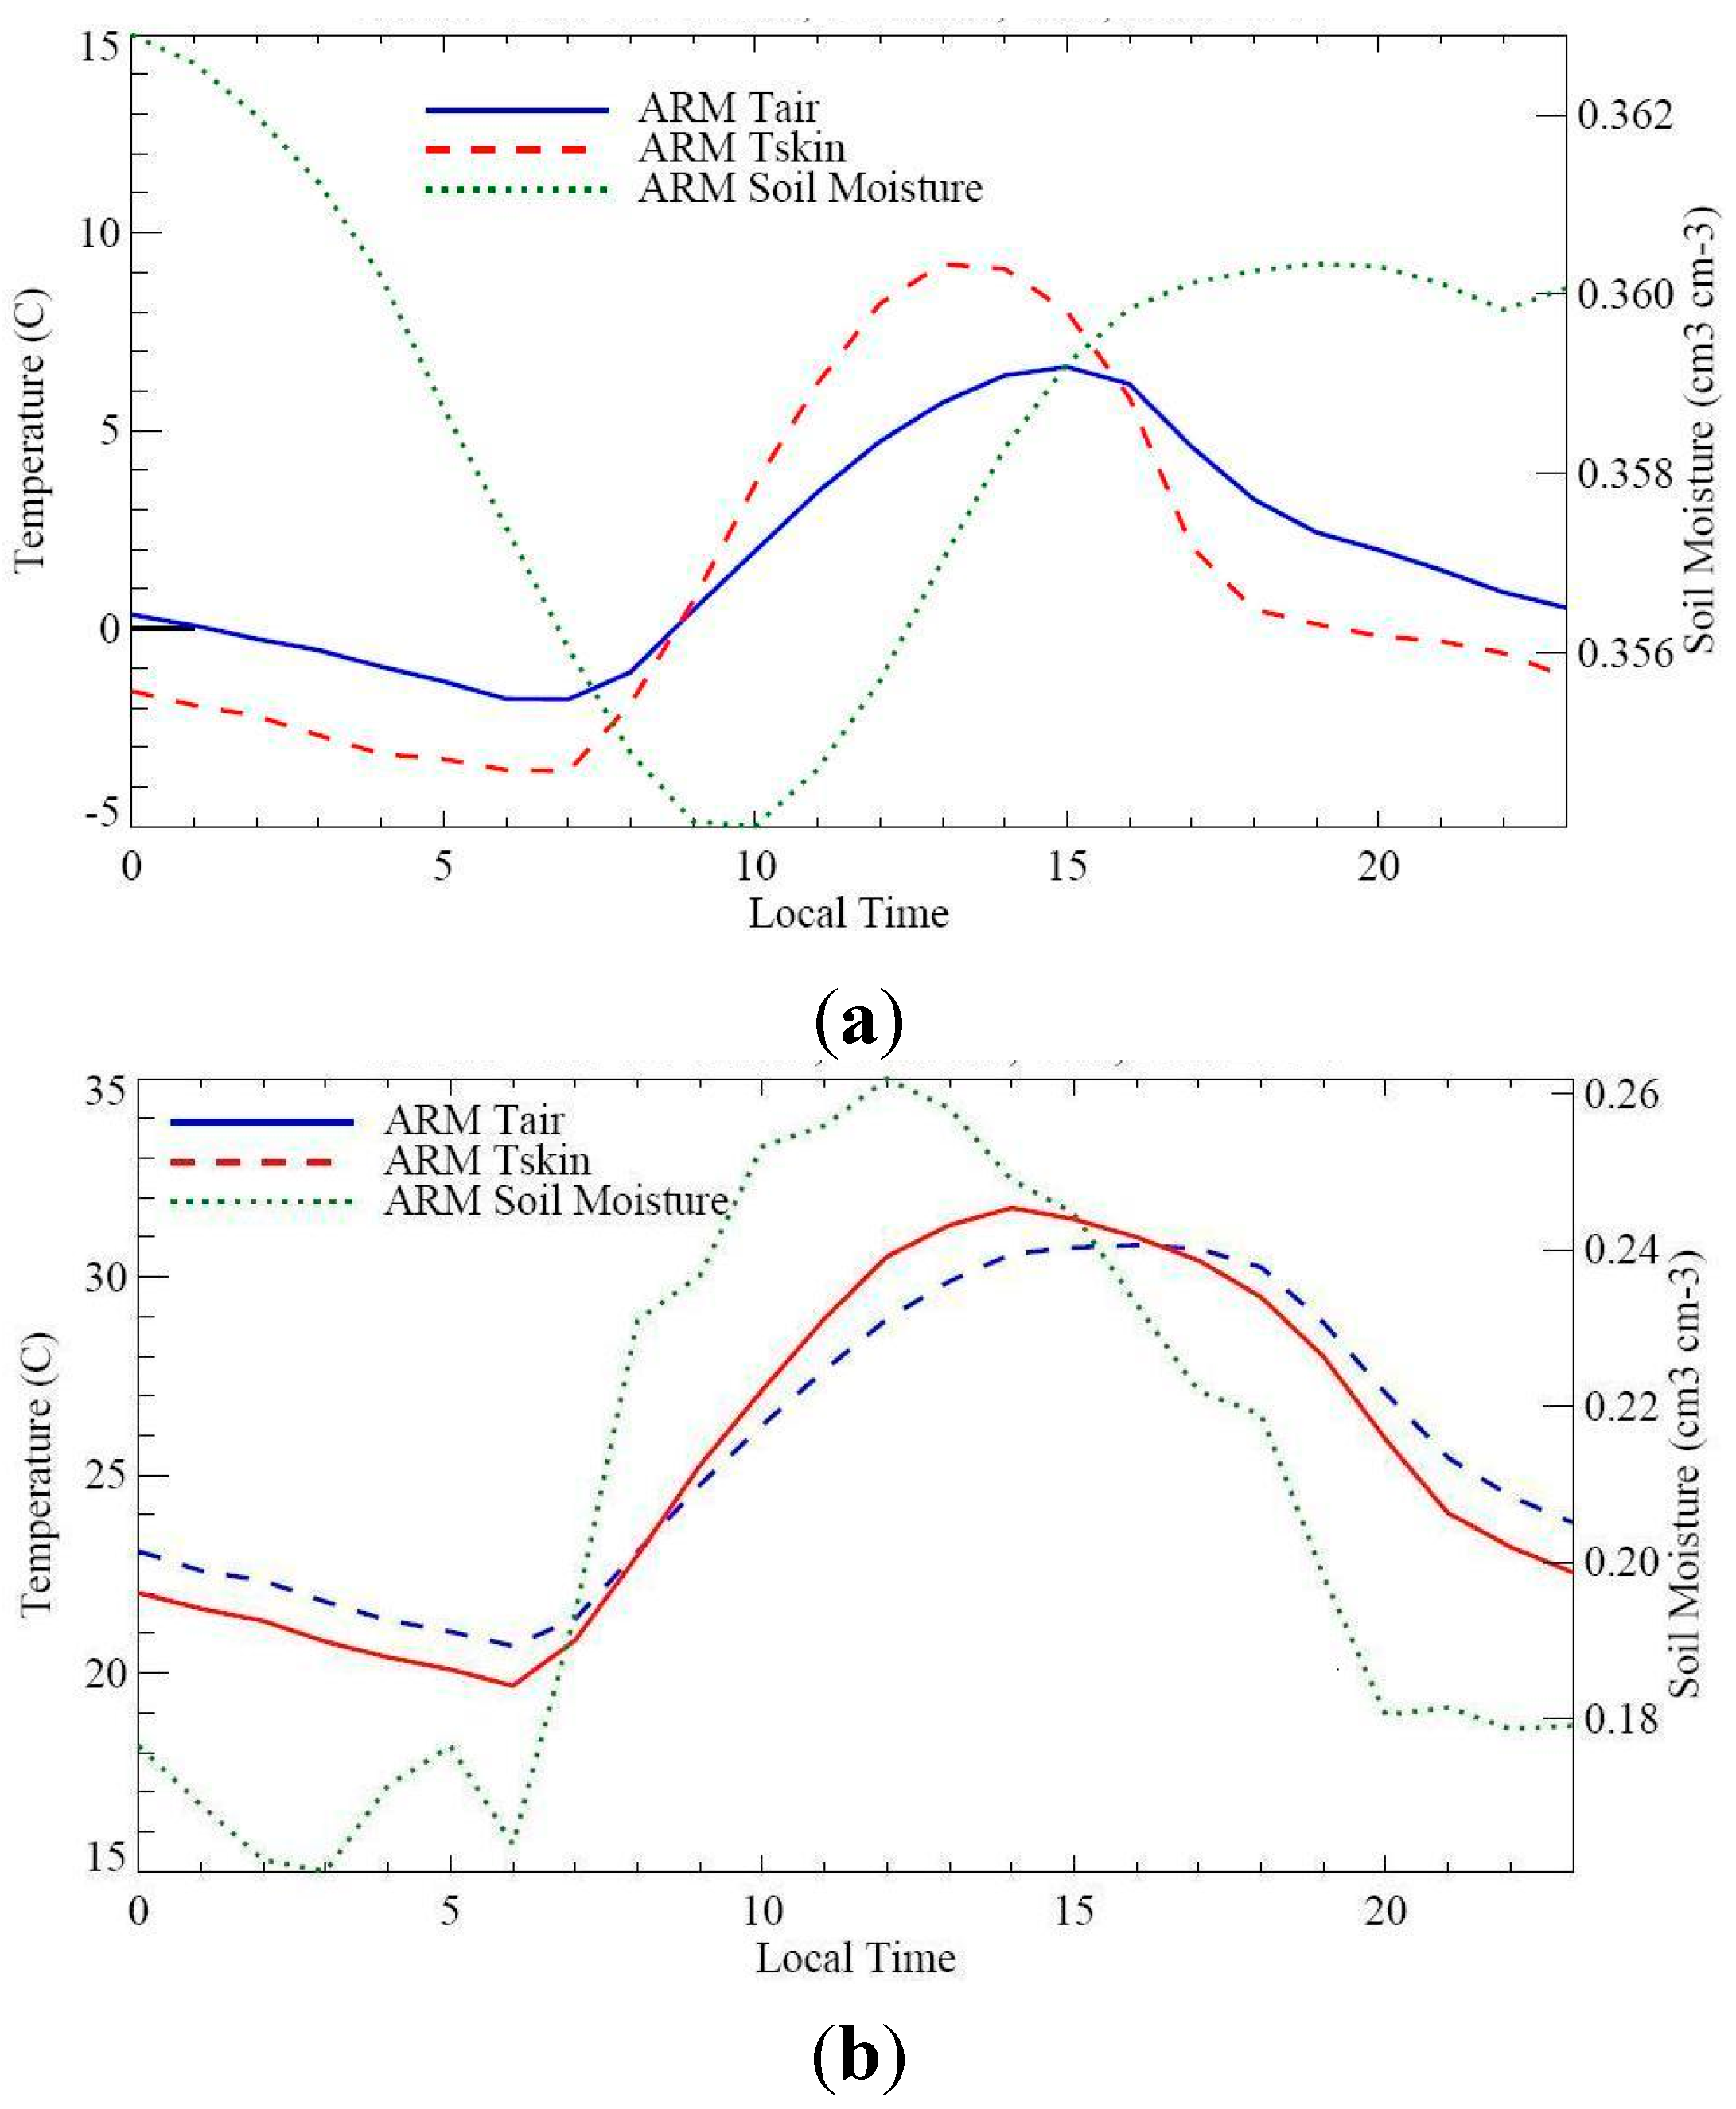
The diurnal cycle is evident on upper soil moisture in both January and July 2004 (
Figure 1). For July, the soil moisture minimum occurred at 03:00 and maximum is at 12:00, before minimum and maximum temperatures. On the other hand, the January minimum daily soil moisture occurred at 10:00, after the minimum air and skin temperatures. Furthermore, the July soil moisture diurnal cycle is less smooth than January, partly because of some missing days of data for July (28 h of missing data for T
skin, 22 h of missing data for T
air, 193 h of missing data for the average of upper and lower soil moisture, or about 8 days). Nevertheless, the primary reason for the July cycle being less smooth is precipitation events during this period of time. In addition, the soil moisture is higher in January, with less monthly variation in January, than in July.
Surface T
skin and 2-m T
air have clear diurnal cycles that follow surface insolation; namely, lowest in the early morning just before sunrise and highest at local noon. Also, due to radiative cooling at night, T
skin is lower than T
air during the night and then increases due to absorption of ground energy during the day. In addition, T
skin is higher than T
air during most of the day. A similar pattern also occurs in July with the largest difference between T
skin and T
air at noon of about 3.0 °C. Such a pattern is typical and is consistent with the earlier observations in other field experiments such as FIFE [
13]; namely, T
skin is higher than T
air during daytime (09:00–16:00) but lower than T
air at night and early morning, before the surface heats up by absorbing surface insolation. Other years of ARM observations during 2000–2008 are also examined (not shown) and the temperature patterns are very similar, except that July soil moisture is largely dependent on local time and rainfall occurrence. Jin and Dickinson have proved that such a typical pattern is a function of land cover, latitude, and cloud conditions [
14].
Figure 1.
Monthly mean diurnal cycle of skin temperature (Tskin), upper-layer soil moisture, and 2-m air temperature (Tair) for (a) January 2004; (b) July 2004. Data is from Atmospheric Radiation Measurement (ARM) Lamont, OK site.
Figure 1.
Monthly mean diurnal cycle of skin temperature (Tskin), upper-layer soil moisture, and 2-m air temperature (Tair) for (a) January 2004; (b) July 2004. Data is from Atmospheric Radiation Measurement (ARM) Lamont, OK site.
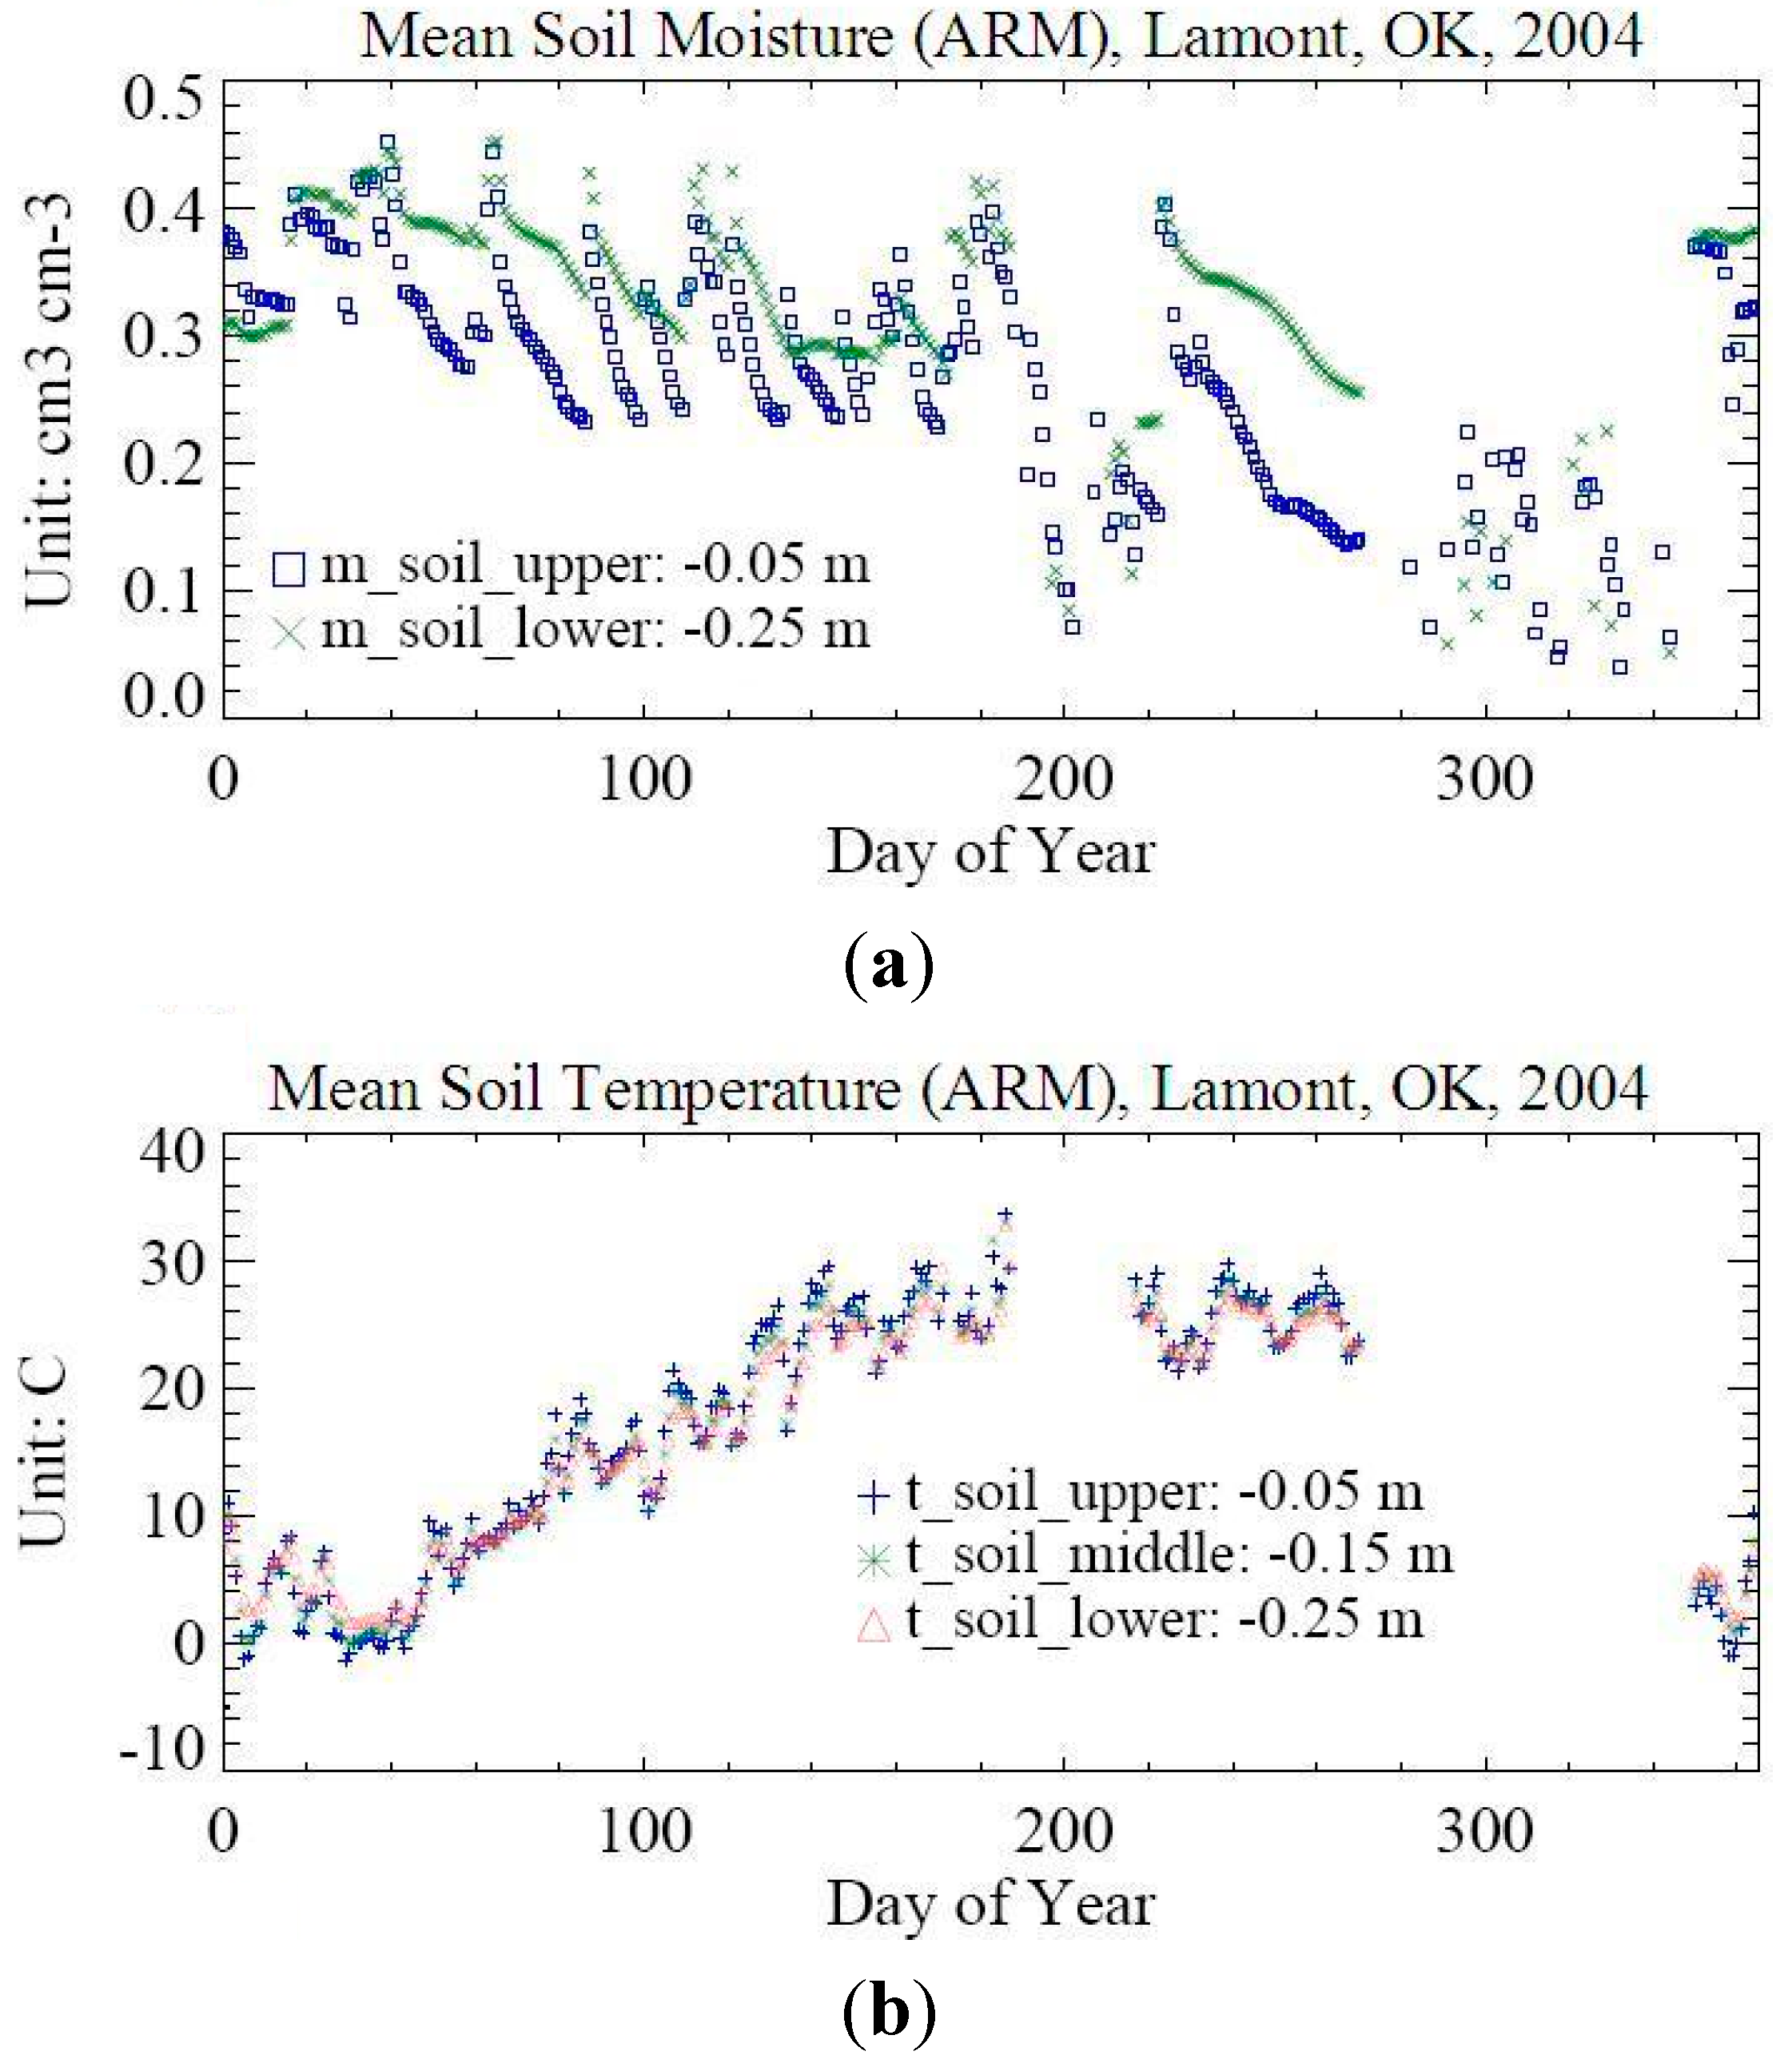
Due to evaporation at the upper soil level (−0.05 m), soil moisture is generally about 0.1~0.2 cm
3∙cm
−3 less than that at lower level (−0.25 m,
Figure 2a). Nevertheless, soil moisture at the two layers follow each other closely throughout the year with generally high values in winter and spring and low values from July (from Day 190) until the end of fall (Day 300). Nevertheless, the general seasonal trend is frequently interrupted by precipitation events. Winter snowfall and spring snowmelt increases soil moisture, while dry summer conditions lead to greater evaporation and thus reduce soil moisture. Furthermore, in the dry season, both levels have similar soil moisture which is less than 0.25 cm
3∙cm
−3.
Similar to T
skin (shown in
Figure 1), T
soil at the upper level (−0.05 m), middle level (−0.15 m) and lower level (−0.25 m) have a similar annual cycle, with the peak in summer and minimum in winter following the seasonal cycle of solar radiation (
Figure 2b). Over the Lamont site, the minimum soil temperature is about −3.0 °C in December and January, and then almost linearly increases to a July maximum of 32.3 °C. In addition, in summer the upper level soil temperature is higher than that of the lower level due to heat transport from the surface, but an opposite pattern is found in winter due to surface radiative cooling.
Figure 2.
(a) Annual variations of daily averaged soil moisture at upper layer (−0.05 m) and lower layer (−0.25 m). (b) Annual variation of daily averaged soil temperature for upper soil layer (−0.05 m), middle soil layer (−0.15 m) and lower soil layer (−0.25 m).
Figure 2.
(a) Annual variations of daily averaged soil moisture at upper layer (−0.05 m) and lower layer (−0.25 m). (b) Annual variation of daily averaged soil temperature for upper soil layer (−0.05 m), middle soil layer (−0.15 m) and lower soil layer (−0.25 m).
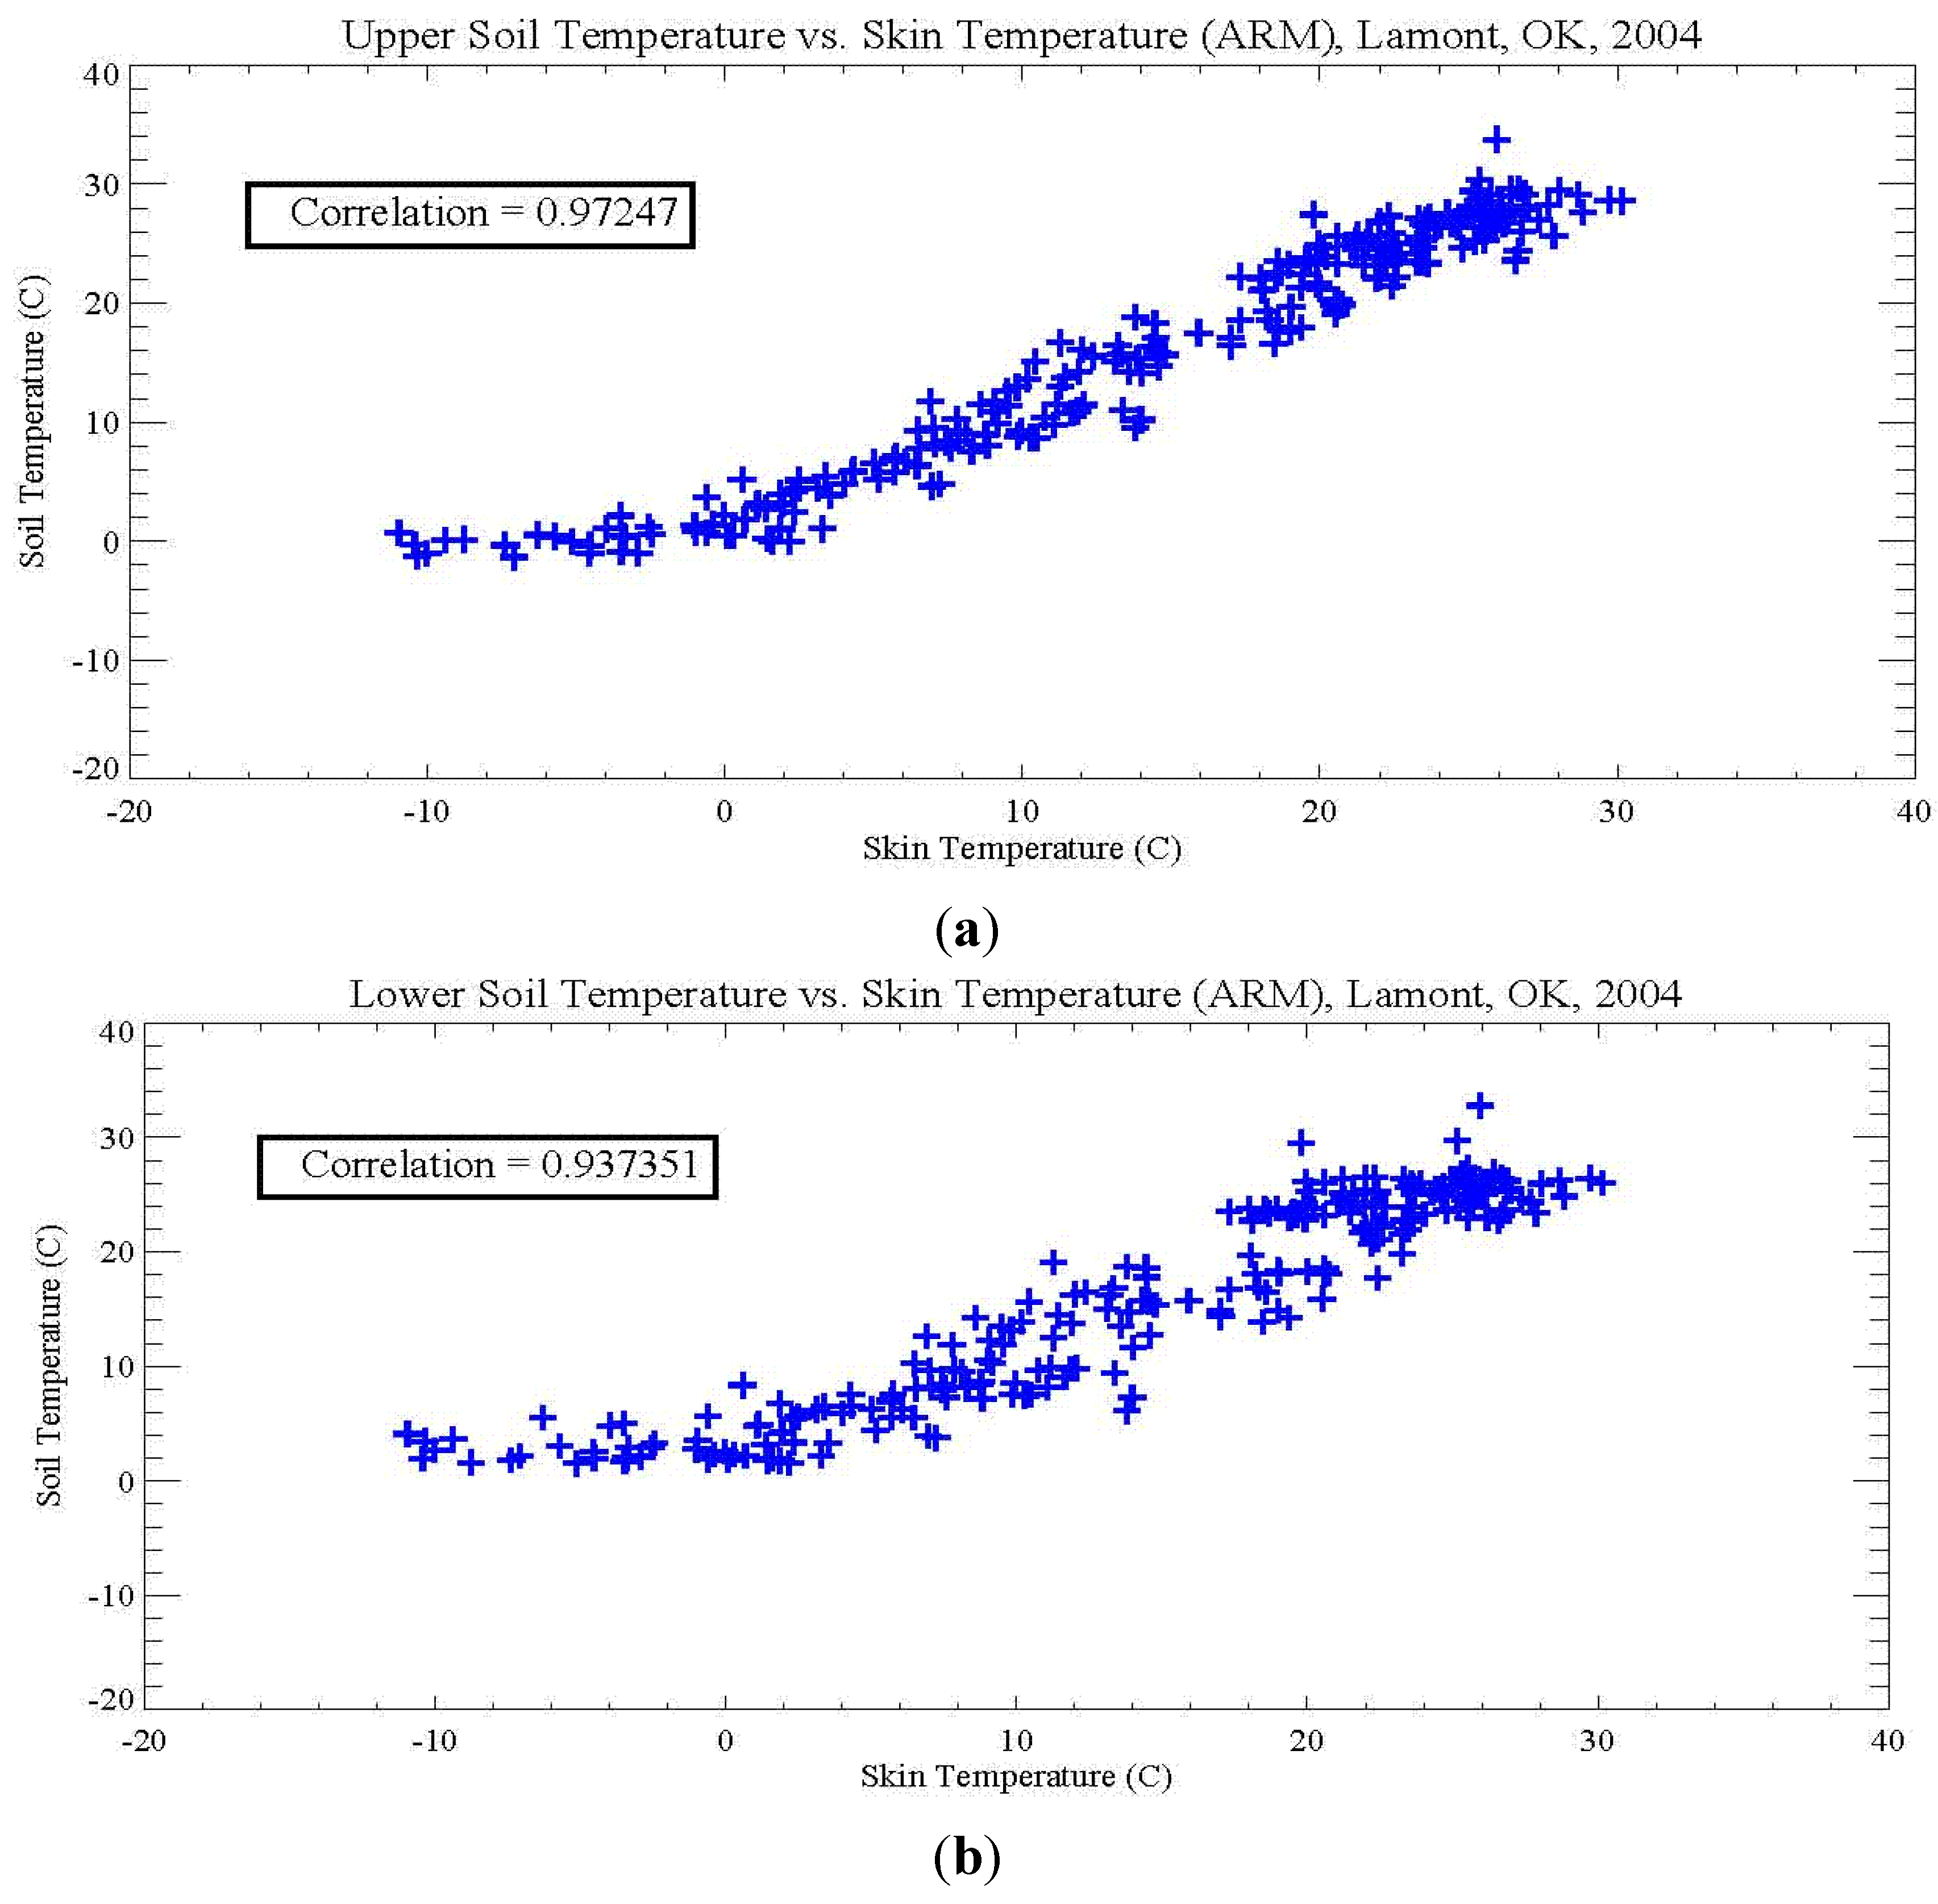
Figure 3.
Soil temperature and skin temperature relations based on annual daily averaged ARM observation at Lamont OK site. (a) upper soil temperature vs. skin temperature, and (b) lower soil temperature vs. skin temperature. Data is daily mean during 2004.
Figure 3.
Soil temperature and skin temperature relations based on annual daily averaged ARM observation at Lamont OK site. (a) upper soil temperature vs. skin temperature, and (b) lower soil temperature vs. skin temperature. Data is daily mean during 2004.
T
soil correlates highly with T
skin (
Figure 3) because of the heat propagation from ground to soil. Sampled for the year 2004, the daily averaged upper T
soil and T
skin has a high correlation coefficient up to 0.97 (
Figure 3a), with a value of 0.94 (
Figure 3b) for lower T
soil and T
skin. This suggests that the upper level T
soil is more closely related to T
skin because the absorbed surface insolation is partly used to warm the ground and partly transported in terms of ground heat flux to warm soil. More importantly, the close-to-linear relationship between T
skin and T
soil as well as for T
air and T
soil may be useful for predicting these two temperatures. Correlation coefficient of 0.97 for daily mean T
skin vs. T
soil only means that these two parameters are highly related, but it is not linear. Furthermore, the almost flat T
soil when T
skin is below 0, which means that when the surface is frozen, the soil temperature at particular layer varies little.
In contrast, soil moisture does not correlate well with Tskin (not shown). Specifically, a negative correlation coefficient (−0.42, p-value = 0.05) is detected between the upper level soil moisture and Tskin. This low negative correlation coefficient is because SH and LE are competing physical processes to re-distribute the surface absorbed radiative energy. Nevertheless, the low coefficients reveal the loose relationship between these two parameters.
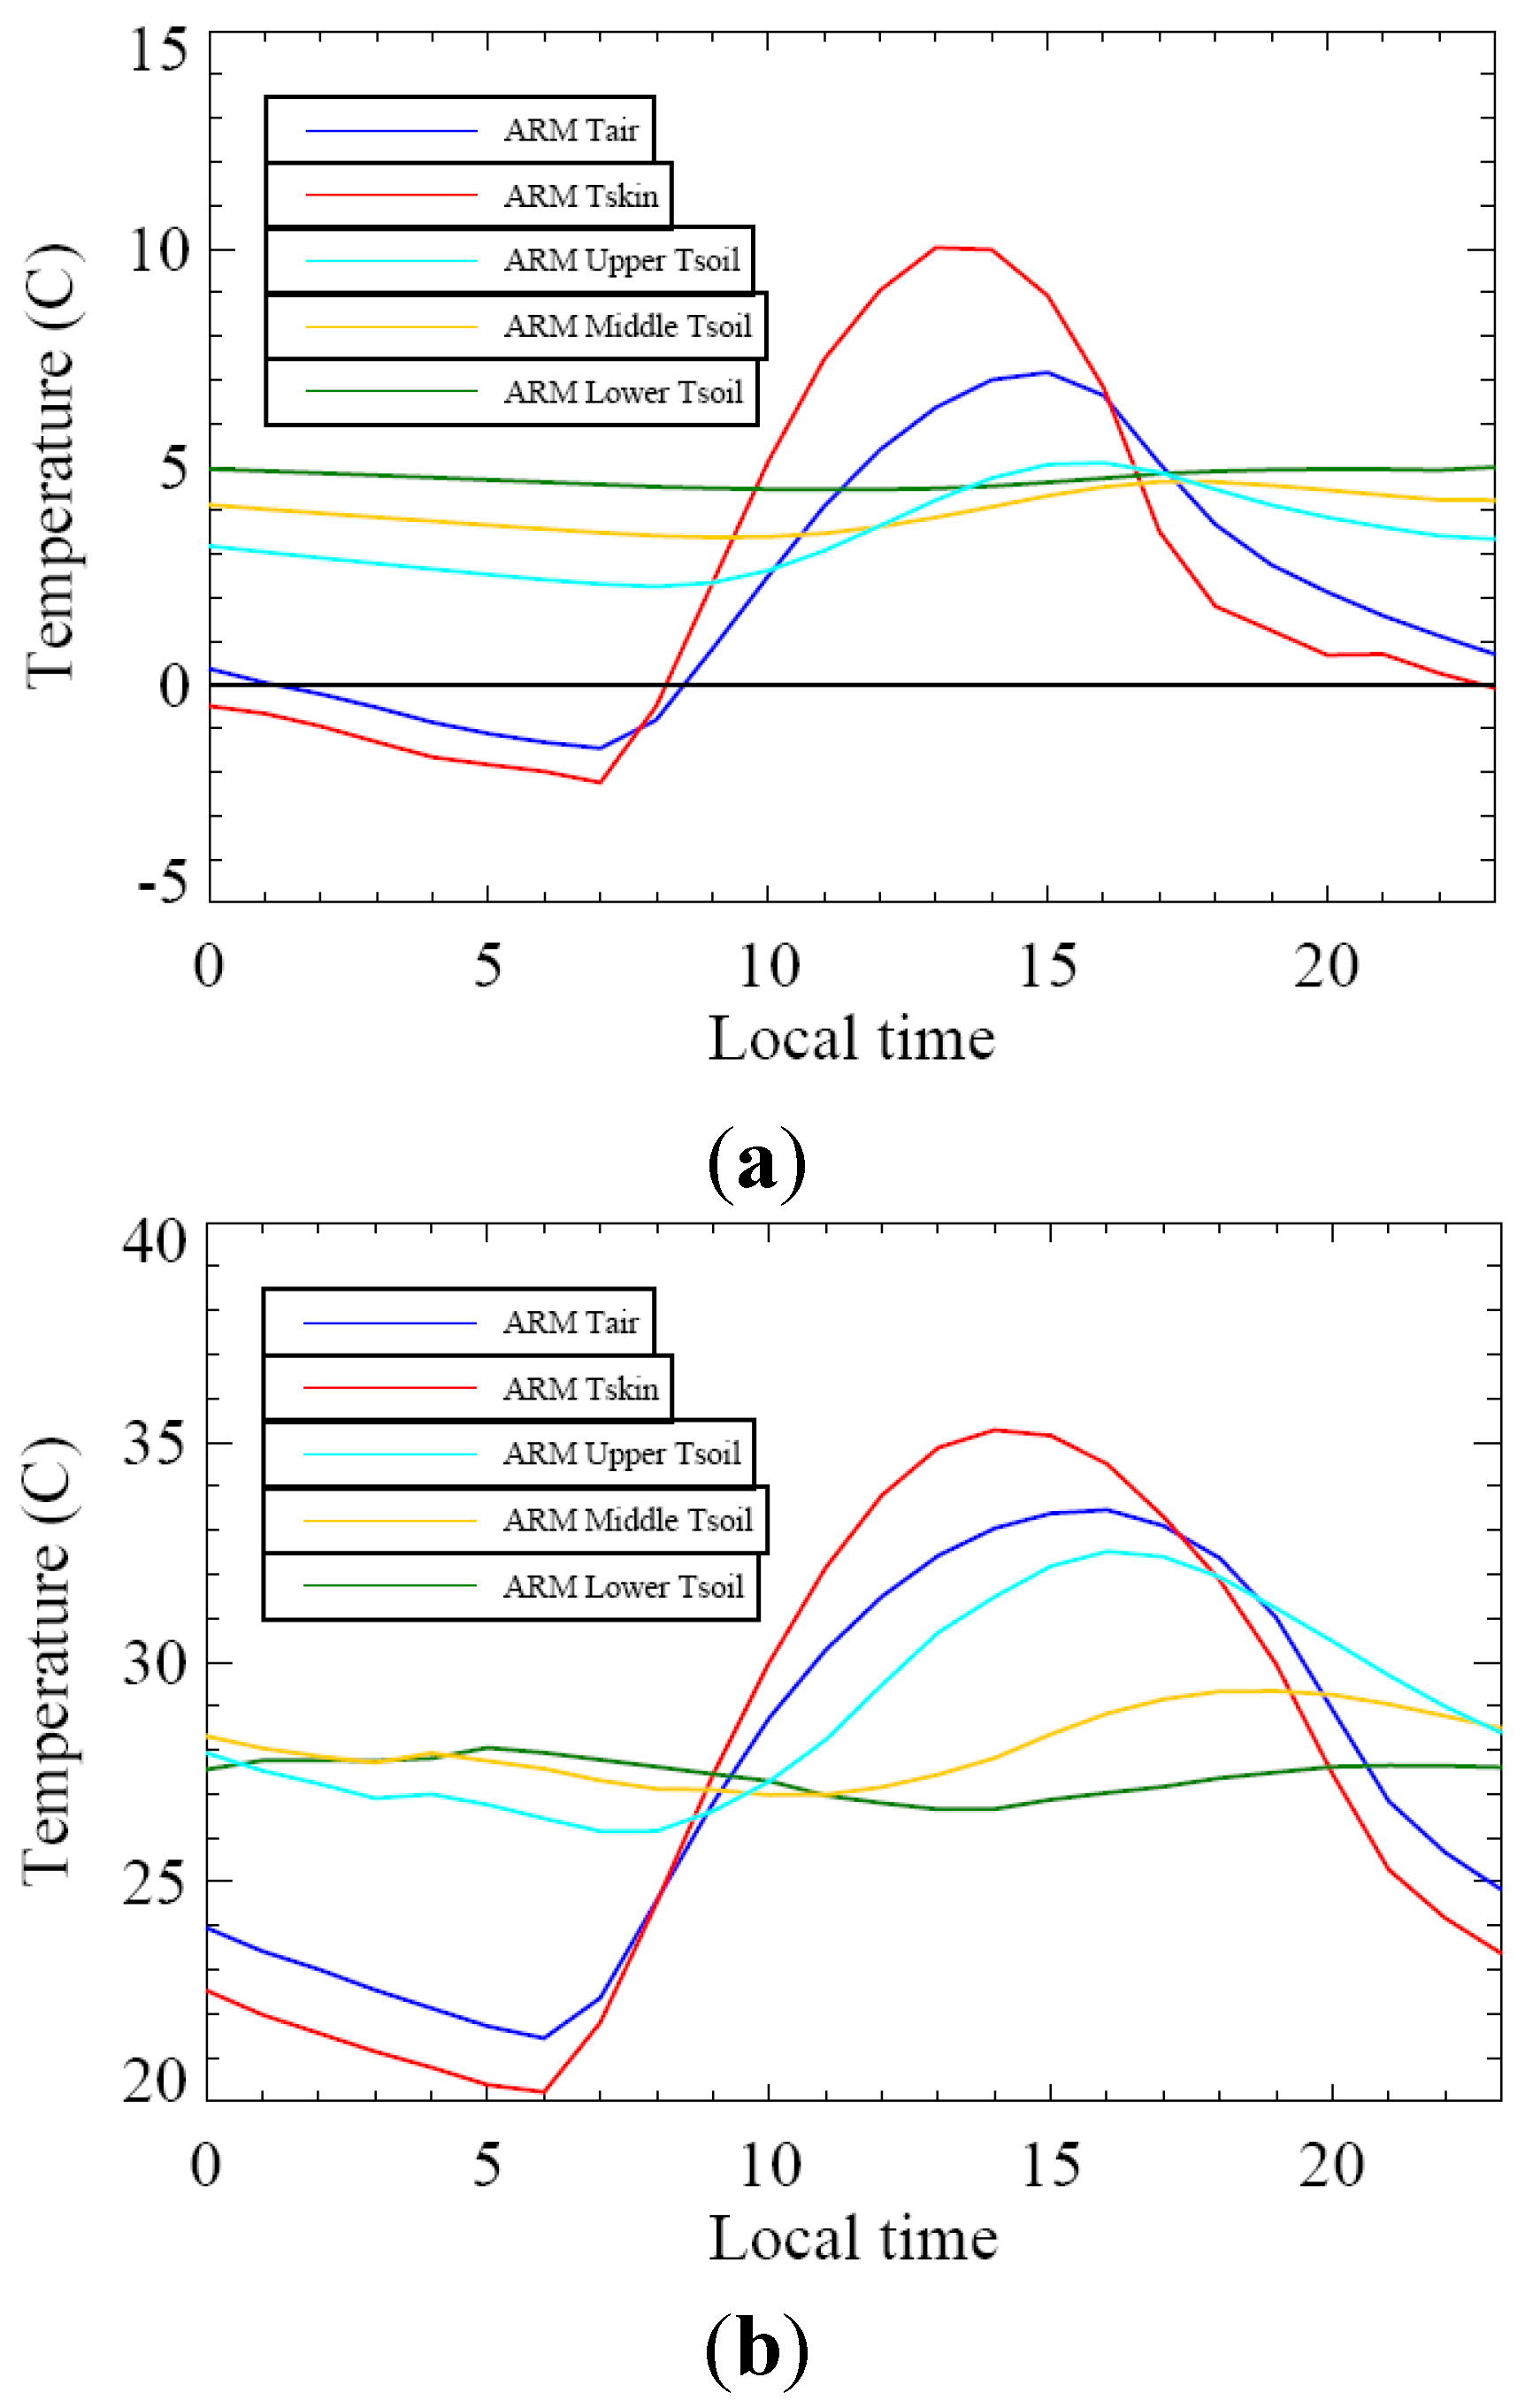
The phase lag in the diurnal variations of temperature (
Figure 4) at different layers—2-m T
air, T
skin, and T
soil at upper, middle, and lower levels, respectively, show evident energy propagation among air-land-soil. In January (
Figure 4a), T
skin has the largest diurnal variation because the skin level (e.g., ground at this location) absorbs surface insolation most rapidly. T
air has a smaller diurnal range than T
skin but a larger diurnal range than the upper, middle, and lower layers T
soil. The upper layer T
soil has larger variations than the middle and lower layers T
soil. In fact, not much diurnal variation occurs at the low soil layer (−0.25 m), implying that heat can be barely transported to this depth. In addition, the phase lag of diurnal variation is evident: T
skin reaches its maximum (10.03 °C) at 13:00, then T
air reaches its maximum (7.17 °C) 2 h later (15:00) after the land surface heats up, while soil layers reach maximum at 16:00 for the upper layer (5.10 °C), 17:00 for the middle layer (4.66 °C), and 23:00 for the upper layer (4.99 °C). Furthermore, the minima of these temperatures are −1.46 °C (07:00) for T
air, −2.24 °C (07:00) for T
skin, 2.25 °C (08:00) for the upper layer soil, 3.63 °C (12:00) for the middle layer soil, and 4.48 °C (11:00) for the lower layer soil. Note that in winter, soil layers are warmer than both air and ground with deeper soils being warmer than upper soils. Radiative cooling near the ground is very clear at night, leading to lower T
skin than T
air and T
soil.
Figure 4.
Multi-year (2003–2008) averaged diurnal variations of 2-m air temperature (Tair), skin temperature (Tskin), and soil temperature at upper level (−0.05 m from ground), Middle level (−0.15 m) and Lower level (−0.25 m) for (a) January and (b) July.
Figure 4.
Multi-year (2003–2008) averaged diurnal variations of 2-m air temperature (Tair), skin temperature (Tskin), and soil temperature at upper level (−0.05 m from ground), Middle level (−0.15 m) and Lower level (−0.25 m) for (a) January and (b) July.
In July (
Figure 4b), the diurnal maxima are 33.46 °C (16:00) for T
air, 35.28 °C (14:00) for T
skin, and 32.52 °C (16:00), 29.34 °C (19:99), and 28.05 °C (05:00) for upper, middle, and lower T
soil, respectively. The minimum for the upper layer T
soil is 26.15 °C (07:00), while it is 26.98 °C (10:00) and 26.65 °C (13:00) for the middle and lower layers, respectively. In addition, T
skin has a larger diurnal variation (15.07 °C) than T
air (12.02 °C). More importantly, the upper T
soil has much more significant diurnal range (6.37 °C) than in January, and other soil layers show little variation (2.36 °C, 1.0 °C). In fact, the lower T
soil shows an inverse pattern, namely, a maximum in the morning and minimum in the afternoon. Furthermore, T
skin and T
air both reach minimum at the same time (6 AM), with values of 20.21 °C for T
skin and 21.44 °C for T
air. In July (
Figure 4b), T
soil at the lower level (−0.25 cm) still has diurnal variation due to the arrival of heat propagated from surface. Nevertheless, it takes about 10 h for heat to reach this level, and thus T
soil of this layer has a clear opposite phase than T
skin diurnal cycle. In January (
Figure 4a), however, little heat can be transported into this level due to frozen ground, and thus no clear diurnal cycle at this soil layer.
Based on the 6-year (2003–2008) annual diurnal cycle, T
air is more closely related to the upper layer Ts
oil than T
skin (
Table 1). For example, in January, the correlation coefficient between T
air and upper T
soil is 0.87 and only 0.64 for T
skin vs. upper T
soil. Similarly, T
air vs. the middle layer T
soil has a higher correlation coefficient (0.41) than that between T
skin vs. the middle layer T
soil (0.07). On the contrary, the lower layer T
soil has a higher but negative correlation with T
skin. Specifically, the coefficient between T
skin and the lower layer T
soil in January is −0.53 but −0.26 between T
air and the lower layer T
soil for the same month. More importantly, seasonality is very clear: In July, both T
air and T
skin have a much higher correlation with the lower layer T
soil than in January. While in July, T
skin vs. lower T
soil is −0.93 and for January it is only −0.54. This is probably because lower T
soil has little diurnal variation, but the minimum value is in the afternoon, and maximum in the morning (opposite of normal diurnal cycle, as noticed in
Figure 4b).
Table 1.
Correlation Coefficients based on 2003–2008 monthly mean observations. The correlation coefficients are based on hourly-averaged temperatures for each day of the month between 2003–2008 (n = 4644).
Table 1.
Correlation Coefficients based on 2003–2008 monthly mean observations. The correlation coefficients are based on hourly-averaged temperatures for each day of the month between 2003–2008 (n = 4644).
| | Tair January | Tskin January | Tair July | Tskin July |
|---|
| Upper Tsoil | 0.8707 | 0.6431 | 0.8842 | 0.8023 |
| Middle Tsoil | 0.4165 | 0.0753 | 0.2978 | 0.1231 |
| Lower Tsoil | −0.2614 | −0.5396 | −0.8795 | −0.9382 |
| Tskin | 0.9327 | - | 0.9831 | - |
Note that T
skin and upper T
soil have a 0.97 correlation (
Figure 3a) while it is only 0.80 for July and 0.63 for January in
Table 1. This is probably because
Table 1 is based on the multi-year averaged diurnal cycle for 2003–2008, namely, an average over all days to get a diurnal cycle for the month, and then averaged over all years. Furthermore,
Table 1 represents the inter-annual variations of the variable.
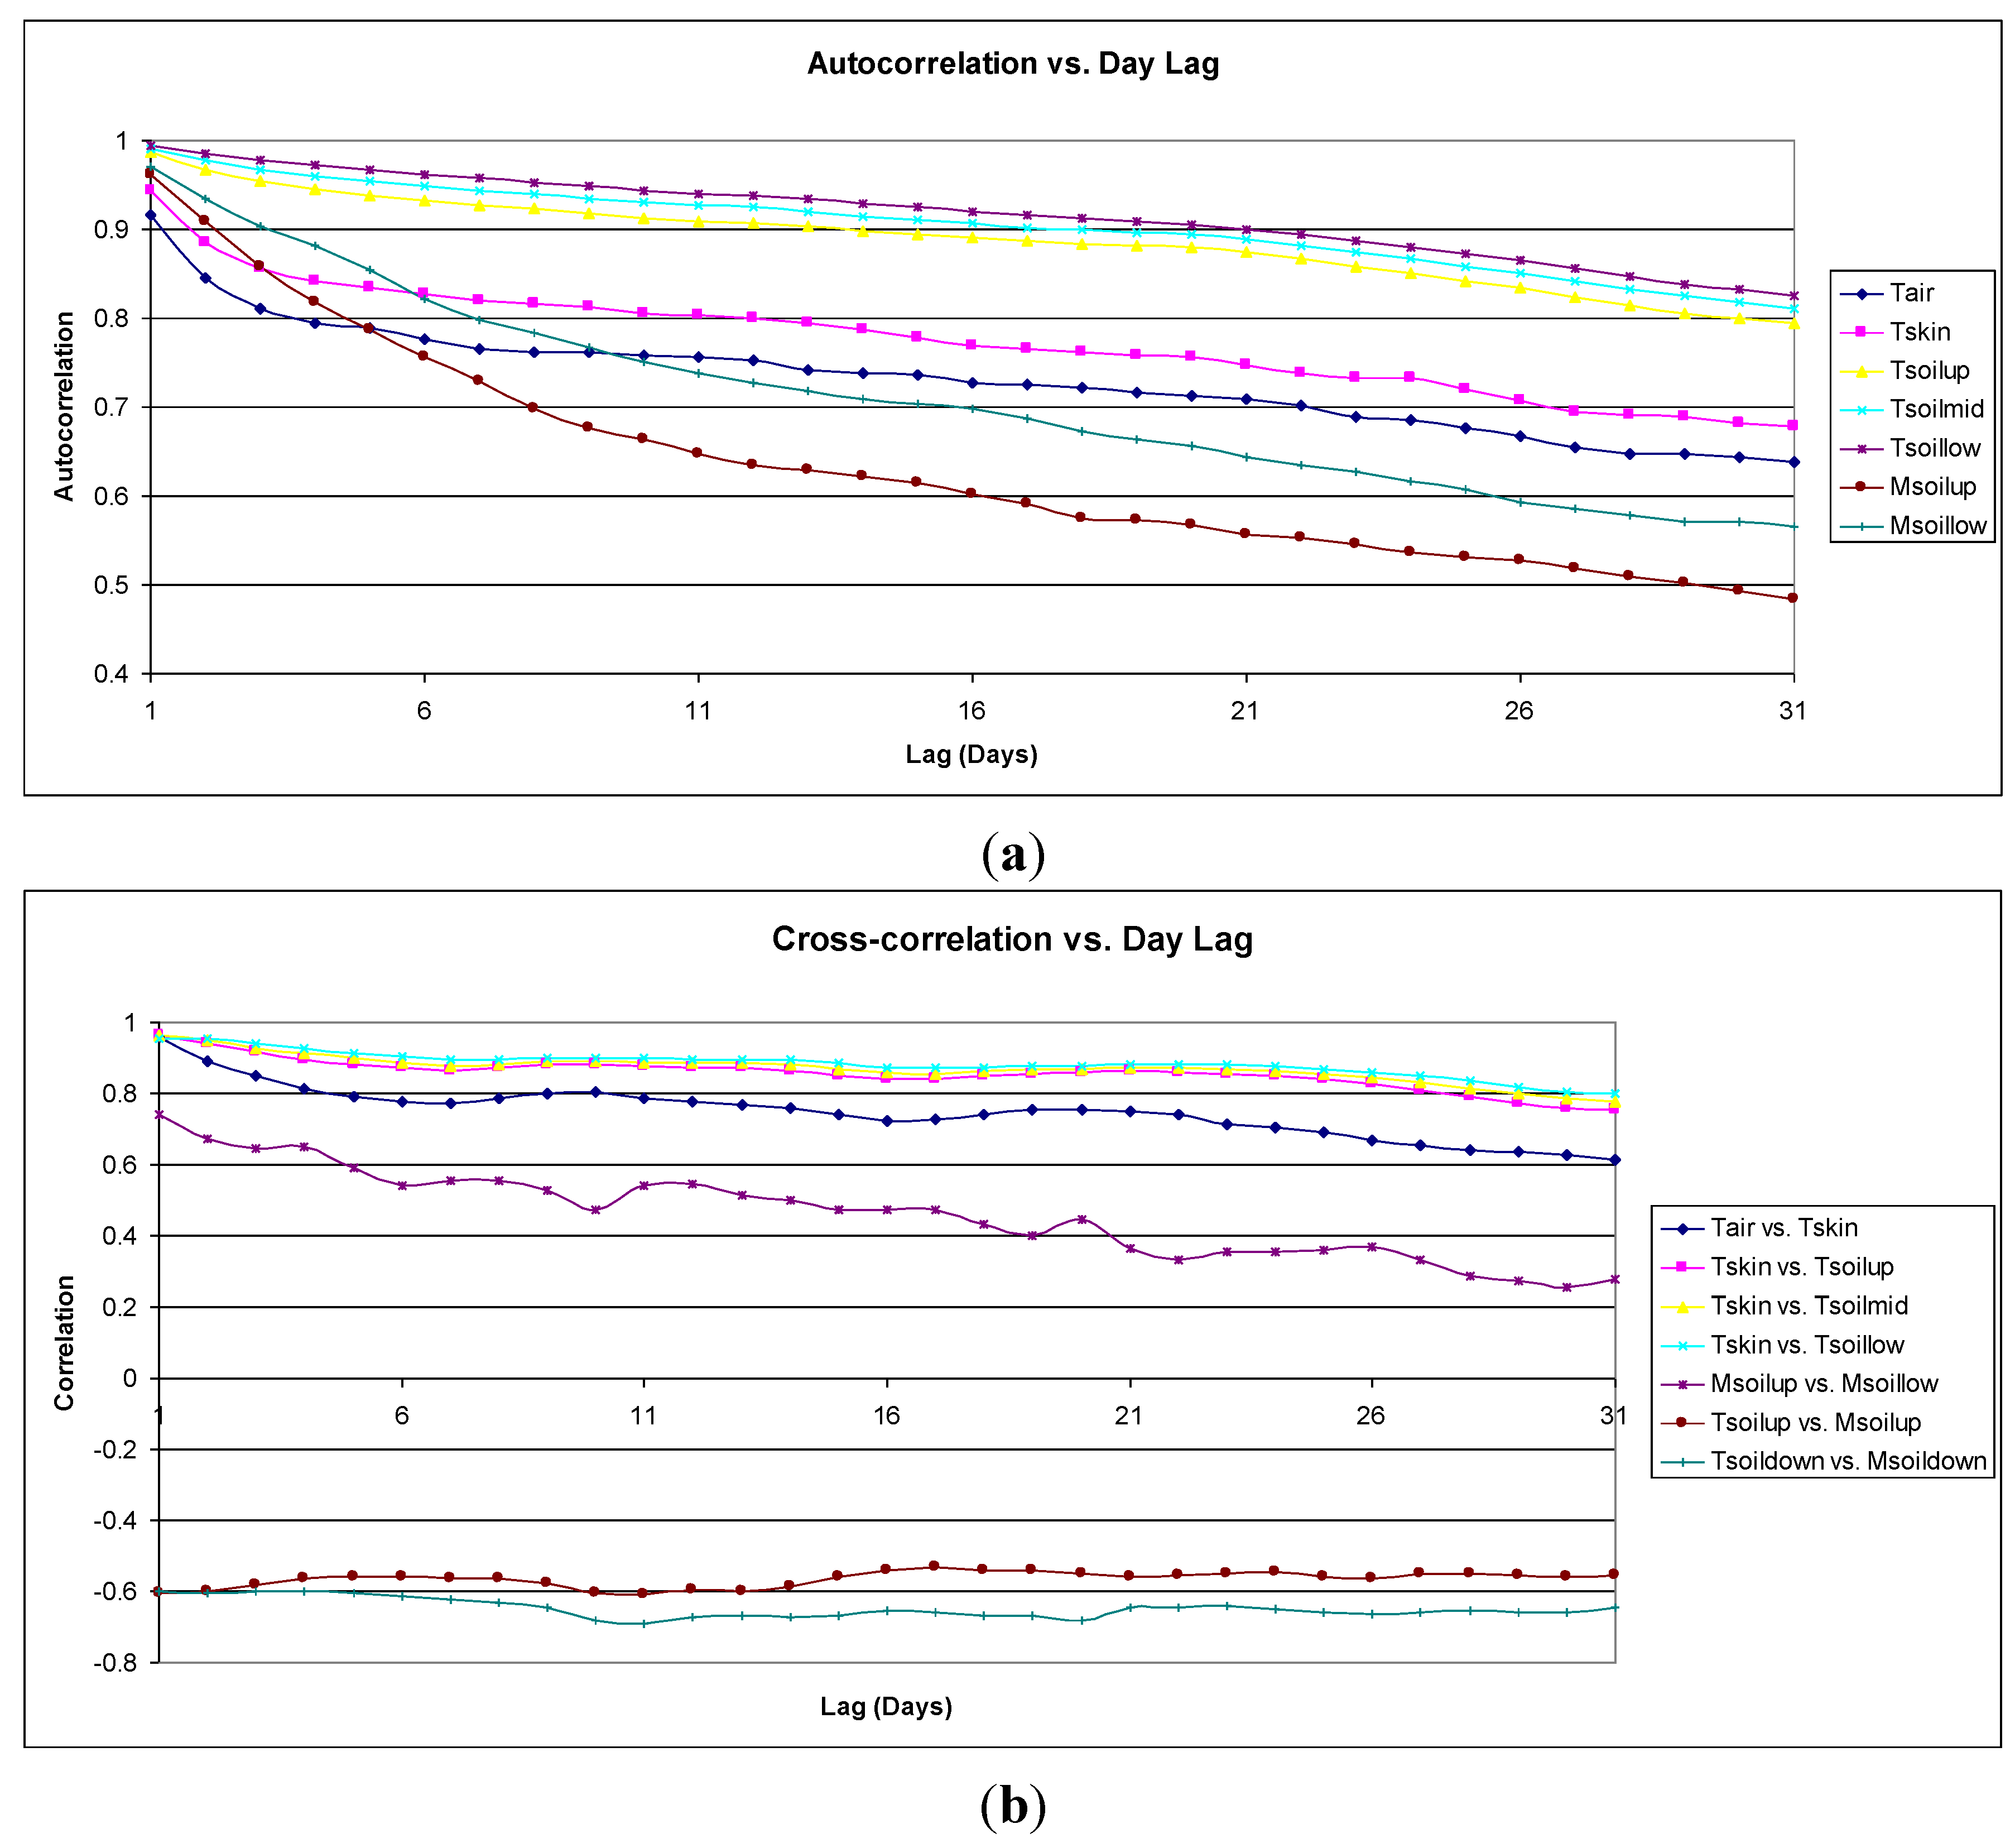
Autocorrelation presents self-persistency of a variable. Soil temperatures have the highest autocorrelations with day lag (
Figure 5a). The deeper the soil, the greater the self-persistency is as reflected in the autocorrelation coefficients. In addition, the lag autocorrelation for soil moisture decreases faster than other variables, implying the least self-persistency among these parameters. Furthermore, the upper layer soil moisture has less self consistency than the lower soil moisture after one day.
Cross-correlation with day lag (
Figure 5b) shows that T
skin and the upper layer T
soil have the highest cross-correlation (~0.90), and that cross-correlation increases with depth, namely, higher correlation of T
skin with the middle and lower layers T
soil than T
skin with the upper layer T
soil. In addition, T
skin and T
air have relatively low cross-correlations, from 0.96 at a day lag of 1 dropping to 0.8 at a day lag of 5. Furthermore, the upper layer soil moisture and the lower layer soil moisture have the lowest positive cross-correlation, and this value rapidly decreases as day lag increases. Again, T
soil and soil moisture have a negative cross-correlation, of around −0.6 at a day of lag 1 and remaining mostly unchanged as day lag increases.
Figure 5.
(a) Autocorrelation with day lag using daily averaged data from 2003–2008 data. Tair is 2-m air temperature. Tskin is skin temperature. Tsoilup is upper soil temperature. Tsoilmid is middle layer soil temperature. Tsoillow is lower layer soil temperature. Msoilup and Msoillow are upper and low soil moisture, respectively. (b) Cross-correlation with day lag.
3.2. CLM4 Simulations
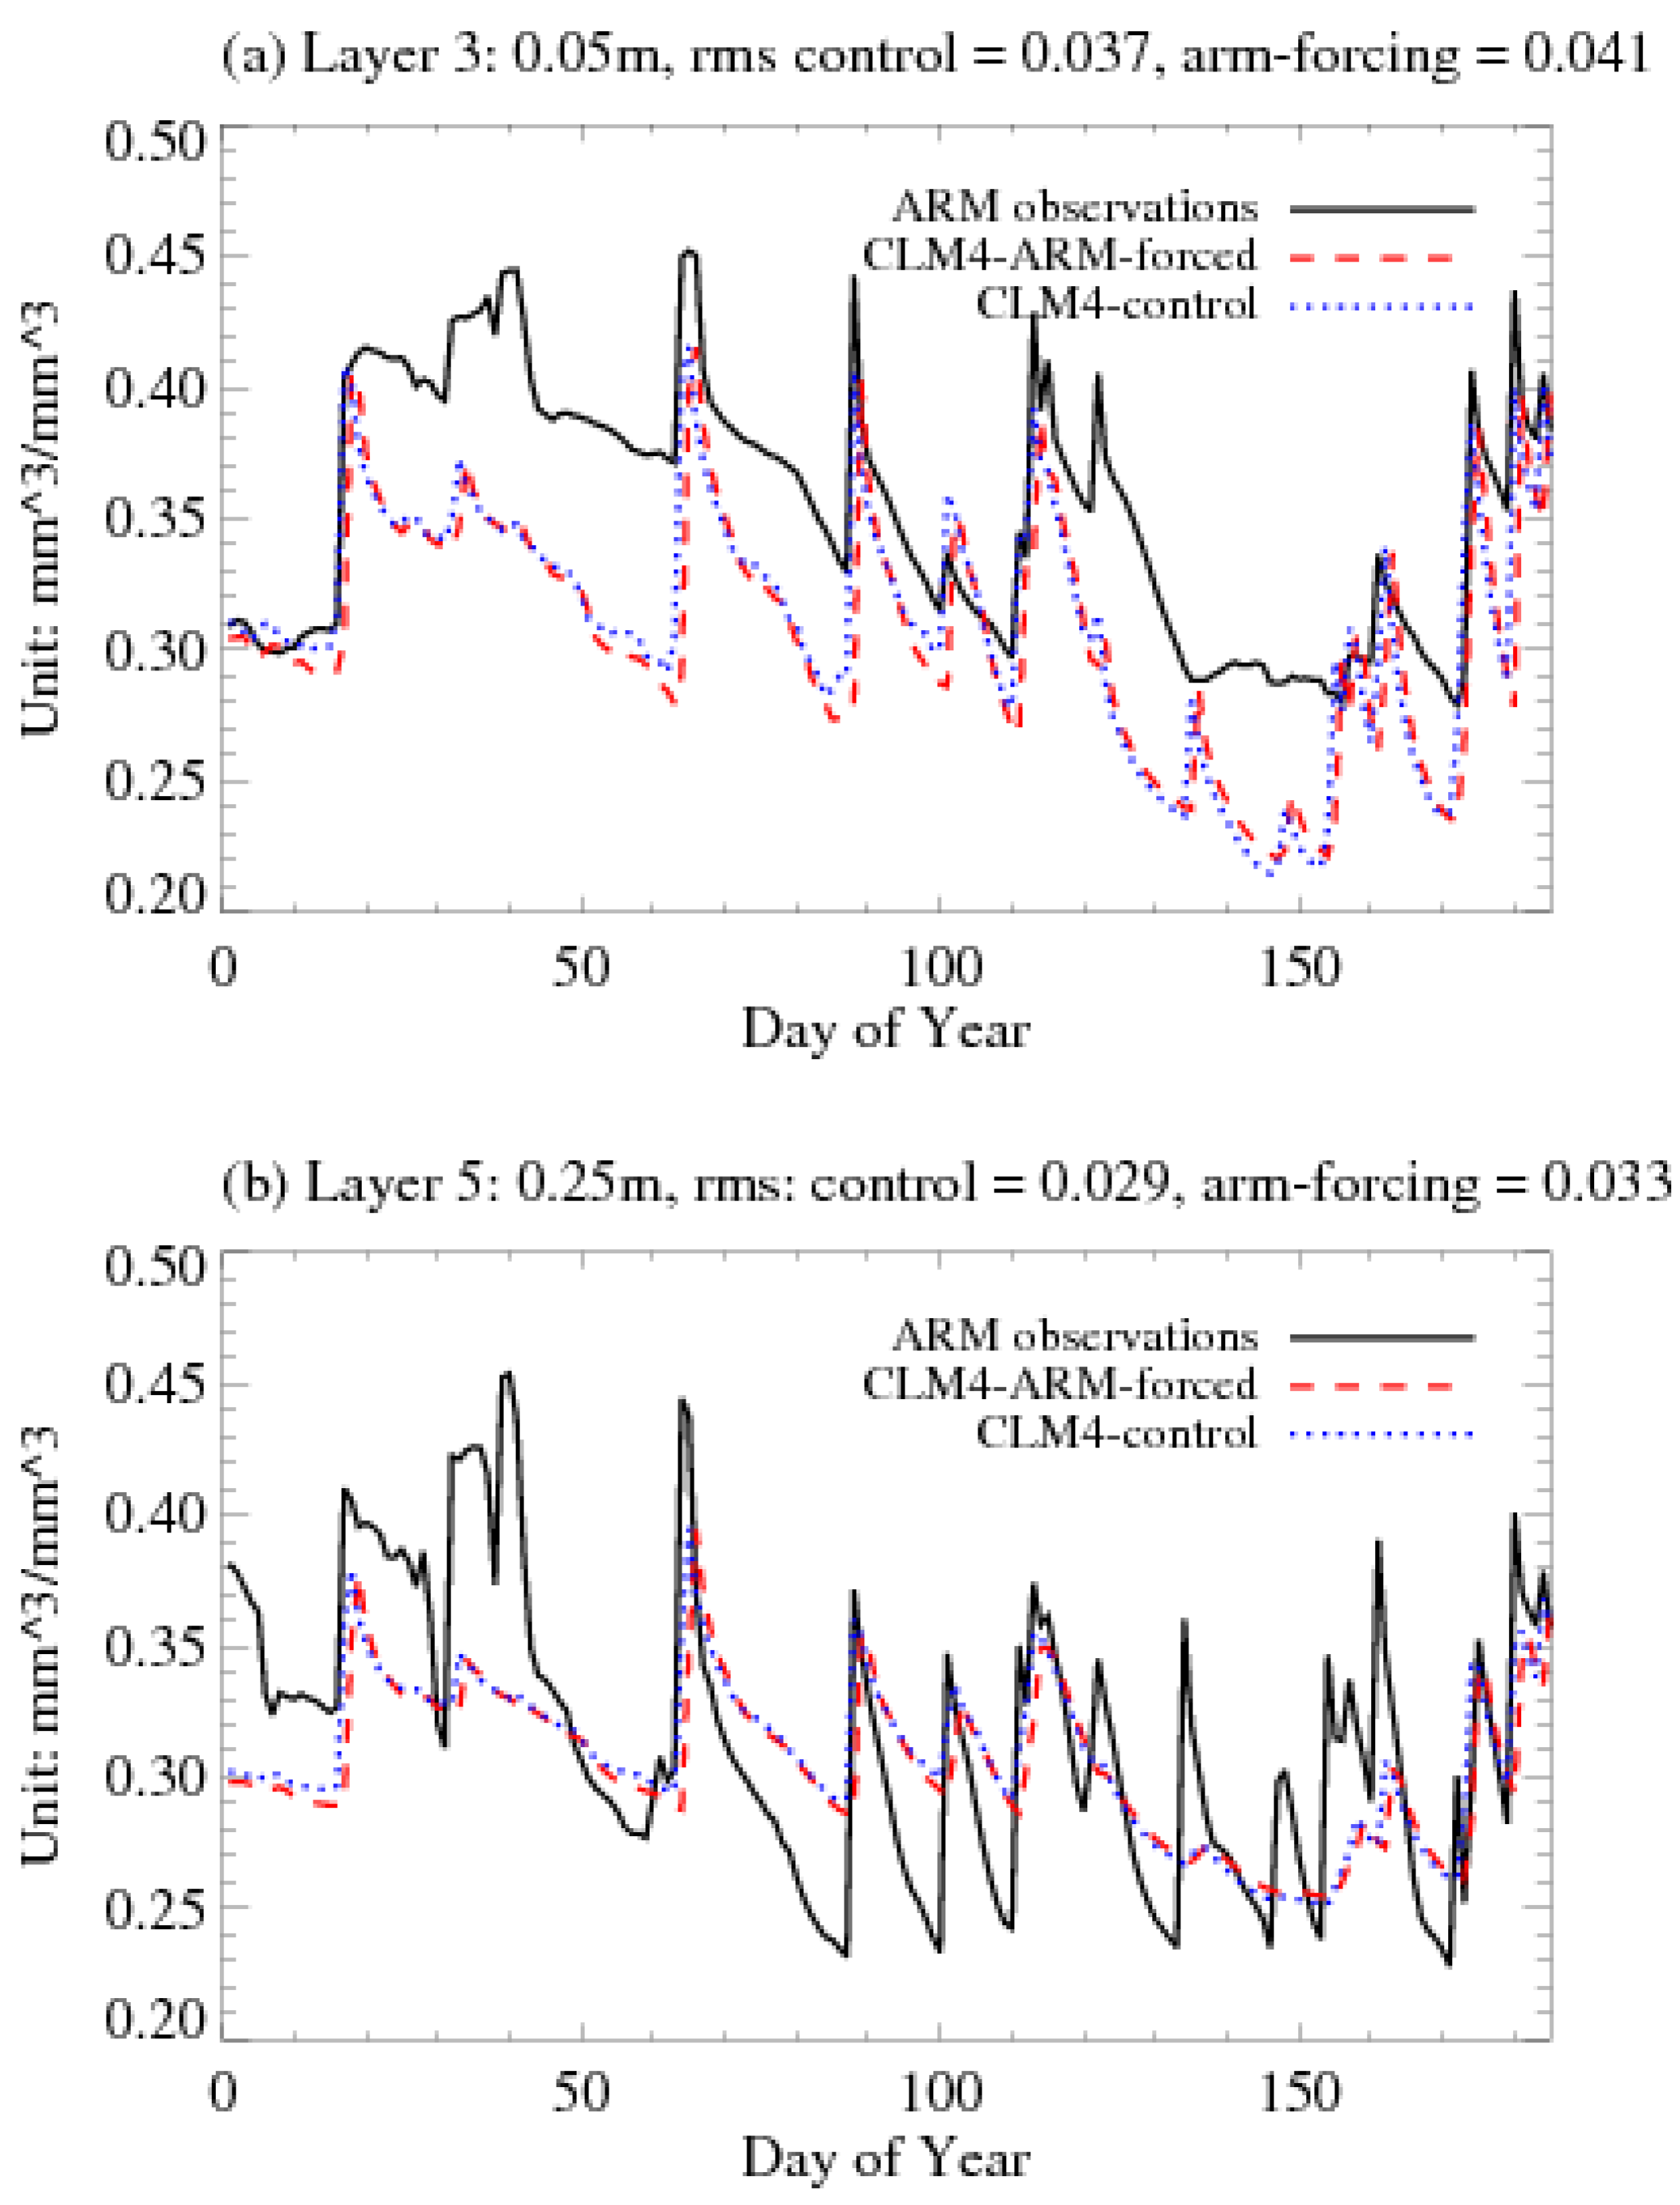
Soil moisture simulations in CLM4 do not get the absolute values correct, but well simulate the peaks, partly because the model responds to rainfall in the atmospheric forcing data (
Figure 6). Specifically, in the model layer 3 (comparable to ARM upper layer −0.05 m,
Figure 6a), soil moisture values are systematically lower than the observations, revealing that the model is too dry at this layer. Once rainfall events occur, however, the soil moisture in the model is close to observations as a result of the model’s response to rainfall forcing. From then, the model soil moisture drops quickly from rainfall-induced peaks and the modeled values are apart from the observations by about 0.10 mm
3∙mm
−3 (e.g., 0.40 mm
3∙mm
−3 in day 50 but 0.30 mm
3∙mm
−3 in CLM4). This suggests that the model loses soil moisture too quickly at this layer. Further analysis implies that one possible reason for this is the large latent heat flux in the model at the ground which reduces soil moisture too quickly from lower soil layers. The averaged root-mean-square error (rms) is 0.04 mm
3∙mm
−3 and the ARM-forced run has relatively larger rms than the control run does, which is unexpected because the ARM-forced run has soil moisture spin up, accurate solar radiation, and rainfall from observations in the forcing. At the lower layer (−0.25 m, comparable to model layer 5,
Figure 6b), CLM4 simulated soil moisture is lower than the observations in spring (Julian days 1–120); therefore, the model is still dryer than the observations during this period of time. However, during summer (Julian days 121–180), model simulated soil moisture in general is higher than the observations. Namely, model lower layer is wetter than the observations in summer. In addition, one problem identified is that the model soil moisture is lower than the observation from the very first day (day 0). Since the CLM4 ARM-forced run has soil moisture spin up, the modeled soil moisture should be close to the ARM observation at least at the beginning as day 0–5 in layer 3 (
Figure 6a). Further analysis reveals that while CLM4 has default saturation soil moisture and even spin-up soil moisture is close to the observation, the model replaces the spin up soil moisture using the default saturation value. The problem may also explain why, soon after a rainfall event, CLM4 soil moisture increases to close to observation value, but keeps dropping to 0.30 mm
3∙mm
−3. Note that
Figure 6 only shows spring and summer because in fall and winter, soil moisture is frozen and causes problems in the ARM observations. Furthermore, the very similar results in the control run and the ARM-forced run suggest that the model has a problem in its soil moisture. Nevertheless, when the forcing has rainfall, it brings the modeled soil moisture value close to the observations. This means that the forcing is important. The better the forcing, the better the model results.
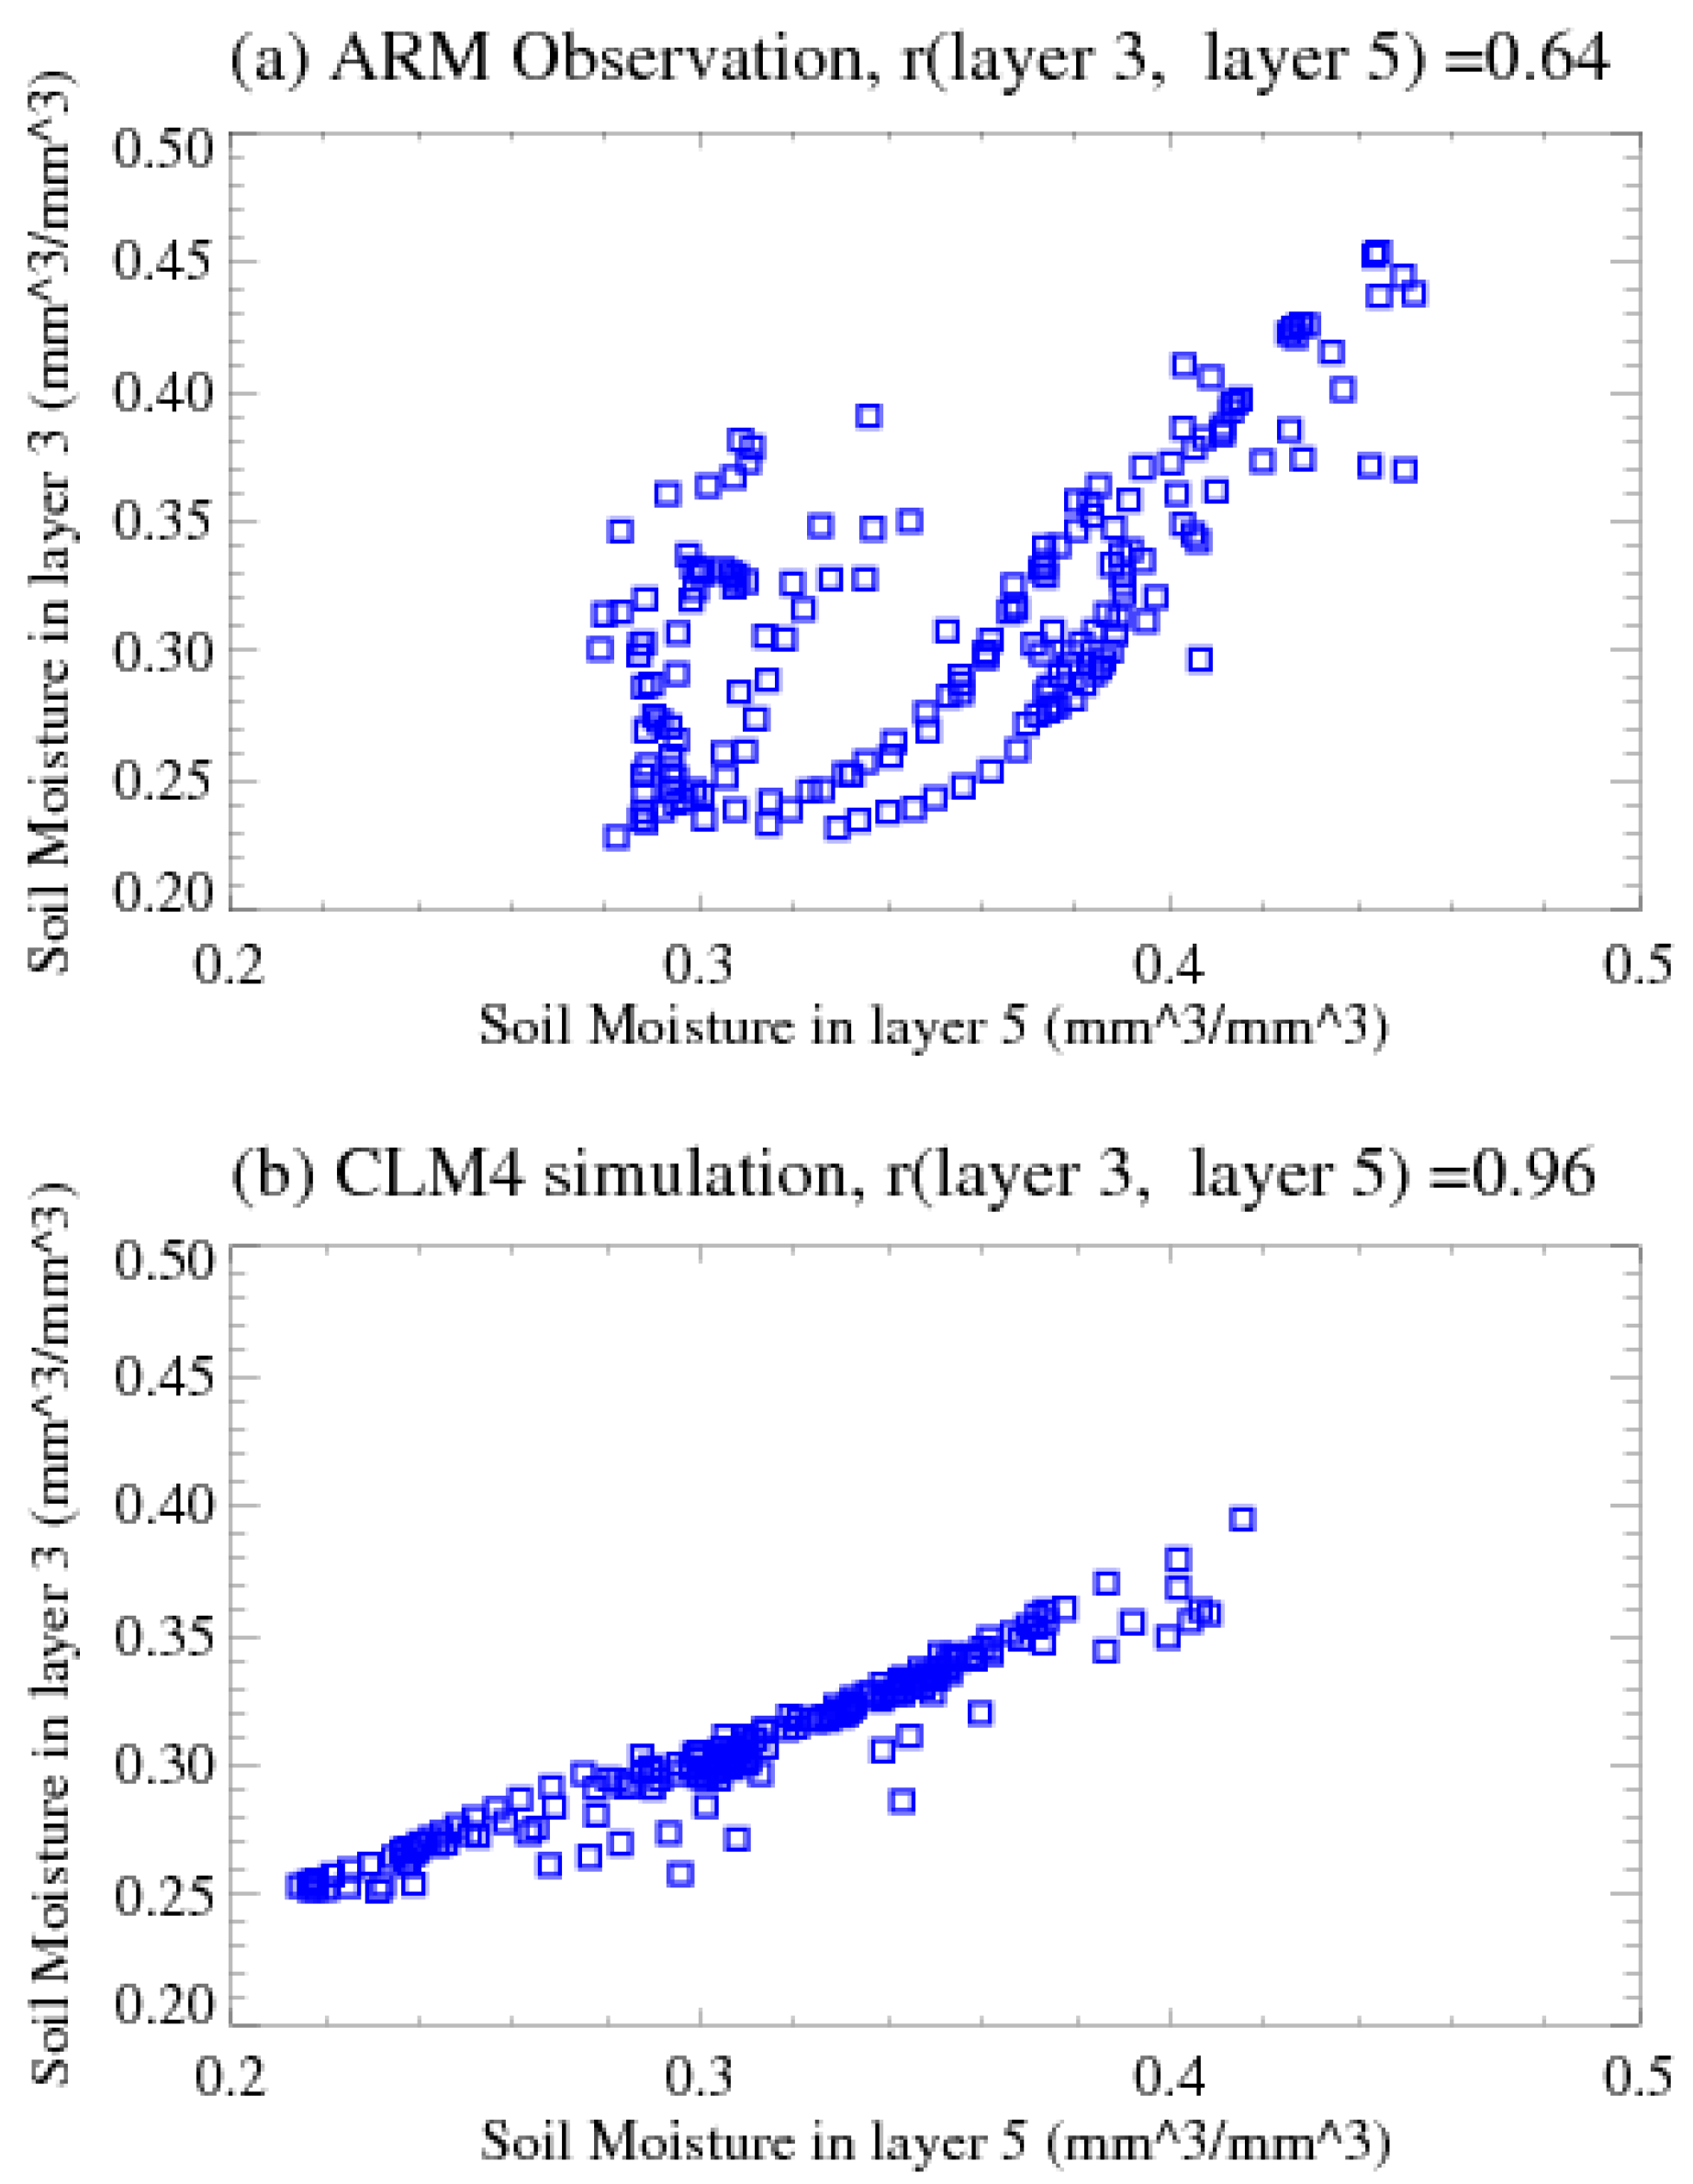
Examining the correlation of soil moisture between the upper layer and lower layers reveals the dependency and vertical structure of soil moisture. In ARM, the correlation coefficient of soil moisture at these two layers is only 0.64 (
Figure 7a) while in CLM4, this correlation coefficient is 0.96 (
Figure 7b). Therefore, ARM data are very scattered (
Figure 7a) but CLM values are very close to each other (
Figure 7b). In addition, the range of soil moisture for layer 5 is 0.30–0.48 mm
3∙mm
−3 in ARM data while it is only 0.20–0.42 mm
3∙mm
−3 in CLM4. In conclusion, two weaknesses are identified here for CLM4: First, in the model, in terms of soil moisture, model layers are too tightly coupled; and second, at the lower layer, soil moisture is too low and the range is too small (0.25–0.40 mm
3∙mm
−3 in CLM4 while ARM data is 0.18 mm
3·mm
−3).
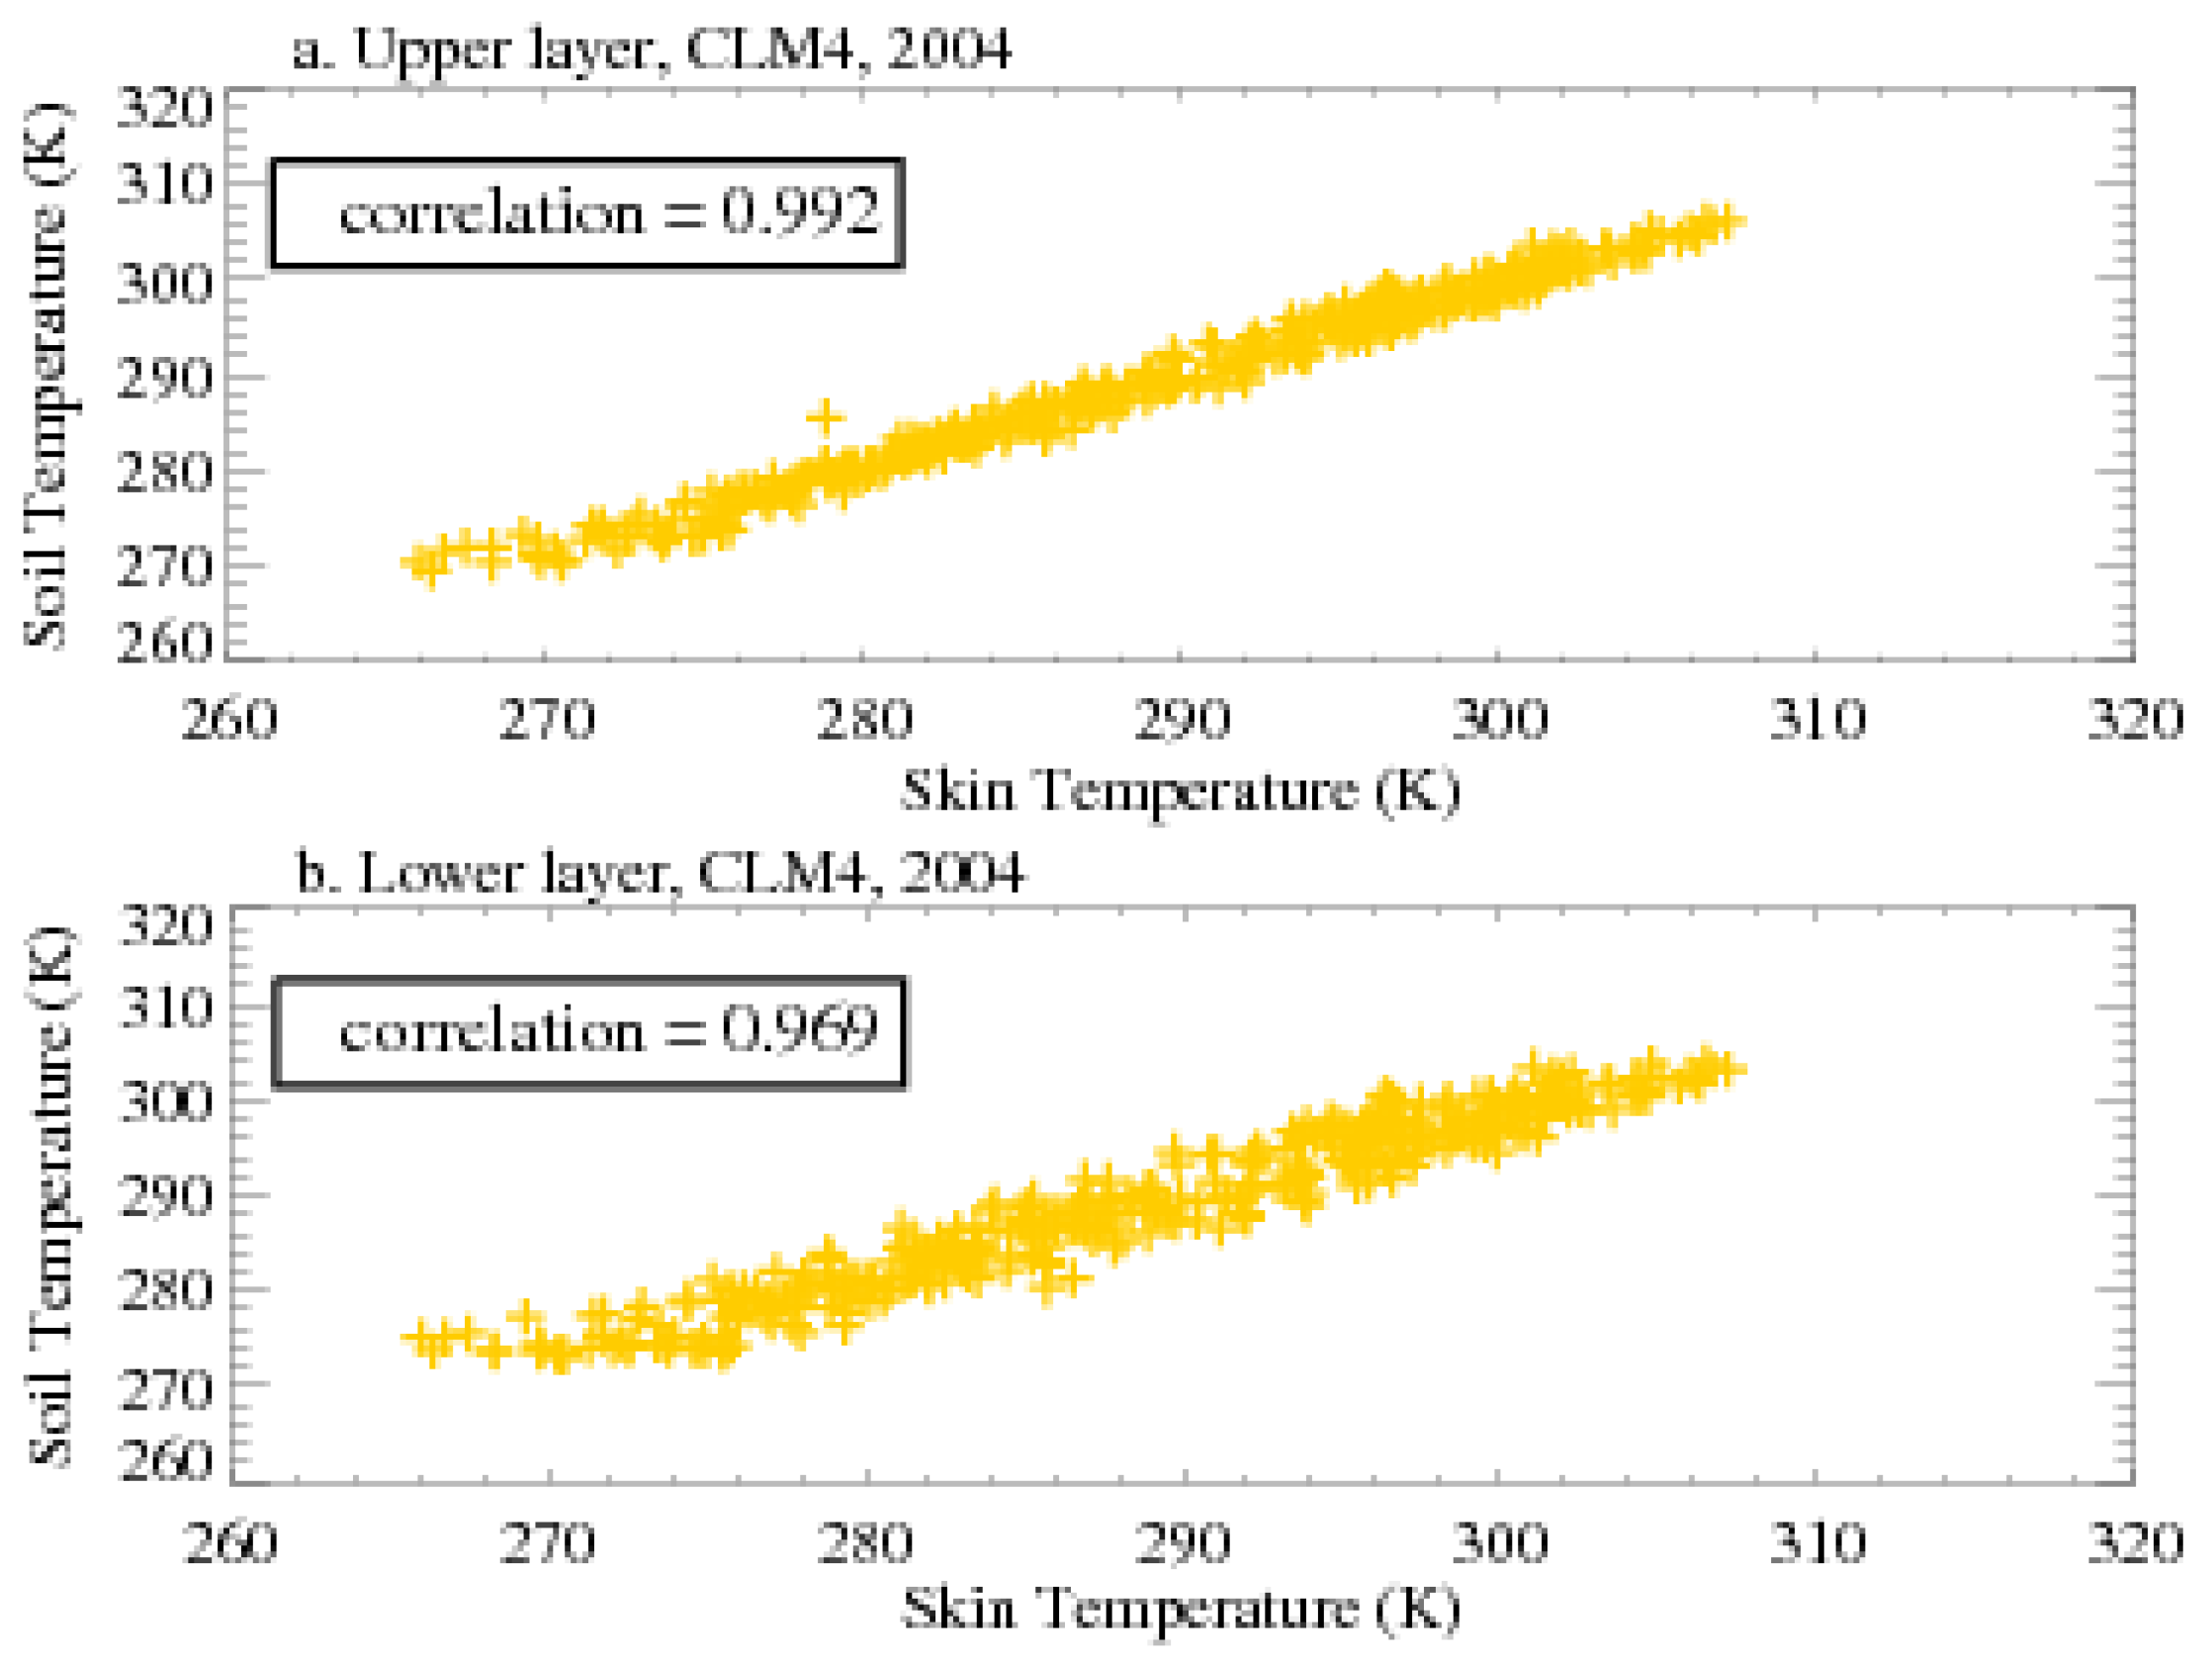
Similar to
Figure 3, CLM4 shows the high correlation between soil temperature and T
skin (
Figure 8). The correlation coefficients on daily averaged soil temperature and T
skin are 0.99 for upper layer and 0.97 for lower layer. Comparing this with the ARM observations where correlation coefficients are 0.97 for the upper layer and 0.94 for the lower layer (
Figure 3), CLM4 has slightly higher dependence between soil temperature and T
skin than the ARM observations. The overall relation is well simulated by the model.
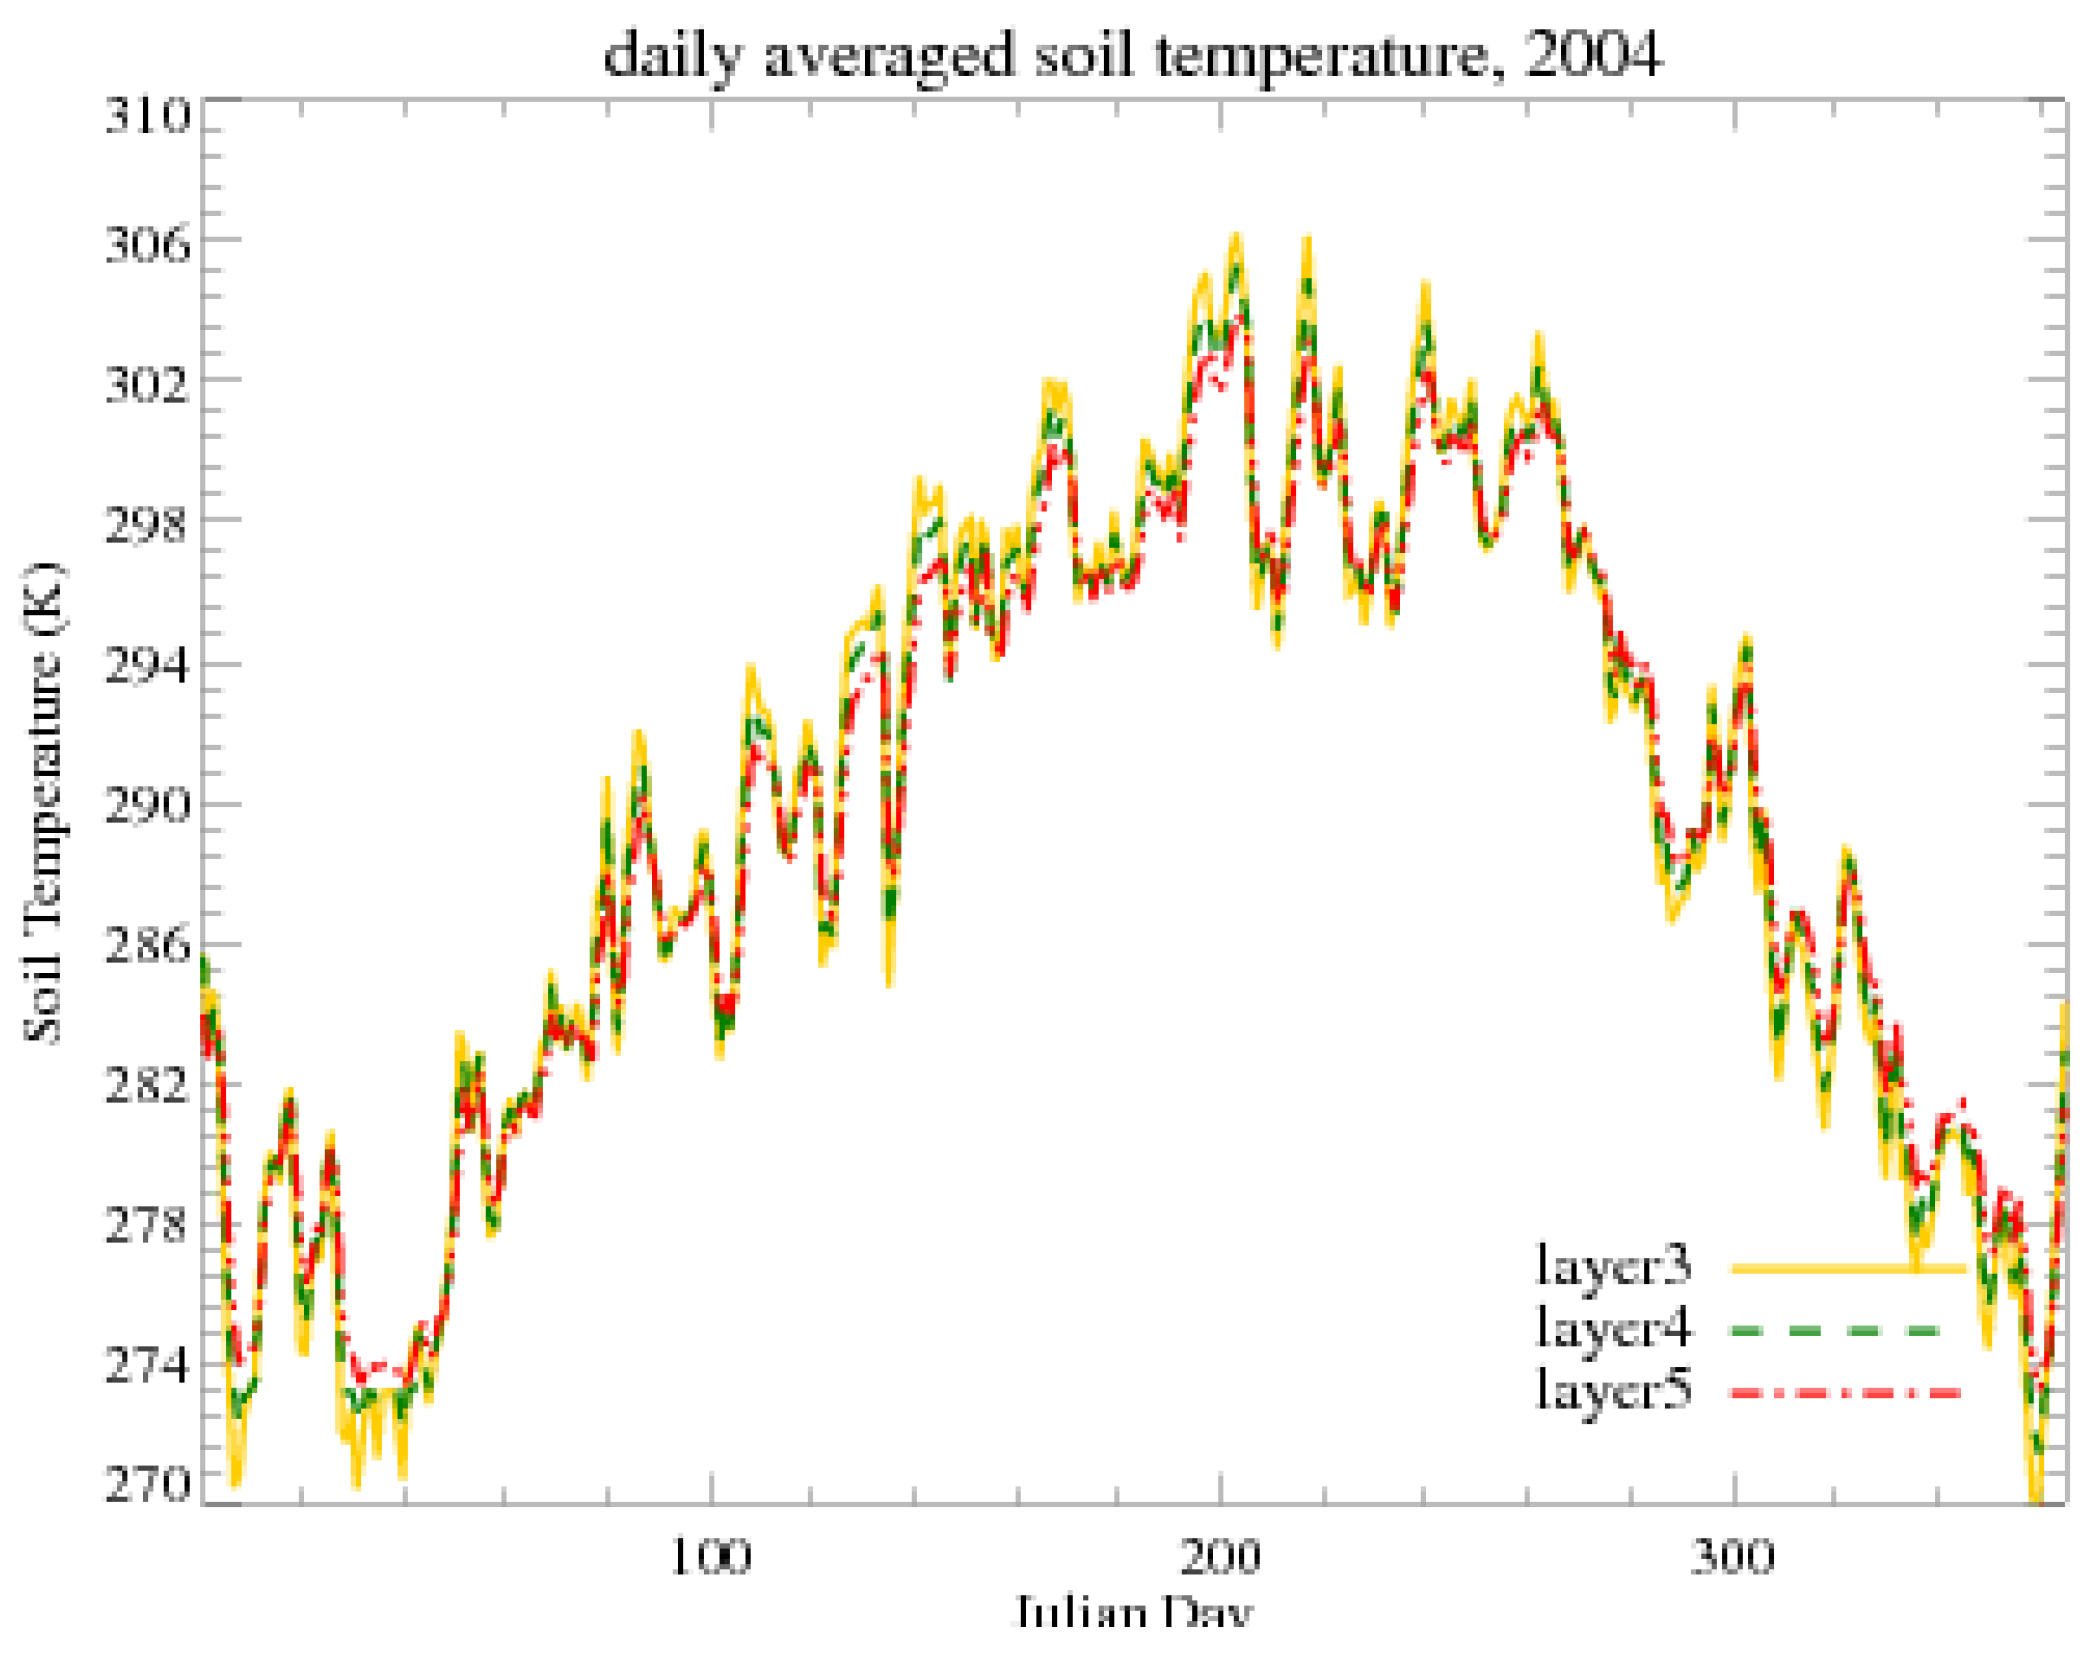
Similar to the ARM observations (
Figure 2b), soil temperatures in CLM4 Layers 3, 4 and 5 are very close to each other (
Figure 9). Apparently, all three layers have the same seasonality because the surface insolation is the key factor determining soil temperature. Nevertheless, layer 3 (−0.05 m) has larger temperature variations than the other two underlying soil layers, as expected. For example, around Julian day 40, T
soil for layer 3 is 2–3 °C lower than that of layer 4 and 5, but around Julian day 200, it is higher than the other two layers by about 2 °C. Such larger seasonality and daily variation are partly due to stronger ground heat flux transport between surface and the upper soil layer and partly due to the fact that model is too dry at this layer, as revealed in
Figure 6a.
Figure 6.
Simulated daily averaged volumetric soil moisture from offline community land model (CLM4) in (a) the upper layer (layer 3, −0.05 m) and (b) the lower layer (Layer 5, −0.3 m). The control run (CLM4-control) is forced by the default atmospheric forcing provided by National Center for Atmospheric Research (NCAR) model release package and the ARM-forced run (CLM-ARM-forced) uses the hourly ARM observed atmospheic forcing data in Year 2004.
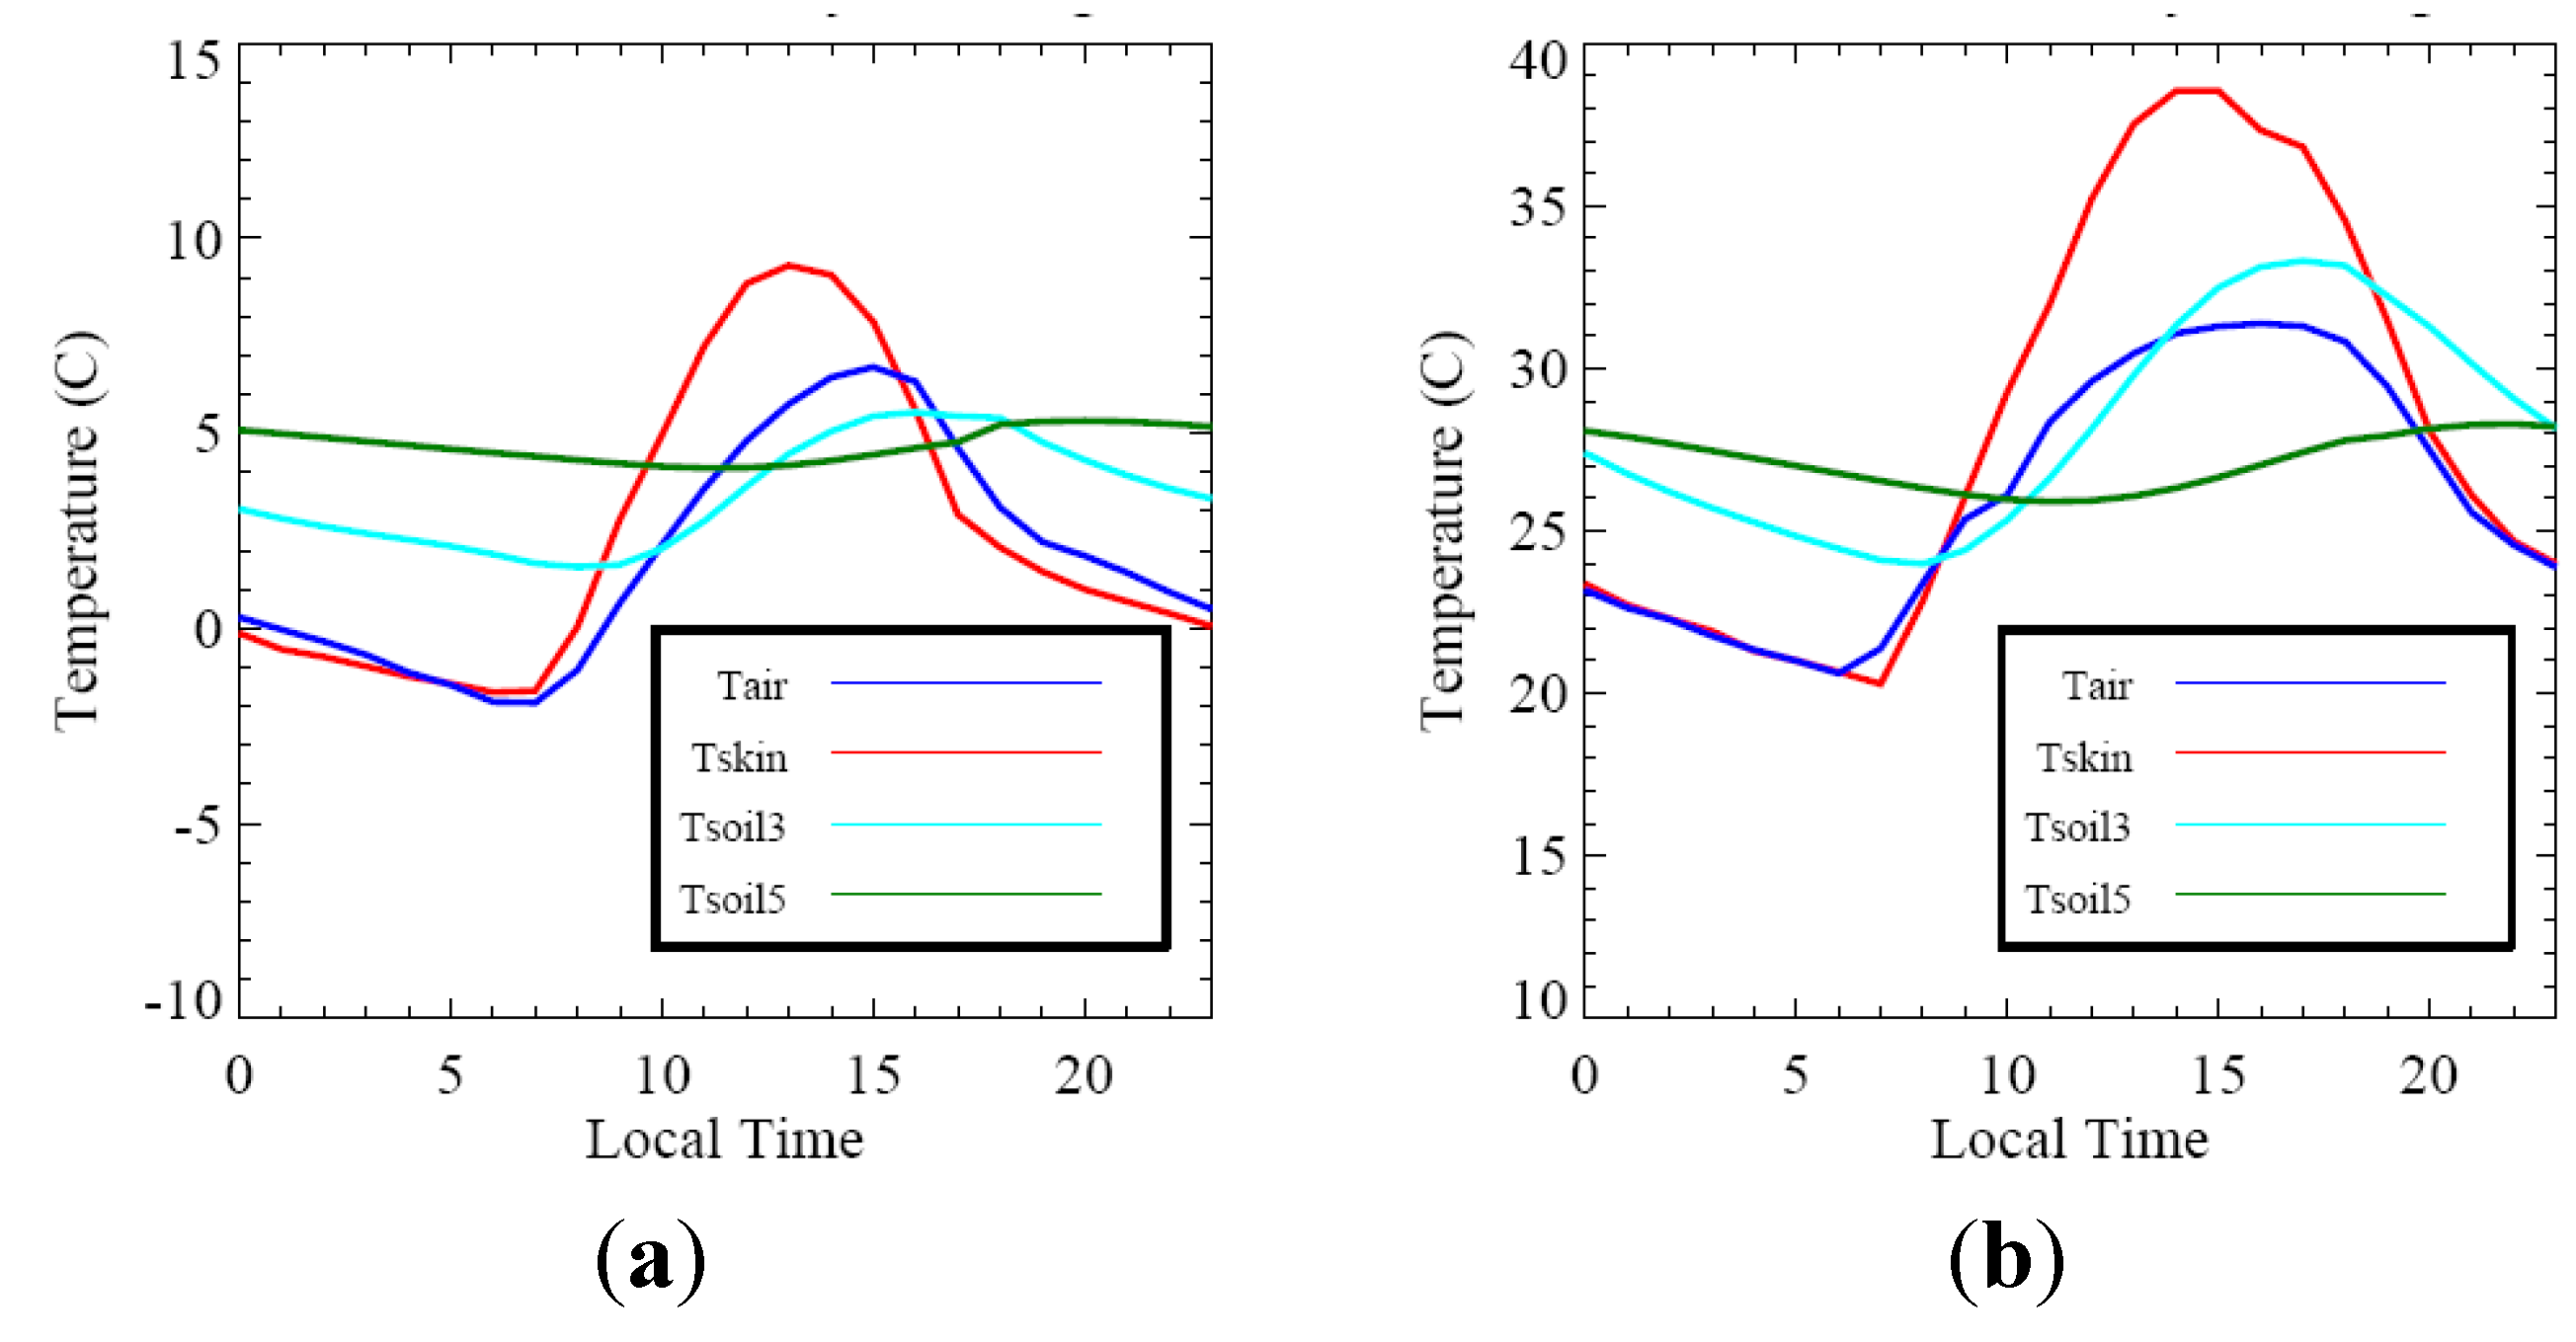
The diurnal phase of 2-m T
air, T
skin, and T
soil are well simulated in offline CLM4 (
Figure 10), comparing those to ARM observations (
Figure 4). First, T
skin is lower than T
air at night but warmer than T
air during daytime after sunrise, a feature consistent with many previously studies [
15]. Second, T
soil in layer 3 is lower than T
skin with 3 h time lag because heat is propagated from the surface skin layer into the ground. Furthermore, the lower layer T
soil (−0.25 m) has the opposite phase to T
skin and T
air in both January and July, namely, high at local night but low at local daytime. Another deficiency in the model is that Tsoil3 is higher than Tair in July 2004 (
Figure 10b), which is not found in the ARM data (
Figure 4b). Nevertheless, the most evident deficiency between the CLM4 and the ARM observations occur at nighttime on T
skin and T
air. In the real world (
Figure 4), T
skin is lower than T
air by about 0.5 °C to 2 °C in January and July, respectively. However, in the model, these two temperatures are too close at nighttime because T
skin is too high. Since in an offline model run, T
air, downward longwave radiation, and wind are all from the observed ARM observations, this nighttime deficiency suggests some model problems which lead to a hot skin surface in CLM4. In addition, the diurnal scale peak of July T
skin is higher in CLM4 than in the observations.
Figure 7.
Correlation of volumetric soil moisture between the upper and lower layers: (a) is the ARM observations and (b) is the CLM simulations. Data is daily average for year 2004.
Figure 7.
Correlation of volumetric soil moisture between the upper and lower layers: (a) is the ARM observations and (b) is the CLM simulations. Data is daily average for year 2004.
Figure 8.
Same as
Figure 3, except that skin temperature and soil moisture are from offline CLM4 ARM-forced run for daily averaged value in Year 2004, (
a) the upper soil layer (−0.05 m) and (
b) the lower soil layer (−0.25 m).
Figure 8.
Same as
Figure 3, except that skin temperature and soil moisture are from offline CLM4 ARM-forced run for daily averaged value in Year 2004, (
a) the upper soil layer (−0.05 m) and (
b) the lower soil layer (−0.25 m).
Figure 9.
Offline CLM4 simulated daily averaged soil temperature at the upper soil layer (model layer 3, −0.05 m), the middle layer (model layer 4, −0.12 m) and the lower layer (model layer 5, −0.25 m). The model run uses ARM hourly atmospheric forcing for Year 2004.
Figure 9.
Offline CLM4 simulated daily averaged soil temperature at the upper soil layer (model layer 3, −0.05 m), the middle layer (model layer 4, −0.12 m) and the lower layer (model layer 5, −0.25 m). The model run uses ARM hourly atmospheric forcing for Year 2004.
Figure 10.
CLM4 simulated monthly mean Tskin, Tair, Tsoil at the upper soil layer (Tsoil3) and Tsoil at the lower soil layer (Tsoil5) for (a) January 2004 and (b) July 2004. The model run is forced by ARM hourly observations.
Figure 10.
CLM4 simulated monthly mean Tskin, Tair, Tsoil at the upper soil layer (Tsoil3) and Tsoil at the lower soil layer (Tsoil5) for (a) January 2004 and (b) July 2004. The model run is forced by ARM hourly observations.


