Article

Projected 21st Century Increased Water Stress in the Athabasca River Basin: The Center of Canada’s Oil Sands Industry

by
Marc-Olivier Brault
1,
Jeannine-Marie St-Jacques
1,*,
Yuliya Andreichuk
2,
Sunil Gurrapu
3,
Alexandre V. Pace
1 and
David Sauchyn
2
1
Geography, Planning and Environment, Concordia University, 1455 Blvd. de Maisonneuve Ouest, Montreal, QC H3G 1M8, Canada
2
Prairie Adaptation Research Collaborative, University of Regina, Regina, SK S4S 0A2, Canada
3
National Institute of Hydrology, Roorkee 247667, Uttarakhand, India
*
Author to whom correspondence should be addressed.
Climate 2025, 13(9), 198; https://doi.org/10.3390/cli13090198
Submission received: 24 July 2025 / Revised: 31 August 2025 / Accepted: 17 September 2025 / Published: 21 September 2025

Abstract

The Athabasca River Basin (ARB) is the location of the Canadian oil sands industry and 70.8% of global estimated bitumen deposits. The Athabasca River is the water source for highly water-intensive bitumen processing. Our objective is to project ARB temperature, precipitation, total runoff, climate moisture index (CMI), and standardized precipitation evapotranspiration index (SPEI) for 2011–2100 using the superior modelling skill of seven regional climate models (RCMs) from Coordinated Regional Climate Downscaling Experiment (CORDEX). These projections show an average 6 °C annual temperature increase for 2071–2100 under RCP 8.5 relative to 1971–2000. Resulting increases in evapotranspiration may be partially offset by an average 0.3 mm/day annual precipitation increase. The projected precipitation increases are in the winter, spring, and autumn, with declines in summer. CORDEX RCMs project a slight increase (0.04 mm/day) in annual averaged runoff, with a shift to an earlier springtime melt pulse. However, these are countered by projected declines in summer and early autumn runoff. There will be significant decreases in annual and summertime CMI and annual SPEI. We conclude that there will be increasingly stressed ARB water availability, particularly in summer, doubtless resulting in repercussions on ARB industrial activities with their extensive water allocations and withdrawals.

1. Introduction

The province of Alberta, Canada, depends on its mountain-sourced rivers, both for the wellbeing of its citizens and the productivity of its agriculture and hydrocarbon industries around which its economy is centered [1]. However, the climate of Alberta is highly continental and prone to severe inter-annual variability in temperature and precipitation. This, along with increasing human water demands, puts its river basins under great stress and creates a necessity for careful water management. This applies to the Athabasca River Basin (ARB) (Figure 1), which is the location of 70.8% of global estimated bitumen deposits (an estimated 168 million barrels) or 13% of total global oil reserves [2]. Thus, the ARB is the center of the Canadian oil sands industry, one of the most water-dependent industries in the province [3,4]. Oil sands surface mining operations require constant water withdrawals from the Athabasca River to extract, process, and upgrade crude bitumen, which once contaminated, remains in massive tailings ponds. With the impending threat of anthropogenic climate change and the water availability uncertainties it entails, this calls for re-examination of the water resource management plans already in place [5].
Most studies of climate impacts rely on instrumental weather and streamflow data to examine trends and inter-annual climate variability (e.g., [6,7,8,9]), to fine tune hydrological models (e.g., [10,11]), and to better understand the climate dynamics which lead to weather extremes (e.g., [12,13]). While weather data exist for ~100 years, hydrometric records, upon which ARB water resource allocations are currently based, are often only decades long [5]. Hence, using these records to inform future water resource management relies on a stationarity assumption that the range of variability of regional hydroclimate will remain the same as that of the short instrumental records [14]. It is becoming increasingly clear that the warming projected for the 21st century will increase both the short-term and long-term variability of dry-continental and semiarid hydroclimates [15,16,17], contradicting this stationarity assumption.
The impacts of anthropogenic greenhouse gas emissions and the climate non-stationarity that they cause have been the focus of climate modeling studies worldwide, initially using global climate models (GCMs) [18]. Regional climate models (RCMs) were developed to dynamically downscale climate fields produced by coarse-resolution GCMs, thereby providing information at finer sub-GCM grid scales more appropriate for modelling regional climate change [19]. GCMs do not provide trustworthy information for hydrologically relevant variables on scales less than ~200 km, but hydrological processes generally act at less than 200 km scales [20]. RCMs are better able to account for the effects of sub-GCM grid scale forcings and processes, such as dynamical mesoscale processes, those due to complex topography including mountainous terrain, inland water bodies such as major lakes, coastlines, and land cover distribution. GCMs do not capture the circulation patterns producing hydrological extreme events [21,22]. Therefore, to more reliably project the hydrological impacts of climate change in the ARB, an analysis from higher-resolution RCMs is needed, which is the objective of this manuscript.
RCMs are needed for projections in the ARB as they do a widely acknowledged more skillful modelling job than GCMs do on mesoscale precipitation processes and the thermodynamics driving convective parameterizations, which are crucial in modelling summer precipitation [19,23,24,25]. RCM-based studies would be a useful contribution to a better understanding of the ARB’s future hydroclimate because it is in the summer when 75% of precipitation occurs, often as major rainstorms, in which meso-scale processes play an important role [26,27]. Similarly, mesoscale convective systems (MCSs) contribute more than 50% of warm season precipitation in the nearby central and midwestern United States. Since GCMs are unable to model MCSs, most show resulting dry and warm biases in these regions, as well as errors in the precipitation diurnal cycle and intensity [23,28]. As a further example of how RCMs better simulate the mesoscale climate of the North American interior, Bukovsky et al. [29] found that a set of NARCCAP RCM simulations demonstrated more realistic historical simulations and projected more severe future late-summer drying in the central United States than their corresponding GCMs alone did. They linked this summer drying more credibly captured by the RCMs to physically consistent mechanisms arising from initial mesoscale and large-scale circulation changes, i.e., the strengthenings of the North American monsoon high (which suppresses convection) and the Great Plains low-level jet (which converges moisture poleward), and an earlier springtime poleward shift of the upper-level jet, all of whose drying effects are then amplified by land–atmosphere interactions.
The headwaters and source of the Athabasca River are located in the Canadian Rocky Mountains; therefore their climate must be modelled adequately. GCMs cannot capture high-relief surface heterogeneity, which is another important source of climate and meteorological spatial variability [23]. Small-scale heterogeneity often arises in mountains and other areas of complex topography just from rapidly varying elevation. RCMs, on the other hand, have shown a better capacity than GCMs to resolve the substantial spatial variations in temperature, precipitation and circulation in these regions. High-relief topography produces variations in temperature from lapse rate effects, and when RCMs are driven by reanalysis data, they reproduce these variations relatively realistically [30,31]. As well, high-relief topography produces temperature anomalies in valleys and other low areas due to the nighttime pooling of cool, dense air masses. Additionally, in RCMs, better snow line resolution in high-relief areas causes localized intensification of warming due to snow albedo feedback, as shown in the Canadian and U.S. Rocky Mountains, among others [32,33]. GCMs typically locate the snow-albedo-feedback warming in incorrect places because of their poor topographic detail [31]. Topographically-caused temperature and circulation variations result in a range of climatologically significant effects, i.e., rain shadows, precipitation from orographic uplift, and barrier jets [23]. In total, these problems with GCMs in mountainous areas can be so severe that they can result in a sign change in future precipitation relative to that from RCMs. For example, Giorgi et al. [34] used an ensemble of EURO-CORDEX RCM-based projections over Europe to investigate the summer precipitation change signal in the Alps. They found that, while the driving GCM ensemble projected a clear regional decrease of summer precipitation (also found by other GCM ensembles), the RCMs projected an increase of precipitation along the highest peaks of the Alpine chain, which accords with what instrumental records have been showing.
Variability in land surface properties other than elevation also causes spatial variations in weather and climate [23]. Among these variations are the transitions from open water to land around lakes and ocean coastlines, and variations in land cover and land use. RCMs can model lake breezes and land–sea breezes quite realistically, together with the localized suppression of the resulting land–water temperature gradient [35]. RCMs also provide better modelling of “lake effect” precipitation through finer resolution of local coastlines and relief than GCMs do [36]. These features are important in the ARB as two major lakes are located here: Lake Athabasca and Lesser Slave Lake.
Recent decades have seen the emergence of increasingly complex and detailed RCMs in an attempt to produce regional projections of future climatic changes that are both accurate and reliable. An effort to group and compare RCMs, called CORDEX (Coordinated Regional Climate Downscaling Experiment), has resulted in a coordinated framework for regional climate modeling and downscaling, which evaluates climate model results from regions of interest worldwide [19,37]. This is the most recently compiled, inter-comparison RCM data available for North America [38]. In addition to offering climate model data for multiple areas of interest, the framework was created with the aim of improving regional dynamic and statistical downscaling techniques, leading to the emergence of a new generation of regional-scale climate projections.
Future water availability in the ARB has been investigated using coarse-resolution GCMs to drive hydrological models or standing alone. Kerkhoven and Gan [39] simulated ARB hydroclimate using statistically assimilated runs from seven GCMs to drive a modified Soil–Biosphere–Atmosphere (MISBA) land surface and hydrological model under primarily A2 (high emissions) and B2 (local sustainability) SRES to project SWE, and average, maximum, and minimum flows for the 21st century. Leong and Donner [26,40] assessed how future changes in Athabasca River streamflow variability might affect the water withdrawals by the oil sands industry, using output from three CMIP5 GCMs under RCP4.5 and RCP8.5 to drive the Integrated BIosphere Simulator (IBIS) land surface process model and the Terrestrial Hydrology Model with Biogeochemistry (THMB) hydrological routing model. They simulated daily ARB streamflow just downstream of the oil sands deposits. Also relevant are the work of Eum et al. and Dibike et al. [41,42,43], who modelled future seasonal and spatial changes in SWE and changes in river discharges and peaks for the ARB using the Variable Infiltration Capacity (VIC) hydrologic model and statistically downscaled future climate data from six CMIP5 GCMs forced with RCP4.5 and RCP8.5 emissions scenarios. Thiombiano et al. [44] examined 13 Expert Team on Sector-Specific Climate Indices (ET-SCI) hydroclimate variables from 12 runs from seven CMIP6 GCMs and four future scenarios to determine their trends in the Alberta oil sands region over the 21st century.
The objective of this manuscript is to project ARB hydroclimate throughout the 21st century using the superior modelling skill of RCMs in capturing regional climate in the ARB’s complex terrain and climate in the context of increasing drought concerns. To the best of our knowledge, all previous basin-scale hydroclimate modelling of the seasonal hydroclimate of the ARB has been done using only coarse-resolution GCMs, and not with more skillful, higher-resolution RCMs. We aim to fill this gap in this manuscript. We use CORDEX RCM runs with RCPs established by the Intergovernmental Panel on Climate Change (IPCC) to model projected changes in ARB runoff and aridity indices by the year 2100 [16]. We hypothesize that the superior modelling skill of the RCMs will show increased precipitation in the ARB. However, we also hypothesize that the projections will show that the ARB will experience future increasing water stress and drought. This basin-scale study focuses on results obtained through RCP 8.5—the business-as-usual, high emissions case—although we also briefly report mid-range mitigation RCP 4.5 results. In this study, we provide context for the viability of water-consuming industrial activities and ecological services at the end of this century.

2. Regional Setting, Materials and Methods

2.1. Regional Setting

The ARB study area is the upper alpine, middle foothill, southern boreal forest, and interior plains reaches of the ARB (Figure 1), from its headwaters in the Canadian Rocky Mountains at the Columbia Icefield (at over 3700 m above mean sea level) to below Fort McMurray, Alberta [42] (~85% of the basin). The Athabasca River ultimately terminates in the inland Peace-Athabasca Delta of Lake Athabasca, an ecologically sensitive region that provides important nesting and transit areas and habitat for wildlife. Its total length is ~1154 km [39]. The ARB’s total drainage area is ~156,000 km2. The ARB’s average annual temperature is 2 °C [45]. It has a continental climate with daily mean temperatures below freezing between mid-October and early April [39]. Usual temperatures range from −20 °C in January to 17 °C in July. Its annual precipitation is over 1000 mm in the mountains (where the dwindling Columbia Icefield serves as its headwater), 500–600 mm in its central reach (where the oil sands are located), and 400–500 mm in the terminal northeast [26,42,46]. The majority of ARB precipitation (up to 75%) occurs between June and October as major rainstorms [26,47]. Streamflow has a nival hydrological regime in the ARB. The observed annual hydrograph from the gauge below Fort McMurray has its lowest flows in the winter, followed by rising spring discharge, leading to a broad, mid-summer peak flow generally in June, followed by a late-summer decline (Figure 1, [48]).
In addition to oil sands development, the ARB has been subjected to many other threats that act as multiple stressors (e.g., urban development, forestry, municipal and industrial wastewater discharges, agriculture, tourism, and mining) [3]. Currently, the Athabasca is the only major river in Alberta with completely unregulated flows, and roughly 74.5% of the total surface water allocation is taken up by the oil and gas industry [4]. As such, there are serious concerns as to whether there is sufficient water even today during low flows for oil sands processing, together with other human (i.e., agriculture, First Nations) and ecosystem service demands on the river [4,5]. Concerns are particularly acute during drought years.

2.2. Data Sources

For observed air temperature and precipitation variables, we used 10 km gridded Australian National University Spline (ANUSPLIN) data from Natural Resources Canada [49]. For observed runoff, we used river flows (in m3/s, which was then converted to runoff (mm/day)) from the Athabasca River below Fort McMurray (Water Survey of Canada (WSC) gauge 07DA001), which is the longest downstream hydrological record with continuous data available from the WSC and provides an integrated measure of ARB flow upstream of Fort McMurray. All observed data were collected for the historical period of 1971–2000.
We used CORDEX data from a set of seven RCM runs driven by an ensemble of GCMs over a domain spanning North America: the Canadian Regional Climate Model 4 and 5 (CRCM4 and 5), the Rossby Centre Regional Atmospheric Climate Model 4 (RCA4), and the HIRHAM Regional Atmospheric Climate Model 5 (HIRHAM 5) (based on a subset of the HIRLAM and ECHAM models). The UQAM version of CRCM5 was used. (CORDEX, https://www.cordex.org/data-access/esgf/ accessed on 2 August 2018) (Table 1). Model data were extracted for daily maximum temperature (tasmax), daily minimum temperature (tasmin), precipitation (precip), and total surface and subsurface runoff (mrro), for the historical simulated period 1971–2000, and three projected timeslices 2011–2040, 2041–2070, and 2071–2100. The driving CMIP5 GCMs were: the Canadian Earth System Model 2 (CanESM2); the Max Planck Institute Earth System Model (low resolution version) (MPI-ESM-lr); the Max Planck Institute Earth System Model (medium resolution version) (MPI-ESM-mr); and the European Centre-Earth Model (EC-Earth), based on the operational seasonal forecast system of the European Centre for Medium-Range Weather Forecasts (ECMWF). The GCMs were forced for the 21st century with RCP8.5 and RCP4.5 (IPCC, 2013). The CRCM4 and CRCM5 runs have a spatial resolution of ~25 km (0.22°) for RCP8.5, as does CRCM4 under RCP4.5; the other model runs have a spatial resolution of ~50 km (0.44°).

2.3. Calculations and Statistical Methods

The CORDEX RCM data were processed for analysis as follows using Matlab2017b®. For each of the RCM runs and each variable, we identified the grid cells centered within the ARB and analyzed their associated data. For each temperature and precipitation variable, we directly averaged the three-hourly data for each month and each year over all the RCM grid cells within the ARB, avoiding interpolation. For runoff using mrro, we directly averaged the three-hourly mrro data for each month and each water year (October–September) over all the RCM grid cells within the ARB. These averaged runoff outputs are used to estimate changes in the discharge of the naturally flowing Athabasca River. Previous work of St-Jacques et al. [50] centered on the South Saskatchewan River Basin, the major river basin of southern Alberta, investigated projected changes in runoff using an ensemble of several RCMs from the North American Regional Climate Change Assessment Program (NARCCAP) and one CORDEX RCM; they found that total surface and subsurface runoff (i.e., total runoff, mrro) was a reasonable estimator of projected changes in river flow.
To address the precipitation bias in the North American NARCCAP RCM models [51] when investigating the full range of regional hydroclimatic variability of the present and near future within the ARB, we used bias correction of temperature, precipitation and runoff by quantile–quantile (Q-Q) mapping based on the smoothed empirical CDFs of the observed and simulated historical temperature, precipitation, runoff, and river flow data, the same paradigm detailed in [50,52,53]. We applied bias correction to temperature and precipitation data from each grid point individually, then averaged the point-wise corrected data over the ARB. Averaging a variable over the ARB and then applying bias correction to the spatially averaged variable gave similar results and is not reported further. Runoff was averaged over the ARB, then bias-corrected. From this procedure, we obtained the bias-corrected mean annual and monthly temperature, precipitation, and runoff for each year and for each of the seven RCM runs for both the projected future and historical simulation periods. A very few values in the temperature scenarios exceeded the greatest values found in the control simulations. In this case, a simple extrapolation was used: outside the range of the correction function, a constant correction was applied following [52].
Drought potential was estimated by two aridity indices dependent on potential evapotranspiration (PET), which we calculated using a modified Penman–Monteith equation, which has fewer data demands than the original, as RCM data repositories do not store all the required variables, nor does the necessary historical instrumental data typically exist in most regions [54]. The first aridity index is Hogg’s climate moisture index (CMI), the difference between precipitation and PET; it is a measure of direct water availability on the surface [54]. Hogg’s CMI can be calculated for any geographic location, with elevation, monthly total precipitation, and mean daily minimum and maximum temperatures for each month of the year. The second aridity index is the standardized precipitation evapotranspiration index (SPEI) developed by Vicente-Serrano et al. [55], which is more useful when comparing drought potential across different regions. For both the CMI and SPEI, a negative value indicates dryness or a surface water deficit, and a positive value indicates wetness or a surface water surplus. Quantile–quantile bias-corrected temperature and precipitation were used in the calculation of both CMI and SPEI.
The widely used SPEI is a standardized aridity index meant to represent the level of drought threat independent of geographical location. It also includes both precipitation and temperature (as PET). To calculate the SPEI, we fitted the difference between precipitation and PET on a log-logistic distribution. The SPEI at a location gives the number of standard deviations from which the transformed (P–PET) deviates from the mean values over the reference period. We used the historical simulated period of 1971–2000 as the reference period. Given that the SPEI is a normalized index, a SPEI value of zero means no change relative to the historical simulated values. SPEI values below −1.28 signify severe dry conditions [56]. We calculated the SPEI for a time scale of 12 months (SPEI-12) (January–December), which can be used to assess the occurrence of multi-year droughts [57]. Unless otherwise noted, SPEI in this manuscript refers to SPEI-12.
We examined how well the RCMs modelled temperature, precipitation and total runoff in the ARB. For each hydrological variable, we calculated regime curves, each of which consisted of the 30-year average mean of each variable, obtained for all 12 months individually for 1971–2000 for each of the seven RCMs, plotted together with the observed historical data. In addition to the visual inspection of the plots of the regime curves, we used the mean squared error (MSE) and the correlation coefficient (R) to evaluate the goodness-of-fit of the 30-year average monthly values of the hydroclimate variable regime curves to their corresponding observed values. To assess the efficacy of bias correction, in addition to the visual inspection of the plots of the regime curves, we used MSE, R, and the Nash–Sutcliffe coefficient (NSE) to evaluate the goodness-of-fit of the 30-year average monthly values of the hydroclimate variable regime curves to their corresponding observed values before and after bias correction. Additionally, statistical tests were conducted on all variables to determine whether a given RCM projected significant changes in the average or variance over a 30-year period (either 2011–2040, 2041–2070, or 2071–2100) when compared with the historical period (1971–2000). These tests were as follows: a two-sample t-test was used to assess the significance of the change in average values, whereas a two-sample F-test was used to examine the significance of variance changes. In both cases, a p-value less than 0.05 was selected as the threshold to determine whether a statistical test yielded a significant departure from the reference period. Inter-model uncertainty is shown by the graphical spread of the projections of the different RCMs. We implicitly accounted for this uncertainty by doing the eight individual t-tests for each RCM and the multi-model mean annual means for each of the five hydroclimate variables. The range of significant and non-significant results further show the effect of inter-model uncertainty.

3. Results

3.1. Historical Simulations

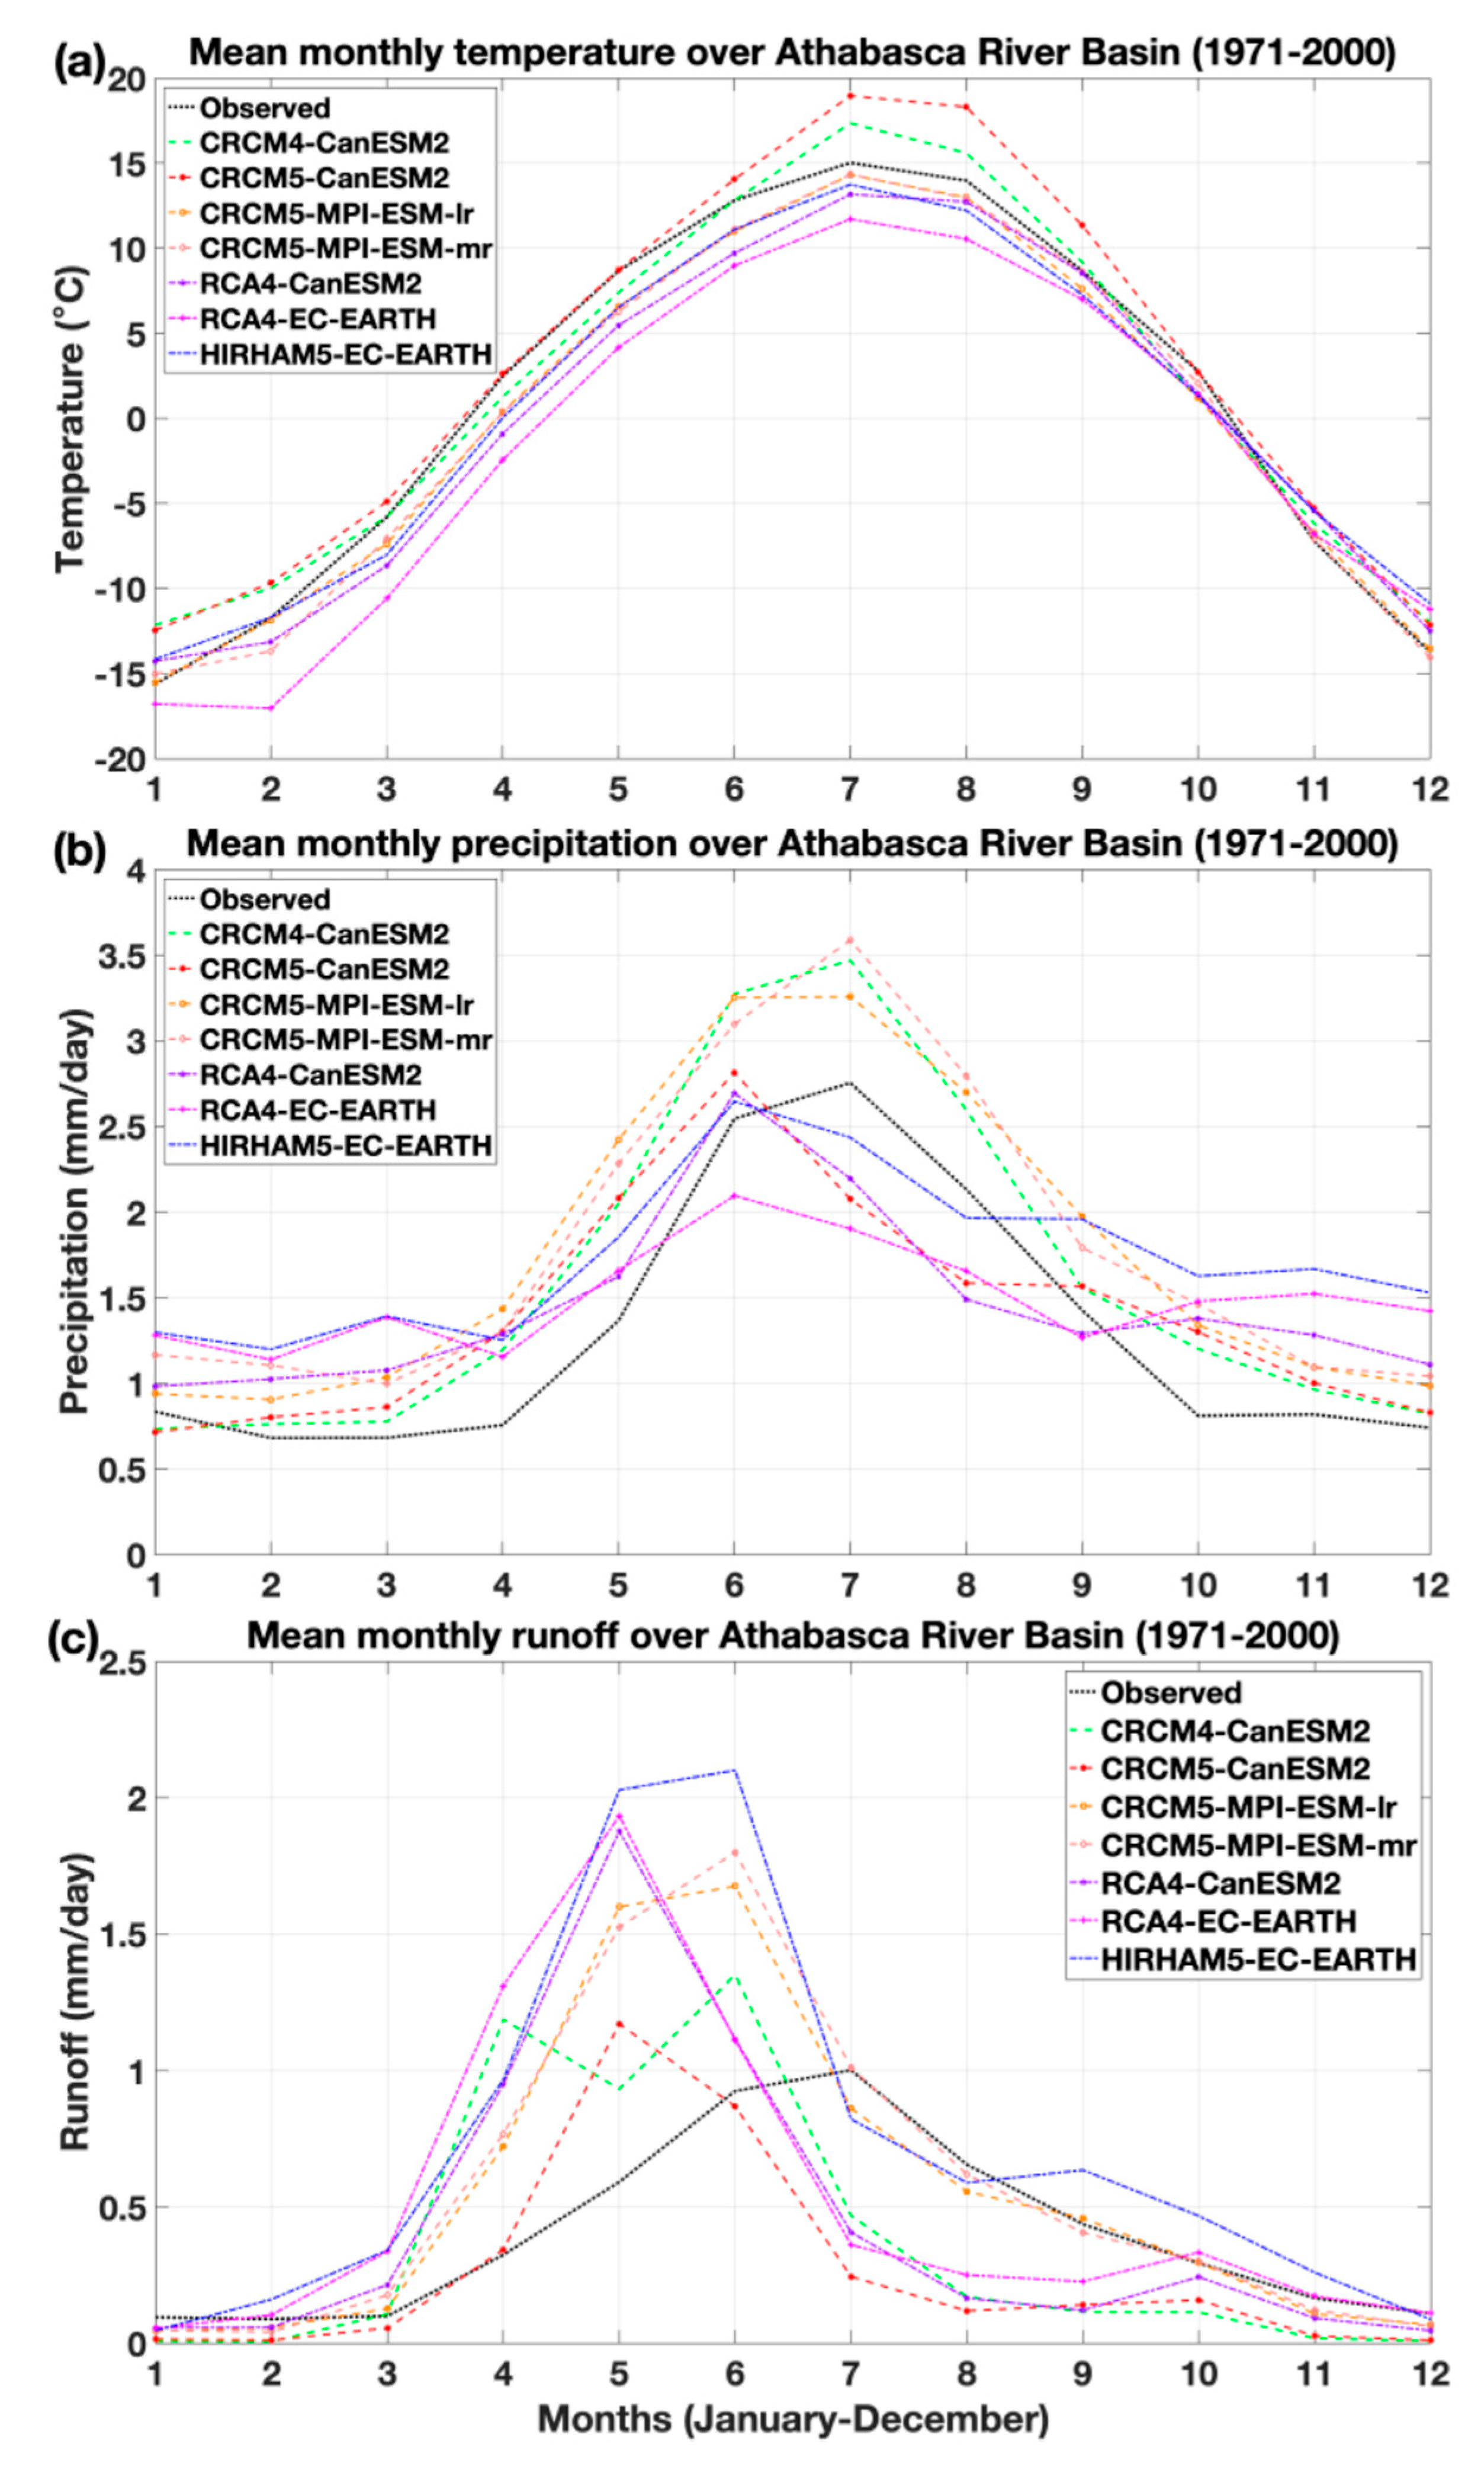
First, we examine how well the RCMs without bias correction captured the observed temperature, precipitation and runoff data for the historical period (1971–2000) (Figure 2 and Table 2). Overall, the values of models agree with the observed ANUSPLIN data more for temperature than for precipitation and runoff as supported by MSE and R. A comparison between the mean monthly climatology (temperature, precipitation and runoff) produced by the seven RCMs and averaged over the ARB for the historical period, and those from observed data averaged over the ARB shows that the models are able to reproduce the temperature and precipitation seasonality in central Alberta quite well (Figure 2a,b). However, precipitation amounts are too high, especially for CRCM4-CanESM2, CRCM5-MPI-ESM-lr, and CRCM5-MPI-ESM-mr. Problems do arise with runoff, but R shows that mrro still does have a substantial correlation with ARB streamflow (Figure 2c and Table 2). Every RCM overestimates winter (snow) precipitation, leading to a large snowpack in the model runs when compared to observed data (Figure 2b). This in turn creates what appears to be a substantially larger spring melt pulse in the model runs; the models with the higher winter precipitation result in the larger meltwater pulses (Figure 2c). As well, four of the models, CRCM4-CanESM2, CRCM5-CanESM2, RCA4-CanESM2, and RCA4-EC-Earth have much lower summer runoff than the summer low flows in the Athabasca River. The Q-Q mapping bias correction works well for temperature and precipitation as shown by MSE, R, and NSE (Table S1) and regime curve plots. It works less well for runoff, but still shows some improvement by R and NSE; NSE is greater than zero for all models, demonstrating that this approach has some skill (Table S1).

3.2. Projected Climate and Runoff Under RCP8.5

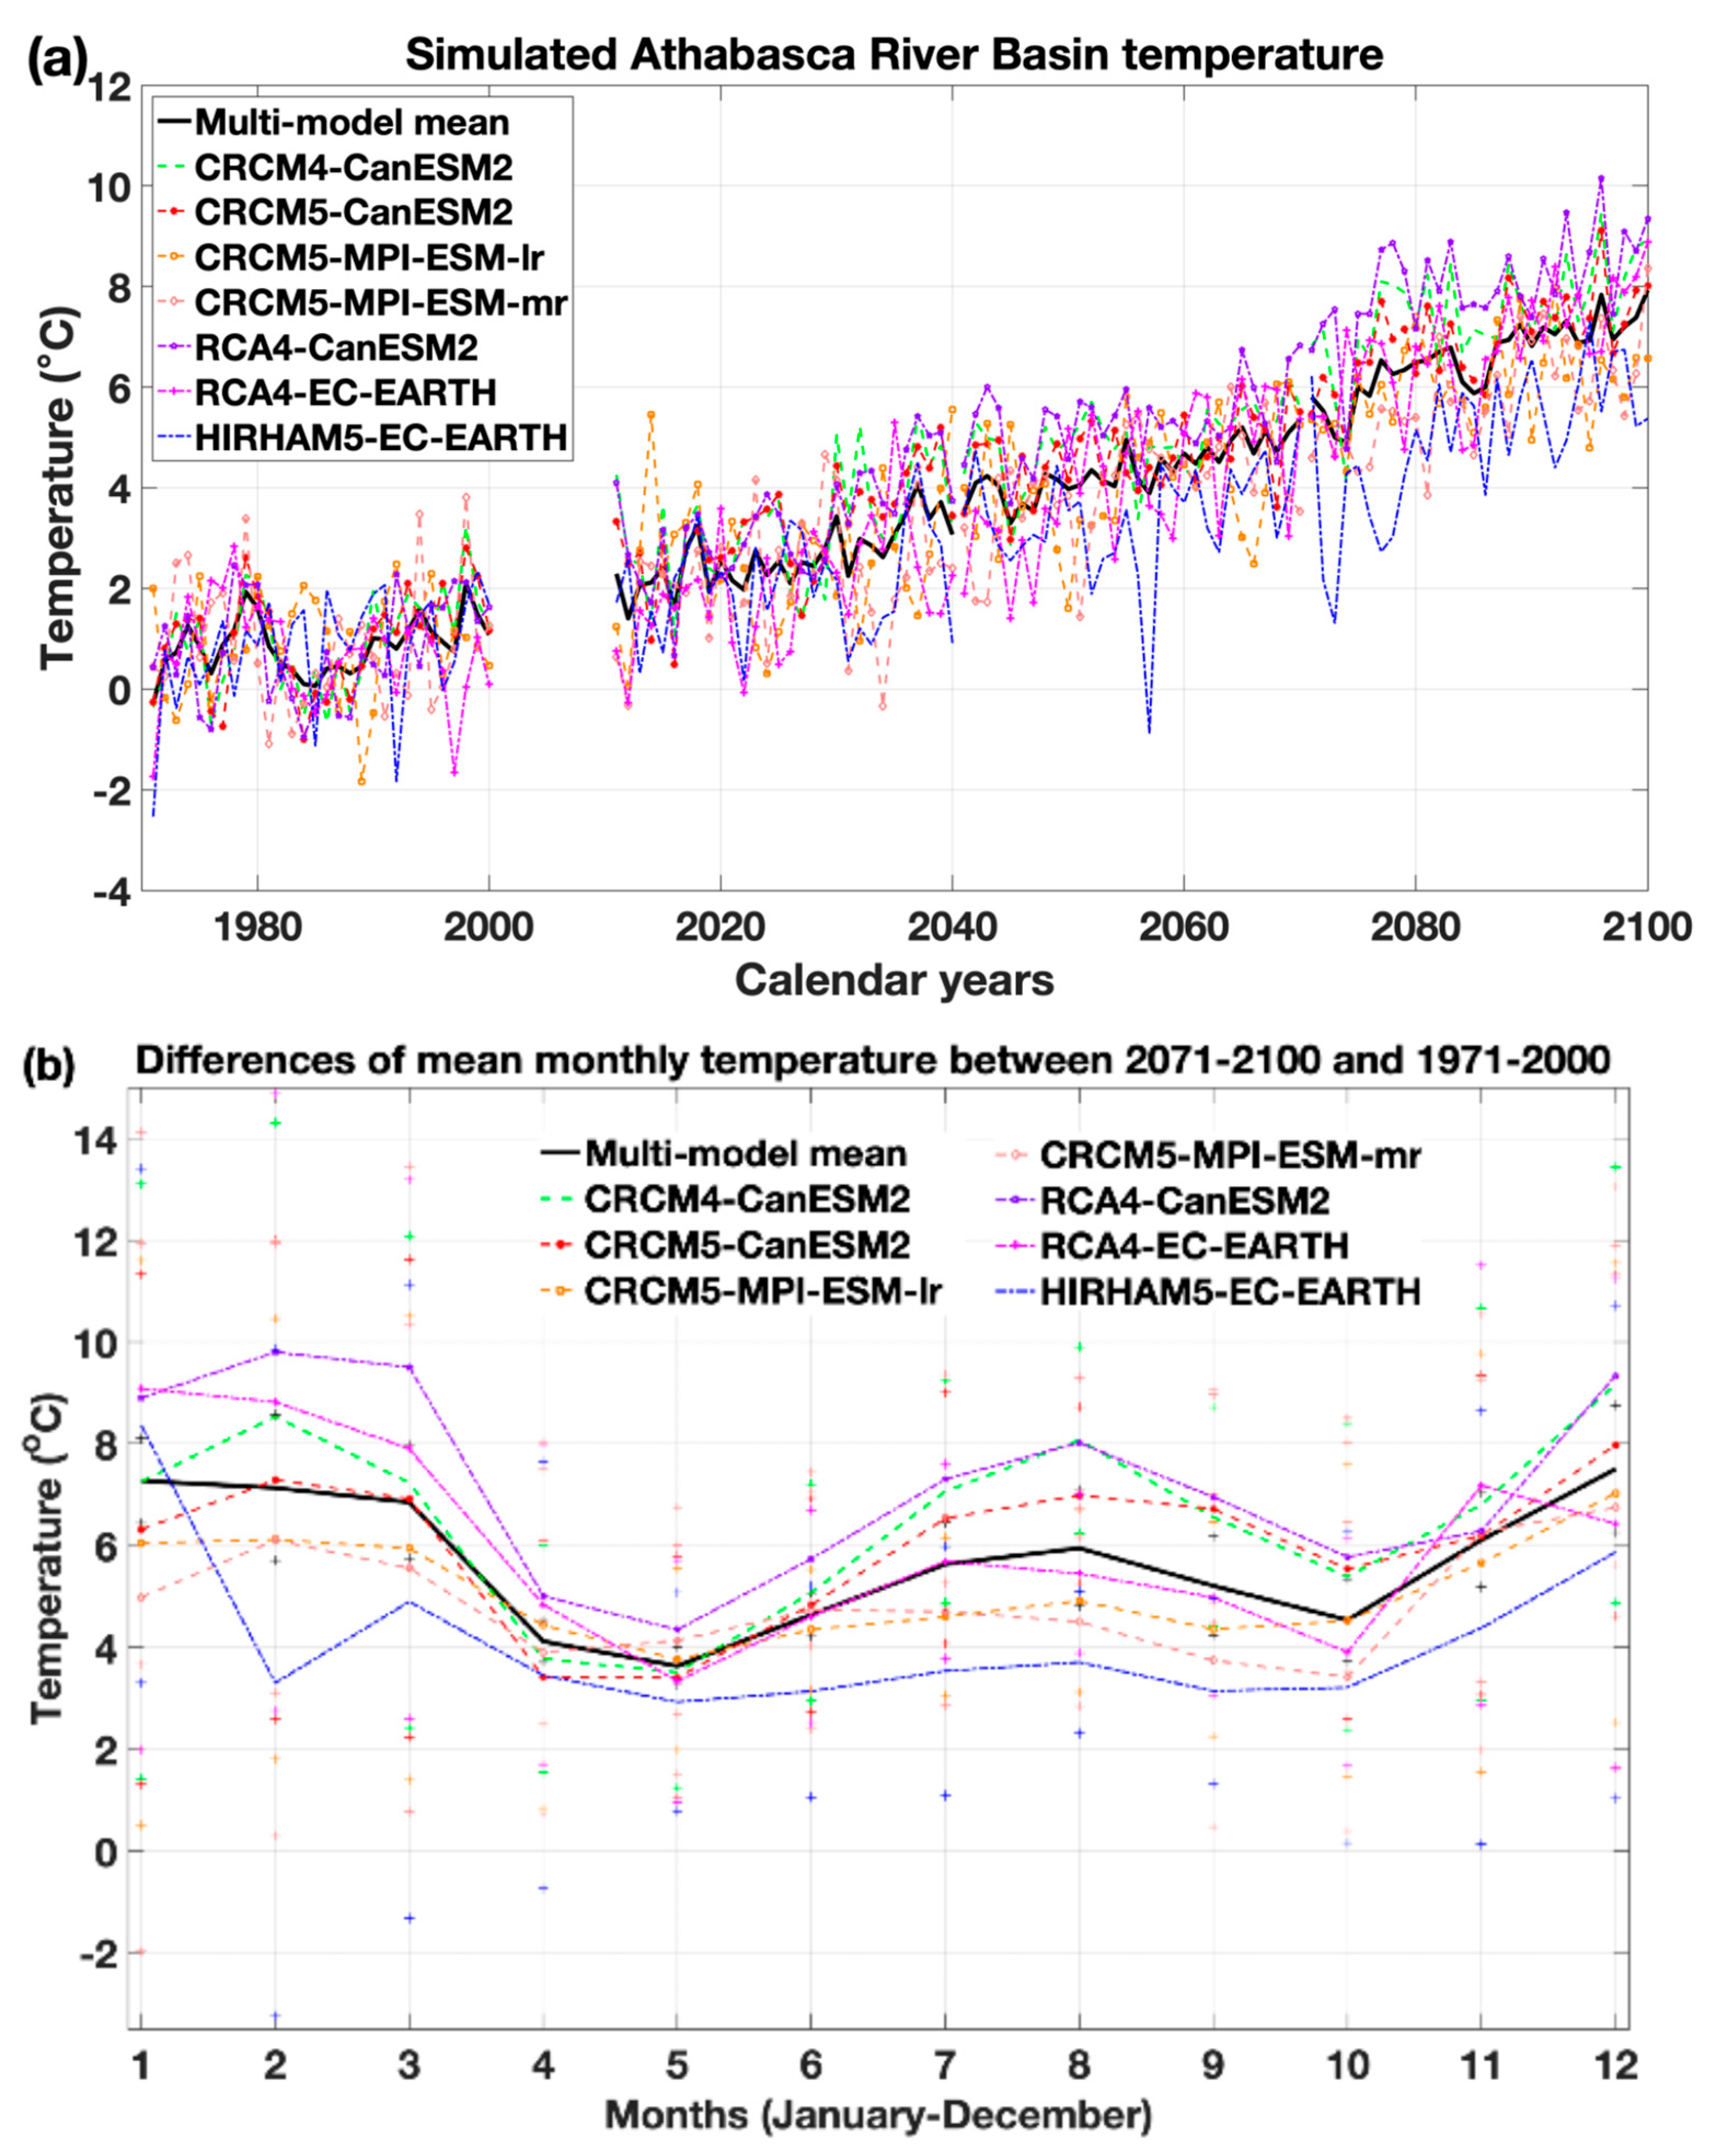
Next, we examine the timelines from 1971–2100 of the projected climate and runoff (with bias correction applied). The timeline of temperature changes under RCP8.5 from the start of the historical period, 1971, to the end of the third projection period, in 2100, is shown in Figure 3a. All of the models show a highly statistically significant steep and steady warming starting in the 2011–2040 period as assessed by t-tests (Table 3 and Table S2) if business as usual continues. Hence, there is not much inter-model uncertainty for temperature. Therefore, by the end of the 21st century, the ARB will be 5.7 °C above historical simulated (1971–2000) temperatures of 0.5 °C according to the multi-model mean (up to 8 °C according to RCA4-CanESM2 and CRCM5-CanESM2). No RCM shows a significant change in temperature variability as assessed by F-tests. Winter temperatures will increase the most, with the multi-model mean showing increases of ~7 °C (Figure 3b). Summer temperatures will also increase, with the multi-model mean for August showing an increase of 6 °C. Spring and autumn temperatures also increase, just not as much. The RCMs, by and large, all agree on the pattern of these seasonal increases.
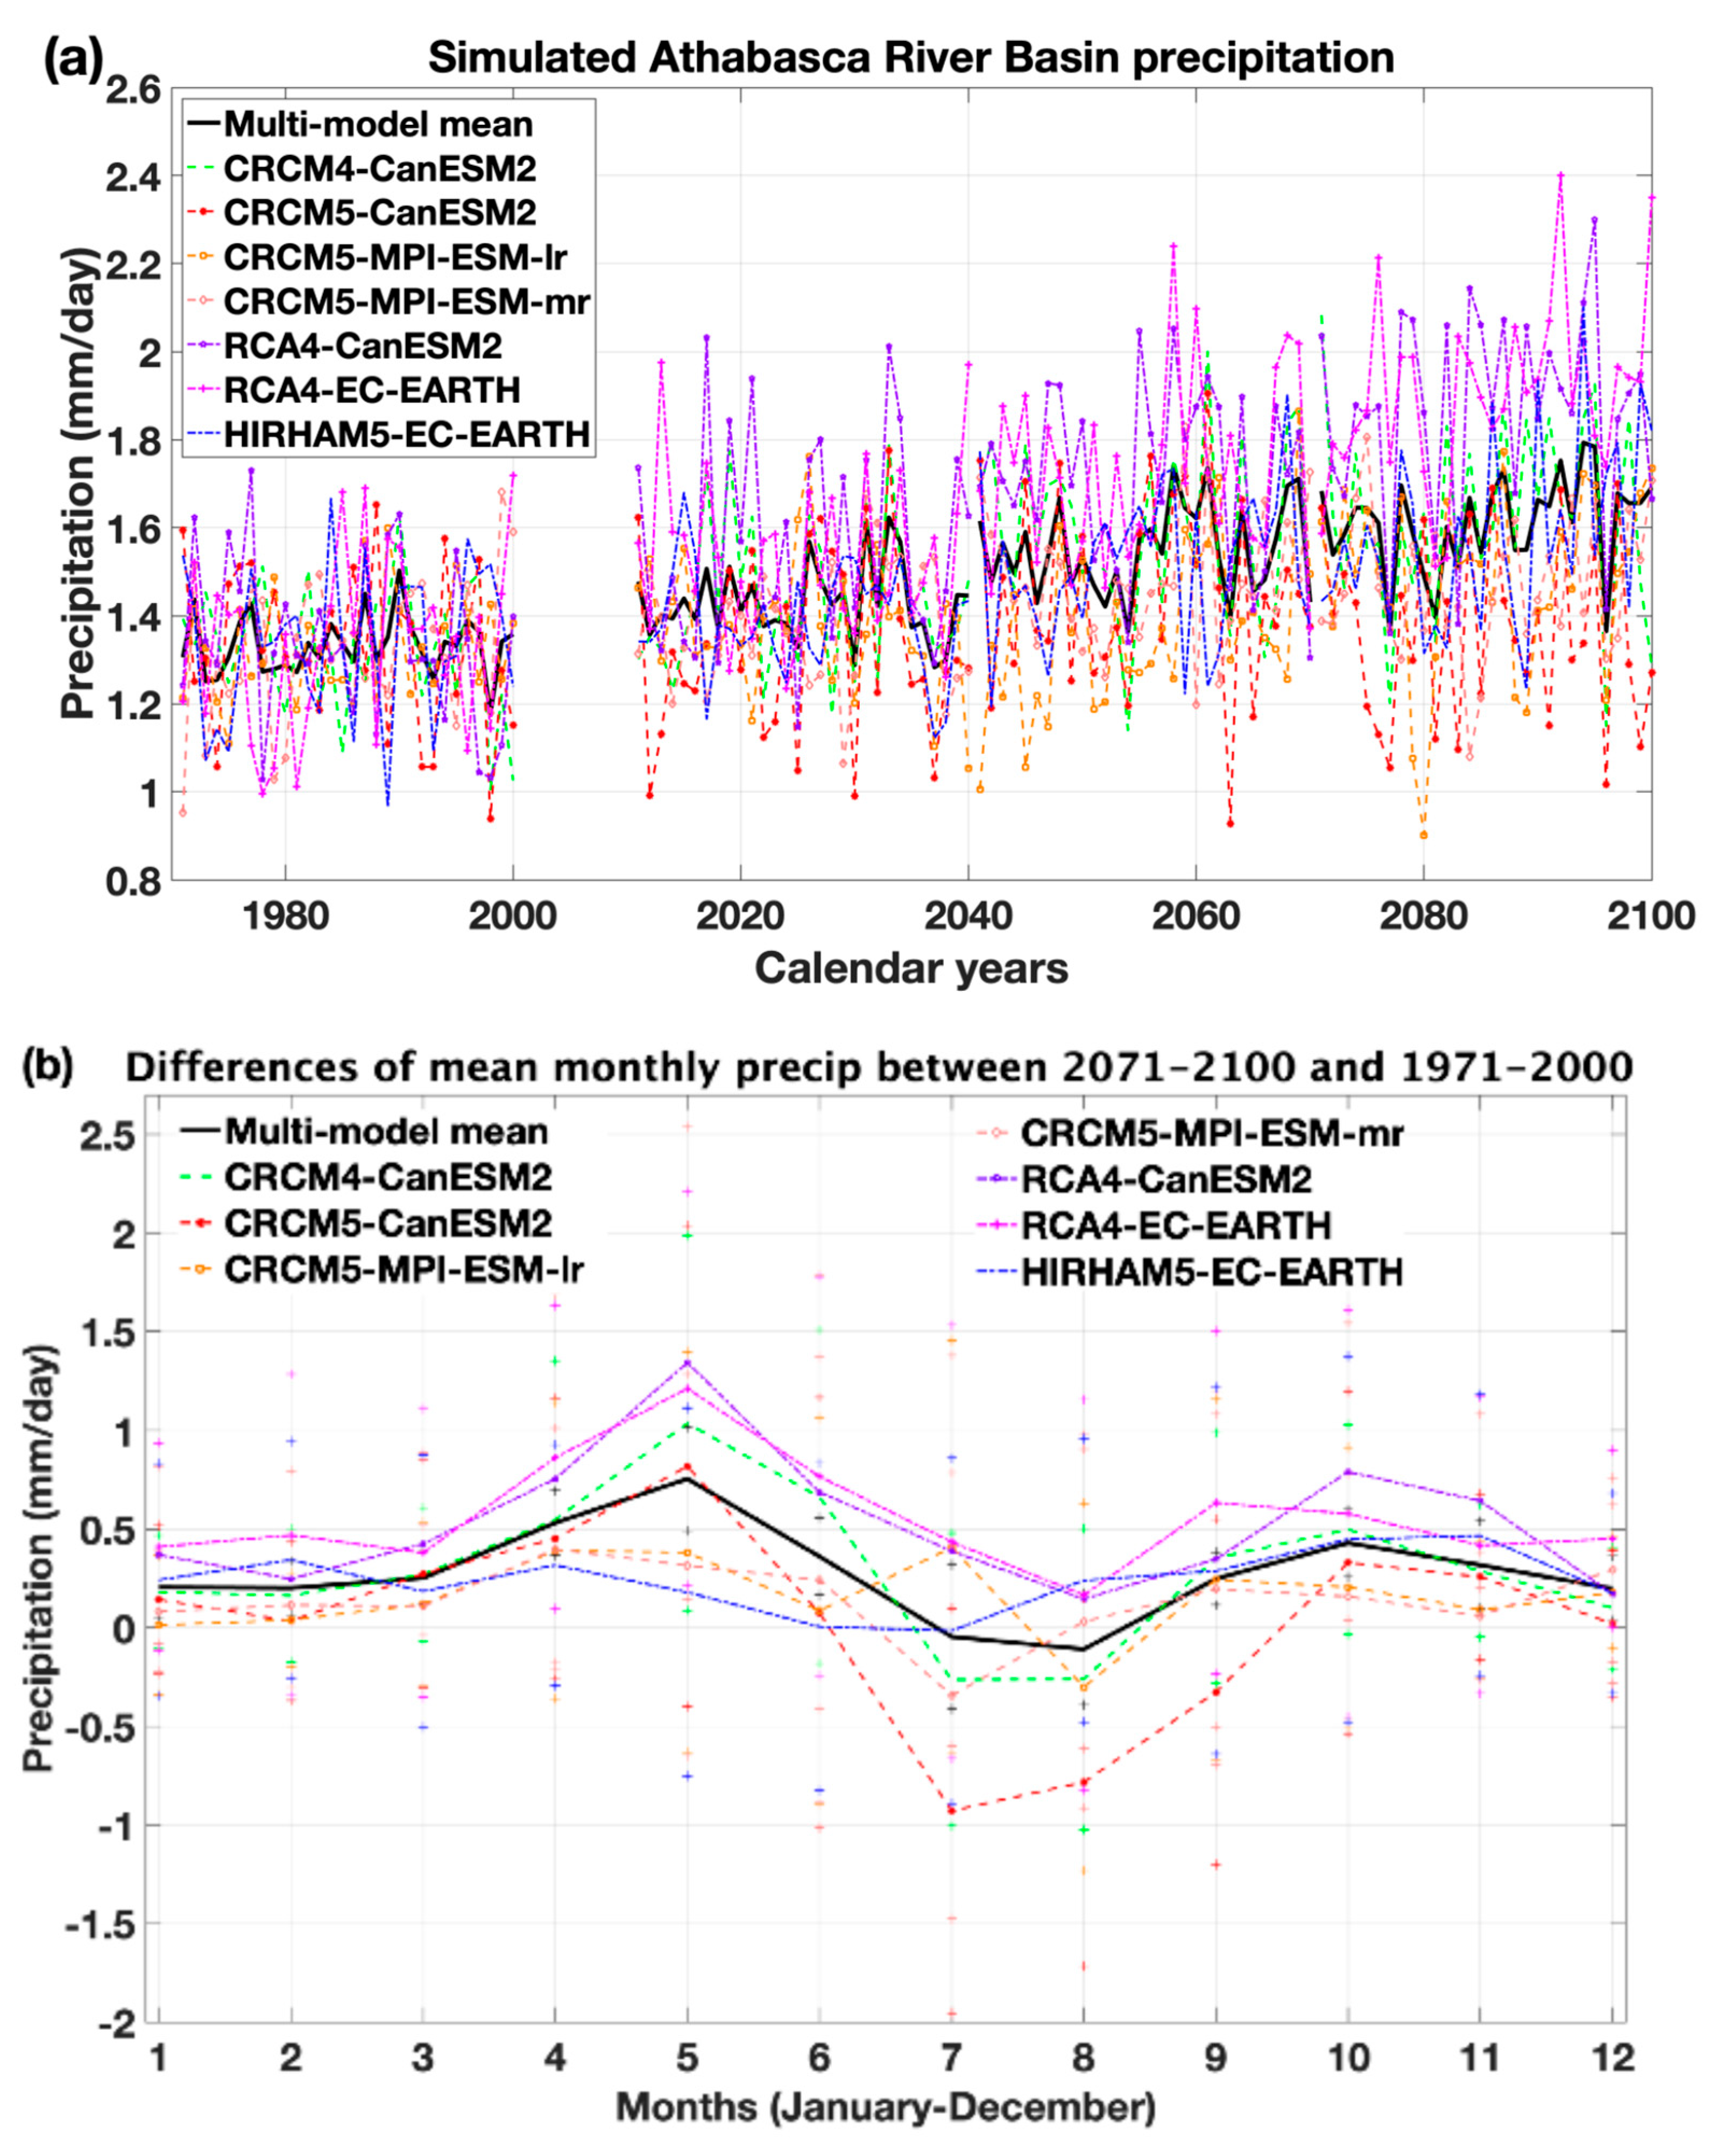
This rise in temperature is accompanied by a steady increase in the multi-model mean of annually-averaged precipitation, reaching 22% by century’s end (Figure 4a). Only three models and the multi-model mean (CRCM4-CanESM2, RCA4-CanESM2, and RCA4-EC-Earth) show a statistically significant annual precipitation increase in the 2011–2040 period as assessed by t-tests (Table S3). By the 2071–2100 period, six RCMs, as well as the multi-model mean, do show a significant increase. One model (CRCM5-CanESM2) still does not show a statistically significant precipitation increase for 2071–2100 (but it does for 2041–2070), indicating that there is greater inter-model uncertainty regarding how precipitation patterns will react to the projected warming than there is for temperature (Table 3 and Table S3). There is also a slight increase in annual precipitation variance as assessed by F-tests as we move further into the 21st century, which would indicate more inter-annual variability (i.e., more prolonged and severe droughts interspersed with exceptionally wet years), but this increase in variance is generally not statistically significant across most RCMs (Table 3 and Table S3). Only two RCMs, CRCM4-CanESM2 and CRCM5-MPI-ESM-lr, and the multi-model mean show significant increases in variability. Much of the precipitation increase happens during winter and spring, with a lesser increase in autumn (Figure 4b). Crucially for ARB water management, the multi-model mean, and all three CRCM5 runs and CRCM4-CanESM2, show declines in July and August, months of the highest temperature and thus greatest water stress and need.
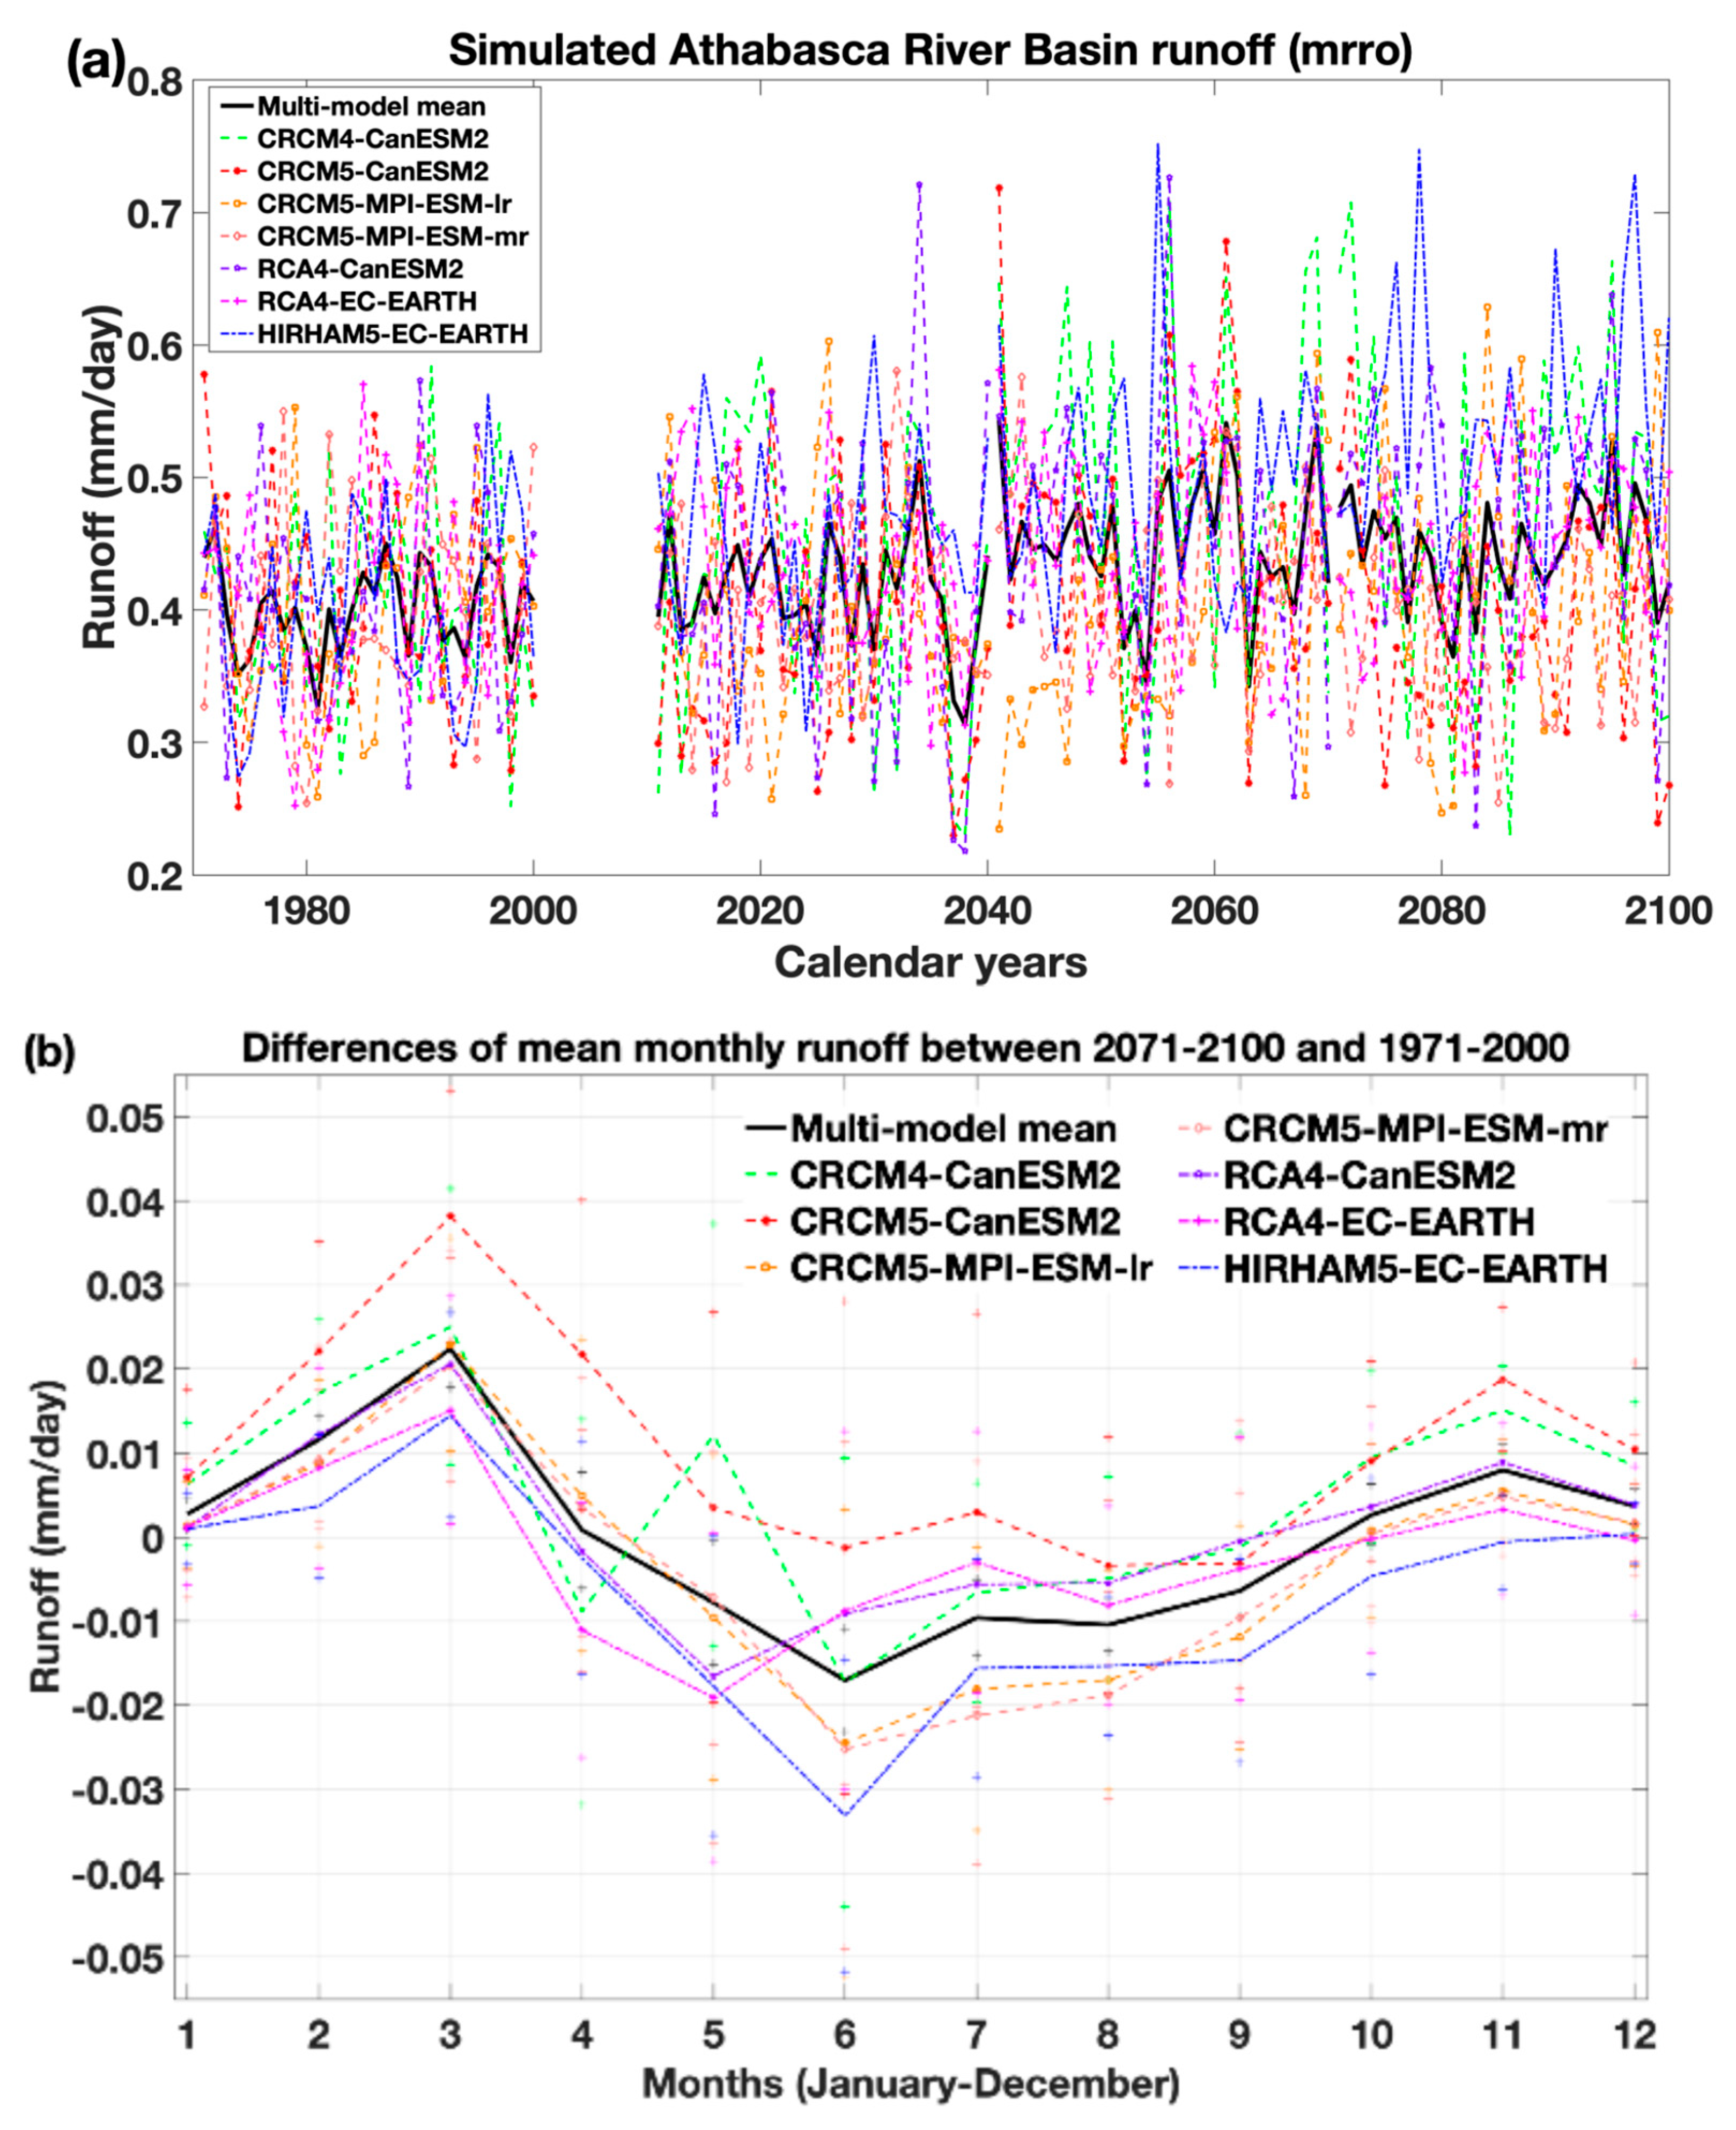
How these changes in temperature and precipitation are reflected by the total runoff (mrro), averaged over the entire river basin, is shown in Figure 5a. In a similar fashion to annual precipitation, multi-model mean annual runoff levels increase by 10% by the end of the 21st century under RCP8.5—all RCMs including the multi-model mean become statistically significant as assessed by t-tests in the second half of the century with the exception of the CRCM5 model runs (Table 3 and Table S4)—which at first suggests that the RCMs show that surface water availability may not become an issue in the future. However, closer examination of the monthly distribution of runoff changes during the 2071–2100 period (Figure 5b) shows that all models project a decrease in summer runoff levels. There is increased projected runoff for November through March, with the increase in runoff peaking during the early spring, in March. There also is increased inter-model uncertainty post 2040. Similarly to precipitation, there is some increase in runoff variance, but only two models, CRCM4-CanESM2 and C RCM5-MPI-ESM-lr, show that this increase is statistically significant as assessed by F-tests (Table 3 and Table S4).

3.3. Projected Drought Potential Indices Under RCP8.5

This hydroclimate picture is further clarified by examining the two aridity indices, the CMI and SPEI. The drought index CMI, which essentially measures the difference between accumulated precipitation on the ground and potential evapotranspiration (hence the moisture content of the atmosphere) shows a decreasing trend during the 21st century, that becomes by 2071–2100 statistically significant declines in the multi-model mean (a decline of −0.7 cm) and all models except RCA4-CanESM2 (Figure 6a, Table 4 and Table S6) as assessed by t-tests (for comparison, the total range of annual CMI values is 3.4 cm to −3.6 cm for the individual RCMs). This indicates a decline in effective moisture and a shift towards drier conditions, and it is projected to occur despite increased annual precipitation and annual runoff. Inter-model uncertainty increases throughout the 21st century. (Figure 6a). There is some discrepancy between the different models, as one model (RCA4-EC-Earth) actually produces a statistically significant increase in CMI, while another (RCA4-CanESM2) has a non-significant increase. As shown by the monthly distribution of CMI changes during the 2071–2100 time slice relative to the simulated historical period 1971–2000 (Figure 6b), the summer months of July and August, and in early autumn, September, exhibit by far the lowest values of monthly CMI, likely a result of severely increased summer temperatures and accompanying increased evapotranspiration.
This drying projection is further supported by the SPEI (Figure 7). The RCM-modelled SPEI captures the variability of the historical simulated period (1971–2000) well within a range of +1.4 to −1.5 with all the models considered. For comparison, the observed SPEI range calculated with instrumental data is +1.4 to −1.2. This close agreement between simulated and observed SPEI gives confidence that the RCMs are capturing moisture deficits and surpluses well in the ARB. However, the range of SPEI values for 2071–2100 is much wider: +1.5 to −3.5, projecting the occurrence of extreme annual drought. Given that each SPEI increment represents an anomaly equivalent to one standard deviation, anything below −1.28 can be considered severe [56]. The generally negative projected values of SPEI intensify as the 21st century progresses, thereby indicating an increased risk of water shortages under the RCP8.5 climate scenario. Furthermore, the SPEI shows a statistically significant multi-model mean decrease of −0.8, supported by five of the seven RCMs, for 2071–2100 relative to 1971–2000 as assessed by t-tests (Table 4 and Table S6). The exceptions are RCA4-EC-Earth, which shows a significant increase, and RCA4-CanESM2 shows a non-significant increase. Again, inter-model uncertainty increases throughout the 21st century (Figure 7).

3.4. Projected RCP 4.5 Results

Climate scenario RCP 4.5 assumes some level of climate change mitigation, allowing greenhouse gas emissions to peak around 2040 and then decline. Therefore, it produces results that are not as extreme as those from the business-as-usual RCP 8.5 scenario. Nevertheless, it still produces an all-around significant warming which exceeds 4 °C before the end of the century. Precipitation and runoff behave similarly to what they do under scenario RCP8.5. However, due to the smaller increase in temperatures, the CMI does not statistically decrease during the 21st century. The multi-model mean SPEI displays a significant decrease of approximately −0.2 by the end of the century.

4. Discussion

4.1. Main Conclusions of These Results

The main conclusions of our RCM-based modelling study of ARB runoff and drought indices is that the basin will be under a severe drying threat that by the end of the 21st century will challenge the maintenance of industrial and agricultural activities and ecosystems. This is demonstrated by the projected annually-averaged declines in the CMI and SPEI, and the declines in runoff and the CMI in the summer months and early autumn, all in the context of substantially warming temperatures throughout the year (Figure 3, Figure 4, Figure 5, Figure 6 and Figure 7; Table 3 and Table 4). Our RCM-based study shows that although there are projections of increasing annual precipitation and annual runoff (Figure 4 and Figure 5a), the increasing temperature, including summer temperature (Figure 3), will lead to increasing warm season evapotranspiration, which will dominate the annual humidity increases during the summer, resulting in decreasing summer runoff (Figure 5b) and increasing aridity as shown by declines in the summer CMI and SPEI (Figure 6 and Figure 7). Contrary to present-day hydrology in which challenging low flows to the oil sands extraction and processing industry occur in winter months in the Athabasca River, by century’s end, we find that it will be the later summer months that will be challenging because of the increasing aridity [5,26,39,40]. Furthermore, the increased annual precipitation will occur in winter and spring, and not in the summer when it is needed most for ecosystem services and agriculture (Figure 4). The growing water stress on aquatic ecosystems and agriculture will be compounded by the fact snowmelt, peak runoff, and the spring freshet will occur earlier in the year (Figure 5, [42,43]), and hence there will be less water in the Athabasca River in the later summer when it will be needed for ecosystem services and potential irrigation.

4.2. Comparison of Our Temperature Projections to Previous GCM-Based Research

Overall, the historical simulated data from the RCMs match the observed ANUSPLIN data better for temperature than for precipitation and runoff (Figure 2 and Table 2). As usual in RCMs, temperature is generally more accurately simulated by climate models than precipitation and its derivatives [19,24].
There is good agreement between the RCMs and GCMs about the expected temperature increase in the ARB. Our CORDEX-based multi-model mean temperature increase of 5.7 °C by end-of-century concords with the GCM-projected increases of Kerkhoven and Gan [39] (a range of 2–9 °C), Leong and Donner [26] (a range of 0.5–7 °C), and Dibike et al. [42] (a mean of 5.6 °C under RCP8.5) (Figure 3, Table 3). It is representative of the projected end-of-century temperatures in central Alberta of the full suite of 27 CORDEX RCMs under the RCP8.5 scenario of Bukovsky and Mearns [58] (who used different averaged time slices than our study does in their North American survey of CORDEX climate projections). Our study’s result that the greatest increase in temperature is projected to occur in winter was also found by Eum et al. [41] and Dibike et al. [42] using GCMs alone, and is consistent with many previous projections of North American temperature [58].

4.3. Comparison of Our Precipitation Projections to Previous GCM-Based Research

All of our RCM historical simulations have too much winter and spring precipitation compared to the observed ANUSPLIN data. The excess winter precipitation over mountainous regions such as the ARB headwaters is a known problem with CORDEX runs [25].
Importantly, the RCM runs project a wetter end-of-century than the GCMs do in the ARB. For the ARB, we project an increase in multi-model mean precipitation of 22% by 2071–2100 under RCP8.5, with all RCMs projecting increases (Figure 4, Table 3). This is more precipitation than the statistically downscaled GCM runs project by end-of-century: Kerkhoven and Gan [39] project changing precipitation ranging between (−5% to 19%), Leong and Donner [26] project a maximum increase of 12% under RCP8.5, and Dibeke et al. [42] project a multi-model mean increased precipitation of 14% under RCP8.5. Our study’s increased precipitation for the ARB is consistent with the increased mean annual precipitation in all the CORDEX members [58]. Here there is a definite difference between the RCMs and GCMs.
Our study’s result that the greatest projected increase in precipitation is in spring, with a lesser increase in winter, and either decreases or the least of increases in July and August was also found by Eum et al. [41] and Dibike et al. [42]. The CORDEX RCMs of Bukovsky and Mearns [58] show a more inconsistent set of either decreased or slightly increased end-of-century precipitation projections in the ARB region than our RCM set, which however consists of CORDEX RCMs which predict drier summers.

4.4. Comparison of Our Runoff Projections to Previous GCM-Based Research

This RCM-based study shows a 10% increase in multi-model mean annual runoff, but it is weak with two of the seven models showing slight non-significant declines. In the RCM runs, the proportionally greater increase in temperature versus that of precipitation increases evapotranspiration, which diminishes the impact of the increase in precipitation with respect to runoff (note that we are using instantaneous runoff in our study, and the next step of running RCM runoff through a hydrological model should be done in the future). Similar to us, Dibike et al. [43] projected an increase of 15.0% to 16.3% in mean annual river discharge in the ARB.
In contrast, most of Kerkhoven and Gan’s [39] GCM-MISBA runs projected decreases in SWE, and average, maximum, and minimum flows in the ARB over the next 100 years, which does match with our drying trends in CMI and SPEI. They found in their projections that all GCM scenarios led to decreased streamflow by the end of the 21st century, and that two-thirds of the scenarios projected streamflow to decline by over 20%. Their declines in SWE are due to increases in winter temperatures that result in less snow accumulation and increased evaporation loss, which offsets projected increases in precipitation, which explains what we also see in the RCMs. Leong and Donner [26] had uncertain results by end-of-century under RCP8.5, as their hydrological model driven by two GCMs projected annual streamflow decreases of 10% and 12%, whereas their hydrological model driven by a third GCM projected increases by 53%. Hence, whether or not Athabasca River mean annual discharge will increase or decrease by the end of the century remains uncertain, with GCM-based studies having a small tendency to project decreased discharges versus this RCM-based study projecting increased runoff.
Relatedly, Dibike et al. [42] projected decreasing trends in annual maximum SWE and mean monthly SWEs over the ARB, with the largest decreases occurring in March and April, together with a decrease in snow cover duration of up to 50 days in the headwaters. Shresthra et al. [59] (2021) also found a moderate decrease in SWE for the ARB region in their large ensemble (50 runs) study using the Canadian Regional Climate Model (CanRCM4-LE).
All model simulations, both RCM- and GCM-based, flag that the major water management challenges in the ARB will lie in the changes in the seasonality of low flows and in summer drying. Kerkhoven and Gan [39] predict that the snowmelt freshets will occur ~10–15 days earlier than during the historical baseline. All their runs predict significant declines in flows from June through November. Leong and Donner [26,40] project that the timing of spring runoff will advance by roughly a month and shorten the persistence of late-season flow in the Athabasca River by midcentury. By century’s end, there will be an increase in streamflow in the first half of the year (i.e., winter) and a decrease in the second half of the year (i.e., summer). Leong and Donner [26,40] also observe that the lowest flows in the ARB will switch from present-day winter low flows to summer low flows. Presently, the current winter low flows cause problems to water-intensive oil sands production due to water shortages, necessitating shut-downs or reservoir construction [26,40]. They state that this problematic water shortage season in oil sands production will shift to summer, when ecosystem services and potential irrigation for agriculture will be competing for this scarce water. Dibike et al. [43] found a shift to an earlier Athabasca River spring freshet and projected discharge increases during the winter and spring, and decreases during the summer and early fall. All these GCM-based results are confirmed and strengthened by what we have found with RCMs with monthly runoff shifting to earlier in spring and both monthly runoff and monthly CMI declining in summer (Figure 5b and Figure 6b).
This shift to an earlier spring peak freshet is not only applicable to the ARB. It has already been detected in instrumental stream gauge data in southern and central Alberta (e.g., [45,60]). As well, the shift to an earlier spring peak has been projected to occur by mid-21st century in the South Saskatchewan River Basin of southern Alberta by St-Jacques et al. [50] using nine NARCCAP RCMs.
There are issues in how ARB total runoff mrro is modelled by the RCMs. First, since every RCM in our study overestimates winter (snow) precipitation in the historical simulated runs, this creates what appears to be a substantially larger than actual spring melt pulse (Figure 2). In particular, the models with higher winter precipitation result in larger meltwater pulses. This was slightly addressed by bias correction (Table S1). Secondly, using total runoff mrro as an estimate for seasonal river flows has issues. The very low historical simulated summer runoff of the four of the models (CRCM4-CanESM2, CRCM5-CanESM2, RCA4-CanESM2, and RCA4-EC-EARTH) that have much lower summer runoff than the actual summer low flows in the Athabasca River arises since the actual spring meltwater fills the river channel far more gradually than the RCMs show. This is because mrro runoff in the CORDEX RCMs is an instantaneous representation of moisture availability that does not take into account the time scales involved in river routing. Therefore, river discharge in the second half of the year is more important than suggested by the historical simulated runoff. This was well addressed by bias correction (Table S1). Additionally, the RCMs with the lowest late-summer simulated runoff, CRCM4-CanESM2 and CRCM5-CanESM2, are also those that overestimate actual summer temperature and hence evapotranspiration, hence the overestimated evapotranspiration will reduce summer total runoff mrro further in these simulations (Figure 2a).

4.5. Comparison of Our Aridity Index Projections to Previous GCM-Based Research

Because we were focused strictly on the ARB, we were able to optimize our choice of PET equation to one performing well on the Canadian Prairies. The modified version of the Penman–Monteith equation that we used for PET in our calculation of CMI and SPEI was developed by Hogg [54] to be locally well-adapted here. His CMI has excellent explanatory power in defining the distinct vegetation zones of this region, which are controlled by chronic moisture deficits: prairie, aspen parkland, and boreal forest, which justifies our use of it. Wang et al. [61] used four CMIP3 GCMs to project standardized CMI and Palmer’s Drought Severity Index (PDSI) for boreal Canada under SRES B1, A1B, and A2. They found an uncertain drying trend in the western boreal plains, including the ARB region, whereas we found a certain drying trend using the CMI and the most recent RCMs. They suggest that the CMI is a useful metric in the boreal forest (which includes the ARB) for estimating future changes in forest distribution and productivity, and therefore a useful tool for sustainable forest management practices in the changing climate.
Tam et al. [57] used biased-corrected temperature and precipitation projections from 29 CMIP5 GCMs under the RCP2.6, 4.5 and 8.5 scenarios to infer future seasonal and annual SPEI for the 21st century across Canada. Their multi-model median showed declines of annual SPEI of between −0.5 to −1.1 for the ARB under RCP8.5 for 2081–2100, which accords well with our CORDEX RCM results (Table 4). Their annual declines were driven by declines in summer and autumn SPEI, which were not sufficiently compensated by winter wetting, which matches what we found using monthly CMI (Figure 6b). Eum et al. [62] used MBCDS biased-corrected temperature and precipitation projections from 12 CMIP6 GCMs and four emissions scenarios to infer future seasonal and annual SPEI for the 21st century in Alberta and found projected declines. Thiombiano et al. [44] also found drying in summer and annual SPEI in the Alberta oil sands region using GCM runs. They did not bias-correct temperature and precipitation in their calculations.
Spinoni et al. [63] used 103 (0.44°-resolution) CORDEX runs to project annual SPEI-12 at global and broad macroregional scales for the 21st century under the RCP4.5 and 8.5 scenarios. Unlike us, they did not bias-correct their temperature and precipitation inputs. Their work is also quite different from ours since for PET they used the Hargreaves–Samani equation because they needed an equation that gave reasonable results globally, as opposed to our making a choice optimized for the ARB. As well, we had more runs for the ARB than Spinoni et al. [63] (14 versus 11), three at higher resolution (0.22°), and seven of our runs were distinct from theirs. All this explains our different results from theirs. We found a distinct drying trend in SPEI for the ARB, whereas they found the ARB to be an uncertain area where their RCM runs did not agree on the SPEI trend.

4.6. Comparison to Instrumental and Paleodata

Water management in the ARB is based upon the limited instrumental data of ~70 years and makes a strong stationarity assumption that these flows capture the expected variability of the river [5,26,40]. Our study, using RCMs, concurs with Leong and Donner [26,40], who concluded that this assumption is unwise for the future. The tree-ring study of Sauchyn et al. [4] provides additional evidence that this strong stationarity assumption in ARB water management is unwise. They reconstructed Athabasca River flows for the past 900 years, finding periods of sustained Athabasca low flows of multiple decades duration in the 1890s, 1790s, the entire 14th century and last half of the 12th century. Hence, a longer period of record shows that the projected much drier ARB at the century’s end is not unprecedented in the last millennium, and that assuming the recorded Athabasca flows since ~1950 are representative of future flow is not realistic.
These sustained low-flow periods in the tree-ring-based Athabasca River reconstruction of Sauchyn et al. [4] suggest the mechanistic influence of the Pacific Decadal Oscillation (PDO) and Pacific North American (PNA) teleconnections whose spectra have multi-decadal power [64,65]. Multi-decadal atmosphere-ocean cycles such as the PDO are known to have a major impact on the hydroclimatology of the Canadian Western interior [4,66,67,68]. Projected trends in PDO phases are unclear under global warming [69,70]. Our study did not specifically examine PDO projections, but they are contained within our ARB hydroclimate projections as they are inherited from the driving GCMs. Subsequent shifts in the PDO’s state could worsen or alleviate the ARB’s projected aridity. The PDO’s future state adds uncertainty to the quantification of the drying of the ARB’s hydroclimate in a future period, but not to its overall occurrence.

4.7. Q-Q Mapping Bias Correction

Our approach of using CORDEX RCM data with bias correction has an important advantage over the conventional use of hydrological models driven by RCM or GCM data in climate impact assessment using the ‘delta’ method [11]. The delta-method applies monthly changes from GCM data to observed climate data (typically from the most recent 30-year climate normal period), and hence cannot examine projected changes in climate variability given this strong stationarity assumption [71]. Hence, using simulated climate and runoff variables with Q-Q mapping bias correction directly from the RCMs allows us to capture the changes in variability projected by the climate models. This worked quite well for temperature and precipitation, though less well for runoff, which still had some skill (Table S1). Future changes in climate variability may be as challenging in water management as changes in climate variable means.

4.8. Summary and Future Work

In summary, in the ARB, our RCM-based study projects more precipitation end-of-century than the GCM-based studies have, which will lead to increased runoff. However, even this increased projected moisture will not be sufficient to overcome the increased evaporation from projected temperature increases, leading to increased drying and water stress. Both previous GCM-derived studies and our RCM-based study agree on the projected ARB drying trend, the shift to an earlier spring peak, and the seasonal shift in low flows from winter to late summer. The shared findings of previous researchers and ourselves lend credence to all of our results, with their expensive economic consequences, which will aid the planning and decision-making of water resource managers.
There are several avenues of future research which would improve projections of ARB hydroclimate. One would be to use CORDEX RCM runs or their successor RCMs’ runs to drive an up-to-date hydrological model to project Athabasca River discharge. Additionally, only the later generation CORDEX RCMs with a higher grid resolution of ~22 km or ~11 km should be used as they have less of a dry bias (we used five such runs) [25]. As well, there are convection-permitting RCMs (CP-RCMs) currently under development that can model small-scale (~4 km) convective processes (which are important in summer in the Prairie Provinces), and not just mesoscale convective processes [19]. These should be considered for future modelling in the ARB as they become available. The RCM output used employed static land cover and land use distributions [19]; future research could explore making these dynamic. More advanced bias correction models than univariate Q-Q mapping should be explored, such as those that handle the interdependence of hydrological variables (i.e., [72]). Lastly, the amplification of wildfire activity in the boreal forest from global warming may lead to significant changes in regional hydrology which could be modelled.

5. Conclusions

In our study, we present an RCM-based examination of projected changes in ARB hydroclimatology (temperature, precipitation, runoff, and two drought indices: the CMI and SPEI). Our results project that the Athabasca River Basin, despite being to the north of semiarid southern Alberta, will also suffer from elevated drought concerns in the warmer world resulting from human activities. The projected average 6 °C increase in temperature is so large that it substantially increases the potential evapotranspiration in the summer months to higher levels than will compensated for by the projected 22% rise in precipitation. Both the CMI and SPEI project significantly increasing aridity in the ARB. Our result that the lowest values in runoff and CMI are projected to occur in the summer months when water demand is at its highest signals a need to further improve future ARB water management.

Supplementary Materials

The following supporting information can be downloaded at: https://www.mdpi.com/article/10.3390/cli13090198/s1, Table S1: Results of assessment of efficacy of bias correction; Table S2: Results of statistical tests for RCP8.5 projected runs for temperature (°C) for each RCM-GCM pair; Table S3: Results of statistical tests for RCP8.5 projected runs for precipitation (mm/day) for each RCM-GCM pair; Table S4: Results of statistical tests for RCP8.5 projected runs for runoff (mm/day) for each RCM-GCM pair; Table S5: Results of statistical tests for RCP8.5 projected runs for CMI (cm) for each RCM-GCM pair; Table S6: Results of statistical tests for RCP8.5 projected runs for SPEI for each RCM-GCM pair.

Author Contributions

M.-O.B.: investigation, roles/writing—original draft; J.-M.S.-J.: conceptualization, funding acquisition, methodology, project administration, resources, software, supervision, validation, roles/writing—original draft, and writing—review and editing; Y.A.: software; S.G.: software; A.V.P.: data curation, software, writing—review and editing; D.S.: conceptualization, funding acquisition. All authors have read and agreed to the published version of the manuscript.

Funding

This project was funded by a Natural Sciences and Engineering Research Council of Canada Collaborative Research and Development Grant CRDPJ 501858-16 to D. Sauchyn (PI) and J.M. St-Jacques.

Data Availability Statement

All datasets used are available from public repositories and sources mentioned in Regional Setting, Materials and Methods Section 2.

Acknowledgments

We thank the support of our industrial partner, Alberta WaterSMART. We also thank Damon Matthews for helpful discussions. Lastly, we thank three anonymous reviewers whose generous efforts greatly improved this manuscript.

Conflicts of Interest

The authors declare no conflicts of interest. Even though this study was funded by an NSERC Collaborative Research and Development Grant, the industrial partners had no role in the design of the study; in the collection, analyses, or interpretation of data; in the writing of the manuscript; or in the decision to publish the results.

References

  1. Schindler, D.W.; Donahue, W.F. An impending water crisis in Canada’s western prairie provinces. Proc. Natl. Acad. Sci. USA 2006, 103, 7210–7216. [Google Scholar] [CrossRef] [PubMed]
  2. Statistics Canada. Available online: https://www150.statcan.gc.ca/n1/pub/11-402-x/2011000/chap/ener/ener02-eng.htm (accessed on 1 August 2019).
  3. Lima, A.C.; Wrona, F.J. Multiple threats and stressors to the Athabasca River Basin: What do we know so far? Sci. Total Environ. 2019, 649, 640–651. [Google Scholar] [CrossRef]
  4. Sauchyn, D.J.; St.-Jacques, J.M.; Luckman, B.H. Long-term reliability of the Athabasca River (Alberta, Canada) as the water source for oil sands mining. Proc. Natl. Acad. Sci. USA 2015, 112, 12621–12626. [Google Scholar] [CrossRef]
  5. Alberta Government. Lower Athabasca Region Surface Water Quantity Management Framework for the Lower Athabasca River. 2015. Available online: https://open.alberta.ca/dataset/f2ebc2f5-fe78-4dfe-be99-85d1d9fb6fe3/resource/d02751b1-c9e4-4e52-921d-72eda6497981/download/zz-6243941-2015-lower-athabasca-region-larp-surface-water-quantity-management-2015-02.pdf (accessed on 15 June 2019).
  6. Burn, D.H.; Sharif, M.; Zhang, K. Detection of trends in hydrological extremes for Canadian watersheds. Hydrol. Proc. 2010, 24, 1781–1790. [Google Scholar] [CrossRef]
  7. Rood, S.B.; Samuelson, G.M.; Weber, J.K.; Wyrot, K.A. Twentieth-century decline in streamflows from the hydrographic apex of North America. J. Hydrol. 2005, 306, 215–233. [Google Scholar] [CrossRef]
  8. Rood, S.B.; Pan, J.; Gill, K.M.; Franks, C.G.; Samuelson, G.M.; Shepherd, A. Declining summer flows of Rocky Mountain rivers: Changing seasonal hydrology and probable impacts on floodplain forests. J. Hydrol. 2008, 349, 397–410. [Google Scholar] [CrossRef]
  9. Zhang, L.; Dawes, W.R.; Walker, G.R. Response of mean annual evapotranspiration to vegetation changes at catchment scale. Water Resour. Res. 2001, 37, 701–708. [Google Scholar] [CrossRef]
  10. Forbes, K.A.; Kienzle, S.W.; Coburn, C.A.; Byrne, J.M. Simulating the hydrological response to predicted climate change on a watershed in southern Alberta, Canada. Clim. Change 2011, 105, 555–576. [Google Scholar] [CrossRef]
  11. Kienzle, S.W.; Nemeth, M.W.; Byrne, J.M.; MacDonald, R.J. Simulating the hydrological impacts of climate change in the upper North Saskatchewan River basin, Alberta, Canada. J. Hydrol. 2012, 412, 76–89. [Google Scholar] [CrossRef]
  12. Bonsal, B.; Shabbar, A. Impacts of large-scale circulation variability on low streamflows over Canada: A review. Can. Water Res. J. 2008, 33, 137–154. [Google Scholar] [CrossRef]
  13. Liu, J.; Stewart, R.E.; Szeto, K.K. Moisture transport and other hydrometeorological features associated with the severe 2000/01 drought over the western and central Canadian prairies. J. Clim. 2004, 17, 305–319. [Google Scholar] [CrossRef]
  14. Milly, P.C.D.; Betancourt, J.; Falkenmark, M.; Hirsch, R.M.; Kundzewicz, Z.W.; Lettenmaier, D.P.; Stouffer, R.J. Stationarity is dead: Whither water management? Science 2008, 319, 573–574. [Google Scholar] [CrossRef]
  15. Durack, P.J.; Wijffels, S.E.; Matear, R.J. Ocean salinities reveal strong global water cycle intensification during 1950 to 2000. Science 2012, 336, 455–458. [Google Scholar] [CrossRef] [PubMed]
  16. IPCC. Climate Change 2013: The Physical Science Basis. Contribution of Working Group I to the Fifth Assessment Report of the In-Tergovernmental Panel on Climate Change; Stocker, T.F., Qin, D., Plattner, G.K., Tignor, M., Allen, S.K., Boschung, J., Nauels, A., Xia, Y., Bex, V., Midgley, P.M., Eds.; Cambridge University Press: Cambridge, UK, 2013. [Google Scholar]
  17. Kharin, V.V.; Zwiers, F.W.; Zhang, X.; Hegert, G.C. Changes in temperature and precipitation extremes in the IPCC ensemble of global coupled model simulations. J. Clim. 2007, 20, 1419–1444. [Google Scholar] [CrossRef]
  18. Meehl, G.A.; Stocker, T.; Collins, W.; Friedlingstein, P.; Gaye, A.T.; Gregory, J.M.; Kitoh, A.; Knutti, R.; Murphy, J.M.; Noda, A.; et al. Global climate projections. In Climate Change 2007: The Physical Science Basis. Contribution of Working Group I to the Fourth Assessment Report of the Intergovernmental Panel on Climate Change; Qin, D., Manning, M., Chen, Z., Marquis, M., Averyt, K.B., Tignor, M., Miller, H.L., Solomon, S., Eds.; Cambridge University Press: Cambridge, UK, 2007. [Google Scholar]
  19. Giorgi, F. Thirty years of regional climate modeling: Where are we and where are we going next? J. Geophys. Res. Atmos. 2019, 124, 5696–5723. [Google Scholar] [CrossRef]
  20. Maraun, D.; Wetterhall, F.; Ireson, A.M.; Chandler, R.E.; Kendon, E.J.; Widmann, M.; Brienen, S.; Rust, H.W.; Sauter, T.; Themeßl, M.; et al. Precipitation downscaling under climate change: Recent developments to bridge the gap between dynamical models and the end user. Rev. Geophys. 2010, 48, RG3003. [Google Scholar] [CrossRef]
  21. Seager, R.; Vecchi, G. Greenhouse warming and the 21st century hydroclimate of southwestern North America. Proc. Natl. Acad. Sci. USA 2010, 107, 21277–21282. [Google Scholar] [CrossRef] [PubMed]
  22. Christensen, J.H.; Christensen, O.B. Climate modelling: Severe summertime flooding in Europe. Nature 2003, 421, 805–806. [Google Scholar] [CrossRef]
  23. Gutowski, W.J., Jr.; Ullrich, P.A.; Hall, A.; Leung, L.R.; O’Brien, T.A.; Patricola, C.M.; Arritt, R.W.; Bukovsky, M.S.; Calvin, K.V.; Feng, Z.; et al. The ongoing need for high-resolution regional climate models. Bull. Am. Meteorol. Soc. 2020, 101, E664–E683. [Google Scholar] [CrossRef]
  24. Mearns, L.O.; Arritt, R.; Biner, S.; Bukovsky, M.S.; McGinnis, S.; Sain, S.; Caya, D.; Correia, J., Jr.; Flory, D.; Gutowski, W.; et al. The North American Regional Climate Change Assessment Program, overview of phase 1 results. Bull. Am. Meteorol. Soc. 2012, 93, 1337–1362. [Google Scholar] [CrossRef]
  25. Meyer, J.D.D.; Wang, S.-Y.S.; Gillies, R.R.; Yoon, J.-H. Evaluating NA-CORDEX historical performance and future change of western U.S. precipitation patterns and modes of variability. Int. J. Climatol. 2021, 41, 4509–4532. [Google Scholar] [CrossRef]
  26. Leong, D.; Donner, S. Climate change impacts on streamflow availability for the Athabasca oil sands. Clim. Change 2015, 133, 651–663. [Google Scholar] [CrossRef]
  27. Raddatz, R.L.; Hanesiak, J. Significant summer rainfall in the Canadian Prairie Provinces: Modes and mechanisms 2000–2004. Int. J. Climatol. 2008, 28, 1607–1613. [Google Scholar] [CrossRef]
  28. Lin, Y.; Dong, W.; Zhang, M.; Xie, Y.; Xue, W.; Huang, J.; Luo, Y. Causes of model dry and warm bias over central U.S. and impact on climate projections. Nat. Commun. 2017, 8, 881. [Google Scholar] [CrossRef]
  29. Bukovsky, M.S.; McCrary, R.R.; Seth, A.; Mearns, L.O. A mechanistically credible, poleward shift in warm-season precipitation projected for the U.S. southern Great Plains? J. Clim. 2017, 30, 8275–8298. [Google Scholar] [CrossRef]
  30. García-Díez, M.; Fernández, J.; Fita, L.; Yagüe, C. Seasonal dependence of WRF model biases and sensitivity to PBL schemes over Europe. Q. J. R. Meteorol. Soc. 2013, 139, 501–514. [Google Scholar] [CrossRef]
  31. Walton, D.B.; Hall, A.; Berg, N.; Schwartz, M.; Sun, F. Incorporating snow albedo feedback into downscaled temperature and snow cover projections for California’s Sierra Nevada. J. Clim. 2017, 30, 1417–1438. [Google Scholar] [CrossRef]
  32. Minder, J.R.; Letcher, T.W.; Skiles, S.M. An evaluation of high-resolution regional climate model simulations of snow cover and albedo over the Rocky Mountains, with implications for the simulated snow-albedo feedback. J. Geophys. Res. Atmos. 2016, 121, 9069–9088. [Google Scholar] [CrossRef]
  33. Pollock, E.W.; Bush, A.B.G. Changes in snow mass balance in the Canadian Rocky mountains caused by CO2 rise: Regional atmosphere model results. Atmos.–Ocean 2013, 51, 505–521. [Google Scholar] [CrossRef]
  34. Giorgi, F.; Torma, C.; Coppola, E.; Ban, N.; Schär, C.; Somot, S. Enhanced summer convective rainfall at Alpine high elevations in response to climate warming. Nat. Geosci. 2016, 9, 584–589. [Google Scholar] [CrossRef]
  35. Vishnu, S.; Francis, P.A. Evaluation of high-resolution WRF model simulations of surface wind over the west coast of India. Atmos. Ocean. Sci. Lett. 2014, 7, 458–463. [Google Scholar] [CrossRef]
  36. Wright, D.M.; Posselt, D.J.; Steiner, A.L. Sensitivity of lake-effect snowfall to lake ice cover and temperature in the great lakes region. Mon. Weather. Rev. 2013, 141, 670–689. [Google Scholar] [CrossRef]
  37. Giorgi, F.; Jones, C.; Asrar, G.R. Addressing climate information needs at the regional level: The CORDEX framework. World Meteorol. Organ. Bull. 2009, 58, 175. [Google Scholar]
  38. Mearns, L.O.; Bukovsky, M.; Coppola, E.; Christensen, J.; Paquin, D.; Giorgi, P. Regional climate modeling in North America and Europe: Why such different paths? In Proceedings of the AGU Fall Meeting 2023, San Francisco, CA, USA, 11–15 December 2023. [Google Scholar]
  39. Kherkoven, E.; Yew Gan, T. Differences and sensitivities in potential hydrologic impact of climate change to regional-scale Athabasca and Fraser River basins of the leeward and windward sides of the Canadian Rocky Mountains respectively. Clim. Change 2011, 106, 583–607. [Google Scholar] [CrossRef]
  40. Leong, D.; Donner, S. Future water supply and demand management options in the Athabasca oil sands. River Res. Appl. 2016, 32, 1853–1861. [Google Scholar] [CrossRef]
  41. Eum, H.-I.; Dibike, Y.; Prowse, T.D. Climate-induced alteration of hydrologic indicators in the Athabasca River basin, Alberta, Canada. J. Hydrol. 2017, 544, 327–342. [Google Scholar] [CrossRef]
  42. Dibike, Y.; Eum, H.-I.; Prowse, T. Modelling the Athabasca watershed snow response to a changing climate. J. Hydrol. Reg. Stud. 2018, 15, 134–148. [Google Scholar] [CrossRef]
  43. Dibike, Y.; Eum, H.-I.; Coulibaly, P.; Hartmann, J. Projected changes in the frequency of peak flows along the Athabasca River: Sensitivity of results to statistical methods of analysis. Climate 2019, 7, 88. [Google Scholar] [CrossRef]
  44. Thiombiano, A.; Pietroniro, A.; Stadnyk, T.; Eum, H.; Farjad, B.; Gupta, A.; Bonsal, B. Temporal assessment of GCM-driven hydroclimatic conditions for the Alberta oil sands region, Canada. J. Hydrometeorol. 2024, 25, 105–123. [Google Scholar] [CrossRef]
  45. Burn, D.H.; Abdul Aziz, O.I.; Pietroniro, A. A comparison of trends in hydrological variables for two watersheds in the Mackenzie River Basin. Can. Water Res. J. 2004, 29, 283–298. [Google Scholar] [CrossRef]
  46. Kherkoven, E.; Yew Gan, T. A modified ISBA surface scheme for modeling the hydrology of Athabasca River Basin with GCM-scale data. Adv. Water Res. 2006, 29, 808–826. [Google Scholar] [CrossRef]
  47. Longley, R.; Janz, B. The Climatology of the Alberta Oil Sands Environmental Research Program Study Area; AOSERP Project ME 1.0; Alberta Oil Sands Environmental Research Program: Edmonton, AB, Canada, 1978. [Google Scholar]
  48. Water Survey of Canada. Government of Canada. Available online: https://wateroffice.ec.gc.ca/ (accessed on 1 January 2018).
  49. McKenney, D.W.; Hutchinson, M.F.; Papadopol, P.; Lawrence, K.; Pedlar, J.; Campbell, K.; Milewska, E.; Hopkinson, R.F.; Price, D.; Owen, T. Customized spatial climate models for North America. Bull. Am. Meteorol. Soc. 2011, 92, 1611–1622. [Google Scholar] [CrossRef]
  50. St.-Jacques, J.-M.; Andreichuk, Y.; Sauchyn, D.J.; Barrow, E. Projecting Canadian prairie runoff for 2041-2070 with North American Regional Climate Change Assessment Program (NARCCAP) data. J. Am. Water Resour. Assoc. 2018, 54, 660–675. [Google Scholar] [CrossRef]
  51. Chen, J.; Brissette, F.P.; Chaumont, D.; Braun, M. Finding appropriate bias correction methods in downscaling precipitation for hydrologic impact studies over North America. Water Resour. Res. 2013, 49, 4187–4205. [Google Scholar] [CrossRef]
  52. Boé, J.; Terray, L.; Habets, F.; Martin, E. Statistical and dynamical downscaling of the Seine basin climate for hydro-meteorological studies. Int. J. Climatol. 2007, 27, 1643–1655. [Google Scholar] [CrossRef]
  53. Teutschbein, C.; Seibert, J. Bias correction of regional climate model simulations for hydrological climate-change impact studies: Review and evaluation of different methods. J. Hydrol. 2012, 456–457, 12–29. [Google Scholar] [CrossRef]
  54. Hogg, E.H. Temporal scaling of moisture and the forest-grassland boundary in western Canada. Agric. For. Meteorol. 1997, 84, 115–122. [Google Scholar] [CrossRef]
  55. Vicente-Serrano, S.M.; Begueria, S.; Lopez-Moreno, J.I. A multiscalar drought index sensitive to global warming: The standardized precipitation evapotranspiration index. J. Clim. 2010, 23, 1696–1718. [Google Scholar] [CrossRef]
  56. Dibike, Y.; Prowse, T.; Bonsal, B.; O’Neil, H. Implications of future climate on water availability in the western Canadian river basins. Int. J. Climatol. 2017, 37, 3247–3263. [Google Scholar] [CrossRef]
  57. Tam, B.Y.; Szeto, K.; Bonsal, B.; Flato, G.; Cannon, A.J.; Rong, R. CMIP5 drought projections in Canada based on the Standardized Precipitation Evapotranspiration Index. Can. Water Res. J. 2019, 44, 90–107. [Google Scholar] [CrossRef]
  58. Bukovsky, M.; Mearns, L.O. Regional climate change projections from NA-CORDEX and their relation to climate sensitivity. Clim. Change 2020, 162, 645–665. [Google Scholar] [CrossRef]
  59. Shrestha, R.R.; Bonsal, B.R.; Bonnyman, J.M.; Cannon, A.J.; Najafi, M.R. Heterogeneous snowpack response and snow drought occurrence across river basins of northwestern North America under 1.0 °C to 4.0 °C global warming. Clim. Change 2021, 164, 40. [Google Scholar] [CrossRef]
  60. Stewart, I.; Cayan, D.R.; Dettinger, M.D. Changes toward earlier streamflow timing across western North America. J. Clim. 2005, 18, 1136–1155. [Google Scholar] [CrossRef]
  61. Wang, Y.; Hogg, E.H.; Price, D.T.; Edwards, J.; Williamson, T. Past and projected future changes in moisture conditions in the Canadian boreal forest. For. Chron. 2014, 90, 678–691. [Google Scholar] [CrossRef]
  62. Eum, H.-I.; Fajard, B.; Tang, T.; Gupta, A. Potential changes in climate indices in Alberta under projected global warming of 1.5–5 °C. J. Hydrol. Reg. Stud. 2023, 47, 101390. [Google Scholar] [CrossRef]
  63. Spinoni, J.; Barbosa, P.; Bucchignani, E.; Cassano, J.; Cavazos, T.; Christensen, J.H.; Christensen, O.B.; Coppola, E.; Evans, J.; Geyer, B.; et al. Future global meteorological drought hot spots: A study based on CORDEX data. J. Clim. 2020, 33, 3635–3661. [Google Scholar] [CrossRef]
  64. Minobe, S. A 50–70 year climatic oscillation over the North Pacific and North America. Geophys. Res. Lett. 1997, 24, 683–686. [Google Scholar] [CrossRef]
  65. Trouet, V.; Taylor, A.H. Multi-century variability in the Pacific North American circulation pattern reconstructed from tree rings. Clim. Dyn. 2010, 35, 953–963. [Google Scholar] [CrossRef]
  66. St. Jacques, J.M.; Sauchyn, D.J.; Zhao, Y. Northern Rocky Mountain streamflow records: Global warming trends, human impacts or natural variability? Geophys. Res. Lett. 2010, 37, L06407. [Google Scholar] [CrossRef]
  67. St.-Jacques, J.M.; Lapp, S.L.; Zhao, Y.; Barrow, E.; Sauchyn, D.J. Twenty-first century northern Rocky Mountain river discharge scenarios under greenhouse forcing. Quat. Int. 2013, 310, 34–46. [Google Scholar] [CrossRef]
  68. St.-Jacques, J.M.; Huang, Y.A.; Zhao, Y.; Lapp, S.L.; Sauchyn, D.J. Detection and attribution of variability and trends in Canadian Prairie Provinces’ streamflow. Can. Water Res. J. 2014, 39, 270–284. [Google Scholar] [CrossRef]
  69. Lapp, S.L.; St. Jacques, J.M.; Barrow, E.M.; Sauchyn, D.J. GCM projections for the Pacific Decadal Oscillation under greenhouse forcing for the early 21st century. Int. J. Climatol. 2012, 32, 1423–1442. [Google Scholar] [CrossRef]
  70. Maloney, E.D.; Camargo, S.J.; Chang, E.; Colle, B.; Fu, R.; Geil, K.L.; Hu, Q.; Jiang, X.; Johnson, N.; Karnauskas, K.B.; et al. North American climate in CMIP5 experiments: Part III: Assessment of twenty-first-century projections. J. Clim. 2014, 27, 2230–2270. [Google Scholar] [CrossRef]
  71. MacDonald, R.J.; Byrne, J.M.; Kienzle, S.W.; Larson, R.P. Assessing the potential impacts of climate change on mountain snowpack in the St. Mary River watershed, Montana. J. Hydrometeorol. 2011, 12, 262–273. [Google Scholar] [CrossRef]
  72. Cannon, A. Multivariate quantile mapping bias correction: An N-dimensional probability density function transform for climate model simulations of multiple variables. Clim. Dyn. 2018, 50, 31–49. [Google Scholar] [CrossRef]
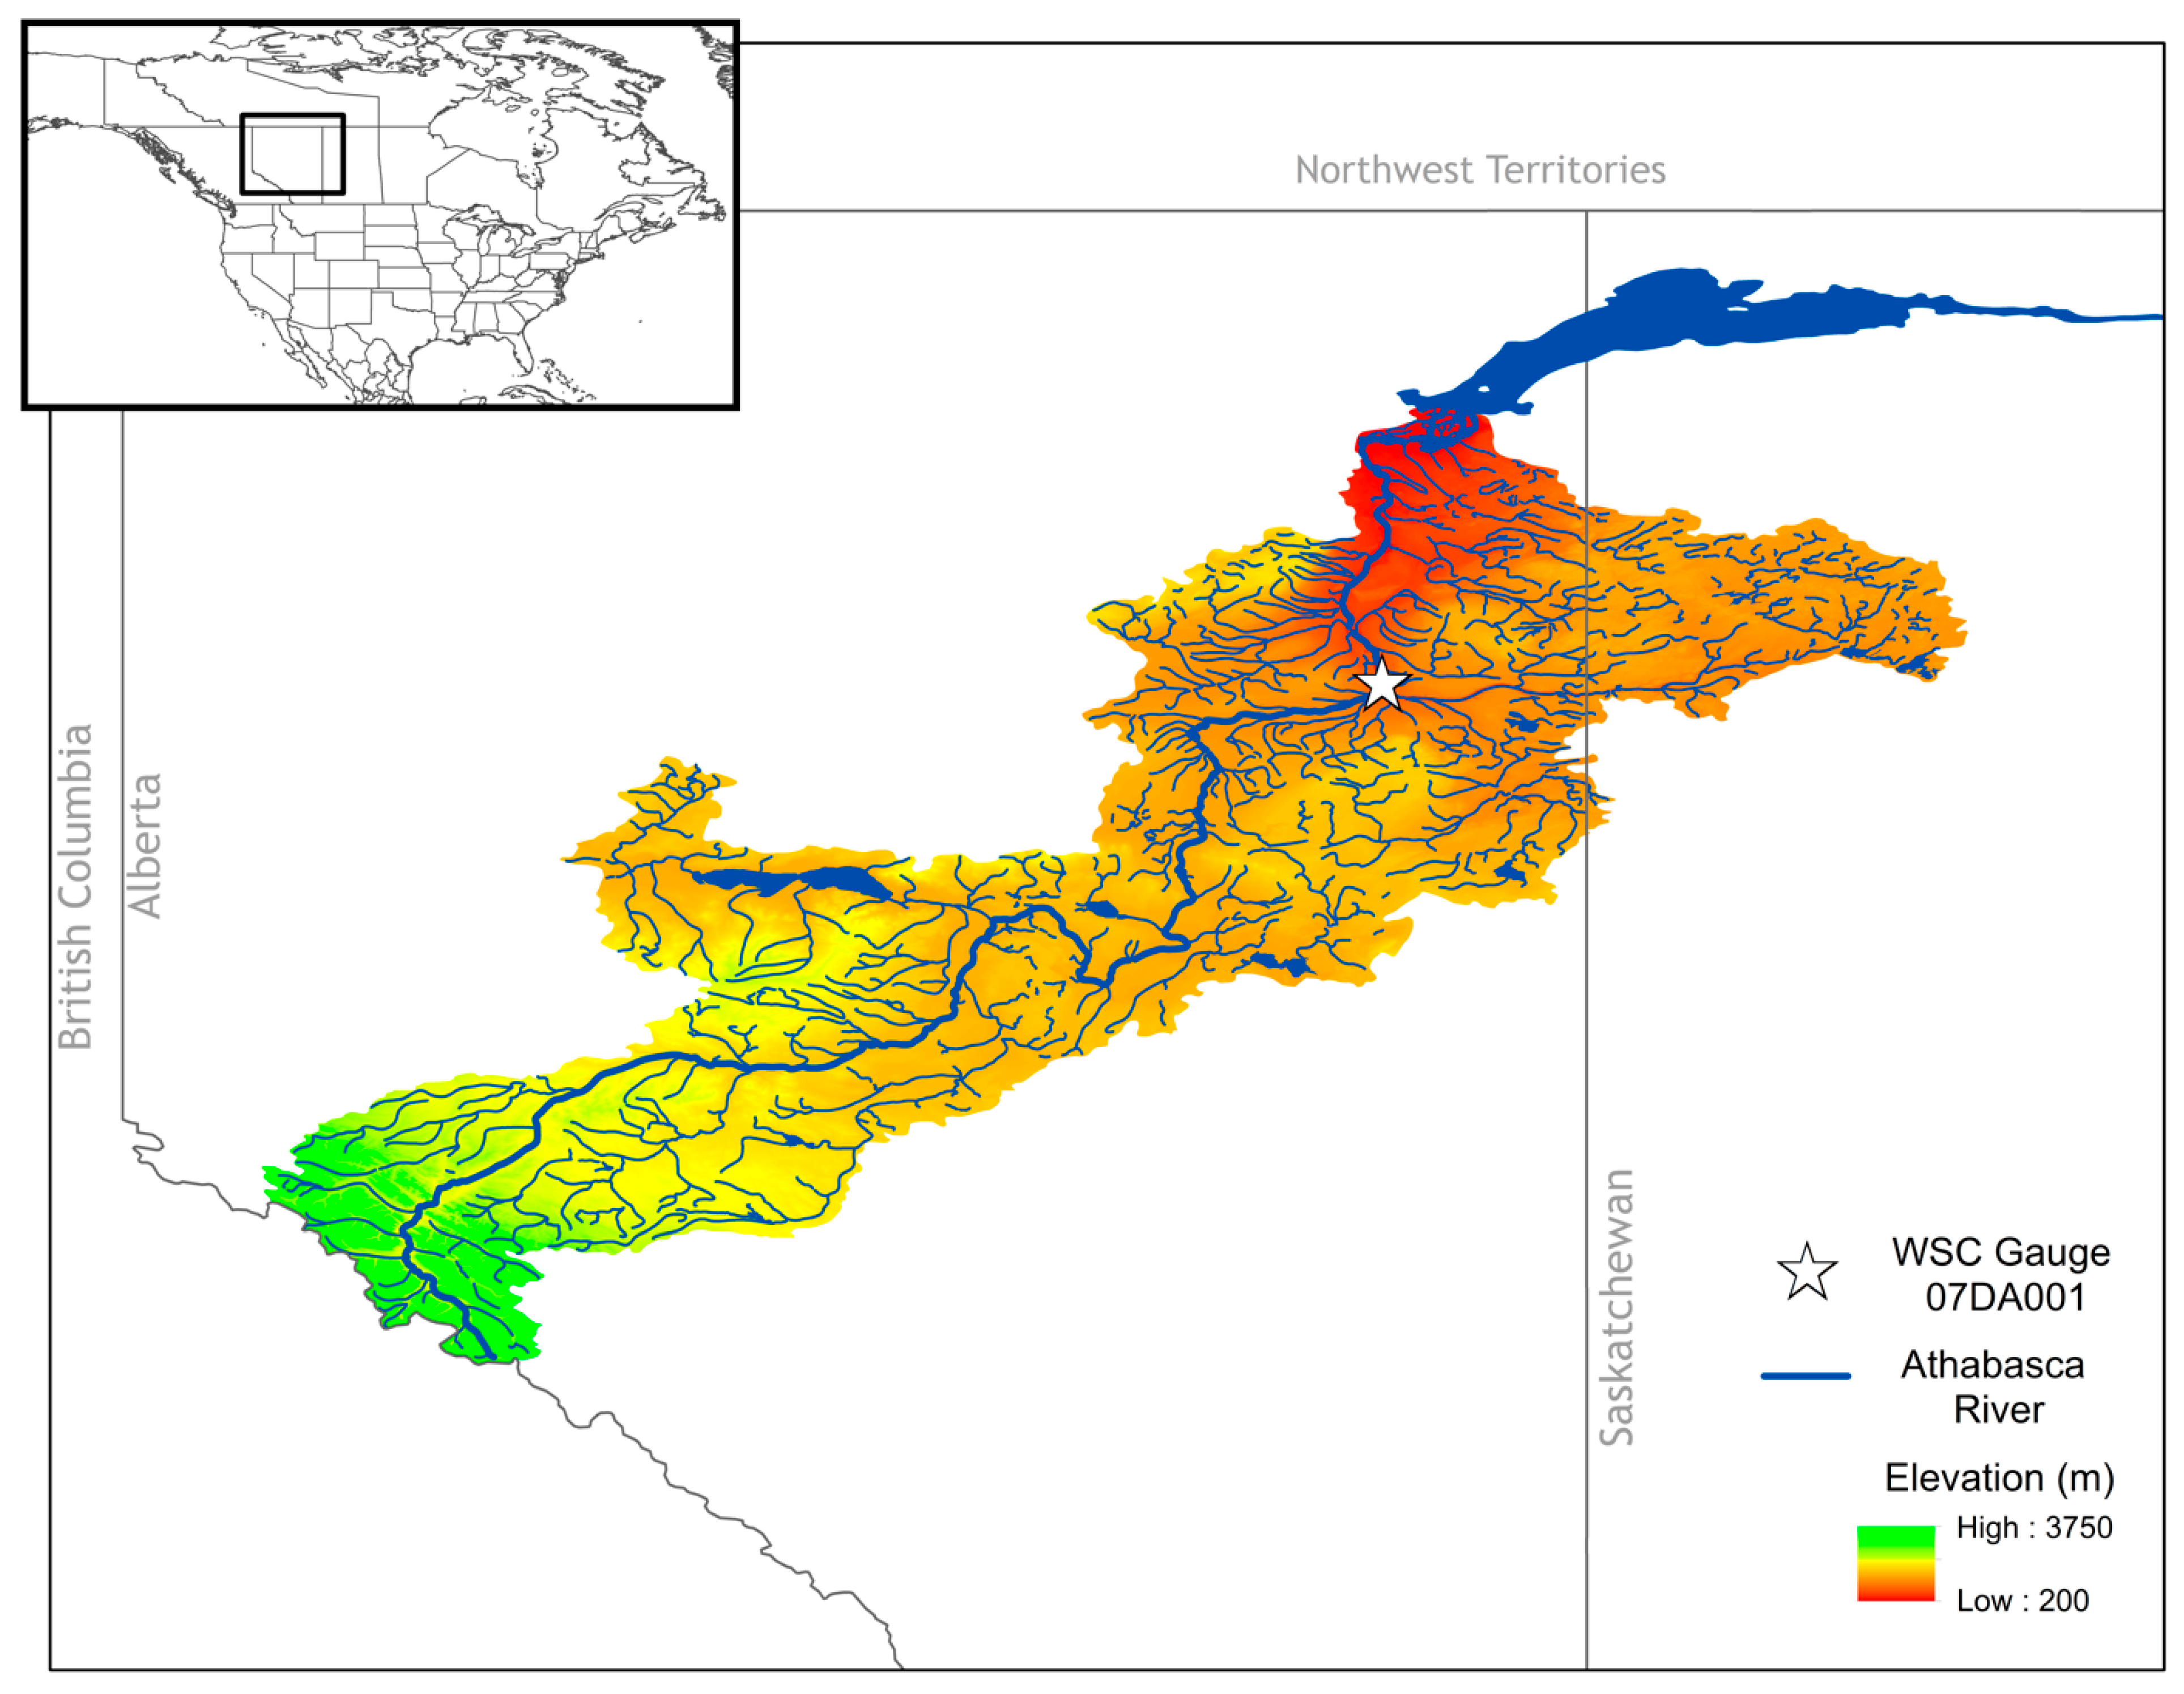
Figure 1. Map of Athabasca River Basin and its location within North America (upper left corner). The main stem of the Athabasca River is bolded, and Fort McMurray is indicated by a star (WSC gauge 07DA001) located just downstream of it.
Climate 13 00198 g001
Figure 2. Mean monthly averaged (a) temperature; (b) precipitation; and (c) runoff without bias correction over the Athabasca River Basin over historical period 1971–2000 for each CORDEX RCM/GCM pair and observed data.
Climate 13 00198 g002
Figure 3. (a) Yearly averaged temperature between 1971 and 2100 for the Athabasca River Basin under RCP8.5. (b) Differences between mean monthly temperature for 2071–2100 under RCP8.5 and modelled historical period 1971–2000. Multi-model means are shown in black. In (b), colored crosses show standard deviations.
Climate 13 00198 g003
Figure 4. (a) Yearly averaged precipitation between 1971 and 2100 for the Athabasca River Basin under RCP8.5. (b) Differences between mean monthly precipitation for 2071–2100 under RCP 8.5 and modelled historical period 1971–2000. Multi-model means are shown in black. In (b), colored crosses show standard deviations.
Climate 13 00198 g004
Figure 5. (a) Yearly averaged runoff (mrro) between 1971 and 2100 for Athabasca River Basin under RCP8.5. (b) Differences between mean monthly runoff for 2071–2100 under RCP8.5 and modelled historical period 1971–2000. Multi-model means are shown in black. In (b), colored crosses show the standard deviations.
Climate 13 00198 g005
Figure 6. Plot of climate moisture index (CMI) for the Athabasca River Basin: (a) yearly average CMI between 1971 and 2100 using RCP8.5 and (b) mean monthly differences of CMI between projected period 2071–2100 under RCP8.5 and modelled historical period 1971–2000. Also shown are multi-model means for every time slice (solid black) (a,b) and CMI calculated from historical observed (ANUSPLIN) data (dotted black, 1971–2000 only) (a). In (b), colored crosses show standard deviations.
Climate 13 00198 g006
Figure 7. Yearly averaged SPEI for 1970–2100 for the Athabasca River Basin under RCP8.5 scenario. Also shown are multi-model means for every time slice (solid black) and SPEI calculated from historical observed (ANUSPLIN) data (dotted black, 1971–2000 only).
Climate 13 00198 g007
Table 1. Combinations of GCMs and RCMs used in this study.
RCM
CRCM4CRCM5RCA4HIRHAM5Acronym for RCM-GCM Pair
G
C
M
CanESM2XXX CRCM4-CanESM2, CRCM5-CanESM2,
RCA4-CanESM2
MPI-ESM-lr X CRCM5-MPI-ESM-lr
MPI-ESM-mr X CRCM5-MPI-ESM-mr
EC-Earth XXRCA4-EC-EARTH, HIRHAM5-EC-EARTH
Notes: Names of RCMs: CRCM4 and 5, Canadian Regional Climate Model 4 and 5; RCA4, Rossby Centre Regional Atmospheric Climate Model 4; and HIRHAM 5, HIRHAM Regional Atmospheric Climate Model 5. Names of GCMs: CanESM2, Canadian Earth System Model 2; MPI-ESM-lr, Max Planck Institute Earth System Model (low resolution version); MPI-ESM-mr, Max Planck Institute Earth System Model (medium resolution version); EC-Earth, based on the operational seasonal forecast system of the European Centre for Medium-Range Weather Forecasts (ECMWF).
Table 2. Mean squared error (MSE) and correlation coefficient (R) for monthly temperature, precipitation, and runoff without bias correction from each CORDEX RCM/GCM pair compared to observed temperature, precipitation, and runoff over historical period 1971–2000.
RCM/GCMTemp
MSE
Temp
R
Precip
MSE
Precip
R
Runoff
MSE
Runoff
R
CRCM4-CanESM22.640.9910.1780.9820.1450.602
CRCM5-CanESM25.240.9920.1670.8440.1130.588
CRCM5-MPI-ESM-lr1.710.9980.2960.9650.1480.803
CRCM5-MPI-ESM-mr1.800.9970.3100.9810.1530.842
RCA4-CanESM24.540.9890.1730.8750.2330.483
RCA4-EC-EARTH12.390.9750.3120.8390.2910.422
HIRHAM5-EC-EARTH3.290.9930.3250.9280.3370.718
Table 3. Summary of t-test and F-test results for temperature, precipitation, and runoff under RCP8.5. Displayed here are difference in averages (avg. diff.), as well as ratio of variances (var. ratio) between projected period 2071–2100 and historical period 1971–2000. Also shown are standard deviations of historical period (σhist) and projected period (σproj) for variables. Significant values (p-value < 0.05) as assessed by t-tests for differences and F-tests for ratios are bolded. More detailed information is included in Tables S2–S4.
Model IDTemperature (°C)Precipitation (mm/day)Runoff (mm/day)
avg. diff.σhistσprojvar. ratioavg. diff.σhistσprojvar. ratioavg. diff.σhistσprojvar. ratio
CRCM4-CanESM26.540.981.051.160.310.140.222.240.100.080.124.59
CRCM5-CanESM26.010.980.910.860.040.180.201.30−0.030.080.080.68
CRCM5-MPI-ESM-lr5.151.020.880.740.170.120.213.060.010.080.101.52
CRCM5-MPI-ESM-mr4.901.261.080.730.140.170.160.89−0.010.080.061.08
RCA4-CanESM27.251.021.000.960.530.190.231.540.180.080.092.49
RCA4-EC-Earth6.021.011.141.280.570.200.201.020.070.080.071.12
HIRHAM5-EC-Earth4.161.141.411.520.250.170.211.500.070.070.091.56
Multi-model mean5.720.550.741.790.290.070.112.600.040.030.041.36
Table 4. Summary of RCM results for CMI and SPEI under RCP8.5. Displayed here are difference in averages (avg. diff.), as well as ratio of variances (var. ratio) between projected period 2071–2100 and historical period 1971–2000. Also shown are standard deviations of historical period (σhist) and projected period (σproj). Significant values (p-value < 0.05) as assessed by t-tests for differences and F-tests for ratios are bolded. More detailed information is included in Tables S5 and S6.
Model IDCMI (cm)SPEI
avg. diff.σhistσprojvar. ratioavg. diff.σhistσprojvar. ratio
CRCM4-CanESM2−1.180.711.243.00−1.150.590.781.78
CRCM5-CanESM2−1.960.741.072.07−1.800.550.591.14
CRCM5-MPI-ESM-lr−1.080.541.003.37−1.390.470.843.16
CRCM5-MPI-ESM-mr−1.070.740.720.92−1.060.560.601.08
RCA4-CanESM20.230.771.132.130.150.620.641.07
RCA4-EC-Earth0.610.920.730.630.470.640.530.68
HIRHAM5-EC-Earth−0.370.660.741.26−0.500.580.570.96
Multi-model mean−0.690.310.522.68−0.760.270.321.39
Disclaimer/Publisher’s Note: The statements, opinions and data contained in all publications are solely those of the individual author(s) and contributor(s) and not of MDPI and/or the editor(s). MDPI and/or the editor(s) disclaim responsibility for any injury to people or property resulting from any ideas, methods, instructions or products referred to in the content.