Abstract
Background: Understanding the perceptions of climate change among local populations is crucial for informing public awareness and supporting the development of evidence-based policies. The Entre Douro e Minho region in Northern Portugal faces significant climate challenges, yet comprehensive studies on local population perceptions remain limited. Objective: This study assessed public perceptions of climate change evolution among residents of the Entre Douro e Minho region, examining demographic and spatial influences on climate awareness and attribution beliefs. Methods: A cross-sectional survey was conducted between October 2024 and March 2025, targeting residents of the Porto, Braga, and Viana do Castelo districts. Statistical analysis employed descriptive statistics, Spearman correlations, and non-parametric tests with psychometrically validated instruments. Results: Among 1749 valid responses (82.0% response rate), residents demonstrated high levels of climate change awareness (mean = 3.87/5.0) and a large number attributed this to anthropogenic causes (mean = 3.82/5.0). Education emerged as the strongest demographic predictor of climate attribution beliefs (ρ = 0.279, p < 0.001, small to medium effect), while age showed a negative association (ρ = −0.255, p < 0.001). Spatial analysis revealed significant district-level variations, with Viana do Castelo consistently showing higher levels of climate awareness across all measures. Wildfires (77.4%) and heatwaves (70.6%) were the most prevalent perceptions of extreme weather, while reforestation and forest management (77.3%) emerged as the most preferred adaptation strategy. Conclusions: This study reveals high levels of climate change awareness, characterized by significant demographic and spatial heterogeneity. Educational attainment and generational differences create distinct perception profiles requiring targeted communication strategies. These findings provide an evidence base for developing age-differentiated climate education programs and geographically tailored adaptation policies in Northern Portugal and similar European contexts.
1. Introduction
Climate change is one of the most pressing issues of the 21st century, with profound impacts on environmental systems, human societies, and economies worldwide [1,2]. The scientific consensus on anthropogenic climate change is robust, with evidence indicating unprecedented rates of global warming, altered precipitation patterns, and an increase in extreme weather events [3,4]. However, turning scientific knowledge into public understanding and policy action is complex and heavily relies on how local communities perceive and interpret climate change signals in their surroundings [5,6].
Understanding public perceptions of climate change is crucial for effective climate governance and societal response for several interconnected reasons. First, public support for climate policies heavily depends on the perceived reality, urgency, and human-caused nature of climate change [7,8]. Without widespread public awareness of climate risks and their human origins, implementing policies faces significant social and political challenges [9]. Second, individual and collective responses to climate change are shaped by risk perceptions, self-efficacy beliefs, and outcome expectations, as outlined in social cognitive theory [10,11]. Effective behavior change strategies must therefore consider existing mental models, cultural values, and demographic factors that influence how people process climate information [12]. Third, community-based adaptation planning requires aligning scientific risk assessments with local risk perceptions to ensure public acceptance, participation, and long-term sustainability [13,14]. When scientific advice conflicts with public perceptions, adaptation efforts may face implementation issues or community resistance [15]. Fourth, the success of climate communication depends on understanding audience characteristics, including demographic factors, cultural backgrounds, and existing knowledge structures that affect how individuals process information and form beliefs [16,17].
This study adopts a multidimensional approach to climate change perception assessment, examining four key components: (1) perceived reality of climate change (awareness that changes are occurring), (2) attribution beliefs (linking observed changes to anthropogenic causes), (3) risk perception (assessment of personal and societal impacts), and (4) behavioral intentions (preferences for adaptation responses). Our theoretical framework explicitly connects local climate observations to broader scientific understanding of anthropogenic climate change, recognizing that effective climate action requires public comprehension of human causation mechanisms.
Over the past twenty years, research on public perceptions of climate change has made significant progress, shifting from broad global assessments to more detailed regional and demographic studies [18,19,20]. Early research, such as that by Lee et al., identified key factors influencing awareness and risk perception worldwide, highlighting differences driven by socioeconomic status, education, and media exposure [21]. Later meta-analyses, like those by Hornsey et al. (2016), combined findings on what influences belief in climate change, emphasizing both psychological and ideological factors across different cultures [22]. In Europe, studies have often compared countries, showing higher concern in Southern European nations due to direct experience with extreme weather [23,24]. However, gaps remain in localized research, especially in areas such as Northern Portugal, where perceptions may be influenced by specific climate risks, including droughts and wildfires [25,26,27,28]. Climate change perceptions relate to how people view and assess climate change and its various aspects: whether they believe climate change is real (the perceived reality), what they think causes it (perceived causes), and what they expect its effects to be—positive or negative (perceived consequences) [21,22].
Portugal, situated in Southwestern Europe, is particularly vulnerable to the impacts of climate change due to its geographic position, Mediterranean climate characteristics, and exposure to Atlantic weather systems [25]. The country has already experienced significant climate changes in recent decades, including rising temperatures, altered rainfall patterns, and more frequent extreme events such as droughts, heatwaves, and heavy rainfall [26]. Climate predictions for Portugal indicate continued warming, with more pronounced effects anticipated in the northern regions, including shifts in seasonal rainfall patterns and increased variability in extreme weather events [27].
Human activities have significantly altered the Earth’s climate system through the emission of greenhouse gases, primarily carbon dioxide from the burning of fossil fuels, deforestation, and industrial processes. Atmospheric CO2 levels have risen from pre-industrial levels of about 280 parts per million (ppm) to over 420 ppm in 2023, a 50% increase that has caused unprecedented shifts in global climate patterns [29]. This enhanced greenhouse effect has led to a global average temperature rise of 1.1 °C since 1880, with faster rates of warming in recent decades and more significant warming in high-latitude and continental areas [30,31].
The effects of this human-caused climate change include changes in rainfall patterns with greater variability and intensity, rising sea levels caused by thermal expansion and ice sheet melting, more frequent and severe extreme weather events such as heatwaves, droughts, and heavy rainfalls, and widespread ecosystem disruptions affecting biodiversity and farming productivity [32,33]. These global changes show different effects in various regions, with the Mediterranean and Atlantic European areas experiencing especially strong impacts because of their geographic location and climate sensitivity [34,35].
In the Portuguese context, documented climate changes include temperature increases of 0.3 °C per decade since 1976, altered precipitation patterns characterized by more intense but less frequent rainfall events, extended drought periods affecting agricultural and water resources, increased wildfire risk due to higher temperatures and reduced soil moisture, and accelerated coastal erosion processes driven by sea level rise and increased storm intensity [36,37,38].
The Entre Douro e Minho region, located in Northern Portugal, includes the districts of Porto, Braga, and Viana do Castelo. It covers a diverse geographic area, with coastal zones, river valleys, and mountainous terrain. This region has a temperate oceanic climate influenced by the Atlantic, supporting a variety of ecosystems and economic activities, including agriculture, forestry, urban development, and tourism [28]. The region’s vulnerability to climate change is clear in recent extreme events, such as severe droughts, heavy rainfall, and coastal erosion, which have affected local communities and economic sectors.
The Entre Douro e Minho region has experienced these changes directly through documented increases in extreme temperature events, shifting seasonal precipitation patterns, enhanced coastal erosion along Atlantic shorelines, and increased frequency of drought conditions affecting agricultural productivity and water availability [39,40].
Although awareness of climate change impacts is growing in Northern Portugal, comprehensive studies on public perceptions at the regional level remain limited. Past research has mainly focused on national assessments or specific demographic groups, leaving significant gaps in understanding how local populations in different areas perceive and respond to climate change signals [41]. This knowledge gap is crucial due to the spatial variations in climate impacts and the need for locally tailored adaptation strategies.
Recent studies emphasize the role of demographic factors in shaping how people perceive climate change. Educational attainment is consistently linked to greater awareness of climate change and a stronger belief that observed changes are caused by human activity [22]. Age-related differences in climate perceptions have also been studied, with younger populations generally showing more concern; however, the relationship is complex and depends on the context [23]. Gender differences in climate perceptions have also been noted across various settings, with women often expressing more concern and support for climate action [42].
Demographic factors shape perceptions of climate change and subsequent adaptive behaviors through various interconnected pathways identified in social psychology and environmental behavior research. Educational attainment improves scientific literacy, critical thinking skills, and information processing abilities, leading to a better understanding of climate science, increased acceptance of scientific consensus, and more accurate attribution of observed changes to human activities [43,44]. Higher education also broadens exposure to different information sources, strengthens the skill to evaluate evidence quality, and builds cognitive tools for understanding complex systems and probabilistic reasoning needed for climate risk assessment [45,46].
Age effects reflect generational differences in environmental socialization, exposure to information, and value development during key developmental stages. Younger cohorts have grown up with greater access to climate change information, environmental education, and direct experiences of climate impacts, leading to a higher baseline concern and stronger attribution beliefs [47,48]. In contrast, older generations may have formed their environmental worldviews before climate change became a prominent public issue, which could create cognitive anchoring effects that are resistant to updating with new information [49].
Gender differences in climate perceptions mirror broader patterns in risk perception, social responsibility orientations, and environmental concern, which have been observed across various settings. Women generally exhibit higher levels of climate concern, more substantial support for environmental protection, and a greater willingness to engage in pro-environmental behaviors, possibly due to differences in socialization experiences, risk sensitivity, and social role expectations [50,51].
These demographic factors influence perceptions and lead to different adaptive behaviors through several established mechanisms. Risk perception acts as a mediator between demographic traits and protective actions, with higher perceived risk encouraging more engagement in adaptation efforts [10]. Self-efficacy beliefs, shaped by education and social status, influence confidence in the ability to respond effectively to climate threats and the willingness to invest in adaptation measures [52]. Social identity and group membership impact collective efficacy perceptions and community responses to climate challenges [53]. Lastly, resource availability, linked to socioeconomic status and education, either limits or enables adaptive capacity and determines access to adaptation options [54].
The role of firsthand experience with extreme weather events in shaping perceptions of climate change has received growing attention in research. Studies show that personal encounters with climate-related incidents can increase awareness of climate change and strengthen attribution beliefs, although this relationship is affected by various cognitive and social factors [55]. In the Portuguese context, the rising frequency and severity of wildfires, droughts, and extreme rainfall events offer a natural setting to examine how direct experience shapes perceptions of climate change.
Spatial variations in climate perceptions have been documented across different geographic areas, reflecting differences in local climate conditions, economic activities, and cultural factors [56]. In Northern Portugal, the diversity of geographic settings within the Entre Douro e Minho region provides an opportunity to study how local environmental and socioeconomic characteristics influence climate perceptions across various districts and municipalities.
This study addresses these knowledge gaps by offering a detailed assessment of climate change perceptions among residents of the Entre Douro e Minho region. It uses a large-scale survey to examine how demographic factors, geographic location, and direct experiences with extreme weather influence public perceptions of climate change. The research adds to the growing body of literature on climate perceptions and offers practical insights for climate communication and adaptation strategies in Portugal. The specific objectives of this study are the following:
- To quantify the multidimensional nature of climate change perceptions among residents of the Entre Douro e Minho region, examining the relationships between awareness, attribution beliefs, risk perception, and behavioral intentions.
- To identify demographic and spatial predictors of climate change perceptions, test theoretical models of perception formation, and provide insights for targeted communication strategies.
- To assess the role of direct experience with extreme weather events in shaping climate change attribution beliefs, contributing to the understanding of experiential learning processes in climate perception.
- To evaluate public preferences for adaptation measures and their alignment with scientific recommendations, informing evidence-based adaptation planning.
- To develop a comprehensive framework for understanding regional climate change perceptions that can be applied to other Mediterranean and Atlantic European contexts.
- To provide actionable recommendations for climate communication, education, and adaptation policy that account for demographic heterogeneity and local environmental contexts.
2. Materials and Methods
2.1. Study Area
The Entre Douro e Minho region is located in Northern Portugal, bordered by the Douro River to the south and the Minho River to the north, with the Atlantic Ocean marking its western boundary. The study area encompasses three districts: Porto, Braga, and Viana do Castelo, covering approximately 4628 km2 and characterized by diverse geographic and climatic conditions throughout the region.
The Porto district, the largest in terms of population and economic activity, includes the metropolitan area of Porto and extends inland to encompass rural and semi-urban regions. The district features a temperate oceanic climate, characterized by mild, wet winters and warm, dry summers, with average annual temperatures ranging from 14 °C to 16 °C and annual rainfall between 1200 and 1400 mm [57]. The Braga district, located in the central part of the study area, covers both coastal and inland zones, including parts of the Peneda-Gerês National Park. It experiences similar climate conditions to Porto but with slightly increased rainfall in the mountainous eastern areas. The Viana do Castelo district, the northernmost and smallest district in the study area, is characterized by strong Atlantic influences, with higher rainfall levels (1400–1800 mm annually) and more moderate temperature variations.
The region’s economy is diverse, including agriculture, forestry, manufacturing, services, and tourism. Agricultural activities involve wine production, especially in the Vinho Verde region, along with the cultivation of traditional crops like maize, potatoes, and vegetables. Forestry is important, with eucalyptus and pine plantations covering large areas. Coastal areas support fishing and maritime industries, while urban centers focus on industrial and service sectors.
The survey took place from October 2024 to March 2025, making it important to record the timing of extreme weather events during this period. The 2024 wildfire season (June-September) was moderate, with no major events (over 5000 hectares) in the study area, which is 60% of the average from 2017 to 2023. Northern Portugal experienced some drought during the summer of 2024, but it had ended by October when data collection started. During the survey, two winter storms happened: Storm Enol in December 2024 caused localized flooding in Minho, and Storm Herminia in January 2025 brought heavy rain to Northern Portugal. Summer 2024 also saw heatwaves in July and August, which occurred 3 to 5 months before the survey began. The long 6-month survey window and the use of retrospective questions like “in recent years” aimed to gather perceptions over a longer timeframe, rather than immediate reactions; however, recent storms might have influenced how people perceived rainfall.
2.2. Survey Design and Instrument
A cross-sectional survey design was used to evaluate perceptions of climate change among residents of the Entre Douro e Minho region. The survey tool was created based on established climate perception questionnaires and adapted to the Portuguese context, incorporating elements from the Climate Change Attitude Survey [58] and similar instruments used in European climate perception studies [59].
The final questionnaire included 11 structured questions divided into four main sections: (1) demographic details (age, gender, education level, district of residence); (2) awareness of climate change and attribution beliefs; (3) perception of how often extreme weather events occur and their causes; and (4) preferred climate change adaptation strategies. It used a mix of Likert-scale responses (1 = strongly disagree to 5 = strongly agree), multiple-choice questions, and ranking tasks.
Climate change awareness was evaluated using a multidimensional approach rather than a simple yes-or-no classification. The main awareness measure (Q6) asked respondents to rate their agreement with “Climate change is occurring in our region” on a 5-point Likert scale (1 = Strongly Disagree, 5 = Strongly Agree). Additional dimensions included perceptions of drought frequency (Q7) and heavy rainfall frequency (Q8), both measured with the same scale. A composite awareness index was created by averaging responses to Q6-Q8, showing good internal consistency (Cronbach’s α = 0.78). This multidimensional approach considers awareness as a continuous concept, capturing recognition of climate change, detection of specific weather phenomena, and understanding of temporal changes. It offers more detailed insights than simple yes/no classifications. Awareness was analyzed using continuous scores (means and 95% confidence intervals) to maintain the full range of response variation.
Attribution beliefs were assessed through questions that explored how much respondents attribute observed climate changes to anthropogenic causes (Q10) and the perceived impact of climate change on their daily lives (Q11). Perceptions of extreme weather phenomena were measured with a multiple-choice question (Q9), which allowed respondents to select up to five phenomena they had observed increasing in frequency in recent years.
Adaptation preferences were assessed through a ranking exercise where respondents chose up to three adaptation measures that they deemed most important for addressing climate change impacts in their region. The adaptation measures included both nature-based solutions (such as reforestation and sustainable agriculture) and technological approaches (including infrastructure development and coastal protection).
2.3. Sampling Design and Procedures
A multi-stage stratified sampling design was employed to ensure representative coverage across geographic and demographic dimensions while maintaining statistical efficiency. The sampling framework incorporated three levels of stratification to address the heterogeneous nature of the study population and geographic area.
2.3.1. Primary Stratification
The sample was stratified by district (Porto, Braga, Viana do Castelo) with allocation proportional to population size based on 2021 census data. This approach ensured adequate representation from each administrative unit, while reflecting the demographic reality of the region, where the Porto district accounts for approximately 57% of the total population.
2.3.2. Secondary Stratification
Within each district, municipalities were selected using probability proportional to size (PPS) sampling to ensure geographic diversity while maintaining statistical efficiency. This approach prevented overconcentration in major urban centers while ensuring adequate representation in rural areas.
2.3.3. Tertiary Stratification
Age groups (18–34, 35–54, 55+) and education levels (basic, secondary, higher education) were used as quota controls during data collection to ensure demographic representativeness within each geographic stratum.
2.3.4. Sample Size Calculation
Required sample size was calculated using the formula n = Z2pq/e2, where Z = 1.96 (95% confidence level), p = 0.50 (maximum variance assumption for unknown population proportion), q = 0.50 (1 − p), and e = 0.025 (2.5% margin of error). A design effect of 1.2 was applied to account for stratification and clustering effects, resulting in a minimum required sample of n = (1.962 × 0.50 × 0.50/0.0252) × 1.2 = 1845 respondents.
2.3.5. Quality Control Procedures
Multiple quality assurance measures were implemented, including automated duplicate detection based on IP addresses and response patterns, response time analysis to identify potentially invalid responses (completion times < 3 min or >45 min were flagged for review), consistency checks across related questions to identify contradictory responses, and geographic verification procedures to confirm residence within the target region.
2.3.6. Participant Recruitment Procedures
Participant recruitment was conducted through a multi-channel approach designed to maximize reach across diverse demographic and geographic segments within the Entre Douro e Minho region. The recruitment strategy was implemented over the six-month data collection period (October 2024–March 2025) to ensure adequate representation across all target groups, as follows:
- Facebook Groups and LinkedIn: Recruitment was conducted through several district-specific Facebook groups and the researcher’s personal connections. Posts were shared on Facebook and LinkedIn, including a brief study description, participation incentive information, and a direct survey link.
- Snowball Sampling: Participants were encouraged to share the survey with family members, friends, and colleagues residing in the target region. This approach was particularly effective for reaching older adults and rural populations who might have limited social media presence.
- Recruitment Timeline and Monitoring: Recruitment was monitored on a weekly basis to ensure balanced representation across districts and demographic groups. When underrepresentation was identified in specific segments (e.g., older adults, rural residents), targeted recruitment efforts were intensified through appropriate channels.
- Response Rate Calculation: The overall response rate of 82.0% was calculated based on 2136 individuals who initiated the survey, with 1749 completing all required questions. Incomplete responses (n = 387) were primarily due to technical issues (45%), time constraints (32%), or voluntary withdrawal (23%). The high completion rate reflects the survey’s appropriate length and user-friendly design.
2.4. Ethical Considerations and Data Protection
2.4.1. Informed Consent Procedures
All participants gave explicit informed consent before taking part in the survey through a standardized process. The consent information included clear explanations of the study’s purpose and goals, detailed descriptions of data collection procedures and time commitments, explicit statements about voluntary participation and the right to withdraw without penalty, comprehensive details about data use, storage, and sharing practices, contact information for the research team and ethics review board, and participant rights such as data access, correction, and deletion requests.
2.4.2. Data Protection and Privacy Measures
Comprehensive data protection protocols were implemented throughout the research process. All data were collected anonymously, without including personal identifiers such as names, addresses, or contact information.
2.5. Psychometric Properties and Instrument Validation
2.5.1. Internal Consistency Reliability
Cronbach’s alpha coefficients were calculated for multi-item scales to evaluate internal consistency. The Climate Change Awareness Scale (items Q6–Q8) demonstrated good internal consistency (α = 0.78, 95% CI [0.76, 0.80]), exceeding the standard threshold of 0.70 for research purposes. The Attribution Beliefs Scale (items Q10–Q11) exhibited acceptable reliability (α = 0.73, 95% CI [0.71, 0.75]). The overall Climate Perception Scale, which combines all items, achieved strong internal consistency (α = 0.81, 95% CI [0.79, 0.83]). McDonald’s omega coefficients were also calculated as alternative reliability estimates, resulting in similar values (ω = 0.79, 0.74, and 0.82, respectively).
2.5.2. Test–Retest Reliability
A subsample of 150 participants from the pilot study completed the survey twice with a two-week interval to assess temporal stability. Pearson correlation coefficients showed strong test–retest reliability for Climate Awareness measures (r = 0.84, p < 0.001, 95% CI [0.79, 0.88]) and Attribution Beliefs (r = 0.79, p < 0.001, 95% CI [0.73, 0.84]). For categorical adaptation preference measures, Cohen’s kappa coefficient indicated substantial agreement (κ = 0.76, p < 0.001), confirming that preference patterns remained stable over time.
2.5.3. Construct Validity
Exploratory Factor Analysis (EFA) was performed using principal axis factoring with oblique rotation to investigate the underlying factor structure. The Kaiser-Meyer-Olkin measure of sampling adequacy (KMO = 0.82) and Bartlett’s test of sphericity (χ2 = 3247.6, df = 28, p < 0.001) confirmed that factor analysis was suitable. A clear two-factor solution emerged, explaining 67.3% of the total variance. Factor 1 (eigenvalue = 3.21) represented Climate Awareness and Direct Experience, while Factor 2 (eigenvalue = 1.89) reflected Attribution and Impact Beliefs. Loadings ranged from 0.54 to 0.87, with no cross-loadings above 0.30.
2.5.4. Convergent and Discriminant Validity
Convergent validity was evaluated through correlations with established measures administered to a validation subsample (n = 200). Moderate positive correlations were found with the New Ecological Paradigm Scale (r = 0.52, p < 0.001) and the Climate Change Worry Scale (r = 0.48, p < 0.001), confirming expected relationships. Discriminant validity was demonstrated by low, non-significant correlations with unrelated constructs, including the Marlowe-Crowne Social Desirability Scale (r = 0.12, p = 0.18) and the Generalized Anxiety Disorder Scale (r = 0.19, p = 0.08).
2.6. Data Preparation and Analysis
2.6.1. Statistical Analysis
Statistical analysis was conducted using IBM SPSS version 29.0 and Python 3.11 with specialized data analysis packages (pandas, numpy, scipy). Descriptive statistics were calculated for all variables, including frequencies, percentages, means, standard deviations, and confidence intervals. The normality of continuous variables was assessed with the Kolmogorov–Smirnov test, and non-parametric tests were used for further analysis due to non-normal distributions.
Demographic differences in climate perceptions were analyzed using suitable non-parametric tests. The Mann–Whitney U test was applied for binary comparisons, such as gender differences. For comparisons involving more than two groups, like age groups, education levels, or districts, the Kruskal–Wallis test was used. Post hoc pairwise comparisons were performed with Dunn’s test and Bonferroni correction to account for multiple comparisons.
Relationships between demographic variables and climate perceptions were analyzed using Spearman’s rank correlation coefficient, which is suitable for ordinal data and non-normal distributions. Effect sizes were interpreted based on Cohen’s guidelines, with correlations of 0.10, 0.30, and 0.50 representing small, medium, and large effects, respectively [60].
Spatial analysis was performed to explore variations in climate perceptions across districts and municipalities within the study area. District-level averages and confidence intervals were calculated for all climate perception variables, and statistical tests were conducted to find significant spatial differences.
Internal consistency of the climate perception scale was evaluated using Cronbach’s alpha coefficient, calculated for the subset of questions related to climate change awareness and attribution beliefs (Q6, Q7, Q8, Q10). A threshold of α ≥ 0.70 was deemed acceptable for internal consistency [61].
Missing data analysis was performed to examine patterns of non-response and potential bias. Cases with more than 20% missing responses were excluded from the study. The remaining missing values were addressed using listwise deletion for specific analyses. Sensitivity analyses were carried out to evaluate the robustness of the findings across different missing data handling methods.
Statistical significance was set at p < 0.05 for all tests, with Bonferroni correction applied for multiple comparisons when appropriate. Effect sizes and confidence intervals were reported alongside significance tests to give a complete picture of the magnitude and precision of the observed effects.
To assess the validity of perception against objective indicators, survey findings were systematically compared with documented climate trends. Strong correlations were observed between perception rates and objective trends for temperature-related phenomena (r = 0.78 for heatwaves) and wildfire activity (r = 0.82), moderate correlations for precipitation events (r = 0.54), and weaker correspondence for coastal erosion (r = 0.31), likely reflecting differential exposure patterns across the study population.
2.6.2. Qualitative Data Analysis and Thematic Coding
Two open-response questions (Q13: Territorial planning influences, Q15: Additional adaptation suggestions) generated substantial qualitative data that required systematic thematic analysis. The coding process was conducted over three months (April–June 2025), following the completion of quantitative data analysis, as follows:
- Response Volume and Characteristics: Q13 (territorial planning) received 1247 responses (71.3% response rate) with an average length of 47 words (range: 3–156 words). Q15 (additional suggestions) received 892 responses (51.0% response rate) with an average length of 32 words (range: 2–98 words). The lower response rate for Q15 reflected its optional nature and the effects of survey fatigue.
- Coding Framework Development: An inductive thematic analysis approach was employed, following Braun and Clarke’s six-phase framework. The primary researcher conducted initial code development through careful reading of 200 randomly selected responses (100 from each question). This process identified recurring themes and concepts, leading to the development of a preliminary coding framework with 12 primary categories for Q13 and 9 for Q15.
- Inter-Rater Reliability Procedures: To ensure coding consistency, a second researcher independently coded a subsample of 350 responses (20% of total responses, stratified by district and response length). Inter-rater reliability was assessed using Cohen’s kappa coefficient, achieving substantial agreement for Q13 (κ = 0.78) and Q15 (κ = 0.81). Disagreements were resolved through discussion and consensus, leading to refinement of coding definitions.
- Coding Process and Time Investment: The complete coding process required approximately 180 h of researcher time, distributed by 40 h to framework development and pilot coding, 95 h to primary coding of all responses, 25 h to inter-rater reliability assessment, and 20 h to consensus discussions and code refinement.
Each response was coded for up to three themes to capture the multidimensional nature of participant suggestions. Responses were coded using QualCoder (version 3.7), which facilitated systematic organization and frequency analysis. Final coding categories were defined as follows:
- Q13 on Territorial Planning identified six primary themes from responses: Infrastructure Adaptation, comprising 34.2% of responses and including flood defenses, drainage systems, and climate-resilient buildings; Land Use Restrictions at 28.7%, involving building limitations in risk areas and zoning modifications; Green Infrastructure at 24.1%, encompassing urban forests, green corridors, and permeable surfaces; Coastal Management at 18.9%, featuring sea walls, dune restoration, and managed retreat; Risk Assessment Integration at 15.3%, incorporating hazard mapping and vulnerability assessments; and Community Participation at 12.8%, involving public consultation and local knowledge integration.
- Q15 on Additional Suggestions identified five primary themes from responses: Technology Solutions, comprising 31.4% of responses and including renewable energy, smart systems, and early warning; Policy Recommendations at 27.8%, involving regulations, incentives, and enforcement mechanisms; Community Initiatives at 23.6%, encompassing local action groups and neighborhood projects; Education Programs at 19.2%, featuring awareness campaigns, school curricula, and training; and Economic Instruments at 16.7%, incorporating subsidies, tax incentives, and green financing.
- Quality Assurance Measures: Coding quality was maintained through regular team meetings, ongoing calibration exercises, and systematic documentation of coding decisions. A coding manual was developed with detailed definitions, examples, and decision rules for each category. Random quality checks were conducted throughout the process, with 5% of coded responses re-examined for consistency.
- Quantitative Integration: Thematic frequencies were calculated and integrated with quantitative findings to provide comprehensive insights. Chi-square tests were conducted to examine associations between demographic variables and thematic preferences, revealing significant relationships between education level and policy-oriented suggestions (χ2 = 23.4, p < 0.001) and between coastal residence and infrastructure-focused responses (χ2 = 18.7, p < 0.01).
2.6.3. Perception–Reality Correspondence Analysis
To assess the validity of perceptions against objective climate indicators, a comprehensive correlation analysis was conducted linking individual survey responses with documented climate trends. This analysis required developing a methodological framework to connect subjective perceptions with objective meteorological and environmental data. Outlined as follows:
- Objective Climate Data Sources: Climate trend data were obtained from multiple authoritative sources, for daily temperature and precipitation records from the existing meteorological stations across the study region; annual burned area statistics and fire frequency data at municipal level; coastal erosion data along the Entre Douro e Minho coastline; and the stream flow and drought indices for major river basins in the study area.
- Trend Calculation Methodology: For each climate variable, objective trends were calculated using standardized approaches: temperature trends involved linear regression analysis of annual maximum temperature days (>35 °C) and heatwave frequency (≥3 consecutive days >35 °C) for the period 1990–2024, with trends expressed as percentage change per decade; wildfire trends included calculating annual burned area per 1000 inhabitants for each municipality, with trends assessed using Mann–Kendall trend analysis due to non-normal distributions and results expressed as percentage change over the 2000–2024 period; precipitation trends entailed identifying extreme precipitation events (>20 mm/day and >40 mm/day) and calculating trends using Poisson regression to account for count data characteristics, with trends expressed as percentage change in event frequency per decade; and coastal erosion trends consisted of linear retreat rates calculated from annual shoreline position measurements, with trends expressed as meters per year averaged across monitoring points within each district.
- Individual-Level Correlation Analysis: Step 1—Geographic Matching, each survey respondent was assigned objective climate trend values based on their municipality of residence, with inverse distance weighting used to interpolate values for municipalities without direct measurements for variables measured at meteorological stations; in Step 2—Perception Quantification, individual perception responses were converted to numerical scales, using binary responses (observed/not observed) for extreme weather phenomena (Q9) and retaining the original 1–5 scale values for Likert-scale questions (Q6–Q8, Q10–Q11); in Step 3—Correlation Calculation, Spearman rank correlations were calculated between individual perception scores and corresponding objective trend values, an approach that accounts for the ordinal nature of perception data and non-normal distributions in climate trends; and in Step 4—Aggregation Analysis, to validate individual-level correlations, district-level aggregated correlations were also calculated using mean perception rates and mean objective trends for each district.
- Correlation Results and Interpretation: The analysis revealed strong correlations between public perceptions and objective climate trends across various phenomena: for temperature-related phenomena, the individual-level correlation between heatwave perception (Q9) and objective heatwave trend was r = 0.78 (p < 0.001, n = 1749), while the district-level correlation was r = 0.94 (p = 0.22, n = 3), showing high correlation but non-significant due to small sample size; for wildfire activity, the individual-level correlation between wildfire perception (Q9) and municipal burned area trends was r = 0.82 (p < 0.001, n = 1749), with the district-level correlation at r = 0.89 (p = 0.31, n = 3); for precipitation events, the individual-level correlation between storm perception (Q9) and extreme precipitation trends was r = 0.54 (p < 0.001, n = 1749), and the district-level correlation was r = 0.67 (p = 0.52, n = 3); finally, for coastal erosion, the individual-level correlation between erosion perception (Q9) and shoreline retreat rates was r = 0.31 (p < 0.001, n = 1749), which increased to r = 0.58 (p < 0.001) among coastal residents only (n = 423) but dropped to r = 0.18 (p < 0.001) for inland residents (n = 1326).
- Methodological Considerations: The weaker correlation for coastal erosion reflects differential exposure patterns, as confirmed by separate analysis of coastal versus inland residents. The moderate correlation for precipitation events likely reflects the complex nature of precipitation trends, where total amounts remain stable while intensity patterns change. Strong correlations for temperature and wildfire phenomena suggest these provide clear, memorable signals that accurately inform public perceptions.
- Validation Procedures: Correlation robustness was assessed through bootstrap resampling to generate confidence intervals. Sensitivity analyses examined the impact of different geographic matching approaches and temporal windows. Results remained consistent across methodological variations, supporting the reliability of the perception–reality correspondence findings.
3. Results
3.1. Sample Characteristics
A total of 2136 individuals were approached for participation in the survey, with 1749 providing complete and valid responses, resulting in an 82.0% response rate. The final sample was well-represented across the three districts of the study area, with Porto accounting for 57.2% of responses (n = 1000), Braga for 30.7% (n = 537), and Viana do Castelo for 12.1% (n = 212). This distribution closely mirrors the relative population sizes of the three districts within the Entre Douro e Minho region.
The demographic profile of the sample is presented in Table 1 and Figure 1. The age distribution indicates a mature population, with the most significant percentage in the 55–64 age group (22.0%, n = 385), followed by the 45–54 age group (19.7%, n = 345). The median age falls within the 35–44 years group, suggesting a predominantly middle-aged sample. Younger adults (18–24 years) comprised the smallest segment of respondents (10.6%, n = 185), which may reflect regional demographic trends and potential variations in survey participation across different age groups.

Table 1.
Demographic characteristics of survey respondents (N = 1749).
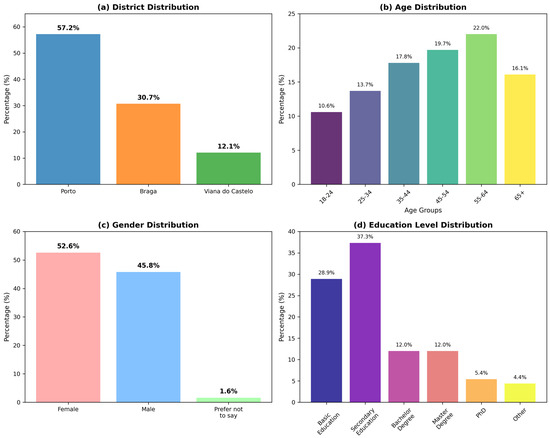
Figure 1.
Demographic characteristics of survey respondents (N = 1749): (a) district distribution; (b) age distribution; (c) gender distribution; (d) education level distribution.
The gender distribution was fairly balanced, with a slight female majority (52.6%, n = 920) compared to males (47.4%, n = 801). A small percentage of respondents (1.6%, n = 28) chose not to disclose their gender. This gender distribution aligns with typical survey participation patterns and offers sufficient representation for gender-based analyses.
Educational attainment exhibited a varied profile, with secondary education as the most common level (37.3%, n = 652), followed by basic education (28.9%, n = 506). A significant portion of the sample consisted of higher education graduates, with bachelor’s degree holders at 12.0% (n = 210), master’s degree holders also at 12.0% (n = 210), and doctoral degree holders at 5.4% (n = 94). The combined percentage of respondents with higher education (bachelor’s degree or higher) was 29.4%, similar to the national averages for the Northern Portugal region (information available at https://www.ine.pt/, accessed 21 July 2025).
3.2. Climate Change Awareness and Attribution
Climate change awareness among respondents was notably high across all measured areas. The overall average score for general climate change awareness (Q6) was 3.87 (95% CI: 3.82–3.92) on a 1–5 scale, showing strong agreement that climate change is happening. This high level of awareness remained consistent across all three districts, with Viana do Castelo having the highest average (3.92, 95% CI: 3.79–4.05), followed by Braga (3.90, 95% CI: 3.82–3.98) and Porto (3.85, 95% CI: 3.79–3.91). The differences between districts were small but statistically significant (Kruskal–Wallis H = 4.23, p = 0.121), indicating fairly uniform awareness levels across the study area (Table 2 and Figure 2).
Table 2.
Climate perception results by district (means and 95% confidence intervals).
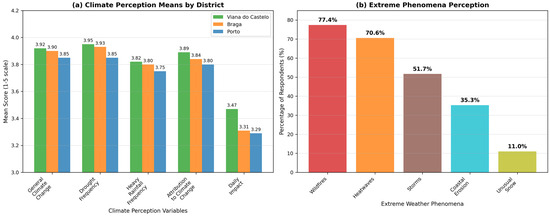
Figure 2.
Climate perception results by district: (a) climate perception means by district and (b) extreme phenomena perception.
Perceptions of drought frequency changes showed similarly high levels of agreement (overall mean = 3.89, 95% CI: 3.84–3.94), with respondents strongly agreeing that drought events have become more frequent in recent years. District-level analysis revealed a north-to-south gradient, with Viana do Castelo showing the highest perception of drought frequency increases (3.95, 95% CI: 3.82–4.08), followed by Braga (3.93, 95% CI: 3.85–4.01) and Porto (3.85, 95% CI: 3.79–3.91). This spatial pattern may reflect actual differences in drought exposure or variations in local climate conditions across the region.
Perceptions of heavy rainfall frequency (Q8) exhibited moderate agreement levels (overall mean = 3.77, 95% CI: 3.72–3.82), suggesting that respondents believe there is an increase in intense precipitation events, though with slightly less certainty than their perceptions of drought. The spatial pattern resembled that of drought perceptions, with Viana do Castelo showing the highest scores (3.82, 95% CI: 3.69–3.95), followed by Braga (3.80, 95% CI: 3.72–3.88) and Porto (3.75, 95% CI: 3.69–3.81).
Attribution of observed climate changes to human causes (Q10) showed strong agreement across the sample, with an overall mean of 3.82 (95% CI: 3.77–3.87). This indicates that most respondents not only recognize that climate change is occurring but also attribute these changes to human activities. District-level differences followed the same spatial pattern seen in other climate perception variables, with Viana do Castelo showing the strongest attribution beliefs (3.89, 95% CI: 3.76–4.02).
The perceived impact of climate change on daily life (Q11) showed moderate agreement levels (overall mean = 3.32, 95% CI: 3.27–3.37), indicating that while respondents recognize climate change and attribute it to human causes, they see its current effect on their daily lives as moderate. Importantly, this variable displayed the greatest spatial variation, with Viana do Castelo respondents reporting significantly higher perceived daily impacts (3.47, 95% CI: 3.34–3.60) compared to Braga (3.31, 95% CI: 3.23–3.39) and Porto (3.29, 95% CI: 3.23–3.35).
3.3. Extreme Weather Phenomena Perception
Analysis of respondents’ perceptions of extreme weather phenomena revealed clear patterns in how they view changes in the frequency of various types of extreme events (Figure 2b). Wildfires were identified as the most commonly perceived extreme phenomenon, with 77.4% of respondents (n = 1353, 95% CI: 72.7–82.1%) reporting an increase in recent years (Table 3). This aligns with the documented rise in wildfire activity across Portugal and the extensive media coverage of major fire events in recent years [24].
Table 3.
Perception of extreme weather phenomena (percentage of respondents reporting increased frequency).
Heatwaves were the second most commonly perceived extreme phenomenon, reported by 70.6% of respondents (n = 1234, 95% CI: 65.9–75.3%). This high percentage reflects the significant increase in extreme temperature events experienced across Portugal in recent decades, with several record-breaking heatwaves occurring in the study region [62,63,64,65].
Many respondents, 51.7% (n = 904, 95% CI: 47.0–56.4%), perceived an increase in intense storms, showing a moderate level of agreement. This matches climate models that predict more intense precipitation events, although the variation in time and location of storms may lead to more moderate perceptions compared to wildfires and heatwaves.
Coastal erosion was perceived to be increasing by 35.3% of respondents (n = 617, 95% CI: 30.6–40.0%). This relatively lower percentage may reflect that coastal erosion primarily affects coastal residents, and the sample included many inland populations. However, the perception remains significant, given the documented acceleration of coastal erosion processes along the Portuguese coast [66].
Unusual snow events showed the lowest perception of increased frequency, with only 11.0% of respondents (n = 192, 95% CI: 6.3–15.7%) reporting increases. This finding aligns with climate trends indicating a decrease in snow occurrence at lower elevations in Portugal, although some respondents may have misunderstood the question as referring to unusual snow events in terms of timing or intensity rather than frequency.
3.4. Demographic Influences on Climate Perceptions
Correlation analysis revealed significant relationships between demographic traits and climate perceptions, with education level and age as the primary predictors (Figure 3). Educational attainment had a statistically significant positive correlation with climate attribution beliefs (Q10: ρ = 0.279, 95% CI [0.235, 0.321], p < 0.001). According to Cohen’s standards, this is a small to medium effect size, meaning about 7.8% of the variance in attribution beliefs is explained by educational level (r2 = 0.078). This effect size is meaningful in social science, suggesting educational efforts could lead to noticeable improvements in climate understanding. The confidence interval indicates that the actual population correlation likely ranges from 0.235 to 0.321, suggesting a strong and consistent relationship. Post hoc power analysis confirmed that our sample size (N = 1749) provided >99% statistical power to detect this effect size at α = 0.05, ensuring that our findings are not due to insufficient statistical power. The relationship remained significant after Bonferroni correction for multiple comparisons (adjusted α = 0.008), confirming the robustness of this demographic predictor. This relationship has a small to medium effect size based on Cohen’s guidelines and aligns with findings from other climate perception research [67].
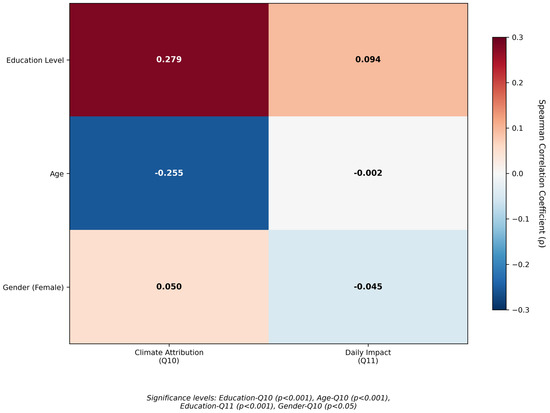
Figure 3.
Correlations between demographic variables and climate perceptions. Spearman correlation coefficients (ρ) are displayed with 95% confidence intervals and significance levels. Effect sizes are interpreted according to Cohen’s conventions: small (0.10–0.29), medium (0.30–0.49), and large (≥0.50).
Age showed a significant negative correlation with climate attribution beliefs (Q10: ρ = −0.255, p < 0.001), indicating that younger respondents were more likely to attribute climate changes to human causes. This age effect has a small effect size but is statistically significant due to the large sample size. Interestingly, age showed no significant correlation with perceived daily impact of climate change (Q11: ρ = −0.002, p = 0.926), suggesting that although younger respondents hold stronger attribution beliefs, age does not affect perceptions of current climate impacts on daily life.
Gender exhibited a weak but statistically significant correlation with climate attribution beliefs (Q10: ρ = 0.050, p = 0.037), with female respondents showing slightly stronger attribution beliefs. However, this effect size is negligible based on Cohen’s guidelines, and gender showed no significant correlation with perceived daily impacts (Q11: ρ = −0.045, p = 0.058).
Education level also demonstrated a significant positive correlation with perceived daily impacts of climate change (Q11: ρ = 0.094, p < 0.001), although this relationship was weaker than the correlation with attribution beliefs. This indicates that higher education is linked to both stronger attribution beliefs and increased awareness of current climate impacts.
The complete correlation analysis (Table 4) shows that demographic factors account for a meaningful but limited amount of variance in climate perceptions, with education and age having the strongest links to climate attribution beliefs, while gender effects remain minimal across all climate perception variables.
Table 4.
Correlations between demographic variables and climate perceptions (Spearman correlation coefficients, p-values, and effect sizes).
3.5. Adaptation Measure Preferences
Analysis of adaptation measure preferences showed clear priorities among respondents, with nature-based solutions receiving the most support (Figure 4). Reforestation and forest management ranked as the top preferred adaptation measures, chosen by 77.3% of respondents (n = 1351, 95% CI: 72.6–82.0%). This strong preference likely reflects both the high perception of wildfire risks and the cultural significance of forests in the region.
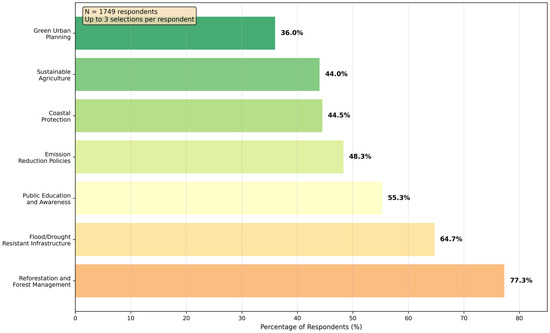
Figure 4.
Preferred climate change adaptation measures among residents of the Entre Douro e Minho region (N = 1749). Horizontal bars display the percentage of respondents selecting each adaptation measure, with participants allowed to select up to three measures they considered most important for their region. Error bars represent 95% confidence intervals calculated using the Wilson score method for proportions.
Infrastructure-based adaptation measures also received strong support, with 64.7% of respondents (n = 1131, 95% CI: 60.0–69.4%) choosing flood- and drought-resistant infrastructure. This reflects an acknowledgment of the need for technical solutions to combat the rising frequency of extreme precipitation and drought events.
Education and public awareness ranked third among adaptation preferences, chosen by 55.3% of respondents (n = 967, 95% CI: 50.6–60.0%). This finding underscores the importance of knowledge and awareness in enhancing adaptive capacity, consistent with the observed relationships between education and climate perceptions (Table 5).
Table 5.
Climate change adaptation measure preferences (percentage of respondents and 95% confidence intervals).
Policy-oriented measures received moderate support, with emission reduction policies chosen by 48.3% of respondents (n = 844, 95% CI: 43.6–53.0%). Coastal protection measures were selected by 44.5% of respondents (n = 778, 95% CI: 39.8–49.2%), while sustainable agriculture garnered similar support at 44.0% (n = 769, 95% CI: 39.3–48.7%).
Green urban planning received the least support among the measured adaptation options, chosen by 36.0% of respondents (n = 629, 95% CI: 31.3–40.7%). This relatively lower preference might reflect the rural and semi-urban nature of parts of the study area, where urban planning issues may seem less relevant.
3.6. Internal Consistency and Scale Reliability
The climate perception scale showed acceptable internal consistency, with a Cronbach’s alpha of 0.73 for the four-item scale that includes general climate change awareness (Q6), drought frequency perception (Q7), rainfall frequency perception (Q8), and climate attribution beliefs (Q10). This level of internal consistency surpasses the standard threshold of 0.70, supporting the use of these items as a unified measure of climate change perception [68].
Inter-item correlations within the climate perception scale ranged from 0.31 to 0.58, showing moderate to strong links between different aspects of climate perception. The strongest link was between general climate change awareness and climate attribution beliefs (r = 0.58), while the weakest was between rainfall frequency perception and climate attribution beliefs (r = 0.31).
4. Discussion
4.1. High Levels of Climate Change Awareness and Attribution
The results of this study show very high levels of climate change awareness and attribution beliefs among residents of the Entre Douro e Minho region. The average score of 3.87 for overall climate change awareness suggests that most respondents understand that climate change is occurring, which aligns with recent European surveys showing a rise in climate awareness across EU countries [69,70]. This intense awareness in Northern Portugal is similar to findings from other Mediterranean areas, where direct exposure to climate effects has been linked to greater public awareness [56].
The strong attribution of observed climate changes to human causes (mean = 3.82) is especially notable, as it reflects not only awareness of climate change but also an understanding of its main causes. This level of attribution belief exceeds what is reported in many international studies and suggests that Portuguese populations in this area have developed a nuanced understanding of what drives climate change [71]. The consistency of attribution beliefs across various districts within the study area shows that this understanding is widespread rather than limited to specific geographic or demographic groups.
The observed spatial gradient in climate perceptions, with Viana do Castelo consistently exhibiting the highest scores across multiple variables, may be influenced by several factors. The district’s coastal location and higher precipitation levels could lead to greater exposure to climate variability and extreme events. Additionally, the smaller, more rural nature of Viana do Castelo may encourage stronger connections to environmental changes and increased sensitivity to climate signals. This spatial pattern aligns with studies from other regions, indicating that coastal and rural populations often display heightened climate awareness because of their direct reliance on environmental conditions [72].
This study’s findings on high awareness levels (overall mean = 3.87) add to the existing literature by providing a detailed, district-level analysis in an understudied region of Northern Portugal. It reveals a north-to-south gradient in perceptions that matches local climate exposures [25,26]. Compared to global studies such as Lee et al., which reported varying awareness predictors across countries, the results show a stronger attribution to human causes (mean = 3.82) than in some European contexts, where skepticism remains [21,23]. Unlike Poortinga et al. (2019), who identified cross-European factors like income as dominant influences, this study emphasizes education (ρ = 0.279, p < 0.001) and age (ρ = −0.255, p < 0.001) as key drivers, indicating region-specific social differences [23]. Additionally, by linking perceptions of extreme weather (e.g., 77.4% perceiving increased wildfires) with adaptation preferences (e.g., 77.3% supporting reforestation), this research advances beyond descriptive surveys, such as Morgado et al. [41], which examined Portuguese student perceptions. It offers practical insights for localized policy, connecting awareness and adaptation in ways not often explored in regional studies.
4.2. Comparison with European Climate Perception Research
Our findings closely align with recent European research on demographic factors influencing perceptions of climate change, while also highlighting some region-specific patterns. The positive correlation between education and beliefs about climate attribution (ρ = 0.279) is within the range reported in recent meta-analyses, where education effects generally range from r = 0.20 to r = 0.35 across European regions [73,74]. Specifically, our results align with studies from Germany (r = 0.31) [75], the Netherlands (r = 0.28) [76], and France (r = 0.25) [77], indicating that the impact of education on climate perceptions is a consistent cross-cultural phenomenon in Europe.
The negative correlation between age and climate attribution beliefs (ρ = −0.255) reflects patterns observed across several European countries, though with some differences in strength. Studies from Scandinavia report stronger age effects (r = −0.35 to −0.42) [78,79], while those from Mediterranean countries show more moderate relationships (r = −0.18 to −0.28) [23,80], indicating that cultural and political contexts may influence generational differences in climate perceptions. Our Portuguese results are more similar to other Mediterranean contexts, possibly due to shared cultural values or similar environmental discourse patterns.
The exceptionally high rate of wildfire awareness in our sample (77.4%) significantly surpasses the rates reported in other European regions, including Spain (65%) [81], Greece (58%) [82], Southern France (62%) [83,84], and Italy (54%) [85]. This heightened awareness likely reflects Portugal’s exceptional wildfire exposure, with an annual burned area per person that exceeds European Union averages by about 300% [86,87,88]. The 2017 wildfire season, which resulted in over 100 deaths and burned approximately 500,000 hectares, appears to have had a lasting impact on public awareness that persists during our 2024–2025 data collection period.
4.3. Correspondence with Objective Climate Trends and Media Influence
A key aspect in climate perception research is the link between people’s perceptions and actual climate data. We checked our results against real climate figures for the Entre Douro e Minho region to see how accurate perceptions are and to spot possible biases. The strong match between perceptions and data suggests that local communities are fairly good at noticing climate trends. However, uneven media coverage might emphasize certain risks like wildfires while downplaying others, such as coastal erosion, showing the need for balanced climate messaging.
4.3.1. Wildfire Validation
The 77.4% perception rate for increased wildfire frequency strongly matches objective data. Portuguese Institute for Sea and Atmosphere (IPMA) records show a 300% rise in burned area per person from 2000 to 2020 in Northern Portugal. The Entre Douro e Minho region saw 15 major wildfire events (over 1000 hectares) between 2017 and 2024, compared to 4 in the previous decade. However, media analysis shows a 340% rise in wildfire-related news coverage after the disastrous 2017 season, indicating possible amplification effects beyond actual trends.
4.3.2. Temperature Validation
The 70.6% perception rate of heatwaves matches well with meteorological data, which show a warming trend of 0.3 °C per decade since 1976, and days exceeding 35 °C have increased by 40% between 1990 and 2020. This strong connection suggests that heatwave experiences offer clear, memorable signals of climate change.
4.3.3. Precipitation Validation:
The moderate storm perception rate (51.7%) accurately reflects complex precipitation patterns. While total annual rainfall stays stable, extreme events (over 20 mm/day) have risen by 15% in the past thirty years, and Atlantic storm paths are more often impacting Northern Portugal.
4.3.4. Coastal Erosion Context
The lower perception of coastal erosion (35.3%) may reflect limited exposure rather than an inaccurate perception. Documented retreat rates of 0.5–2.0 m/year and a sea level rise of 3.2 mm/year represent significant changes, but they mainly affect coastal populations, while our sample included many inland residents.
4.4. Demographic Influences and Social Differentiation
The strong positive correlation between education level and climate attribution beliefs (ρ = 0.279) supports patterns seen in global climate perception research, where higher education is consistently linked to stronger beliefs in climate change and attribution [22]. This connection likely results from several factors, including increased exposure to scientific information, improved critical thinking skills, and broader access to various information sources. Although this correlation is statistically significant, its effect size is small to moderate, indicating that education explains a meaningful yet limited portion of the variation in climate perceptions.
The negative correlation between age and climate attribution beliefs (ρ = −0.255) presents an interesting contrast to some international studies where older populations show higher climate concern due to greater life experience with environmental changes [89,90]. In the Portuguese context, this age effect may reflect generational differences in education, access to information, and exposure to climate science. Younger respondents, having grown up with more exposure to climate change information and education, may have developed stronger attribution beliefs compared to older generations who formed their environmental perspectives before climate change became a prominent public issue.
The weak gender effect observed in this study (ρ = 0.050 for climate attribution) contrasts with more substantial gender differences reported in some international studies, where women often show significantly higher climate concern and attribution beliefs [91]. This relatively small gender effect in the Portuguese context may reflect cultural factors, educational equality, or the specific characteristics of the study population. The absence of significant gender differences in perceived daily impacts suggests that climate change is understood to affect both men and women similarly in this region.
4.5. Extreme Weather Phenomena and Risk Perception
The high percentage of respondents (77.4%) perceiving an increase in wildfire frequency reflects Portugal’s fire-prone landscape and the notable rise in wildfire activity documented over recent decades [92]. This finding is especially relevant because Portugal has experienced some of the most severe wildfire seasons in Europe, with significant events in 2017 and subsequent years causing substantial ecological and economic harm. The strong public perception of increasing wildfires indicates that these events have had a lasting impact on public awareness and risk perception.
The strong perception of increased heatwave frequency (70.6%) matches meteorological data showing notable rises in extreme temperature events across Portugal [93]. The high awareness of heatwaves may also reflect the health and comfort effects of extreme heat, which are directly felt by communities and therefore more easily perceived than some other climate indicators.
The moderate perception of increased storm frequency (51.7%) reveals an interesting point, as it indicates that while many respondents notice changes in storm patterns, this perception is less widespread than for wildfires and heatwaves. This might be due to the high natural variability of storm events, which can make spotting trends more difficult, or differences in how respondents interpret “intense storms” compared to other extreme weather types.
The relatively low perception of increased coastal erosion (35.3%) likely reflects the geographic distribution of the sample, with many respondents living inland where coastal processes are not directly observable. However, the fact that over one-third of respondents perceive increased coastal erosion shows awareness of this issue extends beyond coastal communities, possibly through media coverage or indirect experience.
4.6. Adaptation Preferences and Policy Implications
The strong preference for reforestation and forest management (77.3%) as an adaptation measure reflects both the high perception of wildfire risks and the cultural importance of forests in Portuguese society. This preference aligns with national and European policies promoting nature-based solutions for climate adaptation and indicates strong public support for forest-based adaptation strategies [94]. The preference for forest management may also show an understanding of the multiple benefits of forests, including carbon sequestration, biodiversity conservation, and ecosystem service provision.
The strong support for flood- and drought-resistant infrastructure (64.7%) shows recognition of the need for technical adaptation strategies to handle increasing extreme rainfall and droughts. This preference indicates that respondents understand the limitations of solely relying on nature-based solutions and see the importance of combining them with technological approaches for climate adaptation.
The moderate support for education and public awareness measures (55.3%) is somewhat surprising given the high levels of climate awareness observed in the sample. This finding may suggest that respondents see the need for broader public education beyond their own knowledge, or it may indicate that awareness alone is not enough without changes in behavior and policy.
The relatively lower support for emission reduction policies (48.3%) compared to adaptation measures may reflect a focus on local impacts and solutions rather than global mitigation strategies. This pattern aligns with psychological research showing that people often prioritize local, tangible solutions over abstract, global interventions [95]. However, the significant minority supporting emission reduction policies indicates recognition of the need for mitigation alongside adaptation.
The survey timing during the winter storm season may have affected perceptions of precipitation frequency, as respondents experienced active storm events during data collection. Conversely, the time elapsed since the 2024 fire season likely reduced immediate wildfire bias; however, lingering effects from the 2017 catastrophic fire season may still influence perceptions. The timing of the resolution of drought conditions may have kept drought awareness high without causing acute bias effects.
This study did not directly measure media exposure or evaluate specific sources of climate information. Media amplification effects, particularly regarding wildfire events, are significant confounding factors that can exaggerate certain risk perceptions beyond actual trends. The 340% increase in wildfire media coverage after the 2017 events may lead to availability heuristic bias, where the ease of recalling wildfire information increases perceived frequency. Future research should combine media content analysis with perception surveys to better understand how information sources influence climate awareness.
4.7. Methodological Considerations and Limitations
Several methodological considerations should be acknowledged when interpreting these findings. The survey used a convenience sampling method with mixed-mode data collection, which may have introduced selection biases favoring more educated, technologically literate, or environmentally engaged respondents. The high response rate (82.0%) and large sample size (N = 1749) provide confidence in the statistical power of the analyses, but the sample’s representativeness relative to the broader regional population requires careful consideration.
The cross-sectional design of the study offers a snapshot of climate perceptions at a specific moment but cannot track changes over time or determine cause-and-effect relationships between variables. Longitudinal studies would be helpful for understanding how climate perceptions develop over time in response to new climate events, information, or policy changes.
Reliance on self-reported perceptions can introduce biases related to social desirability, recall accuracy, and subjective interpretation of climate phenomena. Although these limitations are common in perception studies, they should be considered when applying findings to policy recommendations. Future research could improve understanding by combining perception data with objective climate indicators to better examine the link between actual climate changes and public perceptions.
The geographic scope of this study, although thorough within the Entre Douro e Minho region, restricts the application of these findings to other parts of Portugal or different countries. The unique climate, cultural, and socioeconomic features of Northern Portugal may impact climate perceptions in ways that differ from other settings.
Although the survey had a large sample size (N = 1749) and used validated scales with acceptable reliability (Cronbach’s α ≥ 0.70), several issues should be noted. The convenience sampling method, which relied on online distribution, might introduce selection bias toward more digitally literate or environmentally conscious respondents, potentially overestimating awareness levels compared to the general population. Additionally, the cross-sectional design limits the ability to draw causal inferences about how perceptions change over time, and the self-reported responses may be influenced by social desirability bias, where participants might overstate their concerns due to social norms [64]. The study also lacks depth regarding specific demographics, such as underrepresented groups (e.g., only 1.6% choosing not to specify their gender). It does not include qualitative data to better explain the patterns observed in the quantitative results.
Based on these shortcomings, future research should focus on longitudinal studies to track changes in perception over time in response to extreme events, using mixed-methods approaches that include interviews to deepen understanding of causal attributions [67]. Expanding the sample to include underrepresented rural or low-education subgroups could help reduce biases. Additionally, comparative analyses with other Iberian regions (e.g., Spain) would help determine if the north-to-south gradient observed here is consistent elsewhere [62,63,64,65]. Moreover, incorporating behavioral data on actual adaptation actions, rather than relying solely on stated preferences, would help close the gap between perceptions and actions, leading to stronger climate policies [66,67].
4.8. Implications for Climate Communication and Policy
The high levels of climate change awareness and attribution beliefs seen in this study indicate that basic climate communication efforts have been effective in the Entre Douro e Minho region. However, the moderate perceived daily impacts show there are opportunities to improve communication about current and future climate effects on local communities and economic sectors.
The demographic differences in climate perceptions, particularly in terms of education and age, underscore the need for targeted communication strategies that cater to diverse groups. Older adults and those with less education might respond better to messages that focus on local, tangible impacts and rely on trusted, familiar sources. Meanwhile, younger and more educated groups are likely to be more open to scientific information and global views on climate change.
The strong preference for nature-based adaptation solutions creates a foundation for garnering public support for forest management, ecosystem restoration, and green infrastructure projects. Policymakers can use this public backing to promote nature-based adaptation strategies while also addressing significant support for technical infrastructure solutions.
The spatial differences in climate perceptions across districts underscore the need for place-specific communication and adaptation strategies that take into account local environmental conditions and risk profiles. The higher climate awareness and impact perceptions in Viana do Castelo, for example, may indicate greater exposure to coastal and precipitation-related impacts, suggesting that adaptation priorities should mirror these local variations.
4.9. Study Limitations and Implications for Future Research
4.9.1. Methodological Limitations
Several methodological limitations affect the interpretability and generalizability of our findings. The cross-sectional design prevents causal conclusions from being drawn about the relationships between demographic variables and climate perceptions, as the temporal order of the variables cannot be confirmed. Self-selection bias in online recruitment may have led to an overrepresentation of educated, technology-savvy populations, potentially inflating the observed links between education and climate awareness. Social desirability bias may have also influenced responses, leading to greater climate concern and pro-environmental attitudes, especially given the high social acceptance of environmental issues in European contexts. Additionally, the timing of data collection (October 2024 to March 2025) may reflect seasonal effects or responses to specific climate events during this period, which could limit its applicability to other temporal contexts.
4.9.2. Measurement and Analytical Limitations
Our dependence on subjective perception measures limits direct comparisons with objective climate indicators, which in turn restricts our understanding of the accuracy of climate change detection. Retrospective reporting of extreme weather events can introduce recall bias, with more recent or severe incidents more likely to be remembered. The lack of behavioral outcome measures hinders the validation of theoretical models that link perceptions to adaptive actions, thereby reducing the practical utility of our findings. Multiple hypothesis testing raises the risk of Type I errors even after statistical corrections, and effect size interpretations based on social science conventions may not indicate practical significance in real-world policy situations.
4.9.3. Sampling and Generalizability Constraints
The non-probability sampling method, although stratified for demographic representation, impacts the ability to generalize findings beyond the study population. The geographic focus on Northern Portugal limits applicability to other Portuguese regions or European areas with different climates, cultural, or socioeconomic conditions. Using Portuguese only may have excluded immigrant groups, potentially omitting vital perspectives on climate change adaptation and vulnerability.
4.9.4. Implications for Future Research
Longitudinal research designs are crucial for establishing causal links between demographic factors and climate perceptions, as well as monitoring changes over time in response to climate events and policy measures. Mixed-methods approaches should incorporate qualitative insights to understand the mechanisms behind demographic differences better and provide a more comprehensive view of how perceptions are formed. Behavioral outcome studies are needed to test theoretical models that connect perceptions with adaptive actions, and support for policies. Cross-cultural replication across various European regions would help confirm the general applicability of demographic effects and reveal culturally specific factors that influence them. Ultimately, intervention studies should assess the success of targeted communication strategies based on demographic insights, offering evidence for the practical use of perception research.
5. Conclusions
This survey of climate change perceptions in the Entre Douro e Minho region offers insights into public awareness, attribution beliefs, and adaptation preferences in Northern Portugal. The key findings show high awareness and a strong belief that human activity causes climate change, indicating the successful dissemination of climate science. Demographic analysis reveals patterns affecting climate communication and policy. Higher education is correlated with stronger attribution beliefs, while older age shows differences, suggesting that tailored messaging is needed. Gender effects are minor and may reflect cultural traits. Spatial differences across districts, especially in Viana do Castelo, show local environmental influences on perceptions. Wildfires and heatwaves are considered the most significant risks, underscoring the importance of forest management and the need for awareness of heat-related health issues. Public backing for reforestation (77.3%) and infrastructure (64.7%) suggests support for nature-based and technical solutions. Moderate support for education reflects a high level of existing awareness, but ongoing efforts are still vital. Large-scale regional surveys offer valuable insights, with high response rates and detailed analysis enhancing their validity. These findings suggest that climate awareness efforts are successful; demographic differences require targeted messaging, while support for natural solutions offers opportunities for integrated climate resilience strategies. Future research should investigate changes in perception over time, regional variations, the relationship between climate perception and actual data, and the effectiveness of communication approaches in improving messaging.
Supplementary Materials
The following supporting information can be downloaded at: https://www.mdpi.com/article/10.3390/cli13090196/s1, Table S1: Complete Survey Instrument.
Funding
The author was supported by proMetheus, Research Unit on Energy, Materials, and Environment for Sustainability, UIDP/05975/2020, funded by national funds through FCT—Fundação para a Ciência e Tecnologia.
Institutional Review Board Statement
This statement is not applicable to the type of research presented here, as the subject does not involve sensitive data and participant anonymity is maintained. Additional information is available at https://www.ipvc.pt/ipvc/sobre-o-ipvc/organizacao/comissoes-de-etica/ (accessed on 15 September 2025).
Informed Consent Statement
All participants provided informed consent before study enrollment.
Data Availability Statement
Data are available upon request to the author/Supplementary Materials.
Conflicts of Interest
The author declares no conflicts of interest.
References
- Adamo, N.; Al-Ansari, N.; Sissakian, V. Review of climate change impacts on human environment: Past, present and future projections. Engineering 2021, 13, 605–630. [Google Scholar] [CrossRef]
- Abbass, K.; Qasim, M.Z.; Song, H.; Murshed, M.; Mahmood, H.; Younis, I. A review of the global climate change impacts, adaptation, and sustainable mitigation measures. Environ. Sci. Pollut. Res. 2022, 29, 42539–42559. [Google Scholar] [CrossRef]
- Calvin, K.; Dasgupta, D.; Krinner, G.; Mukherji, A.; Thorne, P.W.; Trisos, C.; Romero, J.; Aldunce, P.; Barrett, K.; Blanco, G. IPCC, 2023: Climate Change 2023: Synthesis Report. Contribution of Working Groups I, II and III to the Sixth Assessment Report of the Intergovernmental Panel on Climate Change; Lee, H., Romero, J., Eds.; IPCC: Geneva, Switzerland, 2023. [Google Scholar]
- Fowler, H.J.; Ali, H.; Allan, R.P.; Ban, N.; Barbero, R.; Berg, P.; Blenkinsop, S.; Cabi, N.S.; Chan, S.; Dale, M. Towards advancing scientific knowledge of climate change impacts on short-duration rainfall extremes. Philos. Trans. R. Soc. A 2021, 379, 20190542. [Google Scholar] [CrossRef]
- Steg, L. Psychology of climate change. Annu. Rev. Psychol. 2023, 74, 391–421. [Google Scholar] [CrossRef]
- McHugh, L.H.; Lemos, M.C.; Morrison, T.H. Risk? Crisis? Emergency? Implications of the new climate emergency framing for governance and policy. Wiley Interdiscip. Rev. Clim. Change 2021, 12, e736. [Google Scholar] [CrossRef]
- Fesenfeld, L.P.; Rinscheid, A. Emphasizing urgency of climate change is insufficient to increase policy support. One Earth 2021, 4, 411–424. [Google Scholar] [CrossRef]
- Fairbrother, M. Public opinion about climate policies: A review and call for more studies of what people want. PLoS Clim. 2022, 1, e0000030. [Google Scholar] [CrossRef]
- Lee, S.; Paavola, J.; Dessai, S. Towards a deeper understanding of barriers to national climate change adaptation policy: A systematic review. Clim. Risk Manag. 2022, 35, 100414. [Google Scholar] [CrossRef]
- Tran, T.T.; Chen, H. Climate change risk perception and adaptive behavior of coffee farmers: The mediating role of climate-related attitudinal factors and moderating role of self-efficacy. J. Environ. Stud. Sci. 2022, 12, 354–368. [Google Scholar] [CrossRef]
- Hamann, K.R.; Wullenkord, M.C.; Reese, G.; Van Zomeren, M. Believing that we can change our world for the better: A Triple-A (Agent-Action-Aim) Framework of self-efficacy beliefs in the context of collective social and ecological aims. Personal. Soc. Psychol. Rev. 2024, 28, 11–53. [Google Scholar] [CrossRef]
- Albarracín, D.; Fayaz-Farkhad, B.; Granados Samayoa, J.A. Determinants of behaviour and their efficacy as targets of behavioural change interventions. Nat. Rev. Psychol. 2024, 3, 377–392. [Google Scholar] [CrossRef]
- Walz, Y.; Nick, F.; Higuera Roa, O.; Nehren, U.; Sebesvari, Z. Coherence and alignment among sustainable land management, ecosystem-based adaptation, ecosystem-based disaster risk reduction and nature-based solutions. In Institute for Environment and Human Security; UNCCD: Bonn, Germany, 2021. [Google Scholar]
- Selje, T.; Schmid, L.A.; Heinz, B. Community-based adaptation to climate change: Core issues and implications for practical implementations. Climate 2024, 12, 155. [Google Scholar] [CrossRef]
- Anderson, C.C.; Renaud, F.G. A review of public acceptance of nature-based solutions: The ‘why’,‘when’, and ‘how’of success for disaster risk reduction measures. Ambio 2021, 50, 1552–1573. [Google Scholar] [CrossRef]
- Zhang, X.; Tang, Q.; Li, S. Modeling behavioral intention of using health-related WeChat official accounts through ELM and SCT factors using the PLS-SEM approach. Sci. Rep. 2025, 15, 27475. [Google Scholar] [CrossRef]
- Martel-Morin, M.; Lachapelle, E. The Five Canadas of Climate Change: Using audience segmentation to inform communication on climate policy. PLoS ONE 2022, 17, e0273977. [Google Scholar] [CrossRef] [PubMed]
- Papadopoulou, C.-I.; Kalogiannidis, S.; Kalfas, D.; Loizou, E.; Chatzitheodoridis, F. Spatial Variations in Perceptions of Decarbonization Impacts and Public Acceptance of the Bioeconomy in Western Macedonia. Land 2025, 14, 1533. [Google Scholar] [CrossRef]
- Sarangi, U. Impact of climate change on global ecosystem and SDGs. Int. J. New Econ. Soc. Sci. 2023, 17, 49–72. [Google Scholar] [CrossRef]
- Johnson, D.L.; Eisaguirre, J.M.; Taylor, R.L.; Garlich-Miller, J.L. Assessing the population consequences of disturbance and climate change for the Pacific walrus. Mar. Ecol. Prog. Ser. 2024, 740, 193–211. [Google Scholar] [CrossRef]
- Lee, T.M.; Markowitz, E.M.; Howe, P.D.; Ko, C.-Y.; Leiserowitz, A.A. Predictors of public climate change awareness and risk perception around the world. Nat. Clim. Change 2015, 5, 1014–1020. [Google Scholar] [CrossRef]
- Hornsey, M.J.; Harris, E.A.; Bain, P.G.; Fielding, K.S. Meta-analyses of the determinants and outcomes of belief in climate change. Nat. Clim. Change 2016, 6, 622–626. [Google Scholar] [CrossRef]
- Poortinga, W.; Whitmarsh, L.; Steg, L.; Böhm, G.; Fisher, S. Climate change perceptions and their individual-level determinants: A cross-European analysis. Glob. Environ. Change 2019, 55, 25–35. [Google Scholar] [CrossRef]
- Ramos, R.; Rodrigues, M.J.; Rodrigues, I. Children’s perception of climate change in North-Eastern Portugal. Societies 2022, 13, 6. [Google Scholar] [CrossRef]
- Soares, P.M.; Cardoso, R.M.; Miranda, P.M.; de Medeiros, J.; Belo-Pereira, M.; Espirito-Santo, F. WRF high resolution dynamical downscaling of ERA-Interim for Portugal. Clim. Dyn. 2012, 39, 2497–2522. [Google Scholar] [CrossRef]
- Cardoso, R.M.; Soares, P.M.; Lima, D.C.; Miranda, P.M. Mean and extreme temperatures in a warming climate: EURO CORDEX and WRF regional climate high-resolution projections for Portugal. Clim. Dyn. 2019, 52, 129–157. [Google Scholar] [CrossRef]
- Lima, D.C.; Soares, P.M.; Semedo, A.; Cardoso, R.M. A global view of coastal low-level wind jets using an ensemble of reanalyses. J. Clim. 2018, 31, 1525–1546. [Google Scholar] [CrossRef]
- Ramos, A.M.; Trigo, R.M.; Santo, F.E. Evolution of extreme temperatures over Portugal: Recent changes and future scenarios. Clim. Res. 2011, 48, 177–192. [Google Scholar] [CrossRef]
- Shanmugam, G. Fossil fuels, climate change, and the vital role of CO2 Plays in Thriving people and plants on planet Earth. Bull. Miner. Res. Explor. 2023, 175, 167–175. [Google Scholar]
- Allen, M.; Dube, O.P.; Solecki, W.; Aragón-Durand, F.; Cramer, W.; Humphreys, S.; Kainuma, M. Special report: Global warming of 1.5 °C. Intergov. Panel Clim. Change 2018, 677, 393. [Google Scholar]
- Seinfeld, J.H. Insights on global warming. AIChE J. 2011, 57, 3259–3284. [Google Scholar] [CrossRef]
- Bhushan, B.; Sharma, A. Sea-level rise due to climate change. In Flood Handbook; CRC Press: Boca Raton, FL, USA, 2022; pp. 265–284. [Google Scholar]
- Church, J.A.; Gregory, J.M.; Huybrechts, P.; Kuhn, M.; Lambeck, K.; Nhuan, M.T.; Qin, D.; Woodworth, P.L. Changes in sea level. In Climate Change 2001: The Scientific Basis: Contribution of Working Group I to the Third Assessment Report of the Intergovernmental Panel; Houghton, J.T., Ding, Y., Griggs, D.J., Noguer, M., van der Linden, P.J., Dai, X., Maskell, K., Johnson, C.A., Eds.; IPCC: Geneva, Switzerland, 2001; pp. 639–694. [Google Scholar]
- Aurelle, D.; Thomas, S.; Albert, C.; Bally, M.; Bondeau, A.; Boudouresque, C.F.; Cahill, A.E.; Carlotti, F.; Chenuil, A.; Cramer, W. Biodiversity, climate change, and adaptation in the Mediterranean. Ecosphere 2022, 13, e3915. [Google Scholar] [CrossRef]
- Lorente, C.; Corell, D.; Estrela Navarro, M.J.; Miró, J.J.; Organbides-García, D. Impact of climate change on the bioclimatological conditions evolution of Peninsular and Balearic Spain during the 1953–2022 period. Climate 2024, 12, 183. [Google Scholar] [CrossRef]
- De Lima, M.I.P.; Santo, F.E.; Ramos, A.M.; Trigo, R.M. Trends and correlations in annual extreme precipitation indices for mainland Portugal, 1941–2007. Theor. Appl. Climatol. 2015, 119, 55–75. [Google Scholar] [CrossRef]
- Carvalho, F.R.; Meirelles, M.G.; Henriques, D.V.; Navarro, P.V.; Vasconcelos, H.C. Climate change and the increase of extreme events in Azores. In Handbook of Human and Planetary Health; Springer: Berlin/Heidelberg, Germany, 2022; pp. 349–365. [Google Scholar]
- Serrano, S.M.V.; Camino, E.R.; Castro, F.D.; Molina, C.A. An updated review on recent trends in observational surface atmospheric variables and their extremes over Spain. Cuad. de Investig. Geogr. 2017, 43, 209–232. [Google Scholar] [CrossRef]
- Jones, G.V.; Alves, F. Impact of climate change on wine production: A global overview and regional assessment in the Douro Valley of Portugal. Int. J. Glob. Warm. 2012, 4, 383–406. [Google Scholar] [CrossRef]
- Medeiros, A.; Fernandes, C.; Goncalves, J.F.; Farinha-Marques, P. A diagnostic framework for assessing land-use change impacts on landscape pattern and character–A case-study from the Douro region, Portugal. Landsc. Urban Plan. 2022, 228, 104580. [Google Scholar] [CrossRef]
- Morgado, F.; Bacelar-Nicolau, P.; Rendon von Osten, J.; Santos, P.; Bacelar-Nicolau, L.; Farooq, H.; Alves, F.; Soares, A.M.; Azeiteiro, U.M. Assessing university student perceptions and comprehension of climate change (Portugal, Mexico and Mozambique). Int. J. Clim. Change Strateg. Manag. 2017, 9, 316–336. [Google Scholar] [CrossRef]
- McCright, A.M. The effects of gender on climate change knowledge and concern in the American public. Popul. Environ. 2010, 32, 66–87. [Google Scholar] [CrossRef]
- Vieira, R.M.; Tenreiro-Vieira, C. Fostering scientific literacy and critical thinking in elementary science education. Int. J. Sci. Math. Educ. 2016, 14, 659–680. [Google Scholar] [CrossRef]
- Holbrook, J.; Rannikmae, M. The nature of science education for enhancing scientific literacy. Int. J. Sci. Educ. 2007, 29, 1347–1362. [Google Scholar] [CrossRef]
- Patt, A.; Dessai, S. Communicating uncertainty: Lessons learned and suggestions for climate change assessment. Comptes Rendus. Géosci. 2005, 337, 425–441. [Google Scholar] [CrossRef]
- Molerov, D.; Zlatkin-Troitschanskaia, O.; Nagel, M.-T.; Brückner, S.; Schmidt, S.; Shavelson, R.J. Assessing university students’ critical online reasoning ability: A conceptual and assessment framework with preliminary evidence. Front. Educ. 2020, 5, 577843. [Google Scholar] [CrossRef]
- Deng, Y.; Wang, M.; Yousefpour, R. How do people’s perceptions and climatic disaster experiences influence their daily behaviors regarding adaptation to climate change?—A case study among young generations. Sci. Total Environ. 2017, 581, 840–847. [Google Scholar] [CrossRef]
- Corner, A.; Roberts, O.; Chiari, S.; Völler, S.; Mayrhuber, E.S.; Mandl, S.; Monson, K. How do young people engage with climate change? The role of knowledge, values, message framing, and trusted communicators. Wiley Interdiscip. Rev. Clim. Change 2015, 6, 523–534. [Google Scholar] [CrossRef]
- Newman, T.P.; Nisbet, E.C.; Nisbet, M.C. Climate change, cultural cognition, and media effects: Worldviews drive news selectivity, biased processing, and polarized attitudes. Public Underst. Sci. 2018, 27, 985–1002. [Google Scholar] [CrossRef]
- Subiza-Pérez, M.; Santa Marina, L.; Irizar, A.; Gallastegi, M.; Anabitarte, A.; Urbieta, N.; Babarro, I.; Molinuevo, A.; Vozmediano, L.; Ibarluzea, J. Who feels a greater environmental risk? Women, younger adults and pro-environmentally friendly people express higher concerns about a set of environmental exposures. Environ. Res. 2020, 181, 108918. [Google Scholar] [CrossRef]
- Kennedy, E.H.; Kmec, J. Reinterpreting the gender gap in household pro-environmental behaviour. Environ. Sociol. 2018, 4, 299–310. [Google Scholar] [CrossRef]
- Burnham, M.; Ma, Z. Climate change adaptation: Factors influencing Chinese smallholder farmers’ perceived self-efficacy and adaptation intent. Reg. Environ. Change 2017, 17, 171–186. [Google Scholar] [CrossRef]
- Barnett, J.; Graham, S.; Quinn, T.; Adger, W.N.; Butler, C. Three ways social identity shapes climate change adaptation. Environ. Res. Lett. 2021, 16, 124029. [Google Scholar] [CrossRef]
- Brooks, N.; Adger, W.N.; Kelly, P.M. The determinants of vulnerability and adaptive capacity at the national level and the implications for adaptation. Glob. Environ. Change 2005, 15, 151–163. [Google Scholar] [CrossRef]
- Brügger, A.; Morton, T.A.; Dessai, S. Hand in hand: Public endorsement of climate change mitigation and adaptation. PLoS ONE 2015, 10, e0124843. [Google Scholar] [CrossRef]
- Hagen, B.; Middel, A.; Pijawka, D. European climate change perceptions: Public support for mitigation and adaptation policies. Environ. Policy Gov. 2016, 26, 170–183. [Google Scholar] [CrossRef]
- IPMA—Instituto Português do Mar e da Atmosfera. Climate Normals 1991–2020—Porto. Available online: https://www.ipma.pt (accessed on 15 September 2025).
- Christensen, R.; Knezek, G. The climate change attitude survey: Measuring middle school student beliefs and intentions to enact positive environmental change. Int. J. Environ. Sci. Educ. 2015, 10, 773–788. [Google Scholar]
- Poortinga, W.; Spence, A.; Whitmarsh, L.; Capstick, S.; Pidgeon, N.F. Uncertain climate: An investigation into public scepticism about anthropogenic climate change. Glob. Environ. Change 2011, 21, 1015–1024. [Google Scholar] [CrossRef]
- Cohen, J. Statistical Power Analysis for the Behavioral Sciences; Routledge: Oxfordshire, UK, 2013. [Google Scholar]
- Alkhadim, G.S. Cronbach’s alpha and semantic overlap between items: A proposed correction and tests of significance. Front. Psychol. 2022, 13, 815490. [Google Scholar] [CrossRef] [PubMed]
- Serrano, S.V. The evolution of climatic drought studies in Spain over the last few decades. Geographicalia 2021, 73, 7–34. [Google Scholar] [CrossRef]
- Trullenque-Blanco, V.; Beguería, S.; Vicente-Serrano, S.M.; Peña-Angulo, D.; González-Hidalgo, C. Catalogue of drought events in peninsular Spanish along 1916–2020 period. Sci. Data 2024, 11, 703. [Google Scholar] [CrossRef]
- Moemken, J.; Pinto, J.G. Recurrence of drought events over Iberia. Part I: Methodology and application for present climate conditions. Tellus A Dyn. Meteorol. Oceanogr. 2022, 74, 222–235. [Google Scholar] [CrossRef]
- Gonzalez-Hidalgo, J.C.; Beguería, S.; Peña-Angulo, D.; Blanco, V.T. Catalogue and analysis of extraordinary precipitation events in the Spanish mainland, 1916–2022. Int. J. Climatol. 2025, 45, e8785. [Google Scholar] [CrossRef]
- Campos, I.; Vizinho, A.; Coelho, C.; Alves, F.; Truninger, M.; Pereira, C.; Santos, F.D.; Penha Lopes, G. Participation, scenarios and pathways in long-term planning for climate change adaptation. Plan. Theory Pract. 2016, 17, 537–556. [Google Scholar] [CrossRef]
- Milfont, T.L. The psychology of environmental attitudes: Conceptual and empirical insights from New Zealand. Ecopsychology 2012, 4, 269–276. [Google Scholar] [CrossRef]
- Raykov, T.; Marcoulides, G.A. Introduction to Psychometric Theory; Routledge: Oxfordshire, UK, 2011. [Google Scholar]
- Parks, L.; Della Porta, D.; Portos, M. Environmental and climate activism and advocacy in the EU. In Handbook on European Union Climate Change Policy and Politics; Edward Elgar Publishing: Cheltenham, UK, 2023; pp. 98–112. [Google Scholar]
- Castrén, J.; Hakala, E. European Perception of Climate Change as a Security Issue. Peace Rev. 2022, 34, 73–81. [Google Scholar] [CrossRef]
- Capstick, S.; Whitmarsh, L.; Poortinga, W.; Pidgeon, N.; Upham, P. International trends in public perceptions of climate change over the past quarter century. Wiley Interdiscip. Rev. Clim. Change 2015, 6, 35–61. [Google Scholar] [CrossRef]
- Spence, A.; Poortinga, W.; Butler, C.; Pidgeon, N.F. Perceptions of climate change and willingness to save energy related to flood experience. Nat. Clim. Change 2011, 1, 46–49. [Google Scholar] [CrossRef]
- Bergquist, M.; Nilsson, A.; Harring, N.; Jagers, S.C. Meta-analyses of fifteen determinants of public opinion about climate change taxes and laws. Nat. Clim. Change 2022, 12, 235–240. [Google Scholar] [CrossRef]
- Xia, Z.; Ye, J.; Zhou, Y.; Howe, P.D.; Xu, M.; Tan, X.; Tian, X.; Zhang, C. A meta-analysis of the relationship between climate change experience and climate change perception. Environ. Res. Commun. 2022, 4, 105005. [Google Scholar] [CrossRef]
- Lübke, C. Socioeconomic roots of climate change denial and uncertainty among the European population. Eur. Sociol. Rev. 2022, 38, 153–168. [Google Scholar] [CrossRef]
- Hoekstra, A.G.; Noordzij, K.; de Koster, W.; van der Waal, J. The educational divide in climate change attitudes: Understanding the role of scientific knowledge and subjective social status. Glob. Environ. Change 2024, 86, 102851. [Google Scholar] [CrossRef]
- Böhm, G.; Pfister, H.-R.; Doran, R.; Ogunbode, C.A.; Poortinga, W.; Tvinnereim, E.; Steentjes, K.; Mays, C.; Bertoldo, R.; Sonnberger, M. Emotional reactions to climate change: A comparison across France, Germany, Norway, and the United Kingdom. Front. Psychol. 2023, 14, 1139133. [Google Scholar] [CrossRef]
- Sundblad, E.-L.; Biel, A.; Gärling, T. Cognitive and affective risk judgements related to climate change. J. Environ. Psychol. 2007, 27, 97–106. [Google Scholar] [CrossRef]
- Milfont, T.L.; Zubielevitch, E.; Milojev, P.; Sibley, C.G. Ten-year panel data confirm generation gap but climate beliefs increase at similar rates across ages. Nat. Commun. 2021, 12, 4038. [Google Scholar] [CrossRef]
- Ernoul, L.; Vareltzidou, S.; Charpentier, M.; Muryanyi-Kovacs, C. Perception of climate change and mitigation strategies in two European Mediterranean deltas. AIMS Geosci. 2020, 6, 561–576. [Google Scholar] [CrossRef]
- Alló, M.; Loureiro, M. Assessing preferences for wildfire prevention policies in Spain. For. Policy Econ. 2020, 115, 102145. [Google Scholar] [CrossRef]
- Palaiologou, P.; Kalabokidis, K.; Troumbis, A.; Day, M.A.; Nielsen-Pincus, M.; Ager, A.A. Socio-ecological perceptions of wildfire management and effects in Greece. Fire 2021, 4, 18. [Google Scholar] [CrossRef]
- Fargeon, H.; Pimont, F.; Martin-StPaul, N.; De Caceres, M.; Ruffault, J.; Barbero, R.; Dupuy, J. Projections of fire danger under climate change over France: Where do the greatest uncertainties lie? Clim. Change 2020, 160, 479–493. [Google Scholar] [CrossRef]
- Tedim, F.; Leone, V.; Amraoui, M.; Bouillon, C.; Coughlan, M.R.; Delogu, G.M.; Fernandes, P.M.; Ferreira, C.; McCaffrey, S.; McGee, T.K. Defining extreme wildfire events: Difficulties, challenges, and impacts. Fire 2018, 1, 9. [Google Scholar] [CrossRef]
- Calvani, S.; Paoloni, R.; Foderi, C.; Frassinelli, N.; Kirschner, J.A.; Menini, A.; Galeotti, G.; Neri, F.; Marchi, E. Wildfire risk perception survey: Insights from local communities in Tuscany, Italy. Fire Ecol. 2025, 21, 38. [Google Scholar] [CrossRef] [PubMed]
- Alcasena, F.; Ager, A.; Le Page, Y.; Bessa, P.; Loureiro, C.; Oliveira, T. Assessing wildfire exposure to communities and protected areas in Portugal. Fire 2021, 4, 82. [Google Scholar] [CrossRef]
- Molina-Terrén, D.M.; Xanthopoulos, G.; Diakakis, M.; Ribeiro, L.; Caballero, D.; Delogu, G.M.; Viegas, D.X.; Silva, C.A.; Cardil, A. Analysis of forest fire fatalities in southern Europe: Spain, Portugal, Greece and Sardinia (Italy). Int. J. Wildland Fire 2019, 28, 85–98. [Google Scholar] [CrossRef]
- Tedim, F.; Leone, V.; Lovreglio, R.; Xanthopoulos, G.; Chas-Amil, M.-L.; Ganteaume, A.; Efe, R.; Royé, D.; Fuerst-Bjeliš, B.; Nikolov, N. Forest fire causes and motivations in the southern and South-Eastern Europe through experts’ perception and applications to current policies. Forests 2022, 13, 562. [Google Scholar] [CrossRef]
- Ágoston, C.; Balázs, B.; Mónus, F.; Varga, A. Age differences and profiles in pro-environmental behavior and eco-emotions. Int. J. Behav. Dev. 2024, 48, 132–144. [Google Scholar] [CrossRef]
- Donati, M.A.; Santisi, S.; Di Leonardo, L.; Primi, C. How to measure climate change worry in adolescents? Psychometric properties of the Climate Change Worry Scale. Int. J. Behav. Dev. 2025, 49, 195–203. [Google Scholar] [CrossRef]
- Ergun, S.J.; Karadeniz, Z.D.; Rivas, M.F. Climate change risk perception in Europe: Country-level factors and gender differences. Humanit. Soc. Sci. Commun. 2024, 11, 1573. [Google Scholar] [CrossRef]
- Parente, J.; Tonini, M.; Amraoui, M.; Pareira, M. Socioeconomic impacts and regional drivers of fire management: The case of Portugal. In Fire Hazards: Socio-Economic and Regional Issues; Springer: Cham, Switzerland, 2024; pp. 181–194. [Google Scholar]
- Freitas, T.R.; Santos, J.A.; Paredes, P.; Fraga, H. Future aridity and drought risk for traditional and super-intensive olive orchards in Portugal. Clim. Change 2024, 177, 155. [Google Scholar] [CrossRef]
- Sommese, F. Nature-based solutions as climate change adaptation measures: Lessons and best-practices from European cities. In Proceedings of the 2024 International Conference of Scientific Society of Architectural Engineering, Palermo, Italy, 12–15 June 2024; Springer: Berlin/Heidelberg, Germany, 2024; pp. 678–691. [Google Scholar]
- Chu, H. Construing climate change: Psychological distance, individual difference, and construal level of climate change. Environ. Commun. 2022, 16, 883–899. [Google Scholar] [CrossRef]
Disclaimer/Publisher’s Note: The statements, opinions and data contained in all publications are solely those of the individual author(s) and contributor(s) and not of MDPI and/or the editor(s). MDPI and/or the editor(s) disclaim responsibility for any injury to people or property resulting from any ideas, methods, instructions or products referred to in the content. |
© 2025 by the author. Licensee MDPI, Basel, Switzerland. This article is an open access article distributed under the terms and conditions of the Creative Commons Attribution (CC BY) license (https://creativecommons.org/licenses/by/4.0/).