Abstract
In rainfed areas, precipitation variations directly impact wheat growth stages such as emergence, tillering, jointing and booting, and maturity. Evaluating the impact of climate change on precipitation patterns during these critical growth stages is crucial for adapting climate change and ensuring global food security. In this study, projections of five General Circulation models (GCMs) under two shared socioeconomic pathways (SSPs) were used to predict the changing characteristics of precipitation during four main growth stages of wheat in the rainfed region of the Pothwar Plateau, Pakistan. Historical datasets of daily precipitation at six weather stations were analyzed to check the past changes in the precipitation patterns. During the baseline period (1985–2014), the annual average precipitation decreased at a rate of −9.75 mm/decade, while the amount of precipitation during the rabi season (wheat-growing season) decreased at a rate of −20.47 mm/decade. An increase in the precipitation was found during the fourth (flowering) stage of crop growth, while the first three stages experienced a decrease in the precipitation amount. The multimodal ensembled data, under the SSP2-4.5 scenario, revealed a significant decline (at the rate of −16.63 mm/decade) in the future annual precipitation. However, it is projected that, under SSP2-4.5, there may be a slight increase (4.03 mm/decade) in the total precipitation amount during the future rabi season. Under the SSP5-8.5 scenario, average annual precipitation exhibited a slightly increasing trend, increasing by 1.0 mm/decade. However, during the rabi season, there was a possibility of a decrease in precipitation amount, with a rate of 11.64 mm/decade. It is also expected that the precipitation amount may vary significantly during the crown root initiation, jointing and booting, and flowering stages in the near future. These results provide a framework for the planning of wheat production in the Pothwar region of Pakistan, taking into account the potential impact of shifting weather patterns, particularly in terms of uneven precipitation.
1. Introduction
Climate change poses a serious threat to the world’s food security. It will particularly impact rainfed agriculture, a food supply source for millions of people [1,2]. Plant development relies heavily on the amount of precipitation, as this directly impacts the moisture levels in the soil. Adequate soil moisture is essential for plants to effectively absorb nutrients and carry out the process of photosynthesis. Consistent and plentiful precipitation is essential for the healthy growth of plants. On the other hand, irregular and insufficient precipitation can lead to stress in crops and a reduction in their overall yield. Crop water scarcity is increasing due to changes in the natural cycles of water availability caused by rising temperatures and unexpected precipitation patterns [3]. This is a serious problem for regions where agricultural development is mainly dependent on precipitation.
According to the IPCC (Intergovernmental Panel on Climate Change), agricultural productivity in low-latitude nations is going to decrease as a result of climate change. However, in northern latitudes, the effects of climate change on crop production may be either positive or negative [4]. While certain high-latitude areas may have improved climatic conditions for growing crops, the long-term growth in agricultural productivity in these regions may be limited by factors such as water availability and soil health. It was predicted that, in comparison to a scenario in which the temperature remains unchanged, the yield of wheat and rice may decrease globally by 17% by 2050, based on the climatic models under the maximum warming scenario [5]. Several previous studies have reported the effect of changing precipitation patterns on agricultural water availability, specifically in rainfed agricultural regions [6,7,8]. According to the findings of Kotz et al. [9], changing weather characteristics have the potential to affect the global as well as regional economies. According to findings of Nie et al. [10], the main factor that is limiting crop growth in China’s Yanhuai basin is the unpredictable and uneven distribution of precipitation. The changes in precipitation characteristics affect crop production in addition to altering sowing patterns and making crops more susceptible to pests and diseases.
Wheat (Triticum aestivum L.) is an important cereal food crop, fulfilling 20% of the world’s food demand [11]. Rising air temperatures and variations in precipitation are anticipated to be the primary factors that will significantly affect global wheat crop during the next few decades [12]. Particularly in rainfed agricultural regions, wheat crop is highly susceptible to changes in precipitation patterns. According to the findings of a study that was conducted by Azmat et al. [13], changes in precipitation have a substantial impact on wheat production in the highland rainfed regions. They found that both excessive and inadequate precipitation led to decreased productivity. Bannayan and Rezaei [14] highlighted the susceptibility of rainfed wheat to climatic variability in Iran by concluding that drought stress during the critical growth stages can drastically reduce wheat yields. In a recent study, it was concluded that the climate change accounts for 28–63% of the variation in wheat yield anomalies in Europe [15]. The effect of climatic change on the yield of wheat crops in the Tibetan Plateau was investigated in a recent study [16]. The results showed that from 1961 to 2017, the Tibetan Plateau—one of China’s most vulnerable regions to global warming—experienced an annual increase in air temperature of 0.32 °C/decade. This trend is expected to continue until 2050; with adequate irrigation, this change could increase winter wheat yields by 81%. These findings highlight both the potential risks and benefits of agricultural adaptation.
In Pakistan, wheat is grown over about nine million hectares, or about 40% of total agricultural land of the country [17,18]. About 37% of food demand of the country is being fulfilled by this crop [13], which is more nutritional than the majority of other grains and foods. Wheat is a rabi season crop and sown in Pakistan from October to December, and it is harvested from April to May. The rising temperatures across southern areas of Pakistan will likely decrease wheat crop yield by shortening the crop lifecycle [19,20]. Therefore, it is expected that the southern parts of the country may eventually become unsuitable for wheat production. Under this context, expanding cultivation in the northwestern and midwestern regions can help mitigate the impact of climate change on wheat crop in Pakistan [17]. Wheat crop requires from four to five irrigations at various growth stages because of the high temperatures in the region. The first irrigation is given by 20–25 days after sowing and substitute irrigations provided with the interval of 25–30 days. In this region, the reproductive stages of the wheat crop, namely crown root initiation (Stage-1), tillering (Stage-2), jointing and booting (Stage-3), and flowering (Stage-4), are extremely vulnerable to water stress. Inadequate irrigation and a lack of precipitation can negatively affect crop growth during these stages, which will ultimately result in a decrease of crop yield. Over the growth season, wheat in the semi-arid region of Punjab, Pakistan, requires about 325–450 mm of water [21], whereas across the entire country, wheat crop water requirement varies from 180 to 450 mm [22], and in the Pothwar region, wheat requires about 330 mm of water [23]. Precipitation distribution in the rabi season is very critical for wheat crop production, particularly in the rainfed areas of Pakistan. Therefore, comprehensive understanding of the interannual and seasonal precipitation characteristics is very important for sustainable food production in the rainfed agricultural regions.
As a result of ongoing global warming, the crop production in the Pothwar Plateau of Pakistan is also being affected. The production of wheat in this important agricultural region contributes significantly to the nation’s food supply chain. Nevertheless, the cultivation of crops in this plateau relies mainly on precipitation, especially during the rabi cropping season (November–April). To ensure not only Pakistan’s food security but also to contribute to the stability of the global food chain, it is essential to have a solid understanding of how climate change may alter the patterns of precipitation in this region.
Several researchers have previously assessed the impact of climate change on wheat production in Pakistan, including different aspects such as phenology, grain composition and quality, and overall yield [13,24,25]. However, there has been no study focused on analyzing the spatiotemporal changes in precipitation patterns during the key growth stages of the wheat crop. Previous studies of climate change in the Pothwar Plateau, such as those by Ahmad et al. [22] and Hussain et al. [24], have documented the spatial and temporal variability of precipitation in the region. Recent research indicated a declining trend in the annual average precipitation over the plateau [23]. Analysis showed that the majority of precipitation (about 70%) occurred during the monsoon season (from July to August), while only about 20% fell during the wheat-growing season (rabi season) [25]. The primary challenge for crop growth in the Pothwar Plateau was the unpredictable and inconsistent distribution of rainfall. The unequal distribution of precipitation during different growth phases of the rabi wheat crop negatively impacted its yield potential. Therefore, it was crucial to characterize and describe the attributes of precipitation specifically during the rabi season in the Pothwar Plateau.
While previous studies [23,25,26] have primarily focused on the spatiotemporal distribution of precipitation across the Pothwar Plateau, there is a lack of detailed information regarding rainfall patterns during the different growth stages of rabi wheat. The current evidence is insufficient to guide sustainable wheat production in the rainfed Pothwar Plateau. Moreover, previous studies have assessed the climate change in the Pothwar Plateau using the projections of the general circulation models (GCMs) from the coupled model intercomparison project phase 5 (CMIP5). This study aimed to fill this gap by examining the changes in historical (1985–2014) and future (2021–2050) precipitation in relation to the main growth stages of the wheat crop. Additionally, we projected spatiotemporal changes in total precipitation during the rabi season and on an annual scale using the projections of the CMIP6 GCMs.
2. Materials and Methods
2.1. Study Area
The Pothwar Plateau is surrounded in the south by the Himalayan Salt Range, in the north by the Hazara Hills, in the west by the Indus River, and in the east by the Jhelum River. The landscape of the plateau is regarded as undulating, with an average slope of 8–40%. This plateau is situated between 32.0° N and 34.0° N Latitude and between 71.5° E and 74.0° E Longitude. It covers an area of around 22,254.0 Km2 and has a population of over 17,464,800. The elevation in the plateau varies between 300 and 2300 m and consists of residual hills and hillocks that were produced by glacier debris during the Ice Age. Figure 1 displays the geographical location and topography of the plateau and the location of the weather stations considered for this study.
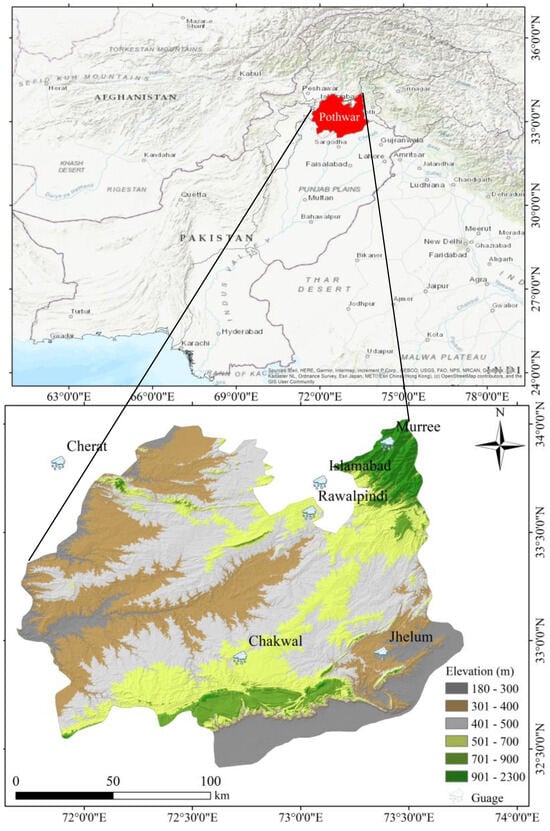
Figure 1.
Location map of the Pothwar Plateau and the considered weather stations.
The main crop of this rainfed plateau is wheat, followed by barley and sorghum. The annual average precipitation across the plateau varies between 589 and 1682 mm. The amount of annual average precipitation varies greatly from the northeast to south direction. Figure 2 displays the spatial variability of annual average precipitation across the Pothwar Plateau. It is well documented that precipitation is the major source of water for crop production in this region. Historical variations in the patterns of precipitation have led to changes in wheat productivity in the Pothwar Plateau. There has been a general downward trend in wheat yields in the region over the past few decades, according to historical statistics. This is mostly attributable to the fact that rainfall has been inconsistent during the wheat-growing season. For instance, studies conducted by Ahmad et al. [22] and Hussain et al. [24] have emphasized that wheat yields have been adversely affected by prolonged dry spells and erratic precipitation in this region.
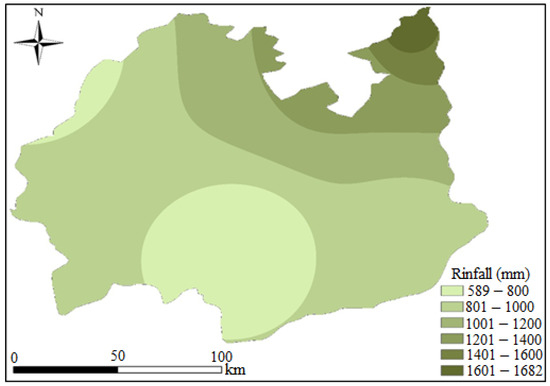
Figure 2.
Spatial variability of annual average precipitation over the Pothwar region of Pakistan.
2.2. Data Acquisition
2.2.1. Observed Data
The daily observed data of precipitation and temperature were acquired from the Pakistan Metrological Department (PMD) and the Soil and Water Conservation Research Institute (SWCRI), Chakwal, Pakistan. In this region, PMD has installed and managed five weather stations (Cherat, Islamabad, Jhelum, Murree, and Rawalpindi), while the SWCRI is responsible for recording and maintaining one weather station (Chakwal). Both organizations have been following the standard guidelines of the WMO (World Meteorological Organization) for the recording and maintenance of weather data. The historical (1985–2014) daily observed data of key climatic variables (precipitation and temperature), at the above-mentioned stations, were obtained from both of the organizations. The salient features of weather stations are given in Table 1.

Table 1.
Salient features of the weather stations.
2.2.2. Model Data
For the future prediction of precipitation, from 2021 to 2050, the outputs of five GCMs (General Circulation Models) of Coupled Model Intercomparison Project Phase 6 (CMIP6), under two future scenarios (SSP2-4.5 and SSP5-8.5), were downloaded from the IPCC website. The five GCMs (ACCESS-CM2, EC-EARTH3-CC, MPI-ESM1-2-LR, MRI-ESM2-0, and NESM-3) of different spatial resolutions were selected from the literature review [26,27], and on data availability for the study area. Details of these GCMs are mentioned in Table 2.

Table 2.
Details of selected Coupled Model Intercomparison Project Phase 6 (CMIP6) models.
The Shared Socioeconomic Pathways (SSPs) are utilized in climate modelling to project future climatic changes by considering various degrees of greenhouse gas emissions and socioeconomic advancements. SSP2-4.5 and SSP5-8.5s are two scenarios that depict distinct paths for future climatic and socioeconomic circumstances. SSP2-4.5 depicts a “Middle of the Road” scenario in which societal development proceeds primarily in accordance with historical trends. In this scenario, moderate mitigation efforts are achieved through the implementation of global policies and programs aimed at reducing greenhouse gas emissions. Based on SSP2-4.5, radiative forcing is expected to stabilize at 4.5 W/m2 by 2100. According to this scenario, sustainability will be approached in a balanced manner, with progressive transitions to renewable energy sources and increases in energy efficiency. SSP5-8.5 is an example of a “Fossil-Fueled Development” scenario, in which significant technological developments and heavy consumption of fossil fuels are the primary drivers of rapid economic growth in the world. This scenario assumes a low level of action to reduce greenhouse gas emissions. In the scenario SSP5-8.5, the amount of radiative forcing is projected to increase to 8.5 W/m2 by the year 2100. This situation gives rise to elevated levels of greenhouse gas emissions and substantial global warming, which in turn leads to more pronounced climate consequences.
2.3. Bias Correction of GCMs Data
To adjust for bias in precipitation and temperature projections of GCMs, researchers frequently employ the change factor method (CFM) [28,29,30]. Anandhi et al. [31] and Goodarzi et al. [32] have effectively used it to address the discrepancy between GCM-based simulated and gauge-based observed meteorological variables in different regions. Anandhi et al. [31] have reported that the CFM is a dependable and resilient technique for refining the output of GCMs for hydro-meteorological investigations. The CFM utilizes the average changes in precipitation and temperature during a reference period and incorporates them into the anticipated future predictions of the GCMs. This robust approach was applied in the present study under SSP2-4.5 and SSP5-8.5 scenarios to bias correct the GCM results across the near-future time range (2021–2050). The equations given below were used for calculations in the CFM, i.e., CFadd and CFmul were calculated using Equation (1) and Equation (2), respectively.
where Pb and Pe denote the mean precipitation for the baseline and evaluation periods, respectively. The downscaled precipitation values were calculated by employing CF to the observed precipitation data using either Equation (3) or Equation (4).
where LSFadd,i and LSFmul,i are the downscaled values of the additive and multiplicative situations. Obsi denotes the observed precipitation data at each time step during the entire period.
2.4. Wheat Crop Growth Stages in the Pothwar Plateau
According to the local practices in the region, the growing season of the wheat crop in the Pothwar Plateau was divided into four distinct stages of development [33]. The calendar of growth stages in the plateau is given in Table 3.

Table 3.
Calander of wheat crop growth stages in the Pothwar Plateau.
2.5. Data Analysis
Daily data of precipitation were processed and converted into annual, seasonal (rabi season), and stage basis (wheat irrigation stages). The “Mann-Kendall Test” (MK) and “Theil-Sen’s Slope Estimator Test” were used to check the availability of rainwater in the Pothwar region. The mathematical equations of Mann-Kendall for calculating S, “variance” V(S), “Standardized test statistics” Z, and “corrected variance” V*(S) are given below:
where
where xj and xk are the values of j and k in the time series, n is the number of observations, t is the length of time, and s(i) is the significant autocorrelation function of the ranks of the observations in these equations. Z values that are positive or negative show an increasing or falling trend, respectively. The trend’s significance was determined at the 5% level of significance. To estimate the rate of trend, Theil–Sen Slope Estimator test was used. According to TS, the slope was computed as follows:
V*(S) = V(S) Cor,
The notations xj is the data value at time j and xk is the data value at time k.
3. Results
3.1. Variations of Precipitation during the Different Growth Stages
Figure 3 shows the fluctuation in precipitation in the Pothwar Plateau from 1985 to 2014 during the rabi season and the various growth phases of the wheat crop (Stages 1–4). During Stage-1, the median precipitation was around 5 mm, with a relatively small interquartile range (IQR) ranging from approximately 1 mm to 19 mm. This suggests that there was little variability in the precipitation. However, there were occasional outliers that could reach up to about 110 mm. Stage-2 exhibited a comparable low median precipitation of approximately 10 mm, but with a broader interquartile range (IQR) spanning from around 2 mm to 46 mm. This indicates a greater degree of variability and occasional extreme values, with outliers reaching as high as 161 mm. Stage-3 exhibited a greater median precipitation of around 42 mm and an interquartile range spanning from approximately 15 mm to 83 mm. This range was characterized by notable variability and included outliers reaching up to 151 mm. Stage-4 was characterized by the highest median precipitation of roughly 50 mm and the widest interquartile range (IQR) ranging from around 14 mm to 96 mm. This indicates a significant amount of variability, with fewer extreme values reaching up to 185 mm. The rabi season, including all its stages, had the highest median precipitation of around 168 mm. The interquartile range (IQR) for precipitation during this season was quite large, ranging from approximately 113 mm to 238 mm. This indicates significant annual variations in precipitation, with some extreme values as high as 292 mm. The comparisons reveal substantial disparities in precipitation patterns during different growth stages, with the rabi season exhibiting the greatest fluctuation. This is crucial for efficient agricultural planning and water resource management in the region.
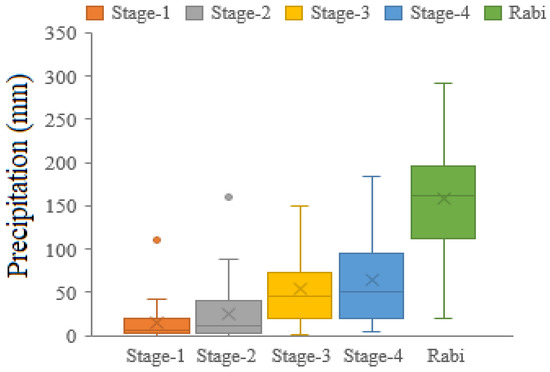
Figure 3.
Variations of precipitation during different wheat growth stages and the rabi season during 1985–2014.
3.2. Historical Changes in the Precipitation Patterns
Based on gauge-based climate data during the baseline period (1985–2014), changes in the patterns of the precipitation during different growth stages of wheat crop were analyzed. For this study, four different stages of wheat crop growth were considered, as reported by [33]. Moreover, changes in the precipitation patterns during the entire rabi season (from November to April) and on the annual time scale were also assessed during the baseline period. Changing characteristics of precipitation patterns were assessed at different spatial scales (i.e., at the station level and the entire plateau scale). Results of the MMK test and Theil–Sen Slope (TSS) estimator are presented in Table 4.

Table 4.
Significance level (Z) and rate of change (Q) of precipitation during the baseline period (1985–2014) in the Pothwar region. Bold values represent the significant change.
During the baseline period, it was found that the precipitation was decreasing, at all stations and across the entire plateau, during the first two stages of the growing season. At the plateau scale, the decreasing rate of precipitation during the first stage was about −2.28 mm/decade, with the highest rate of decreasing trend found at the Murree station. During the second stage, the precipitation decreased significantly across the entire plateau, at a rate of −7.13 mm/decade, with the highest rate of decreasing trend (−7.28 mm/decade) at the Rawalpindi station. During the third stage, the overall trend of precipitation was decreasing across the plateau; however, two stations showed a slightly increasing trend during this stage. Surprisingly, the precipitation was increasing during the fourth stage of the growing season. At the plateau scale, the precipitation was increasing at a rate of 14.68 mm/decade, whereas it was increasing significantly at the Cherat station, at a rate of 20.18 mm/decade. In the rabi season, the total precipitation decreased at the plateau scale and at four stations. The highest rate of decreasing trend (−96.44 mm/decade) was found at the Murree station. Across the entire plateau, the decreasing trend of precipitation during the entire growing season was about −20.47 mm/decade. At the annual scale, the precipitation was decreasing, at a rate of −9.75 mm/year, across the entire plateau. The annual average precipitation was significantly decreased at the Murree station, at a rate of −210.62 mm/year. However, among three stations (Cherat, Rawalpindi, and Chakwal), the highest rate of increasing trend (68.0 mm/year) was found at the Chakwal station. Figure 4 shows the trends in precipitation during four stages of wheat crop growth.
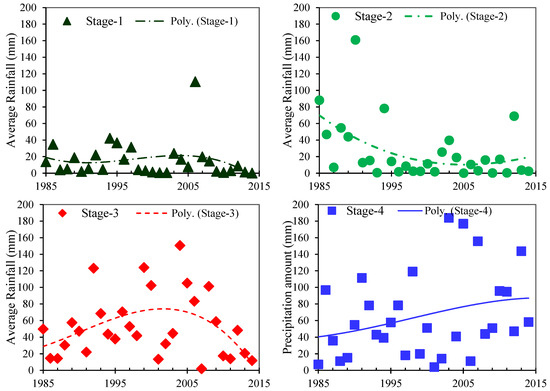
Figure 4.
Trends of precipitation during four different growth stages of wheat crop.
Figure 5a shows the spatial variability of the rate of change in annual average precipitation across the Pothwar region. During the baseline period, the annual precipitation decreased over the northern and eastern parts of the plateau. However, the annual precipitation increased over the central and western parts of the plateau. The spatial variability of the rate of change of wheat-growing season (rabi) is shown in Figure 5b. The spatial distribution of the rate of change of the rabi season precipitation showed a decreasing trend of rabi season precipitation over the majority of the parts of the plateau, except over the central parts, where precipitation was increased during the wheat-growing season.
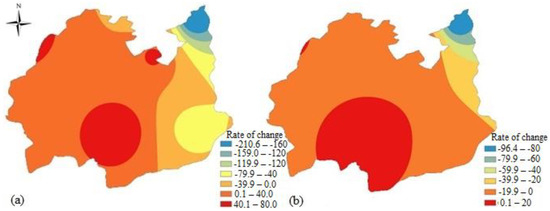
Figure 5.
Spatial variability of the rate of change in (a) annual and (b) rabi season precipitation.
3.3. Changes in the Projected Precipitation across the Pothwar Plateau
Before analyzing the trends of projected precipitation for the future period (2021–2050), the spatial variations of annual average precipitation under the SSP2-4.5 and SSP5-8.5 scenarios were analyzed. Under the SSP2-4.5 scenario, the annual average precipitation was predicted to follow a pattern similar to the historical precipitation, ranging from 549 mm/year in the southern parts to 1531 mm/year in the northern areas. The expected annual average precipitation under the SSP5-8.5 scenario ranged from 556 mm/year in the middle and western parts to 1528 mm/year in the northeastern areas. Historical patterns will persist in the regions with higher precipitation in both SSPs. In general, the average annual precipitation was predicted to decline in the near future, as suggested by the ensembled predictions of multiple models under SSP2-4.5 and SSP5-8.5 scenarios. Figure 6 displays the spatial variability maps of annual average precipitation under both SSPs.
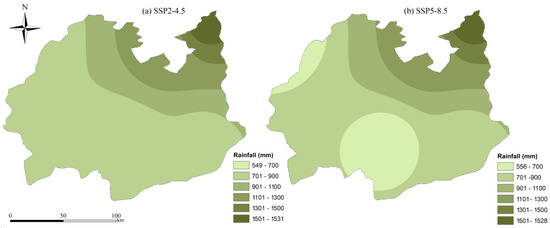
Figure 6.
Spatial variabilities of projected annual average precipitation under (a) SSP2-4.5 and (b) SSP5-8.5 for the period 2021–2050.
3.3.1. Trend Analysis of Projected Precipitation
Table 5 shows the results of predicted precipitation trends for the Pothwar Plateau under SSP2-4.5 and SSP5-8.5 from 2021 to 2050, in four growth stages of wheat crop, the rabi season, and the yearly scale. Under SSP2-4.5, all of the five GCMs projected a slightly increasing trend of precipitation during the S-1; however, no trend was statistically significant at a 5% significance level. The increasing rate varied between 0.01 and 3.6 mm/decade. During S-2, four GCMs showed a decreasing tendency of precipitation, while one GCM (ACESS-CM-2) showed an increasing potential for future precipitation. During S-3, three GCMs (ACESS-CM-2, MRI-ESM2.0, and NESM-3) showed an increasing potential of precipitation, while two GCMs (EC-Earth3-cc and MPI-ESMI-2-LR) showed a decreasing trend of precipitation during S-3. In the case of S-4, only one GCM (MRI-ESM2.0) exhibited a decreasing potential of precipitation, whereas all other GCMs indicated an increasing trend of precipitation. For the rabi season, three GCMs showed an increasing potential for precipitation. The increasing rate of projected precipitation varied between 14.58 and 42.51 mm/decade. It is expected that the annual precipitation may increase across the plateau, as indicated by the projected results of three GCMs. The annual precipitation may increase at a rate of 14.58–49.28 mm per decade. Under the SSP2-4.5, no trend (either increasing or decreasing) was statistically significant at 5% significance level. The results of the multi-model ensemble (MME) show that the precipitation may increase in the first, third, and fourth stages of wheat growth. Overall, an increase in the precipitation amount is expected in the future rabi season, at a rate of 4.34 mm/decade. However, the annual average precipitation may decline in the future at the rate of −16.26 mm/decade. The trends of future precipitation during different growth stages are shown in Figure 7. These trends were assessed using the multi-model ensembled data.

Table 5.
Future Changes in Precipitation under SSP Scenarios over the Pothwar Region.
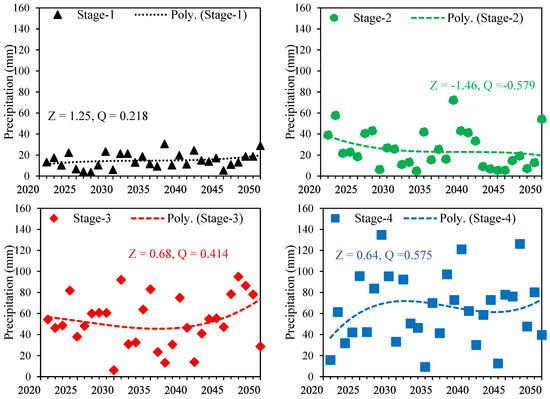
Figure 7.
Trends of projected precipitation (during 2021–2050) in four growth stages of wheat under SSP2-4.5.
Under the SSP5-8.5 scenario, four GCMs showed a decreasing trend of future precipitation in S-1. The decreasing rate varied between −0.01 and −2.02 mm/decade. Stage-2 may experience a higher rate of precipitation in the future, as indicated by the projections of all GCMs during S-2. For S-3, the projections of three GCMs showed an increasing trend of precipitation in S-3. Projections of four GCMs showed a decreasing trend of precipitation in S-4. The maximum decreasing trend (−7.08 mm/decade) was projected by EC-Earth3-CC. In the case of the rabi season, three GCMs showed an increasing tendency of precipitation; however, two GCMs showed a decreasing trend of future precipitation in the rabi season. On the annual scale, three GCMs projected a decreasing tendency of precipitation. The maximum decreasing rate (−90.10 mm/decade) was projected by MRI-ESM2.0. The results of MME under SSP5-8.5 indicated a decreasing trend of annual precipitation at a rate of −2.20 mm/decade, whereas an increase in the precipitation is expected in the future rabi season at a rate of 2.64 mm/decade.
Figure 7 shows the trends of projected precipitation (from 2021 to 2050) in the plateau during four different growth stages of wheat under SSP2-4.5 scenario. Based on the multimodal projections of CMIP6, it is expected that the precipitation may increase in the first, third, and fourth stages of wheat; however, precipitation may decrease in the second growth stage. None of the trends in future precipitation were statistically significant. The highest increasing trend (5.75 mm/decade) of precipitation was found in the fourth stage. The decreasing rate of precipitation in the second stage was about −5.79 mm/decade.
Figure 8 displays the expected trends of future precipitation (for the period 2021–2050) in the four growth stages of wheat under SSP5-8.5. Under this scenario, projections of the multimodal ensembles showed that the magnitude of precipitation may decrease in the first, third, and fourth stages of the crop. All of these trends non-significant. It is expected that the precipitation amount may increase significantly, at the rate of 8.57 mm/decade, in the second growth stage.
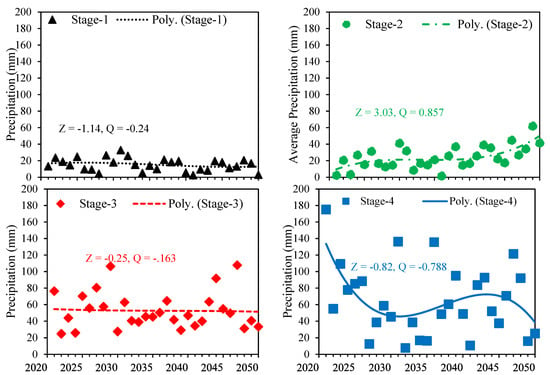
Figure 8.
Projected temporal variabilities of precipitation, during 2021–2050, in four growth stages of wheat crop in the Pothwar Plateau under SSP5-8.5.
3.3.2. Relative Change in Projected Precipitation with Reference to the Baseline Period
Figure 9 displays the relative changes in projected precipitation (2021–2050) with reference to the baseline period (1985–2014). It is expected that, under SSP2-4.5, the Pothwar Plateau may receive less precipitation in future in all wheat crop growth stages. The amount of total precipitation may also decrease in the entire rabi season and on the annual scale as compared to the baseline period. The NESM-3 GCM showed the highest decrease in the future precipitation. Under SSP2-4.5, the outputs of multimodal ensembles showed that the expected decrease in the amount of precipitation during the entire rabi season was about −8.12% as compared with the baseline period. The annual precipitation in the future may decrease about −4.29%. In case of growth stages of wheat crop, the expected decrease in the precipitation amount in the first stage was about −1.49%; in the second stage, about −0.46%; in the third stage, about −1.81%; and in the fourth stage, about −1.87%.
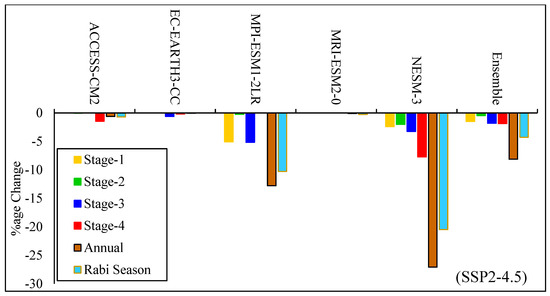
Figure 9.
Relative changes in projected precipitation (2021–2050) with reference to the baseline period (1985–2014) under SSP2-4.5.
Under SSP5-8.5 scenario, it is expected that the predicted precipitation may also less that in the baseline period in all growth stages, the entire growing (rabi) season, and on the annual scale. Relative changes in the amount of precipitation during different stages, the rabi season, and the annual scale (as projected by different GCMs and multimodal ensemble) are shown in Figure 10. The projections of two GCMs (ACCESS-CM2 and MRI-ESM2-0) showed less than 2% reduction in the projected precipitation on all temporal scales. EC-EARTH3-CC showed a decreased precipitation at all temporal scales, with the highest decrease during Stage-2 (−9.43% as compared with the baseline period). As per predictions of MPI-ESM1-2LR, the precipitation may decrease significantly in Stage-2 (−11.77%), during rabi season (−8.41%), and on the annual scale (−12.01%). As per predictions of NESM-3, the precipitation may decrease significantly in the rabi season (about −11.58%) and on the annual scale (−24.88%).
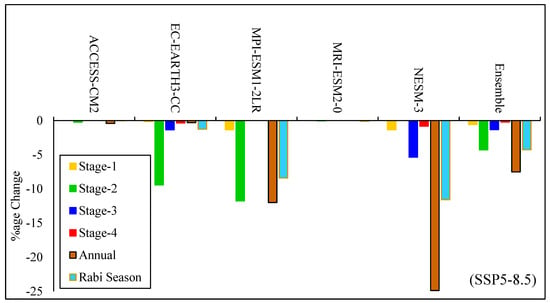
Figure 10.
Relative changes in projected precipitation with reference to the baseline period under SSP5-8.5.
4. Discussion
The main challenge for rainfed agriculture in the Pothwar Plateau of Pakistan is the irregular and unexpected distribution of precipitation, which has a significant effect on the growth phases of wheat, namely emergence, tillering, jointing and booting, and maturity. The uneven distribution of precipitation during these crucial growth stages also makes it very difficult to sustain wheat yields. This study aimed to address these challenges by conducting a comprehensive analysis of historical (1985–2014) and projected (2021–2050) precipitation data, with a particular emphasis on the rabi season. In this study, we comprehensively investigated the changes in the spatial and temporal patterns of historical data and future predictions of precipitation, using outputs of five GCMs under two SSPs, during four growth stages of wheat crop. The results exhibited considerable changes in precipitation patterns which can have a substantial effect on crop yield and food security. The results are consistent with other prior studies emphasizing a decreasing tendency of precipitation during wheat-growing season in many regions for agriculture.
The downward trend in annual and seasonal precipitation was highlighted by the historical analysis, which covered the past three decades (from 1985 to 2014). The annual average precipitation had a decreasing trend, at the rate of −9.75 mm/decade. This finding is consistent with previous studies conducted in the same region, which also documented a decrease in precipitation over the past few decades [34,35]. The observed precipitation decline (−20.47 mm/decade) during the rabi season is especially concerning because it occurred during the critical wheat growth season. This result is consistent with findings from other wheat-growing regions that are undergoing climate change [36]. The constant decrease in water availability highlights the need for adaptable solutions in wheat agriculture to address this issue.
Changes in the spatiotemporal patterns of precipitation predicted by the two SSP scenarios provide a complex picture. The total annual precipitation was projected to decline significantly (at a rate of 16.63 mm/decade) under SSP2-4.5 for the future period (2021–2050). On the other hand, future projections for the rabi season indicated a slight increase in precipitation (4.03 mm/decade), which could provide some relief during the wheat-growing season. Sustainable wheat production in this region may be challenging, nevertheless, due to the likelihood of unequal distribution of precipitation across the four growth stages. The localized climate impacts are complex, and this is seen by the pattern of precipitation during the rabi season, which is in contradiction to the overall trend of declining annual precipitation. This is consistent with the concerns presented in the sixth assessment report of the International Panel on Climate Change’s (IPCC), which emphasizes the possibility of greater precipitation unpredictability in climate change scenarios.
According to the SSP5-8.5 scenario, the average annual precipitation showed a slight upward tendency (1.0 mm/decade), which could imply a less significant effect on the overall availability of water. Nevertheless, the rabi season may still encounter a decline in precipitation at a rate of 11.64 mm/decade. The presence of this mix of patterns highlights the need for adaptable and responsive solutions for managing water, as there is still a potential threat to the precipitation during critical growth stages of wheat crop. It is possible that the anticipated decline in precipitation, under SSP5-8.5, during the important emergence, jointing and booting, and maturity stages (stages 1, 3, and 4) will have a substantial impact on the growth of plants and the yield of wheat crop in the Pothwar Plateau.
The projections emphasize the necessity of implementing adaptation measures in the Pothwar Plateau in Pakistan. Water-saving methods, effective irrigation systems, and drought-resistant wheat cultivars may be vital in light of the possible decrease in future precipitation during the critical growth stages. Mulching and conservation tillage, which increase soil moisture retention, may also help lessen the negative effects of decreased precipitation on the early growth stage.
The main contribution of this study is its comprehensive projections of the spatial and temporal changes in precipitation across critical wheat growth stages. This will help farmers and policymakers devise strategies to adapt to climate variability and ensure sustainable wheat production in the region. Furthermore, the results of this study might be useful for legislators and agricultural planners in order to create resilient farming methods.
5. Conclusions
This study examined the past (from 1985 to 2014) and predicted (for the period 2021–2050) the effects of climate change on the spatiotemporal patterns of precipitation in the Pothwar Plateau, a major rainfed wheat-growing area in Pakistan. The changing behavior of precipitation was predicted through the use of the bias-corrected outputs of five GCMs (ACCESS-CM2, EC-EARTH3-CC, MPI-ESM1-2-LR, MRI-ESM2-0, and NESM-3) under two SSPs (SSP2-4.5 and SSP5-8.5). This study provides the following results by assessing historical data (from 1985 to 2014) and future projections (from 2021 to 2050):
- Historically, the annual average precipitation across the Pothwar Plateau varied from 589 to 1682 mm (1985–2014). Future projections showed a decreased precipitation, with expected ranges of 549–1531 mm under SSP2-4.5 and 556–1528 mm under SSP5-8.5.
- During the past three decades, the Pothwar Plateau has experienced a considerable decline in annual average precipitation, at the rate of −9.75 mm/decade. The decline was particularly significant during the wheat-growing (rabi) season, at a rate of −20.47 mm/decade. These changes in the historical data highlight the need for adaptive strategies to mitigate the effects of reduced precipitation on wheat production.
- During the baseline period, the precipitation amount in the first three growth stages decreased at the rates of 2.28 mm/decade, 7.13 mm/decade, and 1.24 mm/decade, respectively. However, the precipitation increased, at a rate of 14.68 mm/decade, in the fourth stage. The assessment of stage-specific variation in precipitation is very important for creating tailored interventions to help rainfed wheat growth during the most susceptible stages.
- The future predictions under the SSP2-4.5 scenario showed a combination of different patterns. Although the ACCESS-CM2 and MPI-ESM1-2-LR models indicated an increase in yearly precipitation, the majority of other models exhibited a declining trend in future precipitation. More precisely, the ensembled percentage for the rabi season showed a decline of 4.29%, emphasizing the necessity for continuous monitoring and adaptation measures.
- According to the SSP5-8.5 scenario, while two GCMs (EC-EARTH3-CC and NESM-3) predicted a general increase in yearly precipitation, the combined predictions from multiple models suggested a decrease of 4.28% in the rabi season. This shows that the rabi season wheat crop may still have water shortages despite increased annual precipitation, stressing the necessity for effective water management.
Wheat production in the Pothwar Plateau is at serious risk due to the decrease in precipitation as a consequence of climate change that has been observed during critical growth stages and the entire wheat-growing season (rabi). Farmers of this region are recommended to implement water-conservation methods, such as utilizing efficient irrigation systems and cultivating drought-tolerant crop varieties, in order to ensure sustainable wheat production. In addition, implementing better techniques to retain soil moisture will be crucial in reducing the impacts of less precipitation.
Policymakers should utilize these results to develop inclusive water management plans that tackle the expected fluctuations in precipitation. To support the agricultural sector, investments in early warning systems, sophisticated weather forecasting technologies, and water storage and distribution infrastructure are required. Policies should additionally encourage research and development in enhancing the ability of crops to withstand stress and in implementing agricultural techniques that can be maintained over the long term.
It is important to mention the limitations of this study. Firstly, this study used GCM projections, which may introduce climate modeling uncertainty. Utilizing projections of GCMs involves making certain assumptions and simplifications that can potentially impact the precision of future climate projections. Furthermore, regional climate models (RCMs), which could offer finer-scale projections specific to regional features and enhance the resolution of climate data, were not included in this study.
Future research could be enhanced by implementing several modifications to increase the robustness and application of findings. Integrating RCMs with GCMs would offer a more comprehensive and specific understanding of climate projections. This is especially crucial for areas such as the Pothwar Plateau, which has intricate topography and diverse microclimates. In addition, incorporating a wider array of Shared Socioeconomic Pathways (SSPs) in the analysis would encompass a more extensive range of future socio-economic circumstances and their possible effects on agricultural practices and adaptation techniques.
Despite some limitations, this study offers specific insights into precipitation variability and its effects on rainfed wheat crop water availability during the critical growth stages, which makes a significant contribution to the broader fields of agricultural water research and climate change studies. The methodology and results can be used as a framework for comparable studies in rainfed agricultural regions across the world. This research underscores the need of analyzing precipitation patterns at various stages, emphasizing the necessity of conducting thorough evaluations of climate impacts to guide adaptive agricultural practices and policy.
Author Contributions
Conceptualization, G.R. and M.N.A.; methodology, G.R. and D.Y.K.; software, M.N.A. and M.A.; validation, F.H., A.A., S.J.M. and K.C.M.; formal analysis, G.R.; investigation, G.R. and M.N.A.; resources, D.Y.K., S.J.M. and K.C.M.; data curation, M.A. and A.A.; writing—original draft preparation, G.R. and M.N.A.; writing—review and editing, F.H. and A.A.; visualization, D.Y.K. and S.J.M.; supervision, M.N.A.; project administration, M.N.A. and M.A.; funding acquisition, D.Y.K., S.J.M. and K.C.M. All authors have read and agreed to the published version of the manuscript.
Funding
This work was supported by Korea Institute of Planning and Evaluation for Technology in Food, Agriculture and Forestry (IPET) through Agricultural Foundation and Disaster Response Technology Development Program, funded by Ministry of Agriculture, Food and Rural Affairs (MAFRA) (RS-2022-IP322083).
Data Availability Statement
The data can be provided on demand.
Acknowledgments
We are thankful to the “Pakistan Meteorological Department (PMD)” and the “Soil and Water Conservation Research Institute (SAWCRI), Chakwal” for providing the daily observations of precipitation for the baseline period.
Conflicts of Interest
The authors declare no conflicts of interest.
References
- Hernández Ayala, J.J.; Méndez Tejeda, R. Examining the Spatiotemporal Changes in the Annual, Seasonal, and Daily Rainfall Climatology of Puerto Rico. Climate 2023, 11, 225. [Google Scholar] [CrossRef]
- Salnikov, V.; Talanov, Y.; Polyakova, S.; Assylbekova, A.; Kauazov, A.; Bultekov, N.; Musralinova, G.; Kissebayev, D.; Beldeubayev, Y. An Assessment of the Present Trends in Temperature and Precipitation Extremes in Kazakhstan. Climate 2023, 11, 33. [Google Scholar] [CrossRef]
- Gamal, G.; Nejedlik, P.; El Kenawy, A.M. Assessing Future Precipitation Patterns, Extremes and Variability in Major Nile Basin Cities: An Ensemble Approach with CORDEX CORE Regional Climate Models. Climate 2024, 12, 9. [Google Scholar] [CrossRef]
- Waseem, M.; Khurshid, T.; Abbas, A.; Ahmad, I.; Javed, Z. Impact of meteorological drought on agriculture production at different scales in Punjab, Pakistan. J. Water Clim. Change 2022, 13, 113–124. [Google Scholar] [CrossRef]
- Ali, S.; Liu, Y.; Ishaq, M.; Shah, T.; Abdullah; Ilyas, A.; Din, I. Climate Change and Its Impact on the Yield of Major Food Crops: Evidence from Pakistan. Foods 2017, 6, 39. [Google Scholar] [CrossRef]
- Elliott, J.; Deryng, D.; Müller, C.; Frieler, K.; Konzmann, M.; Gerten, D.; Glotter, M.; Flörke, M.; Wada, Y.; Best, N.; et al. Constraints and potentials of future irrigation water availability on agricultural production under climate change. Proc. Natl. Acad. Sci. USA 2014, 111, 3239–3244. [Google Scholar] [CrossRef] [PubMed]
- Khan, A.J.; Koch, M.; Tahir, A.A. Impacts of climate change on thewater availability, seasonality and extremes in the Upper Indus Basin (UIB). Sustainability 2020, 12, 1283. [Google Scholar] [CrossRef]
- Anyamba, A.; Small, J.L.; Britch, S.C.; Tucker, C.J.; Pak, E.W.; Reynolds, C.A.; Crutchfield, J.; Linthicum, K.J. Recent weather extremes and impacts on agricultural production and vector-borne disease outbreak patterns. PLoS ONE 2014, 9, e92538. [Google Scholar] [CrossRef] [PubMed]
- Kotz, M.; Levermann, A.; Wenz, L. The effect of rainfall changes on economic production. Nature 2022, 601, 223–227. [Google Scholar] [CrossRef]
- Nie, H.; Qin, T.; Li, C.; Tang, Y.; Weng, B.; Wang, Y. Trend analysis of effective precipitation in different growth stages of winter wheat in Huaihe River Plain. Theor. Appl. Climatol. 2019, 138, 2043–2056. [Google Scholar] [CrossRef]
- Hawkesford, M.J.; Araus, J.L.; Park, R.; Calderini, D.; Miralles, D.; Shen, T.; Zhang, J.; Parry, M.A.J. Prospects of doubling global wheat yields. Food Energy Secur. 2013, 2, 34–48. [Google Scholar] [CrossRef]
- Araya, A.; Prasad, P.V.V.; Gowda, P.H.; Djanaguiraman, M.; Kassa, A.H. Potential impacts of climate change factors and agronomic adaptation strategies on wheat yields in central highlands of Ethiopia. Clim. Change 2020, 159, 461–479. [Google Scholar] [CrossRef]
- Azmat, M.; Ilyas, F.; Sarwar, A.; Huggel, C.; Vaghefi, S.A.; Hui, T.; Qamar, M.U.; Bilal, M.; Ahmed, Z. Impacts of climate change on wheat phenology and yield in Indus Basin, Pakistan. Sci. Total Environ. 2021, 790, 148221. [Google Scholar] [CrossRef] [PubMed]
- Bannayan, M.; Eyshi Rezaei, E. Future production of rainfed wheat in Iran (Khorasan province): Climate change scenario analysis. Mitig. Adapt. Strateg. Glob. Change 2014, 19, 211–227. [Google Scholar] [CrossRef]
- Vogel, E.; Donat, M.G.; Alexander, L.V.; Meinshausen, M.; Ray, D.K.; Karoly, D.; Meinshausen, N.; Frieler, K. The effects of climate extremes on global agricultural yields. Environ. Res. Lett. 2019, 14, 054010. [Google Scholar] [CrossRef]
- Song, Y.; Wang, C.; Linderholm, H.W.; Tian, J.; Shi, Y.; Xu, J.; Liu, Y. Agricultural adaptation to global warming in the tibetan plateau. Int. J. Environ. Res. Public Health 2019, 16, 3686. [Google Scholar] [CrossRef]
- Abbas, S.; Kousar, S.; Khan, M.S. The role of climate change in food security; empirical evidence over Punjab regions, Pakistan. Environ. Sci. Pollut. Res. 2022, 29, 53718–53736. [Google Scholar] [CrossRef] [PubMed]
- Abbas, F.; Rehman, I.; Adrees, M.; Ibrahim, M.; Saleem, F.; Ali, S.; Rizwan, M.; Salik, M.R. Prevailing trends of climatic extremes across Indus-Delta of Sindh-Pakistan. Theor. Appl. Climatol. 2017, 131, 1101–1117. [Google Scholar] [CrossRef]
- Saleem, F.; Zeng, X.; Hina, S.; Omer, A. Regional changes in extreme temperature records over Pakistan and their relation to Pacific variability. Atmos. Res. 2021, 250, 105407. [Google Scholar] [CrossRef]
- Ghanim, A.A.J.; Anjum, M.N.; Rasool, G.; Saifullah; Irfan, M.; Alyami, M.; Rahman, S.; Niazi, U.M. Analyzing Extreme Temperature Patterns in Subtropical Highlands Climates: Implications for Disaster Risk Reduction Strategies. Sustainability 2023, 15, 12753. [Google Scholar] [CrossRef]
- Naheed, G.; Mahmood, A. Water Requirement of Wheat Crop in Pakistan. Pakistan J. Meteorol. 2011, 6, 89–97. [Google Scholar]
- Mahmood, N.; Ahmad, R.N. Determination of Water Requirements and Response of Wheat to Irrigation at Different Soil Moisture Depletion Levels. Int. J. Agric. Biol. 2005, 7, 812–815. [Google Scholar]
- Ahmad, B.; Gaydon, D.; Bhatti, A.A.; Ahmad, M.M.; Ullah, S.; Dahri, Z.H.; Ali, I. Irrigation Scheduling Impact on Yield of Wheat, Pothowar Region, Pakistan. In The SAARC-Australia Project—Developing Capacity in Cropping Systems Modelling for South Asia; SAARC Agriculture Centre (SAC): Dhaka, Bangladesh, 2014; pp. 135–146. ISBN 978-984-33-7469-1. [Google Scholar]
- Hussain, J.; Khaliq, T.; Ahmad, A.; Akhter, J.; Asseng, S. Wheat Responses to Climate Change and Its Adaptations: A Focus on Arid and Semi-arid Environment. Int. J. Environ. Res. 2018, 12, 117–126. [Google Scholar] [CrossRef]
- Ahmad, Q.U.A.; Biemans, H.; Moors, E.; Shaheen, N.; Masih, I. Article the impacts of climate variability on crop yields and irrigation water demand in South Asia. Water 2021, 13, 50. [Google Scholar] [CrossRef]
- Wang, L.; Rohli, R.V.; Lin, Q.; Jin, S.; Yan, X. Impact of Extreme Heatwaves on Population Exposure in China Due to Additional Warming. Sustainability 2022, 14, 1458. [Google Scholar] [CrossRef]
- Abbas, A.; Ullah, S.; Ullah, W.; Waseem, M.; Dou, X.; Zhao, C.; Karim, A.; Zhu, J.; Hagan, D.F.T.; Bhatti, A.S.; et al. Evaluation and projection of precipitation in Pakistan using the Coupled Model Intercomparison Project Phase 6 model simulations. Int. J. Climatol. 2022, 42, 6665–6684. [Google Scholar] [CrossRef]
- Anjum, M.N.; Ghanim, A.A.J.; Farid, H.U.; Zaman, M.; Niazi, U.M.; Rahman, S.; Alsaiari, M.A.; Irfan, M. Assessment of Climate Change and Its Impacts on the Flows of a Subtropical River Basin in the Hindu-Kush Mountain, South Asia. Pure Appl. Geophys. 2022, 179, 3841–3857. [Google Scholar] [CrossRef]
- Basheer, A.K.; Lu, H.; Omer, A.; Ali, A.B.; Abdelgader, A.M.S. Impacts of climate change under CMIP5 RCP scenarios on the streamflow in the Dinder River and ecosystem habitats in Dinder National Park, Sudan. Hydrol. Earth Syst. Sci. 2016, 20, 1331–1353. [Google Scholar] [CrossRef]
- Diaz-Nieto, J.; Wilby, R.L. A comparison of statistical downscaling and climate change factor methods: Impacts on low flows in the River Thames, United Kingdom. Clim. Change 2005, 69, 245–268. [Google Scholar] [CrossRef]
- Anandhi, A.; Frei, A.; Pierson, D.C.; Schneiderman, E.M.; Zion, M.S.; Lounsbury, D.; Matonse, A.H. Examination of change factor methodologies for climate change impact assessment. Water Resour. Res. 2011, 47, W03501. [Google Scholar] [CrossRef]
- Goodarzi, E.; Bavani, A.R.M.; Dastorani, M.T.; Talebi, A. Evaluating effect of downscaling methods; change-factor and LARS-WG on surface runoff (A case study of Azam-Harat River basin, Iran). Desert 2014, 2, 99–109. [Google Scholar]
- Gaydon, D.S.; Saiyed, I.; Roth, C. The SAARC-Australia Project-Developing Capacity in Cropping Systems Modelling for South Asia; Gaydon, D.S., Saiyed, I., Roth, C., Eds.; SAARC Agriculture Centre (SAC) BARC Campus: Dhaka, Bangladesh, 2014; ISBN 9789843374691. [Google Scholar]
- Ahmad, M. (Ed.) Water Policy in Pakistan: Issues and Options; Springe Nature: Cham, Switzerland, 2023; ISBN 978-3-031-36131-9. [Google Scholar]
- Kamruzzaman, M.; Wahid, S.; Shahid, S.; Alam, E.; Mainuddin, M.; Islam, H.M.T.; Cho, J.; Rahman, M.M.; Chandra Biswas, J.; Thorp, K.R. Predicted changes in future precipitation and air temperature across Bangladesh using CMIP6 GCMs. Heliyon 2023, 9, e16274. [Google Scholar] [CrossRef] [PubMed]
- Lu, C.; Fan, L. Winter wheat yield potentials and yield gaps in the North China Plain. Field Crops Res. 2013, 143, 98–105. [Google Scholar] [CrossRef]
Disclaimer/Publisher’s Note: The statements, opinions and data contained in all publications are solely those of the individual author(s) and contributor(s) and not of MDPI and/or the editor(s). MDPI and/or the editor(s) disclaim responsibility for any injury to people or property resulting from any ideas, methods, instructions or products referred to in the content. |
© 2024 by the authors. Licensee MDPI, Basel, Switzerland. This article is an open access article distributed under the terms and conditions of the Creative Commons Attribution (CC BY) license (https://creativecommons.org/licenses/by/4.0/).