Article

Historic Changes and Future Projections in Köppen–Geiger Climate Classifications in Major Wine Regions Worldwide

by
Cristina Andrade
1,2,3,*,
André Fonseca
2,3,
João A. Santos
2,3,
Benjamin Bois
4 and
Gregory V. Jones
5
1
Polytechnic Institute of Tomar, Natural Hazards Research Center (NHRC.ipt), Quinta do Contador, Estrada da Serra, 2300-313 Tomar, Portugal
2
Centre for the Research and Technology of Agro-Environmental and Biological Sciences, CITAB, University of Trás-os-Montes e Alto Douro, UTAD, 5001-801 Vila Real, Portugal
3
Institute for Innovation, Capacity Building and Sustainability of Agrifood Production, Inov4Agro, University of Trás-os-Montes e Alto Douro, UTAD, 5001-801 Vila Real, Portugal
4
Biogéosciences, UMR 6282 CNRS, Université de Bourgogne, 6 Boulevard Gabriel, 21000 Dijon, France
5
Abacela Vineyards and Winery, 12500 Lookingglass Road, Roseburg, OR 97471, USA
*
Author to whom correspondence should be addressed.
Climate 2024, 12(7), 94; https://doi.org/10.3390/cli12070094
Submission received: 28 May 2024 / Revised: 25 June 2024 / Accepted: 26 June 2024 / Published: 27 June 2024

Abstract

:
A valuable tool for comprehending and characterizing climate patterns on a global scale is the Köppen–Geiger climate classification system. When it comes to wine production, the climate of a region plays an essential role in determining whether specific grape varieties can be cultivated, largely determining the style of wine that can be made, and influencing the consistency of overall wine quality. In this study, the application of the Köppen–Geiger classification system to the latest Coupled Model Intercomparison Project (CMIP6) experiments has been explored. To establish a baseline for the historical period (1970–2000), the WorldClim dataset was used alongside a selection of an ensemble of 14 Global Climate Models. The evaluation of climate variability across winemaking regions is conducted by considering future climate projections from 2041 to 2060, which are based on different anthropogenic radiative forcing scenarios (Shared Socioeconomic Pathways, SSP2–4.5, and SSP5–8.5). The results are the most comprehensive documentation of both the historical climate classifications for most wine regions worldwide and the potential changes in these classifications in the future. General changes in climate types are projected to occur largely in a significant shift from a warm summer climate to a hot summer climate in temperate and dry zones worldwide (climate types C and B, respectively). This shift poses challenges for grape cultivation and wine production. The grape development process can be significantly affected by high temperatures, which could result in early ripening and changes in the grape berry’s aromatic compounds. As regions transition and experience different climates, wine producers are required to adapt their vineyard management strategies by implementing suitable measures that can effectively counter the detrimental impacts of abiotic stresses on grape quality and vineyard health. These adaptation measures may include changes in canopy and soil management, using different variety-clone-rootstock combinations, adopting irrigation methods, or shifting into other microclimatic zones, among other effective techniques. To ensure long-term sustainability, wine producers must consider the climatic change projections that are specific to their region, allowing them to make more informed decisions about vineyard management practices, reducing risks, and ultimately making the wine industry more resilient and adaptive to the ongoing effects of climate change.

1. Introduction

Climate classifications have been developed to help describe the conditions a region usually experiences over a year or longer temporal ranges [1]. Often, they include geographical names such as polar or tropical, biome names such as steppe or rainforest, and can be descriptive, such as desert scrub or dry tundra. Methods for classifying climates have included approaches using environmental indicators [2], weather patterns [3], water budgets [4], and life zones [5]. Numerous factors affect a region’s climate, including the latitude, elevation, proximity to large bodies of water, mountains, and other surface features, ocean current circulation patterns, and global to regional patterns in atmospheric circulation. These factors control regional temperature, precipitation characteristics, and seasonality, which in turn control the ecology or types of native plants and animals in each region.
The most widely used climate classification was first developed by Wladimir Köppen in the late 1800s [2] and modified as more information about climate controls and ecology became available [6,7]. Further refinements were carried out by Geiger [8], resulting in what is known today as the Köppen–Geiger climate classification (KG). The KG uses seasonal temperatures and precipitation to divide climates into five main groups: tropical, arid, temperate, continental, and polar. These are further divided into 30 sub-types that are also based on the types of vegetation that are most common in each region, helping to define regional ecosystems and global biomes. The KG was further refined by Trewartha [9] and Trewartha and Horn [10] to better define the climate and vegetative zones in the mid-latitudes, especially in North America and Asia.
Given the importance of climate in growing grapes for wine production, the classification of climates suitable for viticulture has been important to the wine sector. Köppen [11] compared wine regions using an earlier version of his climate classification approach, and de Blij [12] (p. 112) noted that “viticulture is perhaps the most geographically expressive of all agricultural industries.” Arising from the geography of the old-world wine regions of Europe and the use of the Köppen climate classification system, wine production has become synonymous with Mediterranean climates. Besides being found along the Mediterranean basin of Europe, these climate types are also located in the fynbos of South Africa, the Mallee of southern Australia, the matorral of Chile and Argentina, and the chaparral and coastal valleys of western North America. It is in these regions where a mild wet-winter, dry-summer climate is ideal for the cultivation of Vitis vinifera L. grapes. However, today, wine production occurs across a wide range of climate types [13]. Jones et al. [14] used an updated KG gridded dataset [15] and found that midlatitude climate types make up 55% of the world’s wine regions. Within the midlatitude climate types, Mediterranean climates occur in only 15% of the surface area globally (e.g., Napa Valley, Coonawarra), with humid subtropical (24%; e.g., Barolo), maritime temperate (12%; e.g., Bordeaux), and maritime subarctic (4%; e.g., Tasmania) making up the rest. Other climate types that wine regions fall within include midlatitude dry (16%), subtropical dry (3%; e.g., Priorat and Mendoza), and humid continental climates (13%; e.g., Finger Lakes Region and Niagara).
Given that KG climate types describe observed biome distributions, they inherently have sharp boundaries due to plant sensitivity to various environmental factors [16]. As such, climate classifications have been used to examine how a changing climate has caused shifts in these boundaries [17,18] and could potentially alter entire biomes in the future [19]. For example, Chan and Wu [16] found that approximately 5.7% of the total global land area shifted to warmer and drier climate types during 1950–2010. Belda et al. [1], using both the KG and the Köppen-Trewartha climate classification, found observed changes in semi-arid, savanna, and tundra climate sub-types. Changes in tundra classes occurred across the 20th century but have accelerated in the last 40 years [20,21] and declined significantly in the western US [22]. Continental temperate climate types north of 50° have expanded over the last few decades as inland areas of the northern continents have warmed substantially more than most of the rest of the world [21]. Chen and Chen [17] found that polar climates shrank in size over the period 1901–2010, while there have been significant poleward shifts in temperate climates. Chan and Wu [16] found increasing average elevations in tropical and polar climates. Potential climate type changes in the future have been examined by Rubel and Kottek [19], finding that maximum changes are likely to be found in continental cold climates, with significant shifts to more temperate climate types. Additional changes were noted in low latitudes, where the tropical belt will likely widen, with rainforest and monsoon sub-types expanding in some regions while savanna sub-types expand in others. In Europe, de Castro et al. [23] found that 51–59% of land grid points would likely shift towards warmer or drier climate sub-types. They also noted that it is likely that ecosystems might be at risk for approximately 12% of the European land area, as these regions are projected to shift across two or more climate subtypes.
Climate change has been shown to affect wine quality and production globally [24,25] and impact the suitability of regions to continue growing the winegrape varieties they grow today [26,27]. In Europe, Santos et al. [28] detail how future climate change is expected to exacerbate issues of regional suitability for viticulture and wine production, requiring extensive short- and long-term adaptation strategies [29,30]. Moriondo et al. [31] also detail that climate change will likely reshape the geographical distribution of many of the famous wine regions in Europe. Given the strong connection between weather, climate, and environment in wine production, the purpose of this research is to examine the climate change projections for the KG classes in wine regions worldwide. Wine regions include those in most countries across Europe, in the Northern and Southern Hemispheres, as is detailed in the World Wine Production Outlook report [32]. The research examines the historic (1970–2000) and future (2041–2060) KG considering two Shared Socio-economic Pathways (SSP2–4.5 and SSP5–8.5) using the new state-of-the-art Coupled Model Intercomparison Projects models (CMIP6) downscaled for future climate projections [33].

2. Materials and Methods

2.1. Datasets

In this study, gridded datasets of monthly precipitation (mm), maximum, minimum, and mean temperatures (°C), with a 10-min spatial resolution, were retrieved from the WorldClim dataset [34]. For the historical period, monthly averages between 1970 and 2000 were considered, whereas monthly averages from 2041 to 2060 (20 years) were selected for the future climate. These datasets were generated by state-of-the-art Global Climate Models (GCM) within the framework of the Coupled Model Intercomparison Project (CMIP6). CMIP6 [33] is based on runs from around one hundred GCMs, produced across 49 different modeling groups, showing a higher sensitivity than the previous CMIP5 models [35]. Several Shared Socioeconomic Pathways (SSPs) have been outlined to drive climate models for CMIP6. As such, the previous Representative Concentration Pathways (RCPs) were reformulated in CMIP6. Two Shared Socioeconomic Pathways (SSPs) are considered herein: SSP2–4.5 and SSP5–8.5, or simply SSP2 and SSP5. The downscaling and bias correction of raw GCM data were carried out using WorldClim v2.1 as the baseline climate [33]. The calibration undertaken by the data providers assumes high spatial autocorrelation and was generated by computing the absolute or relative difference between the GCM outputs for the baseline periods and target periods (for this study, 2041–2060) with global cross-validation correlations of about 0.99 for temperature and about 0.86 for precipitation [34]. A 14-member ensemble of bias-corrected monthly datasets for 2041–2060 was chosen, comprising the following GCMs: ACCESS-CM2, BCC-CSM2-MR, CanESM5, CMCC-ESM2, CNRM-CM6-1, EC-Earth3-Veg, FIO-ESM-2-0, GISS-E2-1-G, HadGEM3-GC31-LL, INM-CM4-8, IPSL-CM6A-LR, MIROC-ES2L, MPI-ESM1-2-HR, UKESM1-0-LL. This bias-corrected ensemble was subsequently used to compute the KG climate classification system for the previously referred periods: 1970–2000 and 2041–2060 under both SSPs for each grid point worldwide. The methodology used to attain a worldwide KG climate classification is presented in the next section.

2.2. Köppen’s Climate Classification

The KG climate classification system [2,6,7,11,36] is based on a subdivision of five major terrestrial climate types, represented by capital letters: A (tropical), B (dry), C (temperate), D (continental), and E (polar). The second letter denotes the seasonal precipitation type: s (dry summer), w (dry winter), and f (no dry season). Lastly, the third letter specifies the level of heat: a (hot summer), b (warm summer), c (cold summer), d (very cold winter), h (hot climate), and k (cold climate). It is worth mentioning that the A climate type can also be associated with a second letter, f (rainforest), or m, highlighting a well-defined monsoon regime. For the B type, W (arid) and S (semi-arid) are also used. Lastly, associated with the E type (polar), T or F are related to the tundra or ice cap, respectively.
This climate classification has been modified and updated over time ([8,9,10] and others). It is worth noting that the change in the classification may lead to different descriptions of the main group climates. In this study, the KG climate classification system denomination and calculation followed the methodology presented by Andrade and Contente [37] (Table A2; cf. full type description and definition criteria in their Tables 3–5), which in turn was based on Kottek et al. [38]. Therefore, a brief description of the 31 KG climate types is presented in Table A1. The color scheme for all figures presented herein was adopted by Peel et al. [15] and Beck et al. [39].
This study will assess changes in the worldwide KG climate classification system between the historical period (1970–2000) and the future (2041–2060), under SSP2 and SSP5.

2.3. Study Areas

This analysis utilizes both spatial data representing wine regions around the world and country-level listing of wine regions. The spatial data used to assess historic and future KG climate types is a database of major winegrowing regions worldwide developed by Bois et al. [40], called Vineyard Geodatabase (VGDB). The geodatabase consists of wine-producing regions delineated from various sources, including American Viticultural Areas in the USA, Geographic Indications in Australia and New Zealand, Wine Districts in South Africa, Protected Designation of Origin in Europe, and other region boundaries from the World Atlas of Wine. For Europe, vineyard limits were also adjusted to areas planted with grapevines using the Corine Land Cover database 2006 version [41]. VGDB has been used in various studies in the global analysis of wine region climate characteristics [42,43,44] and is continuously updated. This research utilized Version 1.2.3, which has the boundaries for 686 wine-producing regions worldwide. However, this number of wine-producing regions was restricted to match the country-level data in the World Wine Production Outlook report [32]. The list of countries included in this study can be found in Table 1, and their locations are shown in Figure 1. The final number of wine regions worldwide used in this analysis is 490, with 161 in the EU, 285 in the NH non-EU, and 44 in the Southern Hemisphere (SH).
Within the European Union (EU) countries, Cyprus and Malta were not considered due to the residual 5-year average wine production. Outside the EU, in the Northern Hemisphere (NH), Moldova and Russia were not included due to the lack of data. It is worth mentioning that the list of countries provided in Table 1 is ranked in decreasing order of wine production (data retrieved from Tables 1 to 3 in [32]).

3. Results

The results are presented following this framework. First, for the historical period (1970–2000), the wine regions and the KG climate types are analyzed and detailed. Second, the worldwide KG classification system map distributions for the historical and projections (2041–2060) under SSP2 and SSP5 are analyzed independently of the wine regions. In the third subsection, the relationships between climate change projections for the KG and wine regions are presented. Finally, following the work by Jones and Schultz [45], the impacts of climate change projections in emerging cool-climate wine regions (focused on the locations previously studied) are undertaken.

3.1. Wine Region KG Climate Types 1970–2000

During the historical period (1970–2000) for the climate data used in this research (Figure 2), wine regions were found to range across KG climate types, mostly in the mid-latitudes. Temperate C types represented 66.3% of the wine regions worldwide, while Dry B types were found in 23.1% and Continental D types in 7.2% (Table A3). Within the Temperate C types, temperate oceanic (Cfb) accounted for just over 30% of the wine regions, with humid subtropical (Cfa) representing close to 13%. Mediterranean climate types made up just under 20% of the worldwide wine regions during 1970–2000, with warm summer (Csb) accounting for 9.5% and hot summer (Csa) representing 10.3%. For the Dry climate types, semi-arid cold (BSk) was the most dominant, accounting for 16.6%. Within the Continental D climate types, warm summer humid continental (Dwb) made up 4.1% of the total worldwide.
Within the European sector wine regions examined in this research, Temperate C types represented 91.3% of the regions during 1970–2000, with temperate oceanic (Cfb) as the dominant climate type at 47.5%, followed by hot summer Mediterranean (Csa, 21.1%) and humid subtropical (Cfa, 14.9%) (Table A5). For other NH wine regions, Temperate C types were 47.8% of the total, with warm summer (Csb, 27.6%) and hot summer Mediterranean (Csa, 10.9%) as the most dominant climate classes. Other climate types in the NH regions accounting for significant percentages include semi-arid cold (BSk) at 17.2% of the total and warm summer humid continental (Dwb) at 12.8%. For the SH wine regions considered in the study, Temperate C types accounted for 60.6% of the wine regions. Within the C types, temperate oceanic (Cfb, 32.9%) and humid subtropical (Cfa, 16.9%) were the most common climate classes. Dry B types were also represented in the SH wine regions at 32.3% of the total area, with semi-arid cold (BSk, 23.2%) the most common type. Variations in climate types by country during the historic period (1970–2000) can be found in Table A6, Table A7 and Table A8.

3.2. Climate Change Projections for the KG Climate Classification System

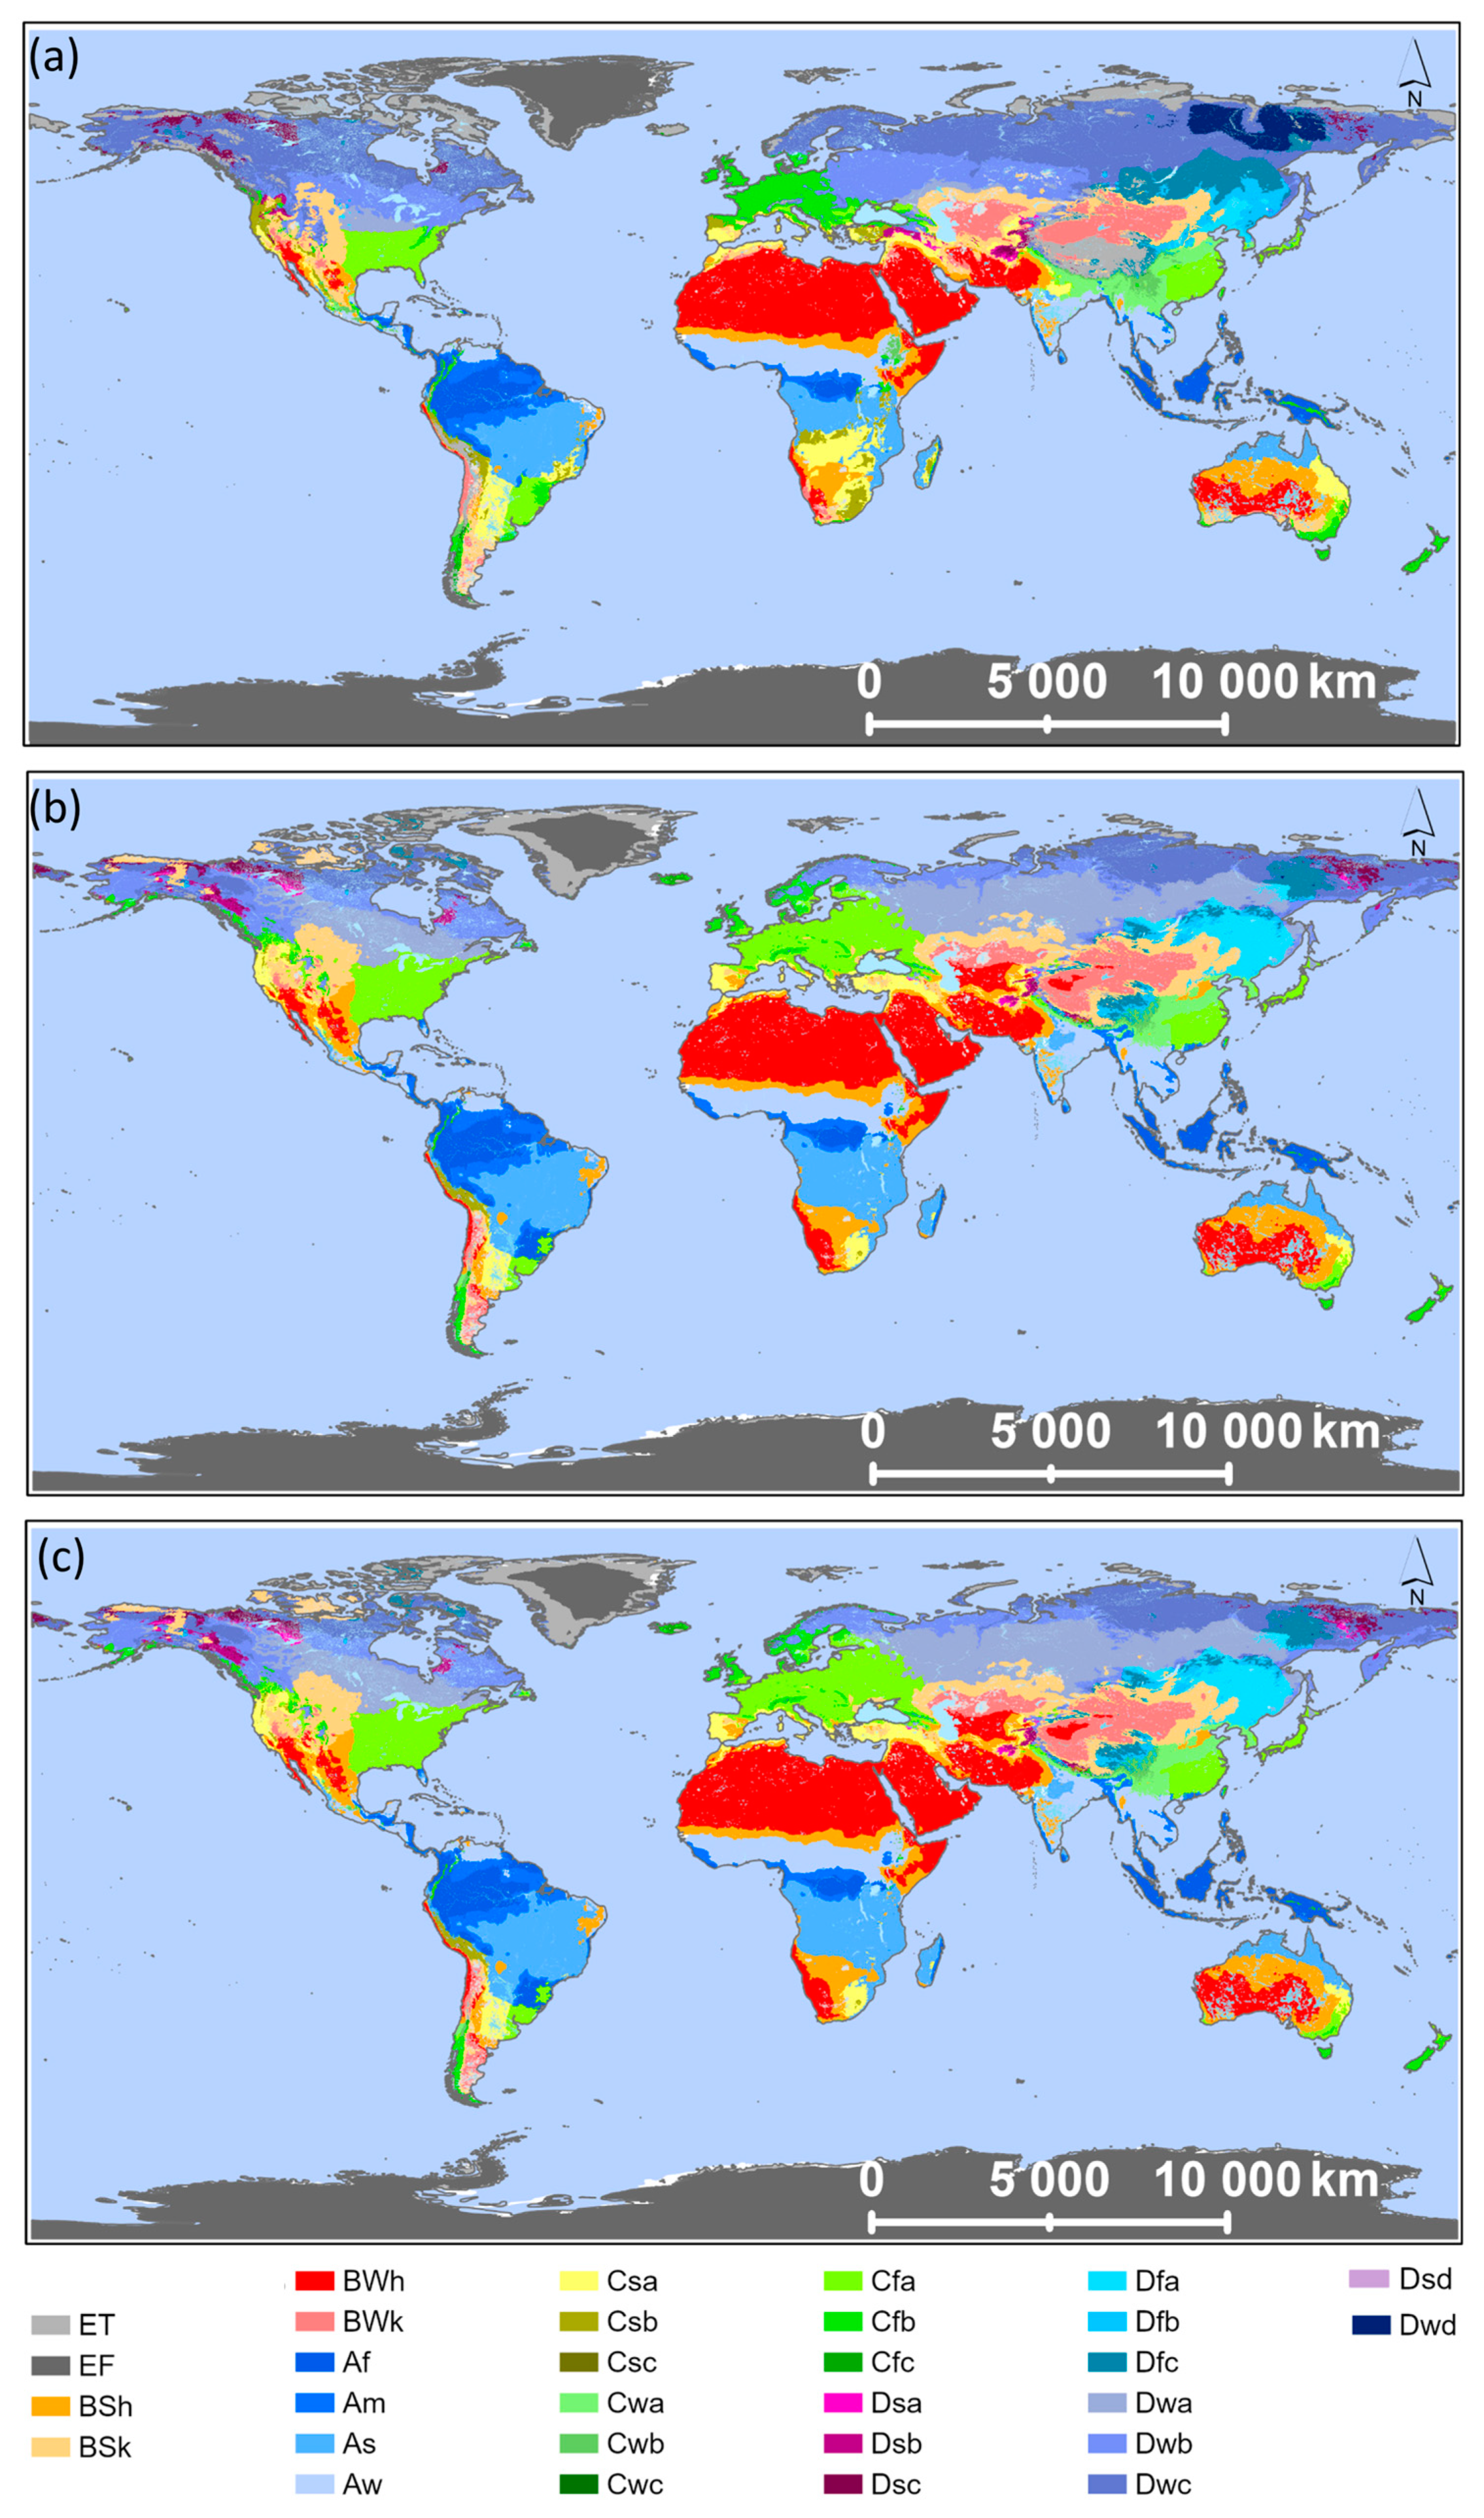
Figure 2 shows the global map series of the KG climate classification for the period 1970–2000, as well as under the selected future SSP scenarios (SSP2 and SSP5). The KG climate type map of eastern Europe for the historical period shows that only three main climate types are present: temperate (C), continental (D), and polar (E), in predominant order of climate type by land area. Under future scenarios, continental climate types depict a decrease in terms of area; the polar tundra (ET) climate completely disappears (previously in Iceland, the Alps, the Pyrenees, and the northern coast of Norway), while temperate climate types show a significant increase across eastern Europe. Across the Iberian Peninsula (IP), the temperate oceanic climate (Cfb) and the temperate warm-summer Mediterranean climate (Csb) shift to the temperate hot-summer Mediterranean climate (Csa), while in the southeast of the IP Csa areas change to dry semi-arid hot (BSh) and dry semi-arid cold (BSk) climates. Most of central and eastern Europe is predicted to change from a temperate oceanic climate (Cfb) to a temperate humid subtropical climate (Cfa).
In Asia, the biggest changes are observed in the Himalayan Mountain Range, where the polar tundra climate (ET) completely disappears, giving way to the continental warm-summer humid climate (Dfb) and continental subarctic climate (Dfc). Moreover, in the Mongolian region, the current Dfc climate is expected to change completely to a continental hot-summer humid climate (Dfa) and a continental warm-summer humid climate (Dfb). In northern Asia, monsoon-influenced summer humid continental and subarctic climate (Dwb and Dwc) areas contract due to the expansion of both monsoon-influenced hot summer humid continental (Dwa) and Mediterranean-influenced subarctic climate (Dsc) in the north-easternmost part of Asia (Figure 2).
In North America, particularly in Canada, most of the changes are very similar to the northernmost part of Asia, where monsoon-influenced hot summer humid continental (Dwa) climate areas expand and monsoon-influenced summer humid continental and subarctic climate (Dwb and Dwc, respectively) areas contract. In the United States of America (USA), there is an increase in the dry semi-arid hot (BSh), dry semi-arid cold (BSk), arid cold (BWk), and temperate humid subtropical climate (Cfa) climate areas. It is worth mentioning the decrease in polar icecap (EF) and the increase in polar tundra climate (ET) in Greenland (Figure 2).
Close to the equator, the KG classification areas remain very similar between historical and future periods under both scenarios. Some changes are projected southwards of the tropic of Capricorn (23.43° S), where temperate hot-summer Mediterranean climate (Csa) climate areas decrease due to the expansion of tropical savanna, tropical dry summer climate (As), and dry hot desert (BWh) areas.
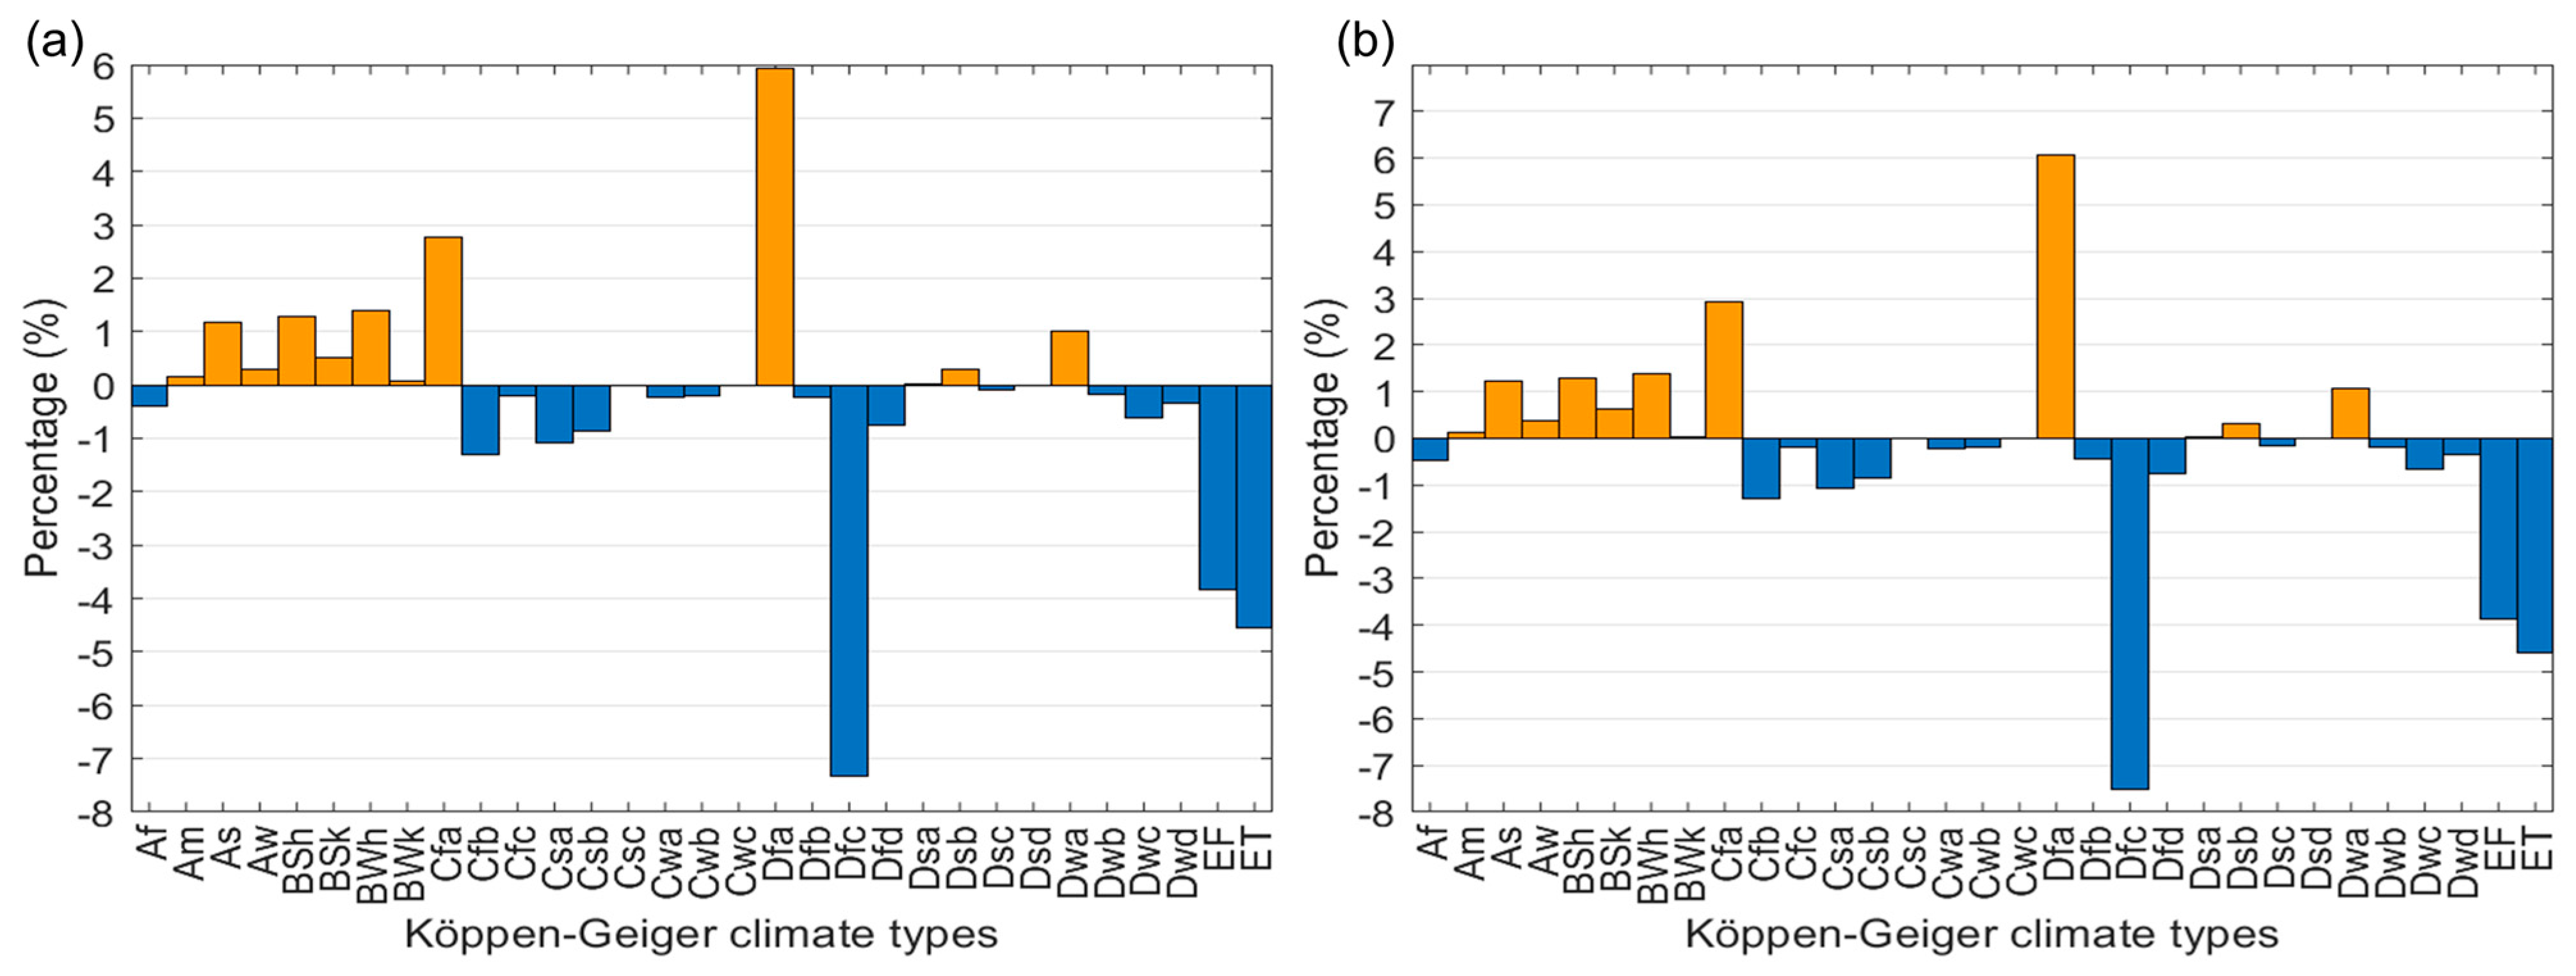
Despite the shifts in the geographical distribution of the different KG climate type classes, the effects of climate change depict a significant impact only on a few KG climate types in terms of the global covered area (Figure 3; Table A4). Three KG climate types are projected to have a major decrease: continental subarctic (Dfc) climate (−7.3%), polar tundra (ET) climate (−4.6%), and polar icecap (EF) (−3.8%), while continental hot-summer humid (Dfa) and temperate humid subtropical (Cfa) climates are projected to increase by 5.2% and 2.8%, respectively.

3.3. Relationship between Climate Change Projections for KG Classes and Wine Regions

In global terms, within the selected world wine regions, the most important changes are projected to occur in temperate humid subtropical (Cfa) (from around 13% to just over 34%), dry semi-arid hot (BSh) (from around 2% to nearly 18%), and temperate hot-summer Mediterranean (Csa) (from around 10% to just over 17%) climate types when comparing the periods 1970–2000 and 2041–2060, under both SSPs (Table A3). The cold temperate climate types (D) in wine regions are projected to almost disappear, while the tropical climate types (A) are projected to increase in area. Furthermore, decreases in the temperate oceanic (Cfb) climate types (from around 30% to close to 6%), dry semi-arid cold (BSk) (from around 17% to just over 5%), and temperate warm-summer Mediterranean climate (Csb) (from over 9% to close to 1%) are also projected. It is worth mentioning that, due to the resolution of the gridded datasets used to compute the KG climate classification, it is not possible to resolve microclimatic conditions across wine regions. Therefore, some inconsistencies can be identified, such as the existence of vineyard land cover in areas classified as polar (ET) climates (Table A3), namely in some deep valleys in the Andes Mountain Range.
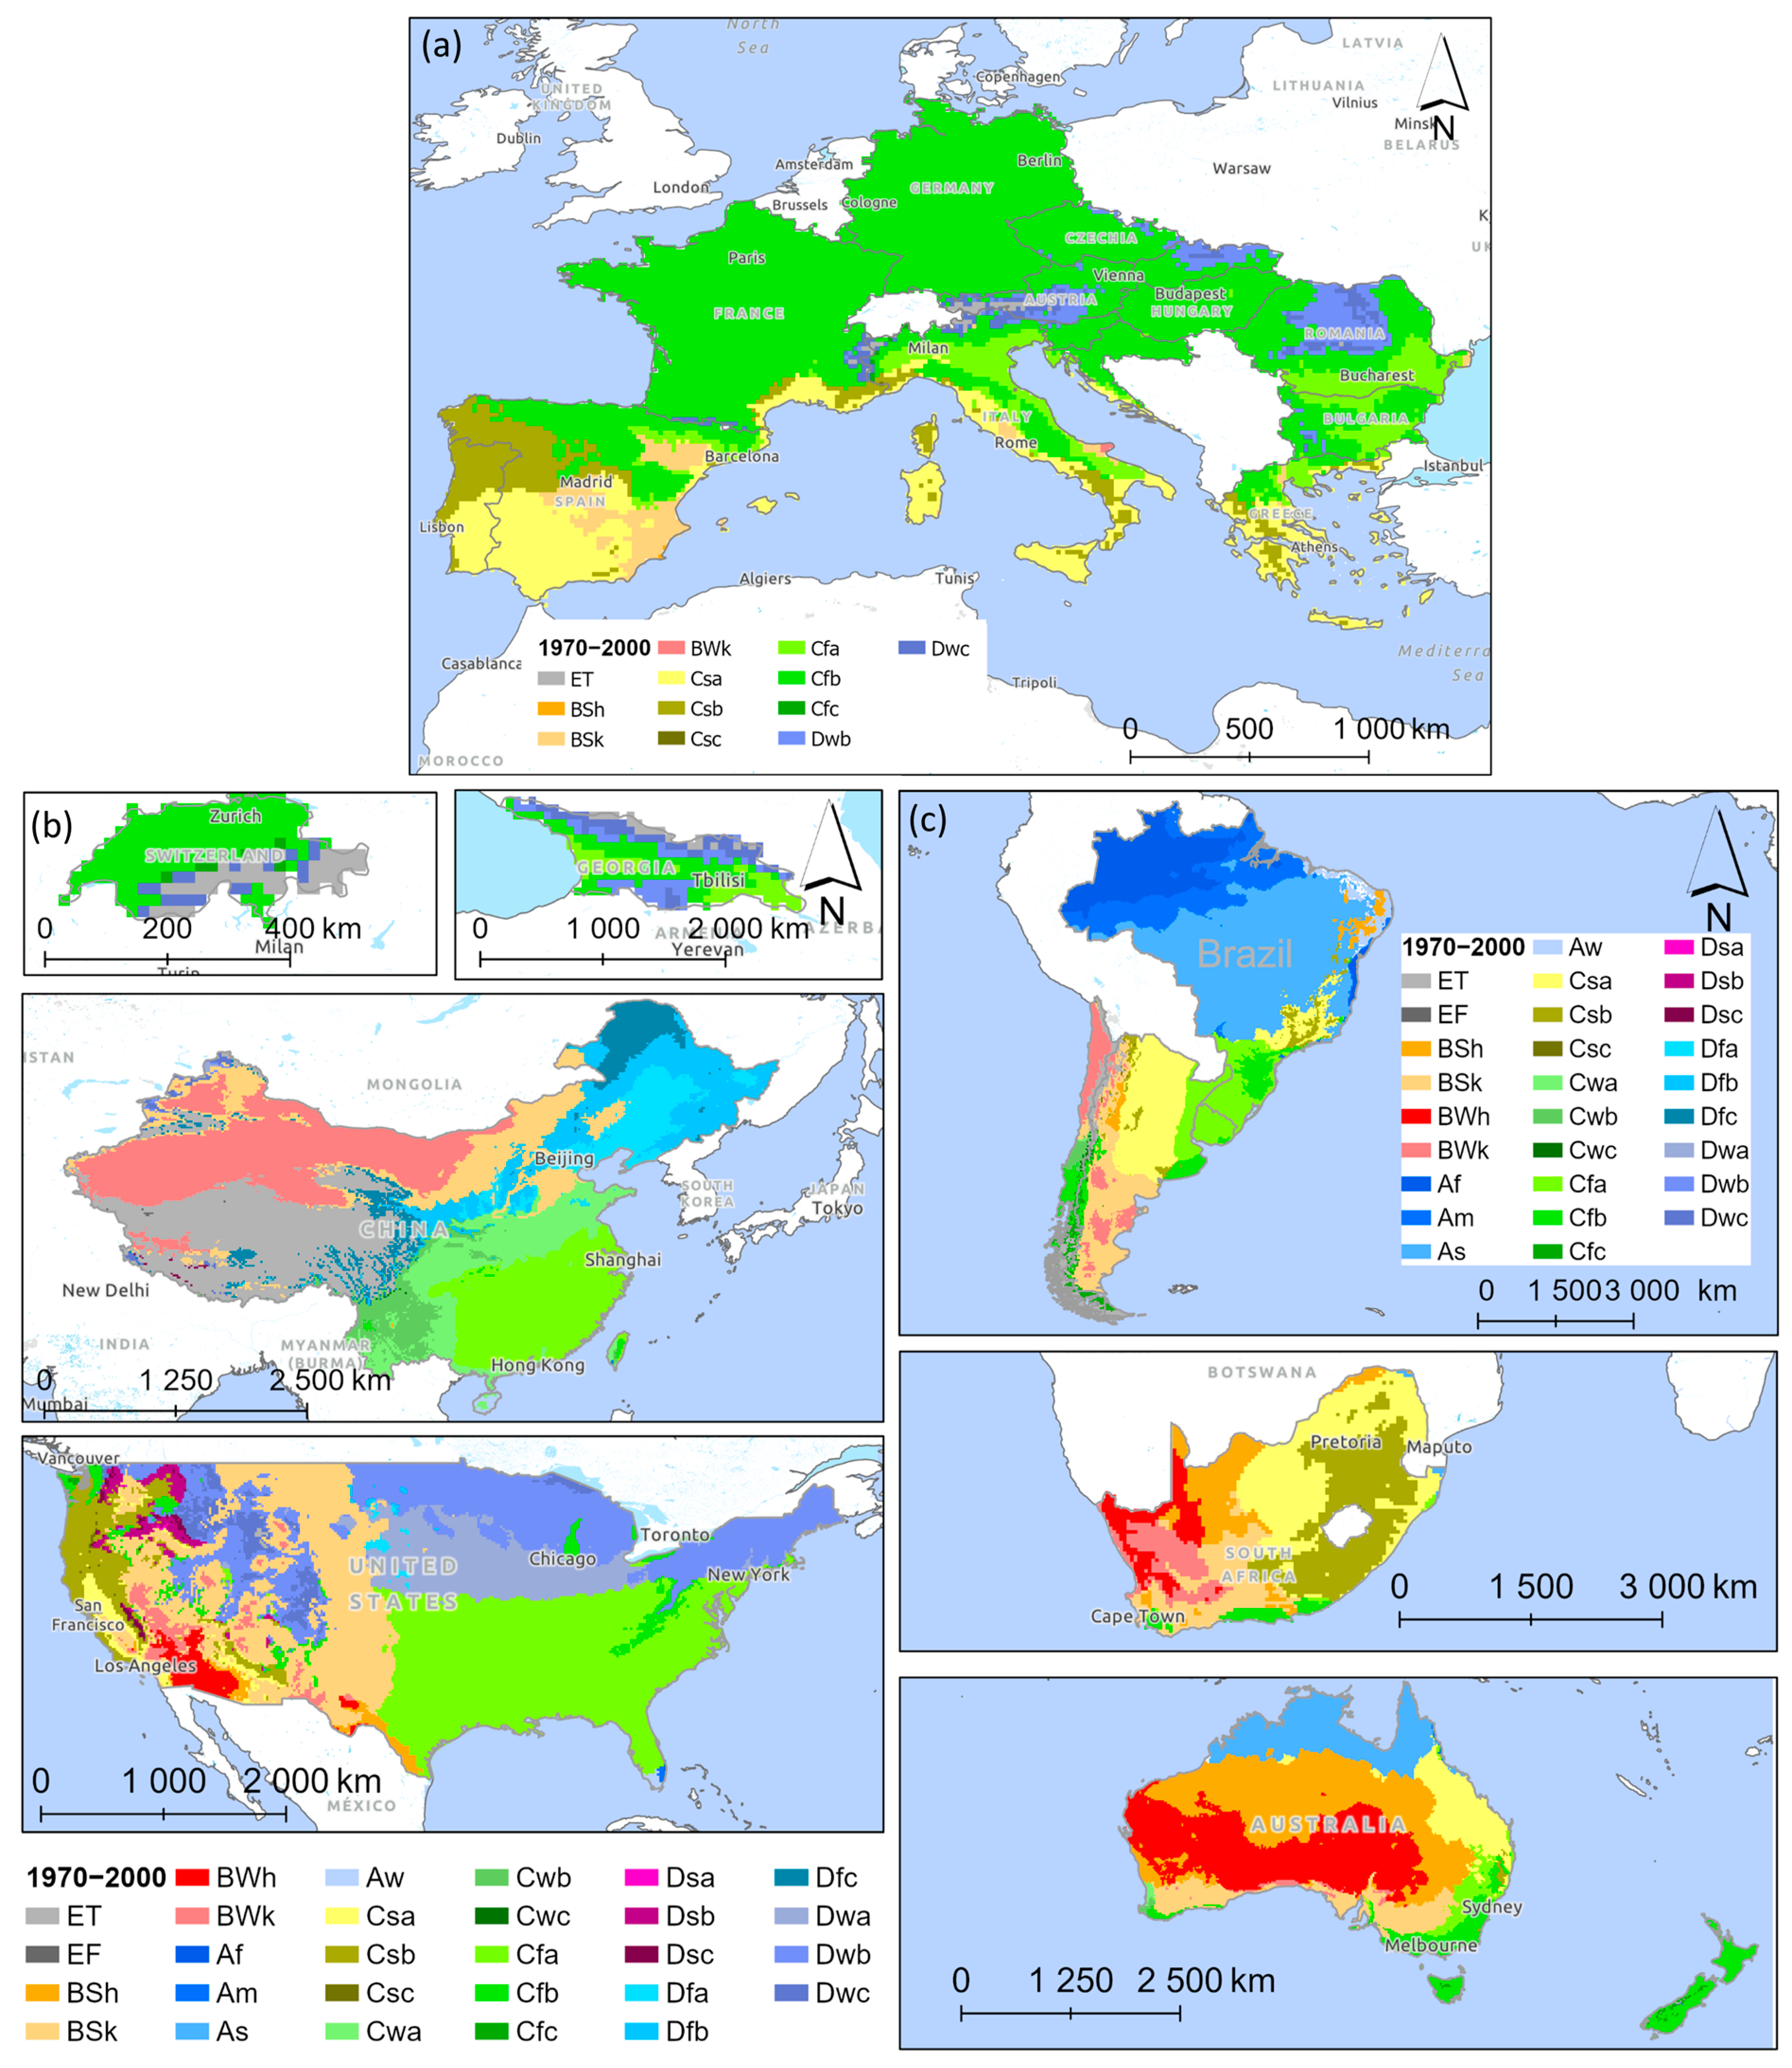
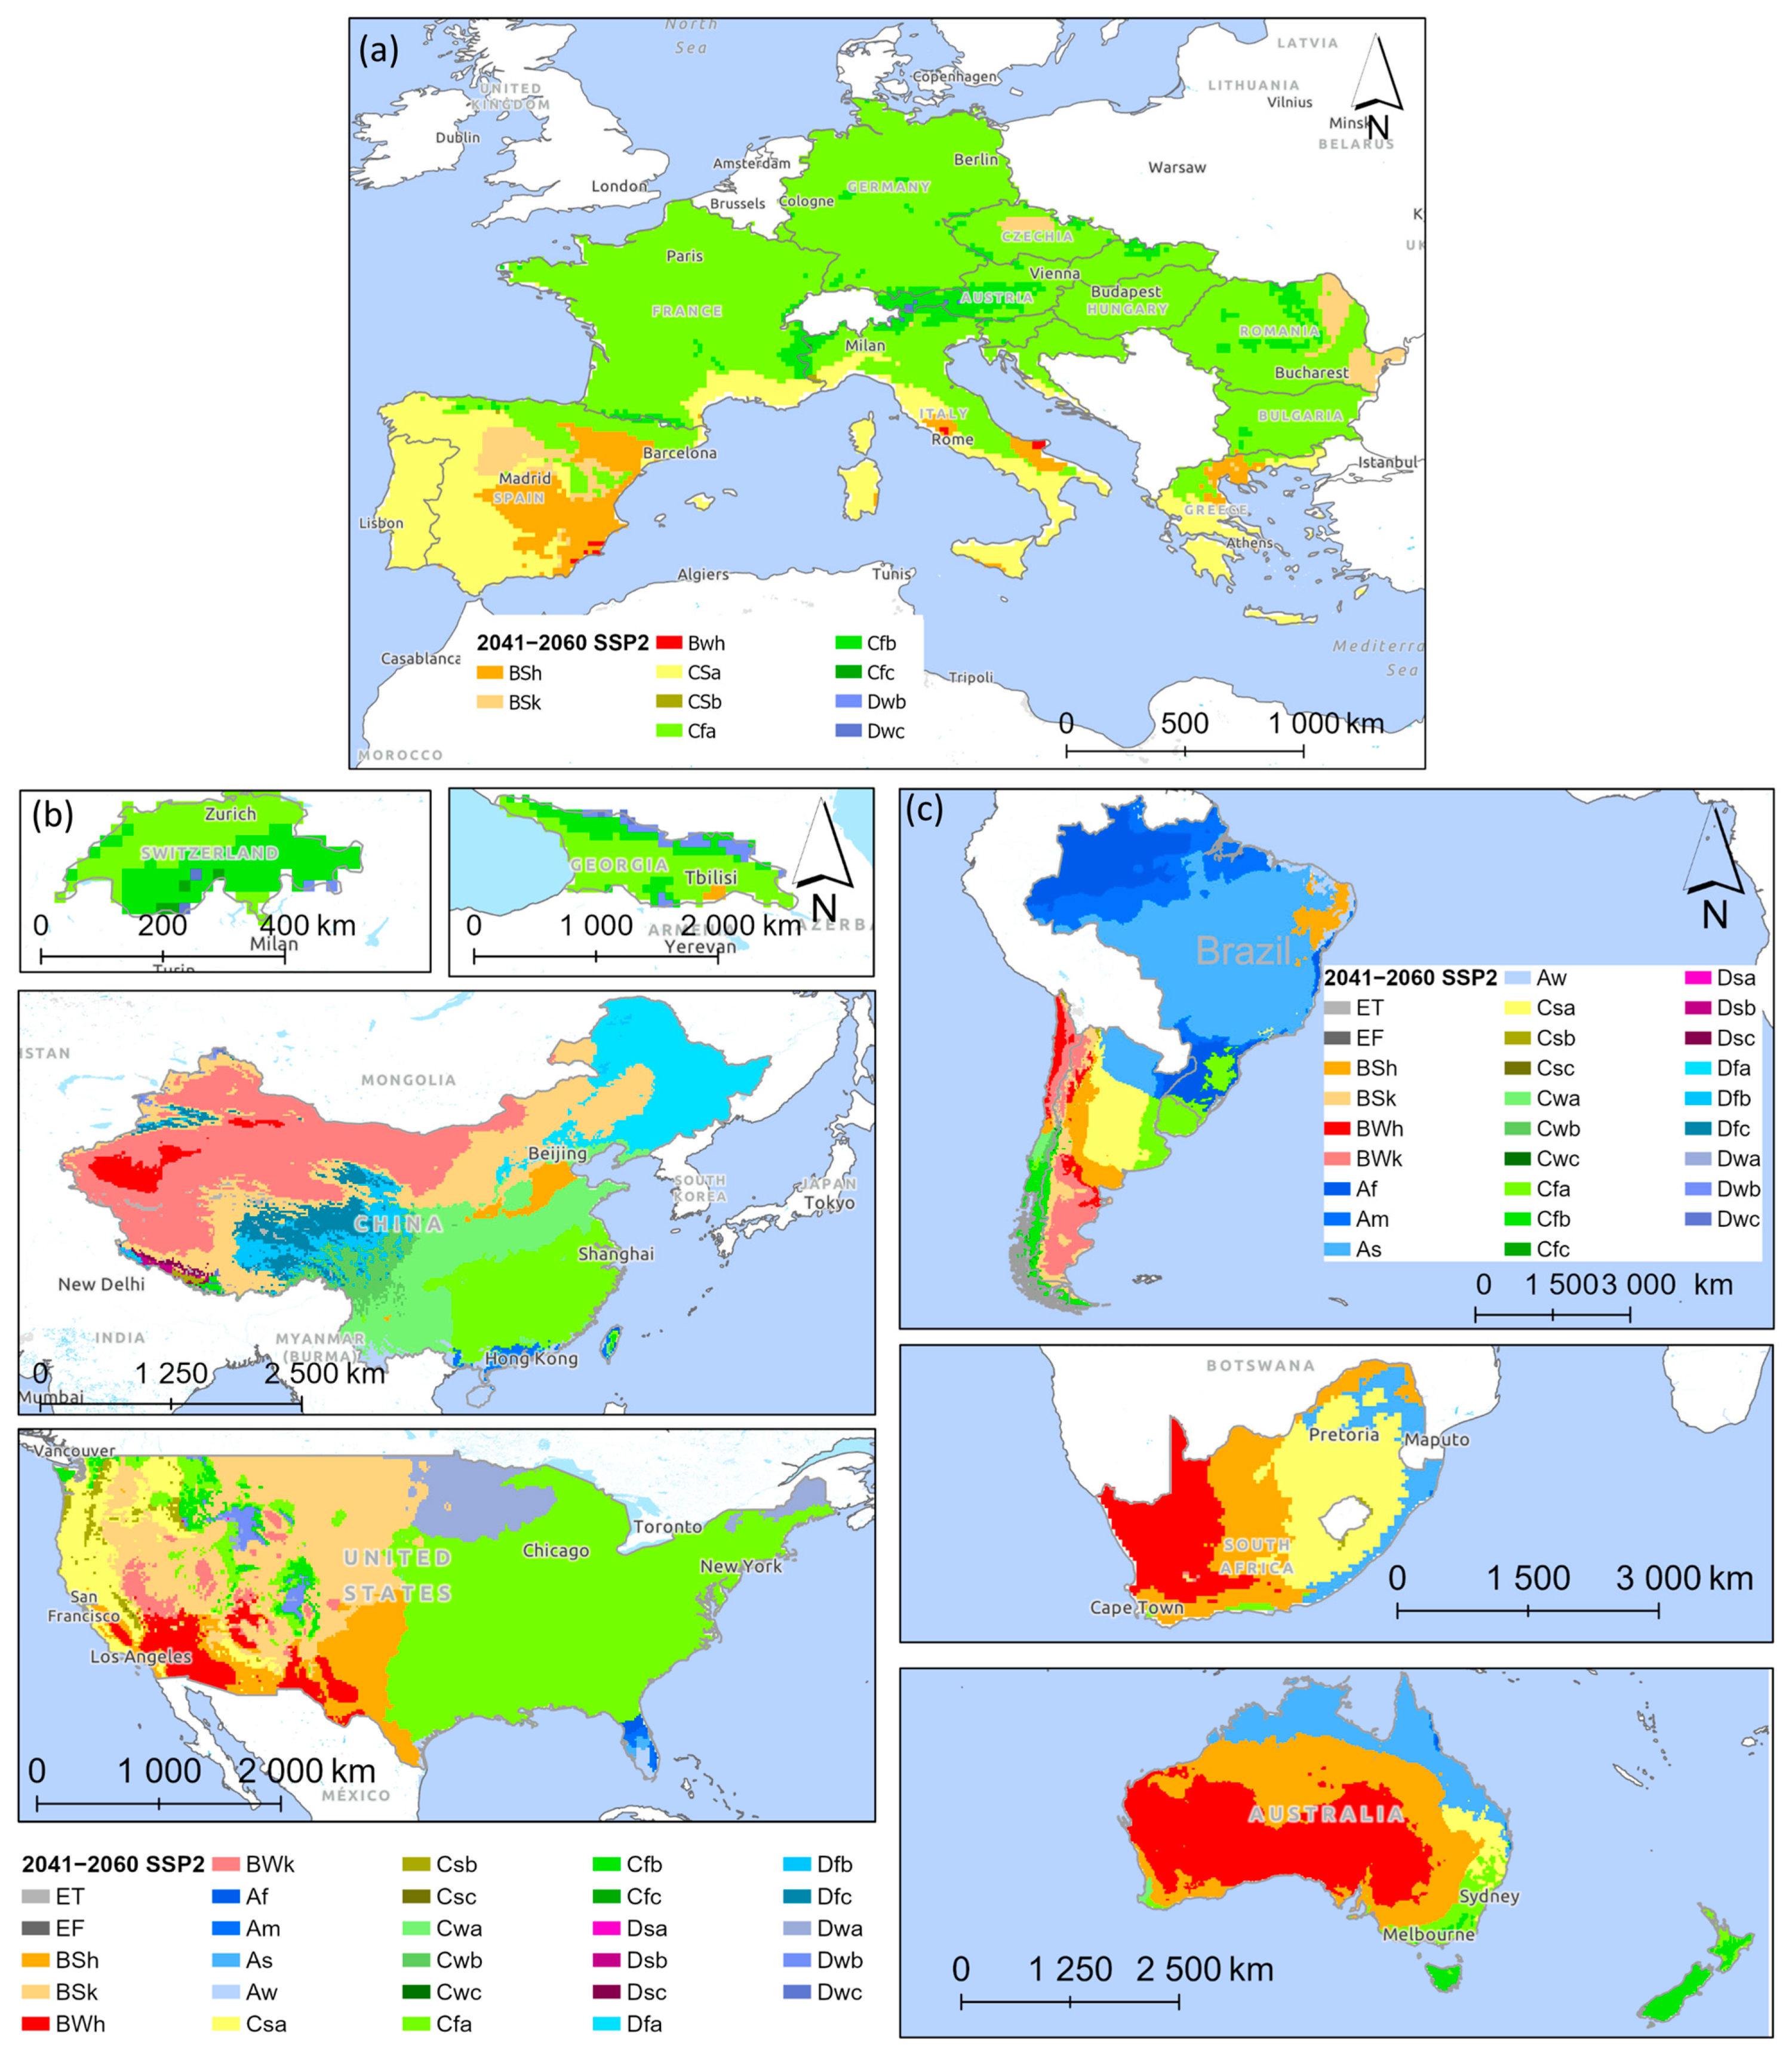
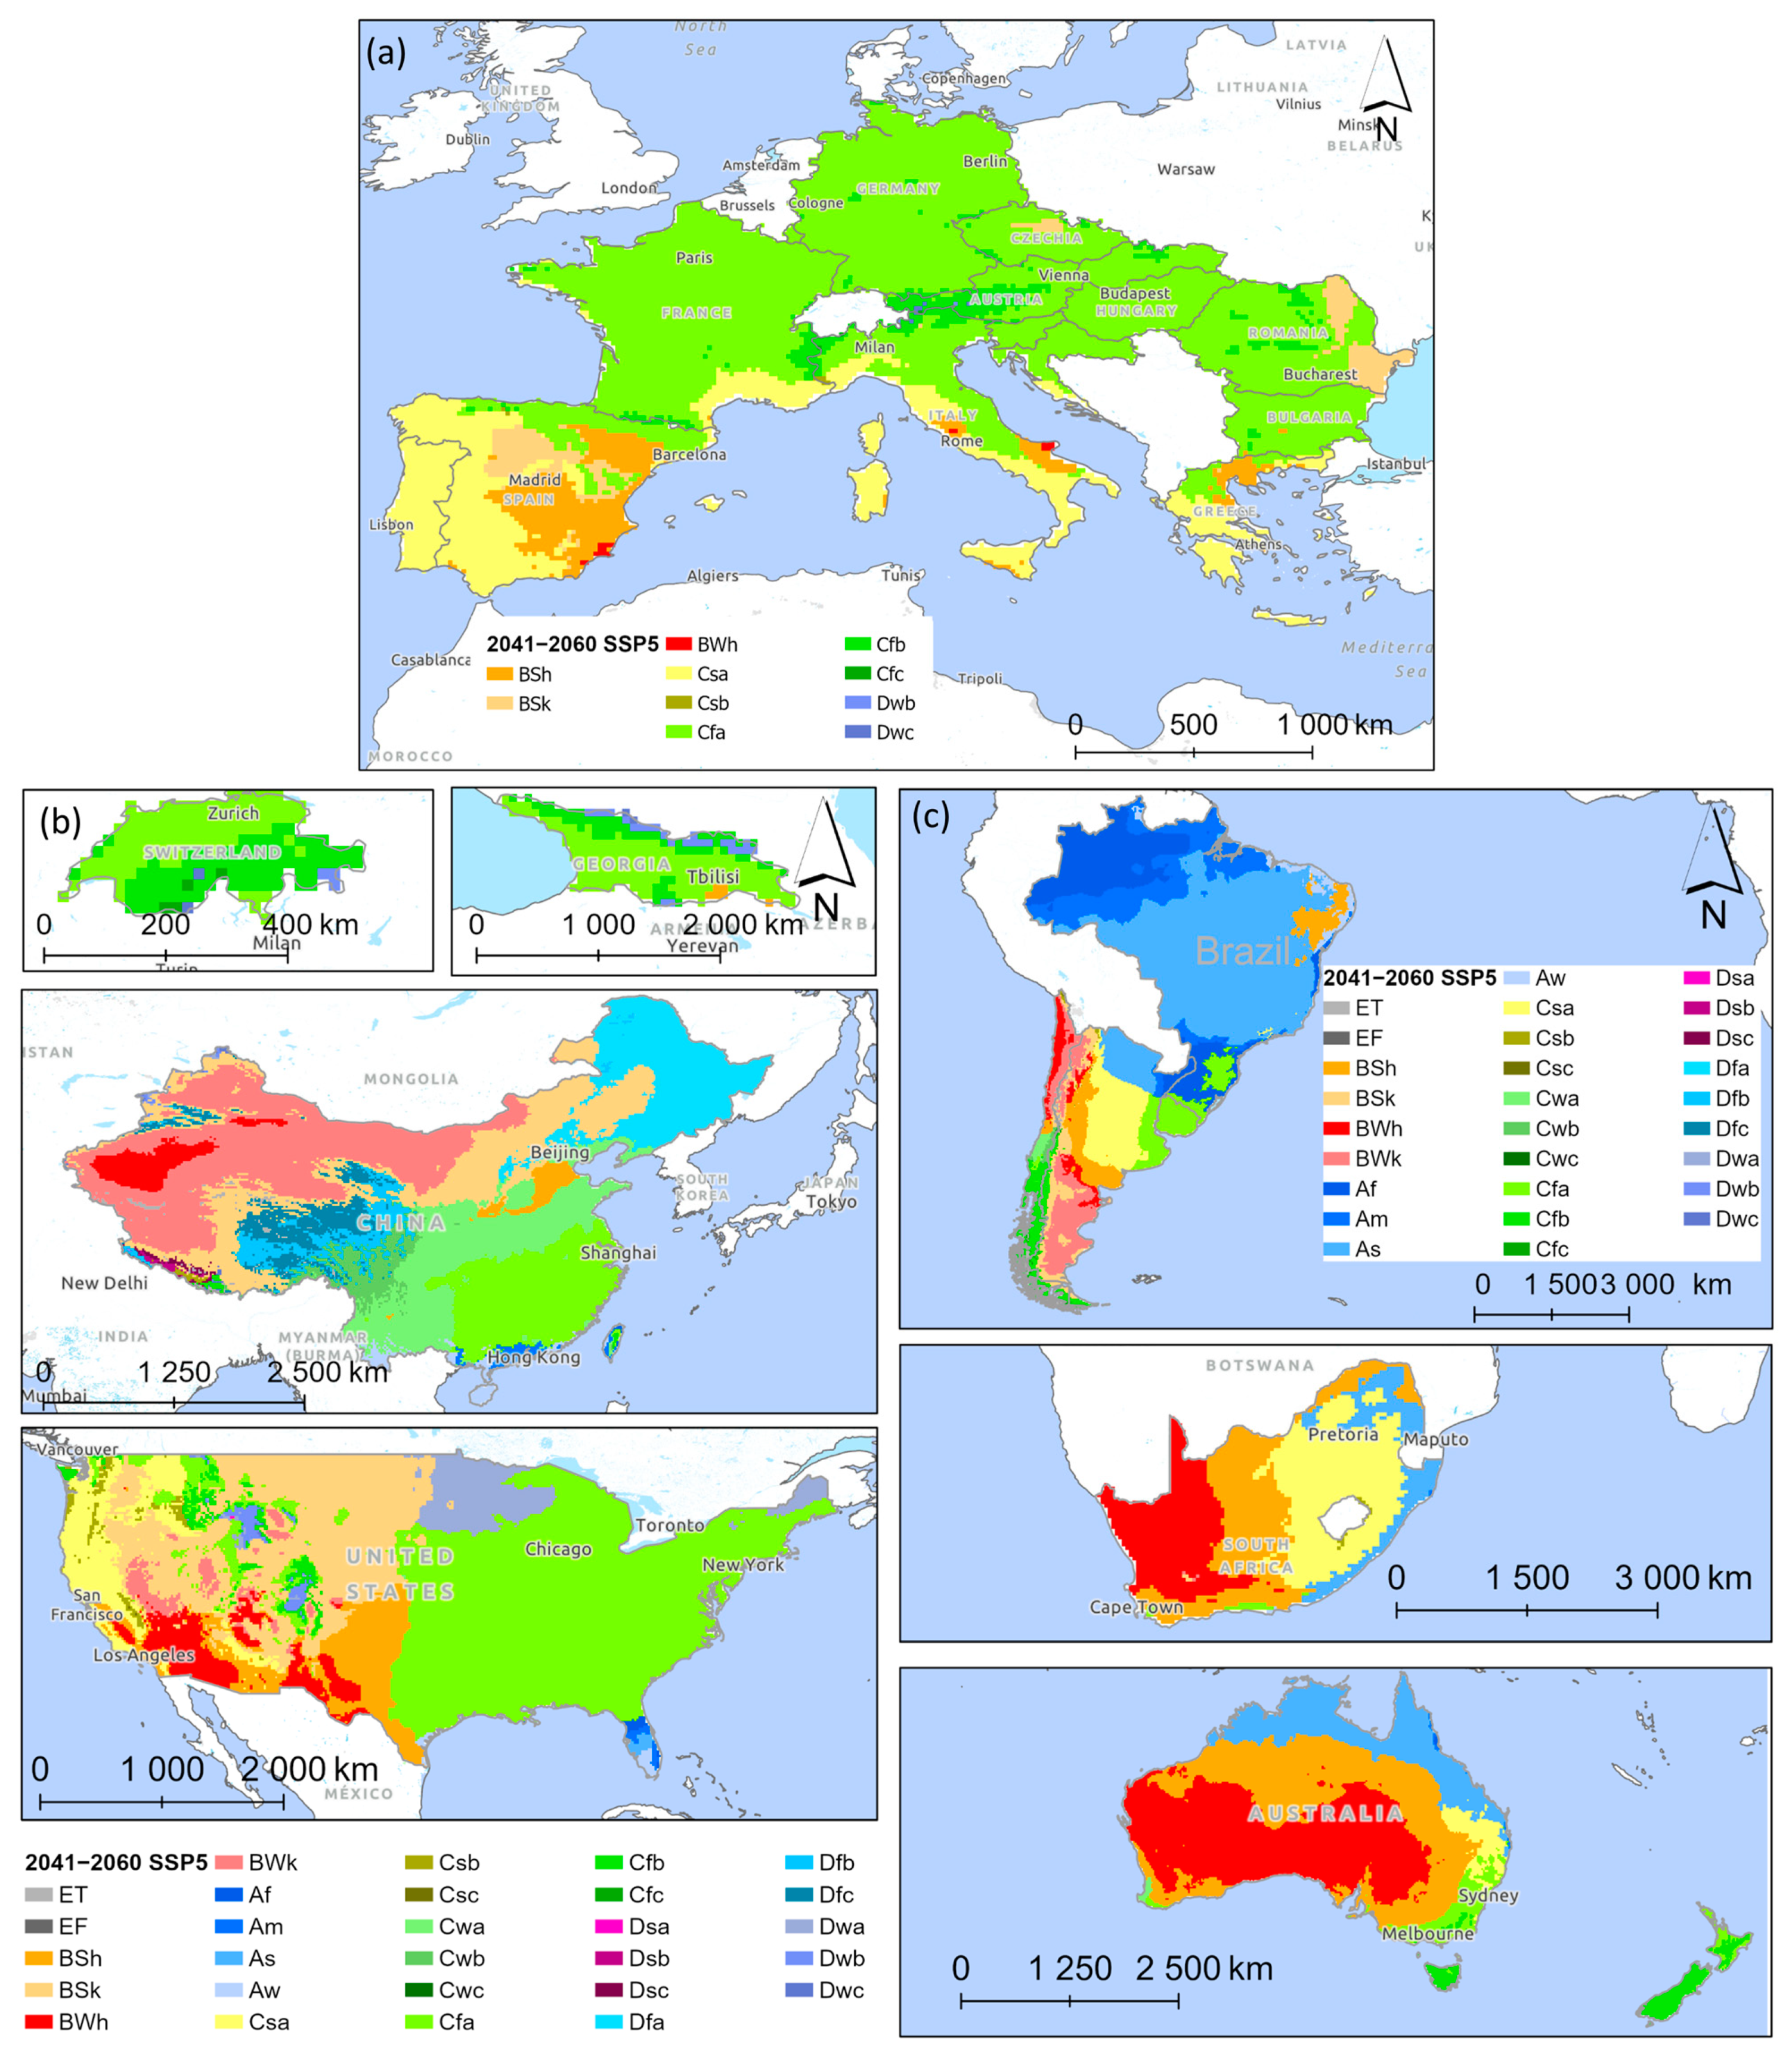
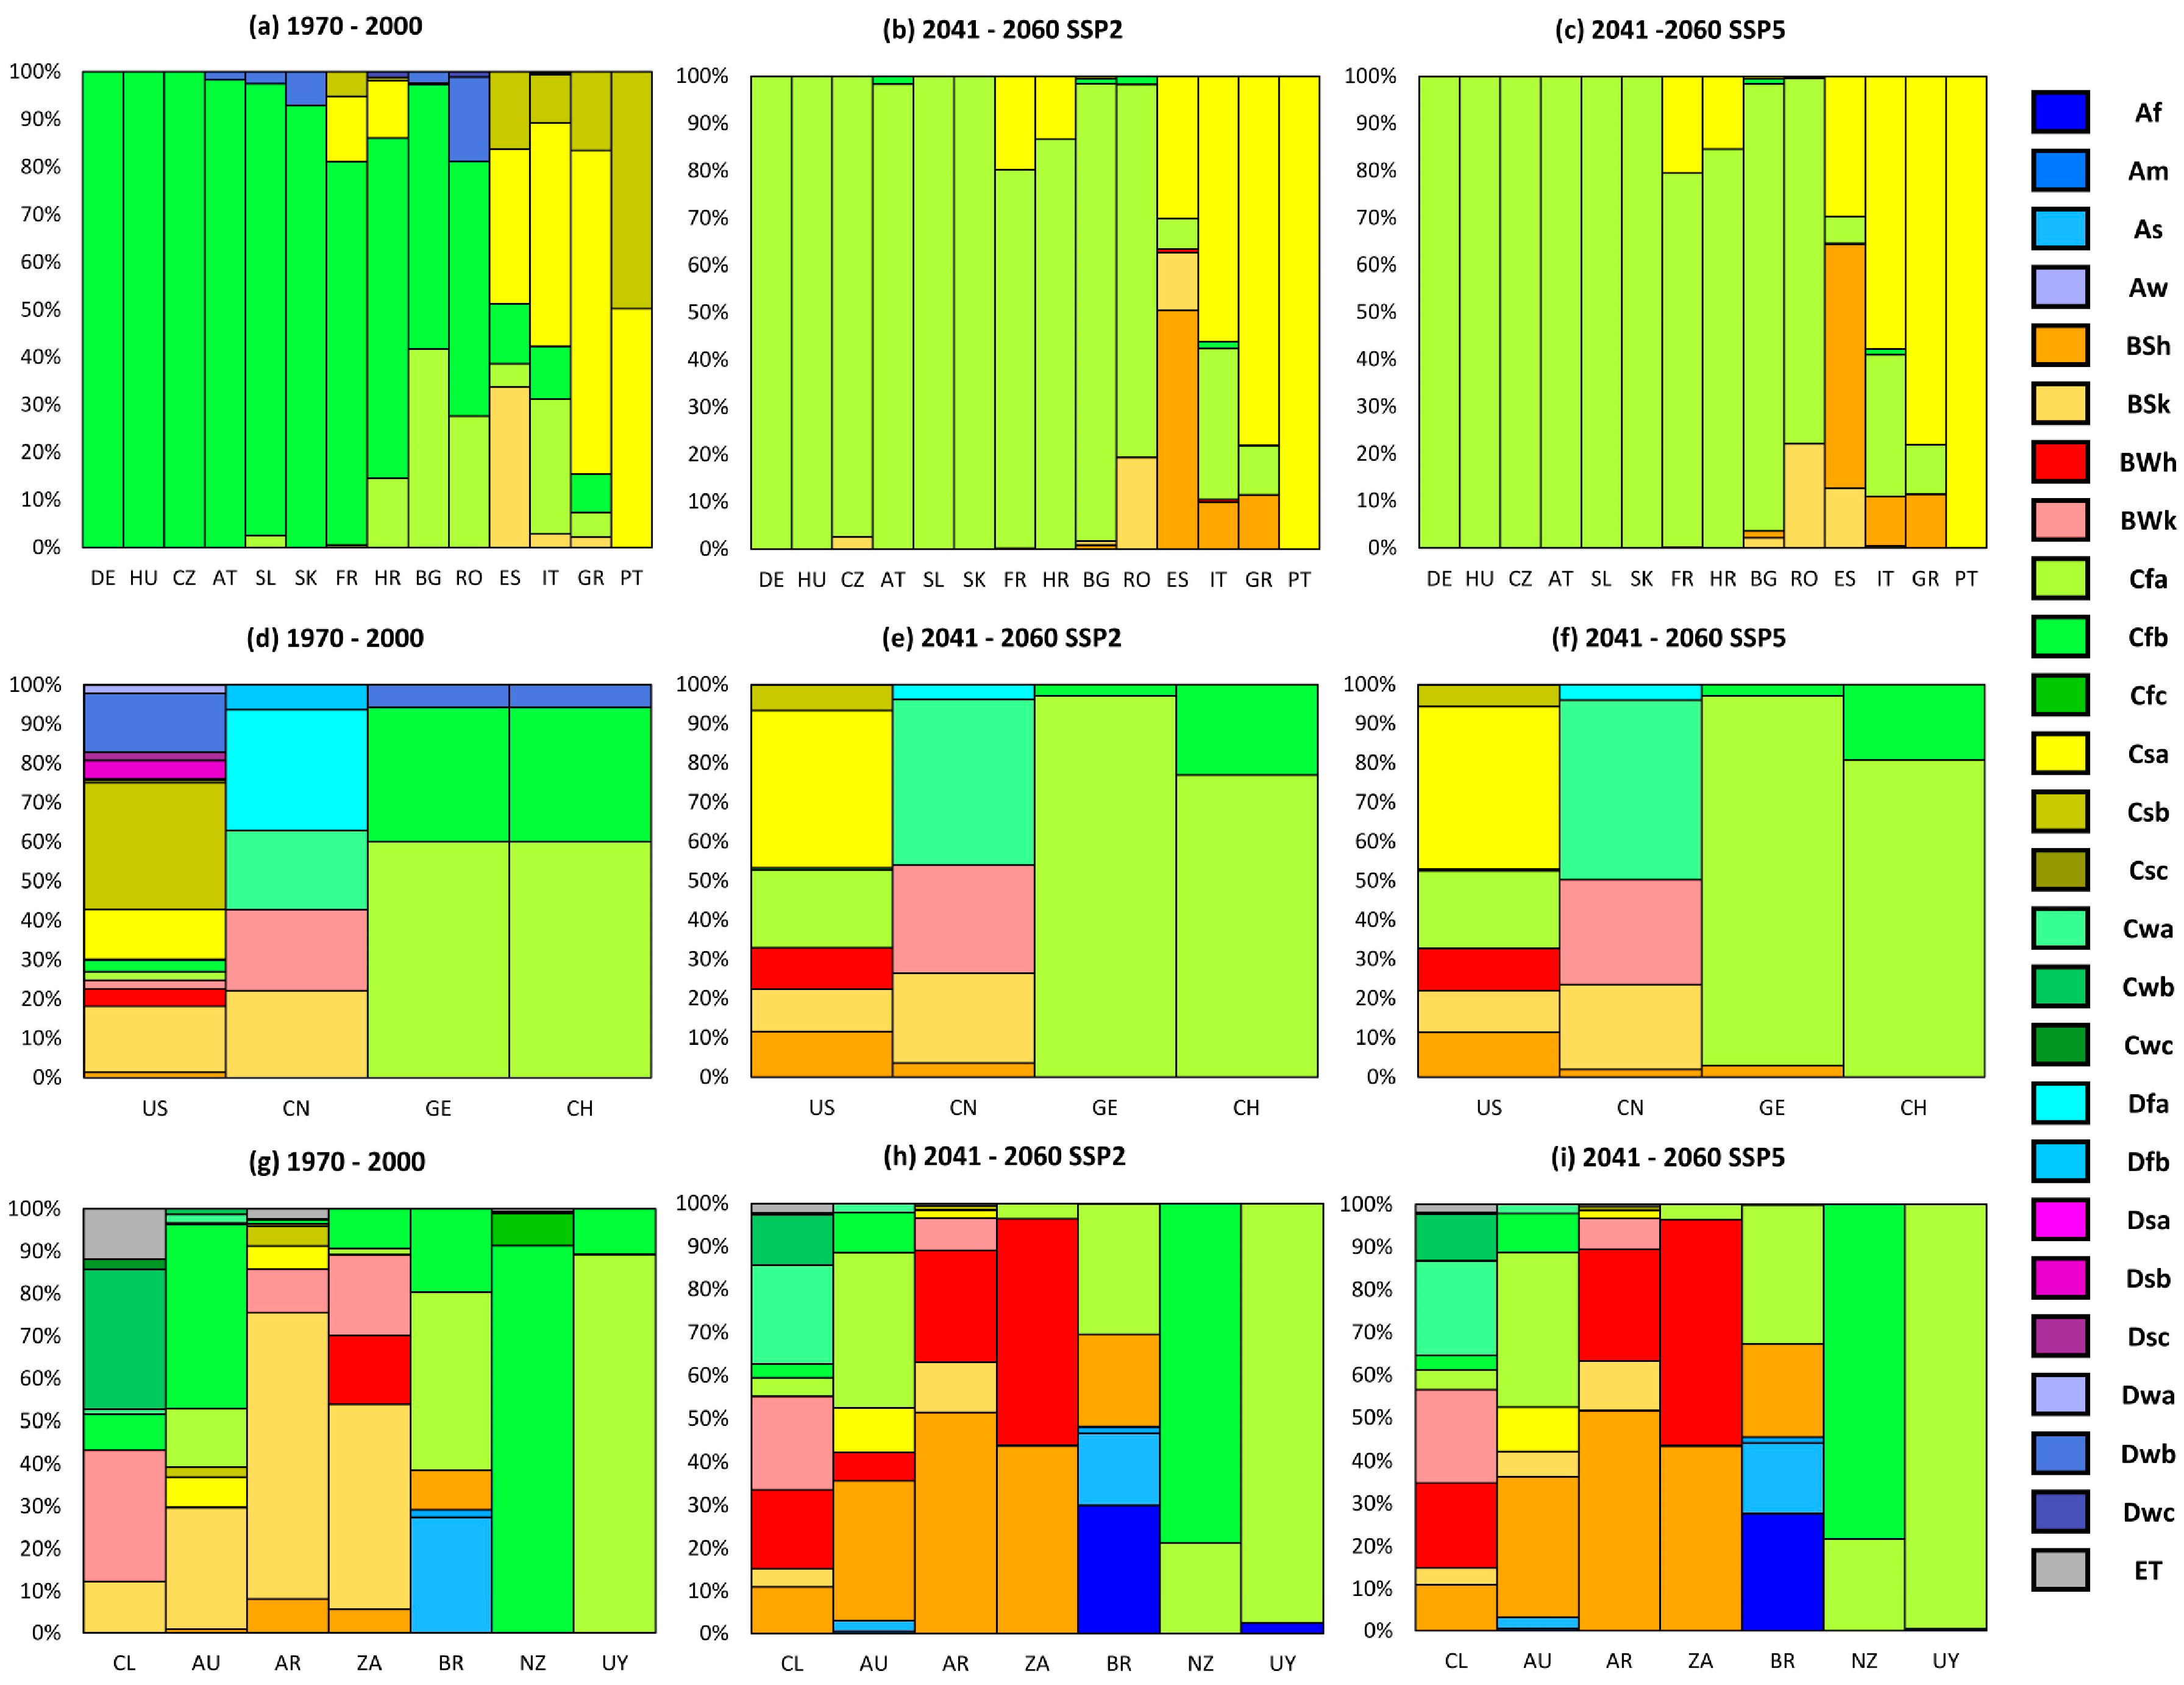
In most of the vineyard areas in the European Union (EU) (Figure 4a, Figure 5a, Figure 6a and Figure 7a; Table A5), a general shift from a warmer summer climate (b type) to a hot summer climate (a type) is expected. In the north-westernmost part of the IP and along the Mediterranean coast, the temperate warm-summer Mediterranean (Csb) climate is projected to change entirely to the temperate hot-summer Mediterranean (Csa). Furthermore, the vineyard areas in the southeastern IP may experience a shift from the semi-arid cold steppe (BSk) to the semi-arid hot steppe (BSh) and even the arid hot desert climate (BWh), particularly in the Murcia region of Spain. Across the other major vineyard regions in Europe, the KG climate classification is expected to change from a temperate oceanic (Cfb) to a humid subtropical (Cfa) climate.
For other areas across the NH (Figure 4b, Figure 5b, Figure 6b and Figure 7; Table A5), wine regions examined in the research include areas in China, Switzerland, Georgia, and the USA, with the latter having significantly more areas on the west coast. For China, the KG classification shows that the climate in the vineyard areas will likely remain unchanged (Figure 8; Table A6, Table A7 and Table A8).
Wine regions of the west coast of the USA are mostly projected to transition from a temperate warm-summer Mediterranean (Csb) to a temperate hot-summer Mediterranean (Csa) climate type, like what is projected in the IP, while in California, dry arid hot climate types (BWh-desert) are expected to increase, reflecting that the summers are expected to be much hotter. In contrast, the east coast of the USA is projected to experience a similar transformation as seen in much of central Europe, shifting from the temperate oceanic (Cfb) climate to the humid subtropical (Cfa) climate (Figure 8; Table A6, Table A7 and Table A8).
In the SH, similar changes as projected for the NH are anticipated, with vineyard regions likely experiencing shifts from dry semi-arid cold (BSk) to dry semi-arid hot (BSh), namely in Argentina, South Africa, and Australia. In Chile, a transition to an arid hot desert (BWh) climate is projected since vineyard areas are already found in an arid cold (BWk) climate (Figure 8; Table A6, Table A7 and Table A8).

3.4. Impacts of Climate Change Projections in Emerging Cool Climate Wine Regions

Jones and Schultz [45] assessed the impacts of climate change in emerging cool-climate wine regions. In these regions, the growing season average temperatures are between 13 and 15 °C, with a relatively short growing season (less than 7 months). These regions might also endure spring frost and fall frost depending on their proximity to the coast or other large bodies of water that buffer temperatures to some degree. In addition, higher latitudes along the coast usually have higher growing-season rainfall, which increases the risk of grapevine diseases. In this study, the area’s growing grapevines located the furthest poleward in both hemispheres (Table A9) are revisited. For each location, a comparison between the KG climate classification system for the historical period and the future under both SSPs was performed. Results show that major changes are projected to occur in the NH regions where greater warming rates are occurring at higher latitudes, while regions in the SH are less likely to see changes in climate types due to limited landmass at poleward latitudes. In the SH, cool climate regions in Argentina (arid cold, BWk), New Zealand (temperate oceanic, Cfb), Tasmania (temperate oceanic, Cfb), and Chile (temperate oceanic, Cfb) show that no changes in the KG are projected for 2041–2060 under both SSPs. Two regions in the NH are also not projected to change from their current climate type: Denmark (temperate oceanic, Cfb) and Britain (temperate oceanic, Cfb). Regions in the NH that are projected to see significant changes are located on the North American continent. In Canada and the USA, wine regions in the Sussex, the Leelanau Peninsula, and Annapolis areas that were classified as warm-summer humid continental (Dwb) during 1970–2000 are projected to shift to humid subtropical (Cfa). Other Canadian regions defined as warm-summer humid continental (Dwb) are projected to shift to semi-arid cold (BSk, Kamloops) or hot-summer humid continental (Dwa, Ontario, and Quebec). In Europe, Gothenburg (Sweden), Zilona Góra (Poland), and Maastricht (Netherlands) are projected to change from temperate oceanic (Cfb) to humid subtropical (Cfa) shortly and under both SSPs. Overall, these results highlight a shift towards warmer and milder climate types in most of the NH’s coolest climate locations.

4. Discussion

Climate and vegetation are intricately linked at both regional and global scales. The KG climate classification scheme has been used as an effective tool to describe and examine both natural and human-managed plant systems [46,47,48]. Compared with single-variable approaches (i.e., just temperature or precipitation), using the KG climate classification can add new dimensions to the description of climate variation and change and their impacts and potential changes to vegetation [17]. Spatial changes in climate zones can signal contraction or expansion of the influence of climatic conditions, which in turn implies risks for plant and animal species. While large-scale biome shifts are possible, edge effects may produce the most dramatic changes as species may not be able to adapt quickly enough to the changes in climate [49].
In terms of agriculture, the world map of zones suitable for various crops very closely correlates with the KG climate classification system [46,47,48,50]. Although the factors that influence agricultural suitability are many and complex, correlation is especially apparent in the temperate latitudes where a favorable climate and intensive higher-yield agriculture exist. Growing grapes for wine production is one of the most geographically expressive crops, having a relatively large footprint in the midlatitudes [12], which makes viticulture a model system with which to use the KG climate classification system. As such, wine production has become synonymous with the Mediterranean climate types found mostly in southern European wine regions. Previous efforts to depict the climatic environments for growing winegrapes worldwide have used bioclimatic models and indices designed for grapevine aptitude to grow and produce quality grapes, e.g., [42,44,51,52,53]. By using KG, the most common reference climate classification system in use today, our analysis makes it possible to compare grape production climate characteristics to those of other crops and biomes. The results allow for both assessing the current and future potential to grow grapevines for wine production rather than other crops and estimating which type of ecosystem might replace viticulture if removed from a given area for conservation purposes.
Recent research has shown that climate change is already affecting viticulture and wine production through changes in grapevine phenological development [14], harvest dates [54], and grape acidity and sugar content [55,56]. However, establishing relationships between environmental changes and other components, like polyphenols or aroma compounds, is more complex [57,58]. This research has added to the baseline knowledge of the potential changes of climate on viticulture and wine production by examining global and regional-scale shifts in the KG climate types for wine regions. The two main climatic shifts identified in this study are: (1) regions shifting to a warmer and drier climate (temperate warm-summer Mediterranean (Csb) to temperate hot-summer Mediterranean (Csa); dry semi-arid cold (BSk) to dry semi-arid hot (BSh) and arid hot desert (BWh) climates); and (2) other regions shifting to a warmer and moister climate (temperate oceanic (Cfb) to humid subtropical (Cfa)).
These changes in climate conditions are believed to be causing a gradual shift in grapevine varieties being grown in temperate climate wine regions, with an increasing loss of suitability for white wine varieties towards suitability for red wine varieties [14,59,60]. In more semi-arid regions, where water for viticulture is already scarce, warmer and drier conditions may induce greater risk for the sustainability of vineyards since water consumption for viticulture is usually higher than total annual precipitation in these regions [61]. To address the increasing intensity of drought stress and to ensure more dependable and predictable yields, the use of water through irrigation in historically rainfed regions will likely be required as a necessary means to adapt to warmer and drier climates [28,62,63]. Additionally, shifts from more temperate to more subtropical or more continental climate types are likely to produce a wider annual temperature range and more extreme temperatures [64]. In regions such as southern Europe, Australia, and California, where arid, hot climate types are expected to become even drier and hotter in the summer, the chance of wildfire occurrences will likely increase as well [65].
At the cool limits of viticulture, warming and shifting to more suitable climate types identified in this research will likely increase the potential ripening of the main varieties being grown today and expand the range to other varieties. The most common varieties currently grown in these emerging cool climate regions are early or very early Vitis vinifera cv. Müller-Thurgau, Chardonnay, Pinot noir, Riesling, Pinot gris, Sauvignon blanc, Madeleine Angevine, and Siegerrebe, as well as cold and disease-resistant hybrids such as Rondo, Vidal, and Regent [45].
The potential shifts in KG climate types identified in this research will likely produce different challenges depending on the region, and as such, the strategies to ensure a sustainable product must be adapted accordingly. In general, cool-climate wine regions have already seen a change to intermediate climates, with many regions even expected to become warm- or hot-climate regions. However, while cool to intermediate to warm regions have experienced generally more consistent ripening due to warming, shifts to earlier bud break have left grapevines more prone to spring frosts, which still occur in many wine regions [66,67]. In addition, heat stress has already increased in many regions, and the results of this study indicate that it will most likely continue to increase in the future, bringing greater challenges to grape quality and yield in the warmest and driest wine regions [68,69]. Furthermore, Wang et al. [70] find that shifting climate zones due to climate change are impacting steep-slope agricultural areas much more than more broadacre global agricultural lands. The researchers found that the effect is more prevalent with the expansion of arid zones, which would have a major impact on many areas of southern Europe where steep slope viticulture is prevalent.
The potential future shifts in climate types in wine regions worldwide are likely to be non-uniform over both space and time. Sgubin et al. [66] find that for Europe, future warming is likely to produce a non-linear loss of suitable land in traditional wine regions from 4% at 1 °C to 17% at 2 °C of additional warming. The research finds that there is some offset of the loss in traditional regions by the gain of newly suitable regions due to warming. In addition, the research suggests that adopting grapevine varieties better suited to warmer and drier conditions will provide a viable long-term response to a changing climate, up to a point. Therefore, additional adaptation measures are needed to increase the resilience of the winemaking sector and can be divided into long-term [29] and short-term strategies [30]. Some examples of adaptive measures include appropriate canopy management and changes in training systems, soil management, more effective pest and disease control, the selection of scion-rootstock combinations, or vineyard relocation [28].

5. Conclusions

Global bioclimatic conditions have been documented via climate classifications that help depict the spatial characteristics of ecosystems and biomes. The Köppen–Geiger climate classification has been the most widely used vegetation-based empirical system. Using temperature and precipitation, the classification system subdivides terrestrial climates into five major types (tropical, arid, temperate, continental, and polar), which are further defined by the seasonal precipitation characteristics and the level of heat. Tied to the plant life of a given region, the system is useful in predicting future changes in ecosystems at the global and regional levels.
This research utilizes a global-scale climate data set to categorize most wine regions worldwide into recent and future KG climate types. This research has provided a comprehensive look at the range of climate types that winegrapes have been grown in worldwide. The results show in mid-latitudes that temperate C types represented most wine regions worldwide (66.3%), with Dry B types (23.1%) and Continental D types (7.2%) also prominent. Within the Temperate C types, temperate oceanic (Cfb) made up roughly 30% of the wine regions, while humid subtropical (Cfa) climate types were close to 13%. Contrary to popular belief, Mediterranean climate types were found in a lower percentage of wine regions, making up just under 20% of the worldwide wine regions (warm summer, Csb 9.5%, and hot summer, Csa 10.3%). Additionally, the Dry climate types (semi-arid cold, BSk) were also dominant, accounting for 16.6%, while Continental D climate types such as warm summer humid continental (Dwb) types made up 4.1% of the total worldwide. The results show that wine regions are more diverse than the commonly held view that Mediterranean climates are where most wine is produced.
Wine regions in the recent past have been largely located in temperate oceanic (Cfb, around 30%), Mediterranean (Csa,b,c, nearly 20%), cold dry semi-arid (BSk, around 17%), and humid subtropical (Cfa, around 13%) KG climate types. Observations from numerous studies have shown that many of these regions have already warmed, and some have become drier. These changes in KG climate types reflect accelerated warming in the Earth’s climate system, with polar climates shrinking and arid regions expanding. Research examining the potential changes in geographical distributions of climate zones in the future points to shifts into warmer and drier climates in this century. Tropical and arid climates will likely expand into the midlatitudes, while continental hot summer and humid climates are projected to expand, and high-latitude subarctic and polar climates will likely continue to shrink in area. Projected changes in broadscale climatic conditions such as these are likely to lead to the reorganization of ecosystems and the redistribution of species diversity.
Future climate projections used in this research show that significant shifts from warm summer climates to hot summer climates in the temperate zones where many wine regions are located are likely. These shifts are a further indication of the need for adaptive measures in the wine sector to address potential challenges to grape cultivation and wine production in the future. As such, this study adds to our knowledge of how climate change is likely to alter wine region climates around the world and provides additional scope to the framework by which adaptation and mitigation measures can be considered.

Author Contributions

Conceptualization, C.A. and J.A.S.; methodology, C.A.; software, C.A.; validation, C.A., A.F., J.A.S., G.V.J. and B.B.; formal analysis, C.A.; investigation, C.A.; data curation, C.A.; writing—original draft preparation, C.A., A.F. and G.V.J.; writing—review and editing, C.A., A.F., J.A.S., G.V.J. and B.B.; visualization, C.A.; project administration, J.A.S.; funding acquisition, J.A.S. All authors have read and agreed to the published version of the manuscript.

Funding

This research was funded by National Funds by FCT—Portuguese Foundation for Science and Technology, under the projects UIDB/04033/2020 and LA/P/0126/2020. Vine & Wine Portugal—Driving Sustainable Growth Through Smart Innovation, PRR—Plano de Recuperação e Resiliência e pelos Fundos Europeus Next Generation EU, no âmbito das Agendas Mobilizadoras para a Reindustrialização, Projeto n.º C644866286-011.

Data Availability Statement

The original contributions presented in the study are included in the article, further inquiries can be directed to the corresponding author.

Acknowledgments

The authors acknowledge the use of WorldClim version 2.1 climate datasets, which used CRU-TS 4.06 [71] downscaled with WorldClim 2 [34].

Conflicts of Interest

The authors declare no conflicts of interest.

Appendix A

Table A1. Köppen–Geiger (KG) climate classification system.
Climate TypeDescription
A TropicalAf Tropical rainforest
Am Tropical monsoon
Aw Tropical savanna with dry winter
As Tropical savanna with a dry summer
B DryBWh Arid hot (Desert)
BWk Arid cold (Desert)
BSh Semi-arid hot (Steppe)
BSk Semi-arid cold (Steppe)
C TemperateCfa Humid subtropical
Cfb Temperate oceanic
Cfc Subpolar oceanic
Cwa Monsoon-influenced humid subtropical
Cwb Subtropical highland climate or monsoon-influenced temperate oceanic
Cwc Cold subtropical highland climate or monsoon-influenced subpolar oceanic climate
Csa Hot-summer Mediterranean climate
Csb Warm-summer Mediterranean climate
Csc Cold-summer Mediterranean climate
D ContinentalDfa Hot-summer humid continental
Dfb Warm-summer humid continental climate
Dfc Subarctic climate
Dfd Extremely cold subarctic
Dwa Monsoon-influenced hot-summer humid continental
Dwb Monsoon-influenced warm-summer humid continental
Dwc Monsoon-influenced subarctic climate
Dwd Monsoon-influenced extremely cold subarctic
Dsa Mediterranean-influenced hot-summer humid continental
Dsb Mediterranean-influenced warm-summer humid continental climate
Dsc Mediterranean-influenced subarctic climate
Dsd Mediterranean-influenced extremely cold subarctic climate
E PolarET Tundra
EF Icecap
Table A2. Criteria to calculate the Köppen–Geiger classification for the main climates and subsequent precipitation conditions for the first two letters. Criteria to compute the third level temperature classification (h and k) for dry climates (B) and (a to d) for the warm temperate (C) and continental (D) climates following the Köppen’s climate classification. For the warm summer (b) type, a threshold temperature value of +10 °C must occur for at least four months (adapted from [36]).
ClimateDescriptionCriteria
A Tropical or Equatorial
Tmin 1 ≥ +18 °C
Af Tropical rainforest, fully humid
Am Tropical monsoon
As Equatorial savannah with a dry summer
Aw Equatorial savannah with dry winter
Pmin ≥ 60 mm
Pa ≥ 25(100 − Pmin)
Pmin < 60 mm in summer
Pmin < 60 mm in winter
B Dry or Arid
Pa < 10 Pth
BW Desert
BS Semi-arid or steppe
Pa > 5 Pth
Pa ≤ 5 Pth
C Temperate or Warm temperate
−3 °C < Tmin < +18 °C
Cs Warm temperate (or Mediterranean) with dry summer
Cw Warm temperate (or Mediterranean) with dry winter
Cf Warm temperate (or Mediterranean) fully humid
Psmin < Pwmin, Pwmax > 3 Psmin and Psmin < 40 mm
Pwmin < Psmin and Psmax > 10 Pwmin
neither Cs nor Cw
D Continental or Cold
Tmin ≤ −3 °C
Ds Continental with dry summer
Dw Continental with dry winter
Df Continental, fully humid
Psmin < Pwmin, Pwmax > 3 Psmin and Psmin < 40 mm
Pwmin < Psmin and Psmax > 10 Pwmin
neither Ds nor Dw
E Polar
Tmax < +10 °C
ET Tundra
EF Ice cap or frost
0 °C ≤ Tmax < +10 °C
Tmax < 0 °C
hhot steppe or desertTa ≥ +18 °C
kCold steppe or desertTa < +18 °C
aHot summerTmax ≥ +22 °C
bWarm summerNot a and at least 4 Tmin ≥ +10 °C
cCold summer and cold winterNot b and Tmin > −38 °C
dExtremely continentalLike c but Tmin ≤ −38 °C
1 Ta—Annual mean temperature (°C); Tmax—Monthly mean temperature of the warmest month (°C); Tmin—Monthly mean temperature of the coldest month (°C); Pa—Accumulated annual precipitation (mm); Pmin—Precipitation of the driest month (mm); Psmin, Psmax, Pwmin, Pwmax—Lowest and highest monthly precipitation values for the summer and winter half-years (April to September and October to March), respectively (°C). For the polar climates (E) no precipitation differentiations are given, only temperature conditions are defined, consequently, the polar climates (E) must be determined first, followed by the arid climates (B) and subsequent differentiations into the equatorial climates (A) and the warm temperate and snow climates (C) and (D), respectively.
Table A3. KG climate type percentage of wine regions worldwide in the historical period 1970–2000 and the future period 2041–2060 under SSP2 and SSP5.
Vineyards ETBShBSkBWhBWkAfAmAsAwCsaCsbCscCwaCwbCwcCfaCfbCfcDsaDsbDscDfaDfbDwaDwbDwc
70–000.681.916.61.33.4 2.60.1710.39.470.191.071.70.1012.930.080.470.050.950.440.930.20.44.050.14
41–60 SSP20.1218.05.26.92.22.90.122.10.1417.41.390.012.720.50.0234.25.950.01 0.12
41–60 SSP50.1118.15.36.92.22.60.122.20.1317.81.180.012.780.480.0134.25.76 0.12
Table A4. Differences in the land area percentages of each Köppen–Geiger (KG) climate type between future (2041–2060), under SSP2 (upper rows, ∆1) or SSP5 (lower rows, ∆2), and the historical period (1970–2000) (Table linked to Figure 3).
KG (%)ETEFBShBSkBWhBWkAfAmAsAwCsaCsbCscCwaCwbCwc
∆1−4.55−3.821.270.521.400.07−0.410.161.190.31−1.09−0.86−0.01−0.23−0.20−0.01
∆2−4.58−3.861.290.631.400.03−0.460.141.240.38−1.07−0.86−0.01−0.21−0.20−0.01
KG (%)CfaCfbCfcDsaDsbDscDsdDfaDfbDfcDfdDwaDwbDwcDwd
∆12.78−1.30−0.200.030.30−0.100.005.92−0.23−7.34−0.741.02−0.18−0.62−0.34
∆22.91−1.29−0.200.040.32−0.140.006.06−0.44−7.52−0.741.06−0.17−0.67−0.34
Table A5. KG climate type percentage of change within the study regions with vineyards (EU, NH non-EU countries, and SH) for 1970–2000 and 2041–2060 under SSP2 and SSP5 (Table linked to Figure 7).
Vineyards EU70–0041–60 SSP241–60 SSP5Vineyards NH70–0041–60 SSP241–60 SSP5Vineyards SH70–0041–60 SSP241–60 SSP5
ET0.02% ET0.03% ET1.37%0.25%0.23%
BSh 8.82%9.09%BSh1.17%10.43%10.09%BSh3.39%27.07%27.30%
BSk4.85%5.25%5.89%BSk17.22%12.07%11.73%BSk23.24%1.70%1.65%
BWh 0.12%0.10%BWh3.80%9.01%9.21%BWh0.79%9.82%9.77%
BWk BWk4.50%3.56%3.45%BWk4.83%2.76%2.74%
Af Af Af 6.08%5.57%
Am Am Am 0.24%0.25%
As As As5.40%4.46%4.50%
Aw Aw Aw0.36%0.30%0.27%
Csa21.11%24.87%25.22%Csa10.85%34.30%35.55%Csa3.64%4.63%4.58%
Csb7.77% Csb27.56%5.59%4.69%Csb1.53%0.10%0.10%
Csc Csc0.67%0.06%0.06%Csc0.07%
Cwa Cwa2.60%5.37%5.82%Cwa0.96%2.94%2.87%
Cwb Cwb Cwb3.50%1.05%0.99%
Cwc Cwc Cwc0.21%0.04%0.03%
Cfa14.93%60.28%59.33%Cfa2.43%18.45%18.45%Cfa16.92%26.90%27.62%
Cfb47.46%0.66%0.37%Cfb3.52%0.68%0.45%Cfb32.89%11.65%11.52%
Cfc Cfc0.17% Cfc0.90%0.01%0.01%
Dsa Dsa0.17% Dsa
Dsb Dsb4.00% Dsb
Dsc Dsc1.87% Dsc
Dfa Dfa3.94%0.48%0.50%Dfa
Dfb Dfb0.81% Dfb
Dwa Dwa1.73% Dwa
Dwb3.54% Dwb12.83% Dwb
Dwc0.32% Dwc0.13% Dwc
Table A6. KG climate type percentage of change per country within the study regions with vineyards EU (EU, NH non-EU countries, and SH) for 1970–2000 and 2041–2060 under SSP2 and SSP5 (Tables linked to Figure 8).
Vineyards EU
7000ETBShBSkBWhCsaCsbCfaCfbDwbDwc
AT 98.33%1.67%
BU 0.27% 41.67%55.65%2.41%
CR 12.12%0.61%14.55%71.52% 1.20%
CZ 100.00%
DE 100.00%
ES 33.77% 32.46%16.23%4.85%12.69%
FR 13.74%5.19%0.50%80.57%
GR 2.21% 68.01%16.54%5.15%8.09%
HR 0.00% 100.00%
IT0.14% 2.85% 47.08%10.04%28.36%10.99%0.14%0.40%
PT 50.26%49.74%
RO 27.59%53.58%17.64%1.19%
SK 92.93%7.07%
SL 2.50%95.00%2.50%
4160 SSP2ETBShBSkBWhCsaCsbCfaCfbDwbDwc
AT 98.33%1.67%
BU 0.82%0.82% 0.54% 96.73%1.09%
CR 13.29% 86.71%
CZ 2.56% 97.44%
DE 100.00%
ES 50.47%12.24%0.75%30.14% 6.40%
FR 0.17% 19.83% 80.00%
GR 11.43% 78.10% 10.47%
HR 100.00%
IT 9.89% 0.62%56.16% 31.96%1.37%
PT 100.00%
RO 19.41% 78.86%1.73%
SK 100.00%
SL 100.00%
4160 SSP5ETBShBSkBWhCsaCsbCfaCfbDwbDwc
AT 0.000% 100.00%
BU 1.36%2.17% 0.54% 94.84%1.09%
CR 15.38% 84.62%
CZ 100.00%
DE 100.00%
ES 51.43%12.84%0.19%29.68% 5.86%
FR 0.17% 20.51% 79.32%
GR 11.42% 78.10% 10.48%
HR 100.00%
IT 10.50%0.46% 57.84% 29.98%1.22%
PT 100.00%
RO 22.07% 77.53%0.40%
SK 100.00%
SL 100.00%
Table A7. KG climate type percentage of change per country within the study regions with vineyards NH non-EU countries for 1970–2000 and 2041–2060 under SSP2 and SSP5 (Tables linked to Figure 8).
Vineyards NH
7000ETBShBSkBWhBWkCsaCsbCscCwaCfaCfbCfcDsaDsbDscDsdDfaDfbDwbDwc
CH 96.15% 3.85%
GE 60.00%34.29% 5.71%
US0.03%1.37%16.81%4.45%2.19%12.69%32.25%0.79% 2.16%2.91%0.20%0.20%4.68%2.19%2.03%14.95%0.10%
CN 22.22% 20.48% 20.26% 30.72%6.32%
4160 SSP2ETBShBSkBWhBWkCsaCsbCscCwaCfaCfbCfcDsaDsbDscDsdDfaDfbDwbDwc
CH 76.92%23.08%
GE 97.14%2.86%
US 11.66%10.70%10.54%0.07%40.08%6.54%0.07% 19.78%0.56%
CN 3.56%22.89% 27.56% 42.21% 3.78%
4160 SSP5ETBShBSkBWhBWkCsaCsbCscCwaCfaCfbCfcDsaDsbDscDsdDfaDfbDwbDwc
CH 80.77%19.23%
GE 2.86% 94.28%2.86%
US 11.46%10.50%10.77%0.07%41.55%5.48%0.07% 19.78%0.32%
CN 2.00%21.55% 26.67% 45.78% 4.00%
Table A8. KG climate type percentage of change per country within the study regions with vineyards SH for 1970–2000 and 2041–2060 under SSP2 and SSP5 (Tables linked to Figure 8).
Vineyards SH
7000ETBShBSkBWhBWkAfAmAsAwCsaCsbCscCwaCwbCwcCfaCfbCfcDwc
AR2.43%8.18%67.39% 10.23% 5.50%4.60%0.64% 0.90%0.13%
AU 0.89%28.83% 0.18% 7.03%2.36% 1.98%1.34% 13.71%43.30%0.38%
BR 9.35% 27.41%1.83% 41.81%19.60%
CL11.89% 12.36% 30.83% 1.10%33.02%2.35% 8.45%
NZ0.59% 91.36%7.61%0.44%
ZA 5.68%48.30%16.19%19.03% 1.42%9.38%
UY 89.30%10.70%
4160 SSP2ETBShBSkBWhBWkAfAmAsAwCsaCsbCscCwaCwbCwcCfaCfbCfcDwc
AR0.51%51.41%11.76%25.96%7.42% 1.92%0.90% 0.12%
AU 32.61% 6.57% 0.53%2.56% 10.25% 2.07% 36.06%9.35%
BR 21.34% 29.93%0.07%16.69%1.48% 30.35%0.14%
CL2.21%11.04%4.26%18.30%21.61% 22.87%11.67%0.47%4.26%3.31%
NZ 21.22%78.78%
ZA 43.71%0.30%52.40% 3.59%
UY 2.50% 97.50%
4160 SSP5ETBShBSkBWhBWkAfAmAsAwCsaCsbCscCwaCwbCwcCfaCfbCfcDwc
AR0.51%51.66%11.64%26.21%7.16% 1.92%0.90%
AU 32.97%6.04% 0.56%2.73% 10.15% 2.07% 36.35%9.13%
BR 21.62% 27.68%0.07%16.55%1.34% 32.60%0.14%
CL1.89%11.04%3.94%19.87%21.77% 22.08%11.05%0.32%4.57%3.47%
NZ 21.83%78.17%
ZA 43.42%0.30%52.69% 3.59%
UY 0.50% 99.50%
Table A9. KG climate types for cool climate wine regions. Geographical coordinates, location, and climate type are listed, ranked by decreasing latitude in each hemisphere (EU, NH non-EU countries, and SH) for 1970–2000 and 2041–2060 under SSP2 and SSP5.
LatitudeLongitudeLocation70–0041–60 SSP241–60 SSP5
57.7° N12.0° EGothenburg, SwedenCfbCfaCfa
51.6° N15.5° EZilona Góra, PolandCfbCfaCfa
57.1° N9.9° EAalborg, DenmarkCfbCfbCfb
54.0° N1.1° WYork, BritainCfbCfbCfb
50.9° N5.7° EMaastricht, NetherlandsCfbCfaCfa
50.7° N120.4° WKamloops, British Colombia, CanadaDwbBSkBSk
46.4° N79.9° WLake Te, Timagami, Ontario, CanadaDwbDwaDwa
46.4° N71.4° WQuebec City, Quebec, CanadaDwbDwaDwa
45.4° N65.5° WSussex, New Brunswick, CanadaDwbCfaCfa
45.2° N85.5° WLeelanau Peninsula, Michigan, USADwbCfaCfa
45.2° N65.2° WAnnapolis Valley, Nova Scotia, CanadaDwbCfaCfa
45.6° S69.1° WSarmiento, ArgentinaBwkBwkBwk
45.3° S169.4° EAlexandra, New ZealandCfbCfbCfb
43.3° S147.3° EBruny Island, Tasmania, AustraliaCfbCfbCfb
42.7° S73.8° WChiloe Island, ChileCfbCfbCfb

References

  1. Belda, B.; Holtanová, E.; Halenka, T.; Kalvová, J. Climate classification revisited: From Köppen to Trewartha. Clim. Res. 2014, 59, 1–13. [Google Scholar] [CrossRef]
  2. Köppen, W. Die Wärmezonen der Erde, nach der Dauer der heissen, gemässigten und kalten Zeit und nach der Wirkung der Wärme auf die organische Welt betrachtet. Meteorol. Z. 2011, 20, 351–360. [Google Scholar] [CrossRef] [PubMed]
  3. Bryson, R.A. Air Masses, Streamlines, and the Boreal Forest. Geogr. Bull. 1966, 8, 228–269. [Google Scholar]
  4. Thornwaite, C.W. An Approach toward a Rational Classification of Climate. Geogr. Rev. 1948, 38, 55–94. [Google Scholar] [CrossRef]
  5. Holdridge, L.R. Determination of world plant formations from simple climatic data. Science 1947, 105, 367–368. [Google Scholar] [CrossRef] [PubMed]
  6. Köppen, W. Klassifikation der Klimate nach Temperatur, Niederschlag und Jahreslauf. Petermanns Geogr. Mitteilungen 1918, 64, 193–203, 243–248. [Google Scholar]
  7. Köppen, W. Das geographische System der Klimate. In Handbuch der Klimatologie; Borntraeger: Berlin, Germany, 1936; Volume 1. [Google Scholar]
  8. Geiger, R.F. Klassifikation der Klimate nach W. Köppen; Landolt-Börnstein—Zahlenwerte und Funktionen aus Physik, Chemie, Astronomie, Geophysik und Technik, alte Serie; Springer: Berlin/Heidelberg, Germany, 1954; Volume 3, pp. 603–607. [Google Scholar]
  9. Trewartha, G.T. An Introduction to Climate; McGraw-Hill: New York, NY, USA, 1968. [Google Scholar]
  10. Trewartha, G.T.; Horn, L.H. Introduction to Climate, 5th ed.; McGraw Hill: New York, NY, USA, 1980. [Google Scholar]
  11. Köppen, W. Grundiss der Klimakunde, 2nd ed.; Walter de Gruyter & Co.: Berlin, Germany, 1931. [Google Scholar]
  12. de Blij, H.J. Geography of viticulture: Rationale and resource. J. Geogr. 1983, 82, 112–121. [Google Scholar] [CrossRef]
  13. Anderson, K.; Nelgen, S. Which Winegrape Varieties Are Grown Where?, Revised ed.; University of Adelaide Press: Adelaide, Australia, 2020; p. 962. ISBN 978-1925261868. [Google Scholar]
  14. Jones, G.V.; Reid, R.; Vilks, A. Climate, Grapes, and Wine: Structure and Suitability in a Variable and Changing Climate. In The Geography of Wine: Regions, Terroir, and Techniques; Dougherty, P., Ed.; Springer Press: Dordrecht, The Netherlands, 2012; pp. 109–133. [Google Scholar]
  15. Peel, M.C.; Finlayson, B.L.; McMahon, T.A. Updated world map of the Köppen–Geiger climate classification. Hydrol. Earth Syst. Sci. 2007, 11, 1633–1644. [Google Scholar] [CrossRef]
  16. Chan, D.; Wu, Q. Significant anthropogenic-induced changes of climate classes since 1950. Sci. Rep. Nat. Res. 2015, 5, 13487. [Google Scholar] [CrossRef]
  17. Chen, D.; Chen, H.W. Using the Köppen classification to quantify climate variation and change: An example for 1901–2010. Environ. Dev. 2013, 6, 69–79. [Google Scholar] [CrossRef]
  18. Mahlstein, I.; Daniel, J.S.; Solomon, S. Pace of shifts in climate regions increases with global temperature. Nat. Clim. Chang. 2013, 3, 739–743. [Google Scholar] [CrossRef]
  19. Rubel, F.; Kottek, M. Observed and projected climate shifts 1901–2100 depicted by world maps of the Köppen-Geiger climate classification. Meteorol. Z. 2010, 19, 135–141. [Google Scholar] [CrossRef]
  20. Wang, M.; Overland, J.E. Detecting Arctic climate change using Köppen climate classification. Clim. Chang. 2004, 67, 43–62. [Google Scholar] [CrossRef]
  21. Feng, S.; Ho, C.H.; Hu, Q.; Oglesby, R.J.; Jeong, S.J.; Kim, B.M. Evaluating observed and projected future climate changes for the Artic using the Köppen-Trewartha climate classification. Clim. Dyn. 2012, 38, 1359–1373. Available online: https://www.jstor.org/stable/e24897565 (accessed on 21 January 2023). [CrossRef]
  22. Diaz, H.F.; Eischeid, J.K. Disappearing “alpine tundra” Köppen climatic type in the western United States. Geophys. Res. Lett. 2007, 34, L18707. [Google Scholar] [CrossRef]
  23. de Castro, M.; Gallardo, C.; Jylha, K.; Tuomenvirta, H. The use of a climate-type classification for assessing climate change effects in Europe from an ensemble of nine regional climate models. Clim. Chang. 2007, 81, 329–341. [Google Scholar] [CrossRef]
  24. Jones, G.V.; White, M.A.; Cooper, O.R.; Storchmann, K. Climate Change and Global Wine Quality. Clim. Chang. 2005, 73, 319–343. [Google Scholar] [CrossRef]
  25. Gambetta, G.A.; Kurtural, S.K. Global warming and wine quality: Are we close to the tipping point? OENO One 2021, 55, 353–361. [Google Scholar] [CrossRef]
  26. Hannah, L.; Roehrdanz, P.R.; Ikegami, M.; Hijmans, R.J. Climate change, wine, and conservation. Biol. Sci. 2013, 110, 6907–6912. [Google Scholar] [CrossRef] [PubMed]
  27. Sgubin, G.; Swingedouw, D.; Mignot, J.; Gambetta, G.A.; Bois, B.; Loukos, H.; Noël, T.; Pieri, P.; García de Cortázar-Atauri, I.; Ollat, N.; et al. Non-linear loss of suitable wine regions over Europe in response to increasing global warming. Glob. Chang. Biol. 2023, 29, 808–826. [Google Scholar] [CrossRef]
  28. Santos, J.A.; Fraga, H.; Malheiro, A.C.; Moutinho-Pereira, J.; Dinis, L.T.; Correia, C.; Moriondo, M.; Leolini, L.; Dibari, C.; Costafreda-Aumedes, S.; et al. A review of the potential climate change impacts and adaptation options for European viticulture. Appl. Sci. 2020, 10, 3092. [Google Scholar] [CrossRef]
  29. Santos, J.A.; Yang, C.; Fraga, H.; Malheiro, A.C.; Moutinho-Pereira, J.M.; Dinis, L.; Correia, C.M.; Moriondo, M.; Bindi, M.; Leolini, L.; et al. Long-term adaptation of European viticulture to climate change: An overview from the H2020 Clim4Vitis action. IVES Tech. Rev. Vine Wine 2021. [Google Scholar] [CrossRef]
  30. Santos, J.A.; Yang, C.; Fraga, H.; Malheiro, A.C.; Moutinho-Pereira, J.M.; Dinis, L.; Correia, C.M.; Moriondo, M.; Bindi, M.; Leolini, L.; et al. Short-term adaptation of European viticulture to climate change: An overview from the H2020 Clim4Vitis action. IVES Tech. Rev. Vine Wine 2021. [Google Scholar] [CrossRef]
  31. Moriondo, M.; Jones, G.V.; Bois, B.; Dibari, C.; Ferrise, R.; Trombi, G.; Bindi, M. Projected shifts of wine regions in response to climate change. Clim. Chang. 2013, 119, 825–839. [Google Scholar] [CrossRef]
  32. World Wine Production Outlook. Wine Production—OIV First Estimates; International Organization of Vine and Wine: Dijon, France, 2022; Available online: https://www.google.com/url?sa=t&source=web&rct=j&opi=89978449&url=https://www.oiv.int/sites/default/files/documents/OIV_World_Wine_Production_Outlook_2023.pdf&ved=2ahUKEwiNh4ac5fuGAxU-AtsEHe4GD20QFnoECBQQAQ&usg=AOvVaw0BxkIobYX0LNebJLer5E2T (accessed on 21 January 2023).
  33. Swart, N.M.; Cole, J.N.S.; Kharin, V.V.; Lazare, M.; Scinocca, J.F.; Gillett, N.P.; Anstey, J.; Arora, V.; Christian, J.R.; Jiao, Y.; et al. CCCma CanESM5 Model Output Prepared for CMIP6 ScenarioMIP; Earth System Grid Federation, 2019; Available online: https://esgf.llnl.gov/ (accessed on 21 January 2023). [CrossRef]
  34. Fick, S.E.; Hijmans, R.J. WorldClim 2: New 1km spatial resolution climate surfaces for global land areas. Int. J. Climatol. 2017, 37, 4302–4315. [Google Scholar] [CrossRef]
  35. Intergovernmental Panel on Climate Change. Sixth Assessment Report (IPCC, AR6), AR6 Synthesis Report: Climate Change. 2023. Available online: https://www.ipcc.ch/assessment-report/ar6/ (accessed on 21 January 2023).
  36. Köppen, W.; Geiger, R. Handbuch der Klimatologie; Gebrüder Bornträger: Berlin, Germany, 1930. [Google Scholar]
  37. Andrade, C.; Contente, J. Köppen’s climate classification projections for the Iberian Peninsula. Clim. Res. 2020, 81, 71–80. [Google Scholar] [CrossRef]
  38. Kottek, M.J.; Grieser, C.; Beck, B.; Rudolf, R.F. World map of the Köppen–Geiger climate classification updated. Meteorol. Z. 2006, 15, 259–263. [Google Scholar] [CrossRef]
  39. Beck, H.; Zimmermann, N.; McVicar, T.; Vergopolan, N.; Berg, A.; Wood, E. Present and future Köppen-Geiger climate classification maps at 1-km resolution. Sci. Data 2018, 5, 180214. [Google Scholar] [CrossRef]
  40. Bois, B.; Blais, A.; Moriondo, M.; Jones, G.V. High resolution climate spatial analysis of European winegrowing regions. In Proceedings of the 9th International Terroir Congress, Reims, France, 25–29 June 2012; Volume 1, pp. 217–220. [Google Scholar]
  41. European Environment Agency. CLC2006 Technical Guidelines; EEA Technical Report 17/2007; Office for Official Publications of the European Communities: Luxembourg, 2007. [Google Scholar]
  42. Bois, B.; Gavrilescu, C.; Moriondo, M.; Jones, G.V. Wine growing region global climate analysis. In Proceedings of the 11th International Terroir Congress 2016, McMinnville, OR, USA, 10–14 July 2016; pp. 9–14. [Google Scholar]
  43. Gavrilescu, C.; Bois, B. Chardonnay wines climate plasticity: A worldwide geographical approach. BIO Web Conf. 2016, 7, 01013. [Google Scholar] [CrossRef]
  44. Bois, B.; Zito, S.; Calonnec, A. Climate vs. grapevine pests and diseases worldwide: The first results of a global survey. OENO One 2017, 51, 133–139. [Google Scholar] [CrossRef]
  45. Jones, G.V.; Schultz, H.R. Climate change and emerging cool climate wine regions. Wine Vitic. J. 2016, 31, 51–53. [Google Scholar]
  46. Cramer, W.P.; Leemans, R. Assessing impacts of climate change on vegetation using climate classification systems. In Vegetation Dynamics and Global Change; Solomon, A.M., Shugart, H.H., Eds.; Springer: Boston, MA, USA, 1993; pp. 190–217. [Google Scholar]
  47. Rohli, R.V.; Joyner, T.A.; Reynolds, S.J.; Ballinger, T.J. Overlap of global Köppen–Geiger climates, biomes, and soil orders. Phys. Geogr. 2015, 36, 158–175. [Google Scholar] [CrossRef]
  48. Sohoulande, C.D. Vegetation and water resource variability within the Köppen-Geiger global climate classification scheme: A probabilistic interpretation. Theor. Appl. Climatol. 2024, 155, 1081–1092. [Google Scholar] [CrossRef]
  49. Chen, I.C.; Hill, J.K.; Ohlemüller, R.; Roy, D.B.; Thomas, C.D. Rapid range shifts of species associated with high levels of climate warming. Science 2011, 333, 1024–1026. [Google Scholar] [CrossRef] [PubMed]
  50. Müller, M.S.; Dourado-Neto, D.; Timm, L.C.; Reichardt, K.; Sartori, F.F.; Felisberto, G. Climate analysis for agricultural improvement of the Economic Community of West African States according to Köppen and Thornthwaite. Afr. J. Agric. Res. 2018, 13, 1198–1212. [Google Scholar] [CrossRef]
  51. Wolkovich, E.M.; García de Cortázar-Atauri, I.; Morales-Castilla, I.; Nicholas, K.A.; Lacombe, T. From Pinot to Xinomavro in the world’s future wine-growing regions. Nat. Clim. Chang. 2018, 8, 29–37. [Google Scholar] [CrossRef]
  52. Morales-Castilla, I.; García de Cortázar-Atauri, I.; Cook, B.I.; Lacombe, T.; Parker, A.; van Leeuwen, C.; Nicholas, K.A.; Wolkovich, E.M. Diversity buffers winegrowing regions from climate change losses. Proc. Natl. Acad. Sci. USA 2020, 117, 2864–2869. [Google Scholar] [CrossRef]
  53. Puga, G.; Anderson, K.; Jones, G.; Tchatoka, F.D.; Umberger, W. A climatic classification of the world’s wine regions. OENO One 2022, 56, 165–177. [Google Scholar] [CrossRef]
  54. Labbé, T.; Pfister, C.; Brönnimann, S.; Rousseau, D.; Franke, J.; Bois, B. The longest homogeneous series of grape harvest dates, Beaune 1354–2018, and its significance for the understanding of past and present climate. Clim. Past 2019, 15, 1485–1501. [Google Scholar] [CrossRef]
  55. Koufos, G.C.; Mavromatis, T.; Koundouras, S.; Jones, G.V. Adaptive capacity of winegrape varieties cultivated in Greece to climate change: Current trends and future projections. OENO One 2020, 54, 1201–1219. [Google Scholar] [CrossRef]
  56. Bécart, V.; Lacroix, R.; Puech, C.; García de Cortázar-Atauri, I. Assessment of changes in Grenache grapevine maturity in a Mediterranean context over the last half-century. OENO One 2022, 56, 53–72. [Google Scholar] [CrossRef]
  57. Schultz, H.R. Global climate change, sustainability, and some challenges for grape and wine production. J. Wine Econ. 2016, 11, 181–200. [Google Scholar] [CrossRef]
  58. Dinis, L.T.; Bernardo, S.; Yang, C.; Fraga, H.; Malheiro, A.C.; Moutinho-Pereira, J.; Santos, J.A. Mediterranean viticulture in the context of climate change. Ciência Téc. Vitiv. 2022, 37, 139–158. [Google Scholar] [CrossRef]
  59. Kenny, G.J.; Harrison, P.A. The effects of climate variability and change on grape suitability in Europe. J. Wine Res. 1992, 3, 163–183. [Google Scholar] [CrossRef]
  60. Stock, M.; Gerstengarbe, F.W.; Kartschall, T.; Werner, P.C. Reliability of climate change impact assessments for viticulture. In Proceedings of the VII International Symposium on Grapevine Physiology and Biotechnology, Davis, CA, USA, 21–25 July 2004; Volume 689, pp. 29–40. [Google Scholar] [CrossRef]
  61. Medrano, H.; Tomás, M.; Martorell, S.; Escalona, J.M.; Pou, A.; Fuentes, S.; Flexas, J.; Bota, J. Improving water use efficiency of vineyards in semi-arid regions. A review. Agron. Sustain. Dev. 2015, 35, 499–517. [Google Scholar] [CrossRef]
  62. Chaves, M.M.; Zarrouk, O.; Francisco, R.; Costa, J.M.; Santaos, T.; Regalado, A.P.; Rodriges, M.L.; Lopes, C.M. Grapevine under deficit irrigation: Hints from physiological and molecular data. Ann. Bot. 2010, 105, 661–676. [Google Scholar] [CrossRef]
  63. Flexas, J.; Galmés, J.; Gallé, A.; Gulías, J.; Pou, A.; Ribas-Carbo, M.; Tomás, M.; Medrano, H. Improving water use efficiency in grapevines: Potential physiological targets for biotechnological improvement. Aust. J. Grape Wine Res. 2010, 16, 106–121. [Google Scholar] [CrossRef]
  64. Skalák, P.; Farda, A.; Zahradníček, P.; Trnka, M.; Hlásny, T.; Štěpánek, P. Projected shift of Köppen–Geiger zones in the central Europe: A first insight into the implications for ecosystems and the society. Int. J. Climatol. 2018, 38, 3595–3606. [Google Scholar] [CrossRef]
  65. Williams, A.P.; Abatzoglou, J.T.; Gershunov, A.; Guzman-Morales, J.; Bishop, D.A.; Balch, J.K.; Lettenmaier, D.P. Observed impacts of anthropogenic climate change on wildfire in California. Earth’s Futur. 2019, 7, 892–910. [Google Scholar] [CrossRef]
  66. Sgubin, G.; Swingedouw, D.; Dayon, G.; García de Cortázar-Atauri, I.; Ollat, N.; Pagé, C.; van Leeuwen, C. The risk of tardive frost damage in French vineyards in a changing climate. Agric. For. Meteorol. 2018, 250–251, 226–242. [Google Scholar] [CrossRef]
  67. Lamichhane, J.R. Rising risks of late-spring frosts in a changing climate. Nat. Clim. Chang. 2021, 11, 554–555. [Google Scholar] [CrossRef]
  68. Mira de Orduña, R. Climate change associated effects on grape and wine quality and production. Food Res. Int. 2010, 43, 1844–1855. [Google Scholar] [CrossRef]
  69. White, M.A.; Diffenbaugh, N.S.; Jones, G.V.; Pal, J.S.; Giorgi, F. Extreme heat reduces and shifts United States premium wine production in the 21st century. Proc. Natl. Acad. Sci. USA 2006, 103, 11217–11222. [Google Scholar] [CrossRef] [PubMed]
  70. Wang, W.; Pijl, A.; Tarolli, P. Future climate-zone shifts are threatening steep-slope agriculture. Nat. Food 2022, 3, 193–196. [Google Scholar] [CrossRef]
  71. Harris, I.; Osborn, T.J.; Jones, P.; Lister, D. Version 4 of the CRU TS monthly high-resolution gridded multivariate climate dataset. Sci. Data 2020, 7, 109. [Google Scholar] [CrossRef] [PubMed]
Figure 1. Study areas of the major wine producers divided by regions (a) European Union (EU) (b) outside the EU in the Northern Hemisphere (NH), and (c) Southern Hemisphere (SH) countries (list in Table 1).
Climate 12 00094 g001
Figure 2. Worldwide Köppen–Geiger (KG) classification system between (a) 1970 and 2000, (b) from 2041 to 2060 under SSP2, and (c) from 2041 to 2060 under SSP5.
Climate 12 00094 g002
Figure 3. Percentage of the difference (in pixels) between the future 2041 to 2060 (a) under SSP2, and (b) under SSP5, and the historical (1970–2000) periods for each Köppen–Geiger (KG) climate type (values in Table A4).
Climate 12 00094 g003
Figure 4. Worldwide Köppen–Geiger (KG) classification system of the major wine producers’ countries for the (a) European Union (EU) countries; (b) Northern Hemisphere (NH) non-EU countries; and (c) Southern Hemisphere (SH) between 1970 and 2000.
Climate 12 00094 g004
Figure 5. Worldwide Köppen–Geiger (KG) classification system of the major wine producers’ countries for the (a) European Union (EU) countries; (b) Northern Hemisphere (NH) non-EU countries; and (c) Southern Hemisphere (SH) from 2041 to 2060 under SSP2.
Climate 12 00094 g005
Figure 6. Worldwide Köppen–Geiger (KG) classification system for the major wine producers’ countries for the (a) European Union (EU) countries; (b) Northern Hemisphere (NH) non-EU countries; and (c) Southern Hemisphere (SH) from 2041 to 2060 under SSP5.
Climate 12 00094 g006
Figure 7. Köppen–Geiger climate type percentage of change within the study regions with vineyards (a) EU; (b) other NH countries; and (c) SH countries, for 1970–2000 and 2041–2060 under SSP2 and SSP5 for each climate type (values in Table A5).
Climate 12 00094 g007
Figure 8. Köppen–Geiger (KG) climate type percentage of change per country within the study regions with vineyards (ac) EU, (df) other countries in the NH, and (gi) SH countries for 1970–2000 (left column) and 2041–2060 under SSP2 (middle column) and SSP5 (right column) for each climate type (values in Table A6, Table A7 and Table A8).
Climate 12 00094 g008
Table 1. List of the major wine producers by geographical sector (based on [32]).
Geographical SectorCountries (Acronym)
European Union (EU)Italy (IT), France (FR), Spain (ES), Germany (DE), Portugal (PT), Romania (RO), Hungary (HU), Austria (AT), Greece (GR), Bulgaria (BG), Slovenia (SL), Czechia (CZ), Slovakia (SK), and Luxembourg (LU)
Outside the EU Northern Hemisphere (NH)USA (US), China (CN), Georgia (GE), and Switzerland (CH)
Southern Hemisphere (SH)Chile (CL), Australia (AU), Argentina (AR), South Africa (ZA), Brazil (BR), New Zealand (NZ), and Uruguay (UY)
Disclaimer/Publisher’s Note: The statements, opinions and data contained in all publications are solely those of the individual author(s) and contributor(s) and not of MDPI and/or the editor(s). MDPI and/or the editor(s) disclaim responsibility for any injury to people or property resulting from any ideas, methods, instructions or products referred to in the content.