

Precipitation Extremes and Trends over the Uruguay River Basin in Southern South America

 , , ,
, , ,  , and
, and
Abstract
1. Introduction
2. Materials and Methods
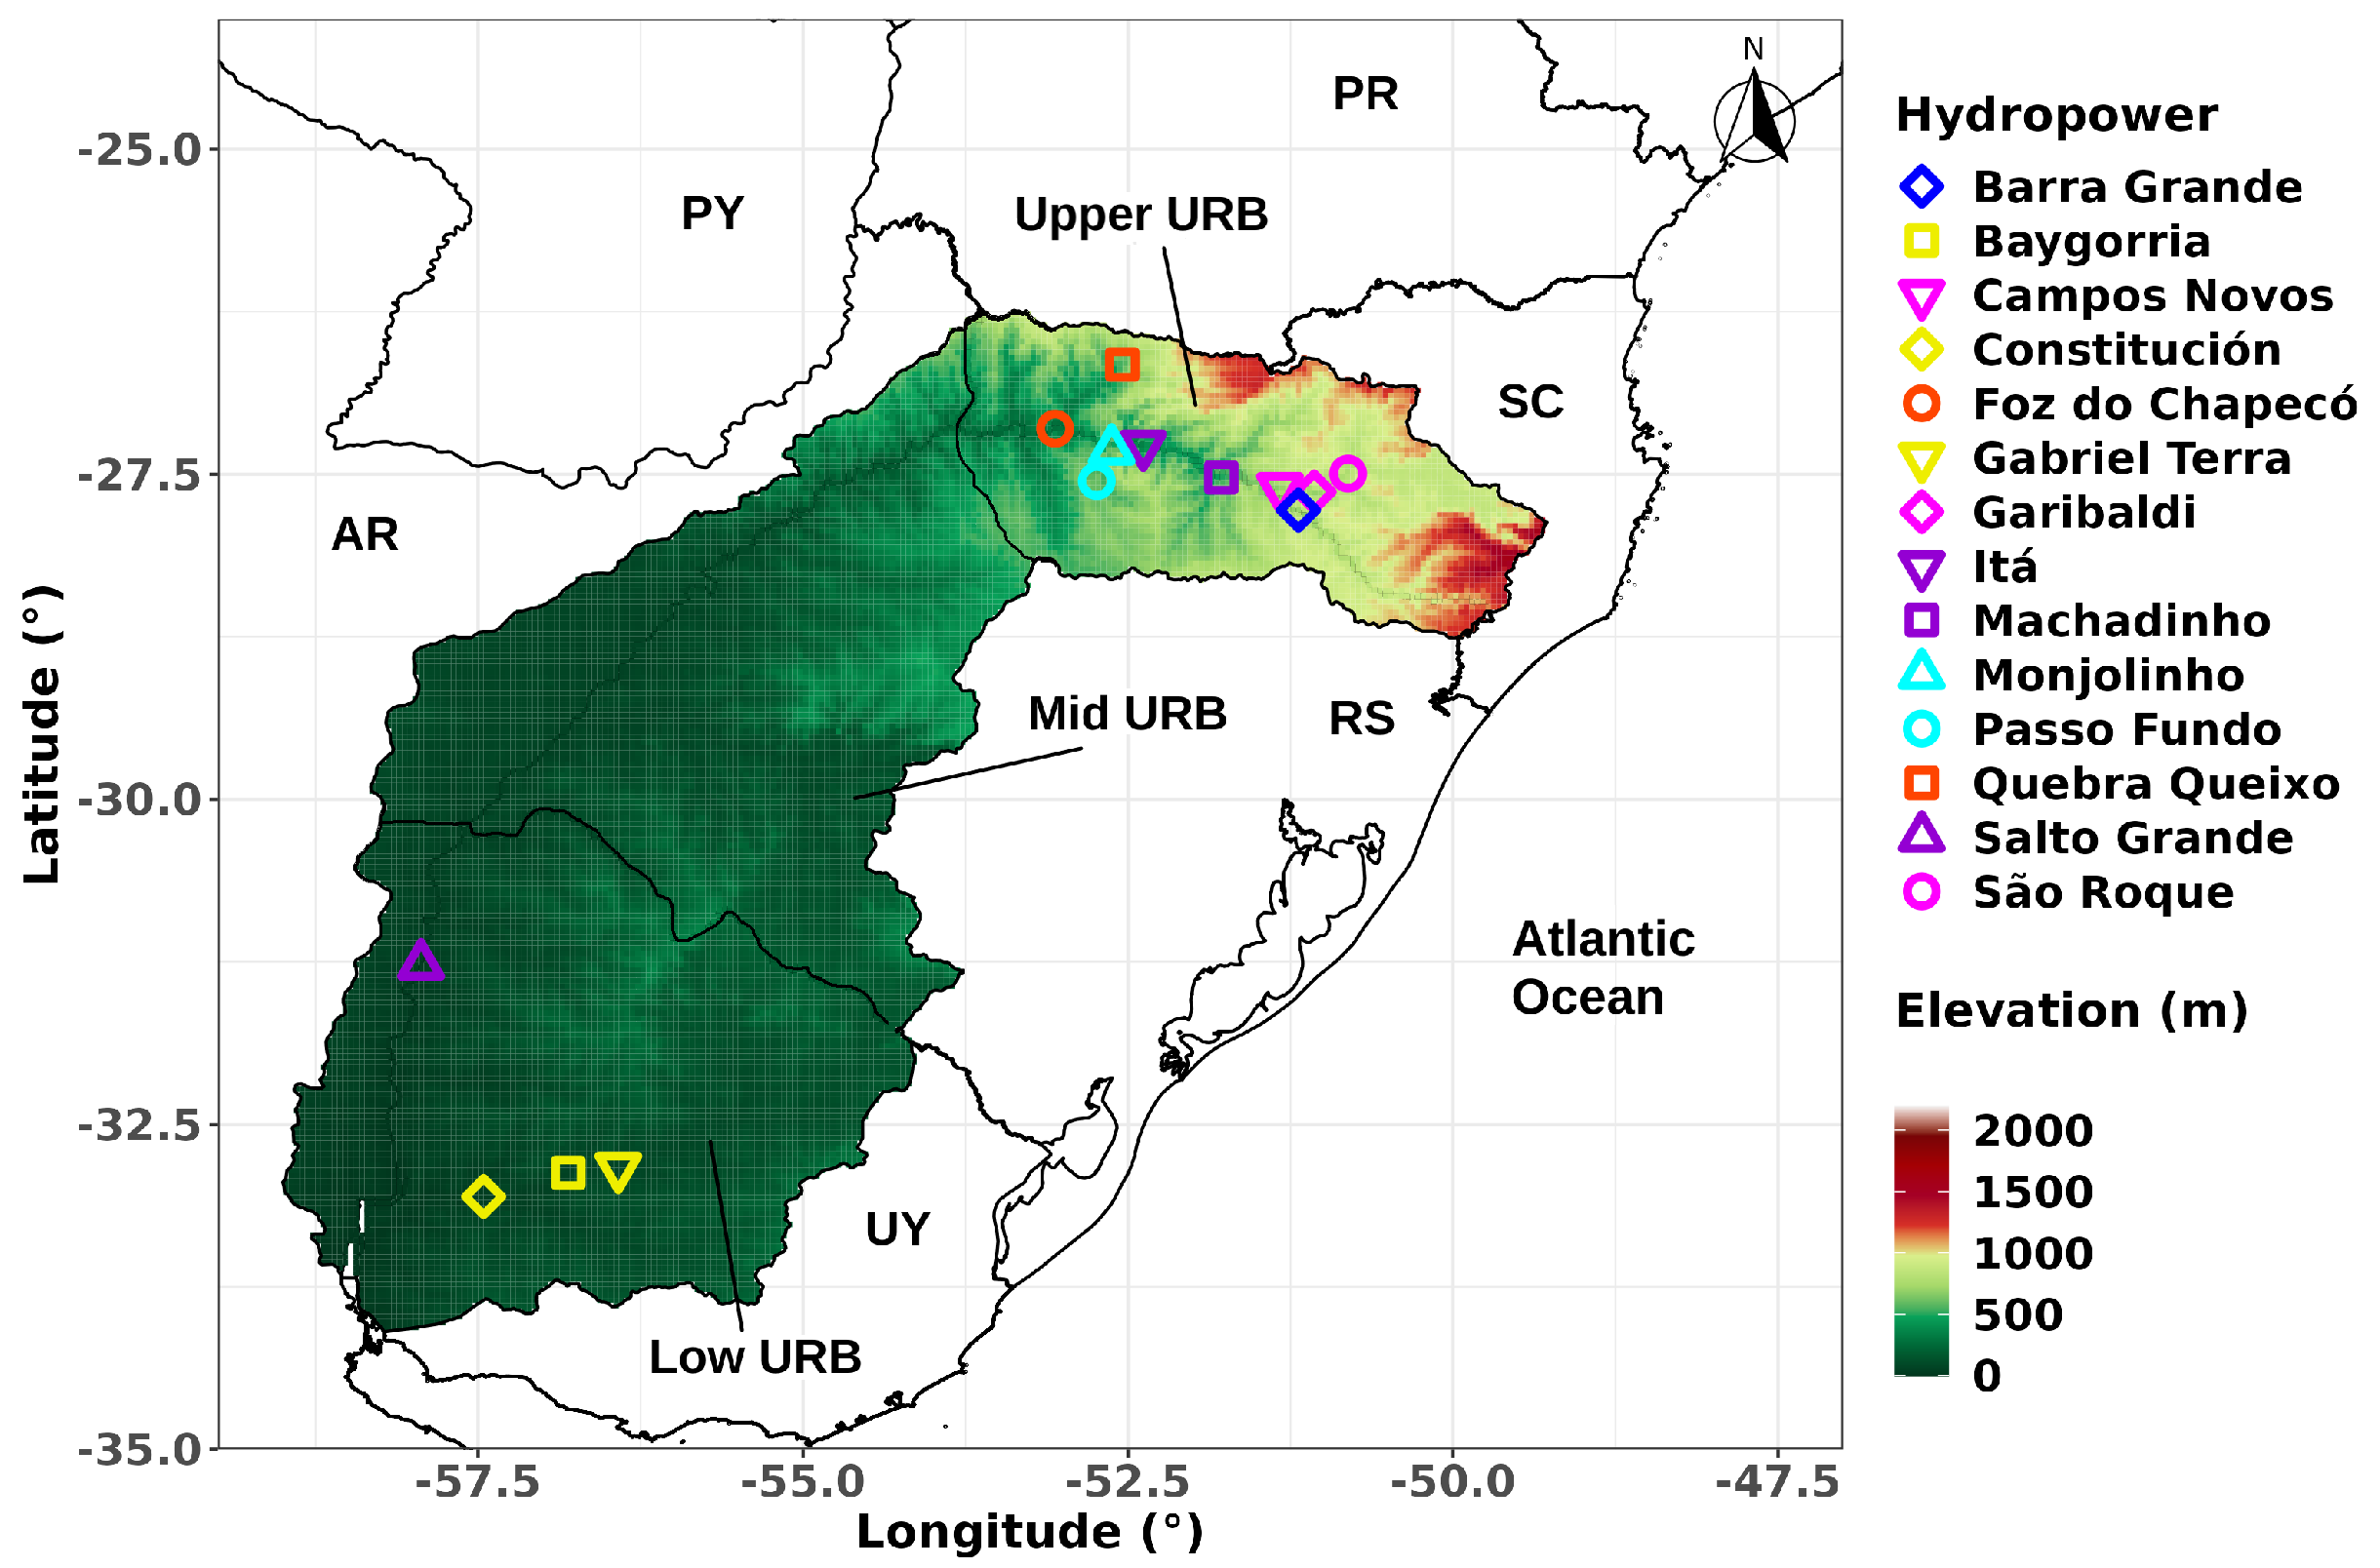
2.1. Study Area
2.2. Data Source, Precipitation Indices and Trends
3. Results and Discussion
4. Conclusions
Author Contributions
Funding
Data Availability Statement
Acknowledgments
Conflicts of Interest
References
- Teixeira, M.S.; Satyamurty, P. Dynamical and synoptic characteristics of heavy rainfall episodes in southern Brazil. Mon. Weather. Rev. 2007, 135, 598–617. [Google Scholar] [CrossRef]
- Liebmann, B.; Vera, C.S.; Carvalho, L.M.; Camilloni, I.A.; Hoerling, M.P.; Allured, D.; Barros, V.R.; Báez, J.; Bidegain, M. An observed trend in central South American precipitation. J. Clim. 2004, 17, 4357–4367. [Google Scholar] [CrossRef]
- Haylock, M.R.; Peterson, T.C.; Alves, L.M.; Ambrizzi, T.; Anunciação, Y.; Báez, J.; Barros, V.R.; Berlato, M.; Bidegain, M.; Coronel, G.; et al. Trends in total and extreme South American rainfall in 1960–2000 and links with sea surface temperature. J. Clim. 2006, 19, 1490–1512. [Google Scholar] [CrossRef]
- Barros, V.R.; Doyle, M.E.; Camilloni, I.A. Precipitation trends in southeastern South America: Relationship with ENSO phases and with low-level circulation. Theor. Appl. Climatol. 2008, 93, 19–33. [Google Scholar] [CrossRef]
- Teixeira, M.d.S.; Satyamurty, P. Trends in the frequency of intense precipitation events in southern and southeastern Brazil during 1960–2004. J. Clim. 2011, 24, 1913–1921. [Google Scholar] [CrossRef]
- Regoto, P.; Dereczynski, C.; Chou, S.C.; Bazzanela, A.C. Observed changes in air temperature and precipitation extremes over Brazil. Int. J. Climatol. 2021, 41, 5125–5142. [Google Scholar] [CrossRef]
- Saurral, R.I.; Barros, V.R.; Lettenmaier, D.P. Land use impact on the Uruguay River discharge. Geophys. Res. Lett. 2008, 35. [Google Scholar] [CrossRef]
- Pasquini, A.I.; Depetris, P.J. Discharge trends and flow dynamics of South American rivers draining the southern Atlantic seaboard: An overview. J. Hydrol. 2007, 333, 385–399. [Google Scholar] [CrossRef]
- Doyle, M.E.; Saurral, R.I.; Barros, V.R. Trends in the distributions of aggregated monthly precipitation over the La Plata Basin. Int. J. Climatol. 2012, 32, 2149–2162. [Google Scholar] [CrossRef]
- Penalba, O.C.; Robledo, F.A. Spatial and temporal variability of the frequency of extreme daily rainfall regime in the La Plata Basin during the 20th century. Clim. Chang. 2010, 98, 531–550. [Google Scholar] [CrossRef]
- Ceron, W.L.; Kayano, M.T.; Andreoli, R.V.; Avila-Diaz, A.; Ayes, I.; Freitas, E.D.; Martins, J.A.; Souza, R.A. Recent intensification of extreme precipitation events in the La Plata Basin in Southern South America (1981–2018). Atmos. Res. 2021, 249, 105299. [Google Scholar] [CrossRef]
- Ávila, A.; Justino, F.; Wilson, A.; Bromwich, D.; Amorim, M. Recent precipitation trends, flash floods and landslides in southern Brazil. Environ. Res. Lett. 2016, 11, 114029. [Google Scholar] [CrossRef]
- Fernandes, L.G.; Rodrigues, R.R. Changes in the patterns of extreme rainfall events in southern Brazil. Int. J. Climatol. 2017, 38, 1337–1352. [Google Scholar] [CrossRef]
- Armoa, O.L.; Sauvage Barresi, S.; Houska, T.; Bieger, K.; Schürz, C.; Sánchez Pérez, J.M. Representation of Hydrological Components under a Changing Climate—A Case Study of the Uruguay River Basin Using the New Version of the Soil and Water Assessment Tool Model (SWAT+). Water 2023, 15, 2604. [Google Scholar] [CrossRef]
- Velasco, I.; Fritsch, J.M. Mesoscale convective complexes in the Americas. J. Geophys. Res. Atmos. 1987, 92, 9591–9613. [Google Scholar] [CrossRef]
- Durkee, J.D.; Mote, T.L. A climatology of warm-season mesoscale convective complexes in subtropical South America. Int. J. Climatol. J. R. Meteorol. Soc. 2010, 30, 418–431. [Google Scholar] [CrossRef]
- Zipser, E.J.; Cecil, D.J.; Liu, C.; Nesbitt, S.W.; Yorty, D.P. Where are the most intense thunderstorms on Earth? Bull. Am. Meteorol. Soc. 2006, 87, 1057–1072. [Google Scholar] [CrossRef]
- Cecil, D.J.; Blankenship, C.B. Toward a global climatology of severe hailstorms as estimated by satellite passive microwave imagers. J. Clim. 2012, 25, 687–703. [Google Scholar] [CrossRef]
- Funk, C.; Peterson, P.; Landsfeld, M.; Pedreros, D.; Verdin, J.; Shukla, S.; Husak, G.; Rowland, J.; Harrison, L.; Hoell, A.; et al. The climate hazards infrared precipitation with stations—A new environmental record for monitoring extremes. Sci. Data 2015, 2, 1–21. [Google Scholar] [CrossRef]
- Cerón, W.L.; Molina-Carpio, J.; Ayes Rivera, I.; Andreoli, R.V.; Kayano, M.T.; Canchala, T. A principal component analysis approach to assess CHIRPS precipitation dataset for the study of climate variability of the La Plata Basin, Southern South America. Nat. Hazards 2020, 103, 767–783. [Google Scholar] [CrossRef]
- Skansi, M.d.l.M.; Brunet, M.; Sigró, J.; Aguilar, E.; Groening, J.A.A.; Bentancur, O.J.; Geier, Y.R.C.; Amaya, R.L.C.; Jácome, H.; Ramos, A.M.; et al. Warming and wetting signals emerging from analysis of changes in climate extreme indices over South America. Glob. Planet. Chang. 2013, 100, 295–307. [Google Scholar] [CrossRef]
- Reckziegel, B.W. Levantamento dos desastres desencadeados por eventos naturais adversos no estado do Rio Grande do Sul no período de 1980 a 2005. 2007. Available online: https://www.oasisbr.ibict.br/vufind/Record/UFSM-20_62dcbddc53875330e327de59e65a8bd2 (accessed on 11 March 2024).
- Paca, V.H.d.M.; Espinoza-Dávalos, G.E.; Moreira, D.M.; Comair, G. Variability of trends in precipitation across the Amazon River basin determined from the CHIRPS precipitation product and from station records. Water 2020, 12, 1244. [Google Scholar] [CrossRef]
- Cavalcante, R.B.L.; da Silva Ferreira, D.B.; Pontes, P.R.M.; Tedeschi, R.G.; da Costa, C.P.W.; de Souza, E.B. Evaluation of extreme rainfall indices from CHIRPS precipitation estimates over the Brazilian Amazonia. Atmos. Res. 2020, 238, 104879. [Google Scholar] [CrossRef]
- Olmo, M.E.; Bettolli, M.L. Extreme daily precipitation in southern South America: Statistical characterization and circulation types using observational datasets and regional climate models. Clim. Dyn. 2021, 57, 895–916. [Google Scholar] [CrossRef]
- Bai, L.; Shi, C.; Li, L.; Yang, Y.; Wu, J. Accuracy of CHIRPS satellite-rainfall products over mainland China. Remote Sens. 2018, 10, 362. [Google Scholar] [CrossRef]
- Shrestha, N.K.; Qamer, F.M.; Pedreros, D.; Murthy, M.; Wahid, S.M.; Shrestha, M. Evaluating the accuracy of Climate Hazard Group (CHG) satellite rainfall estimates for precipitation based drought monitoring in Koshi basin, Nepal. J. Hydrol. Reg. Stud. 2017, 13, 138–151. [Google Scholar] [CrossRef]


| Index | Indicator Name | Definition | Units |
|---|---|---|---|
| RX5day | Maximum 5-day precipitation amount | Monthly maximum consecutive 5-day precipitation | mm |
| CDD | Consecutive dry days | Maximum number of consecutive days with daily rainfall <1 mm | days |
| CWD | Consecutive wet days | Maximum number of consecutive days with daily rainfall ≥1 mm | days |
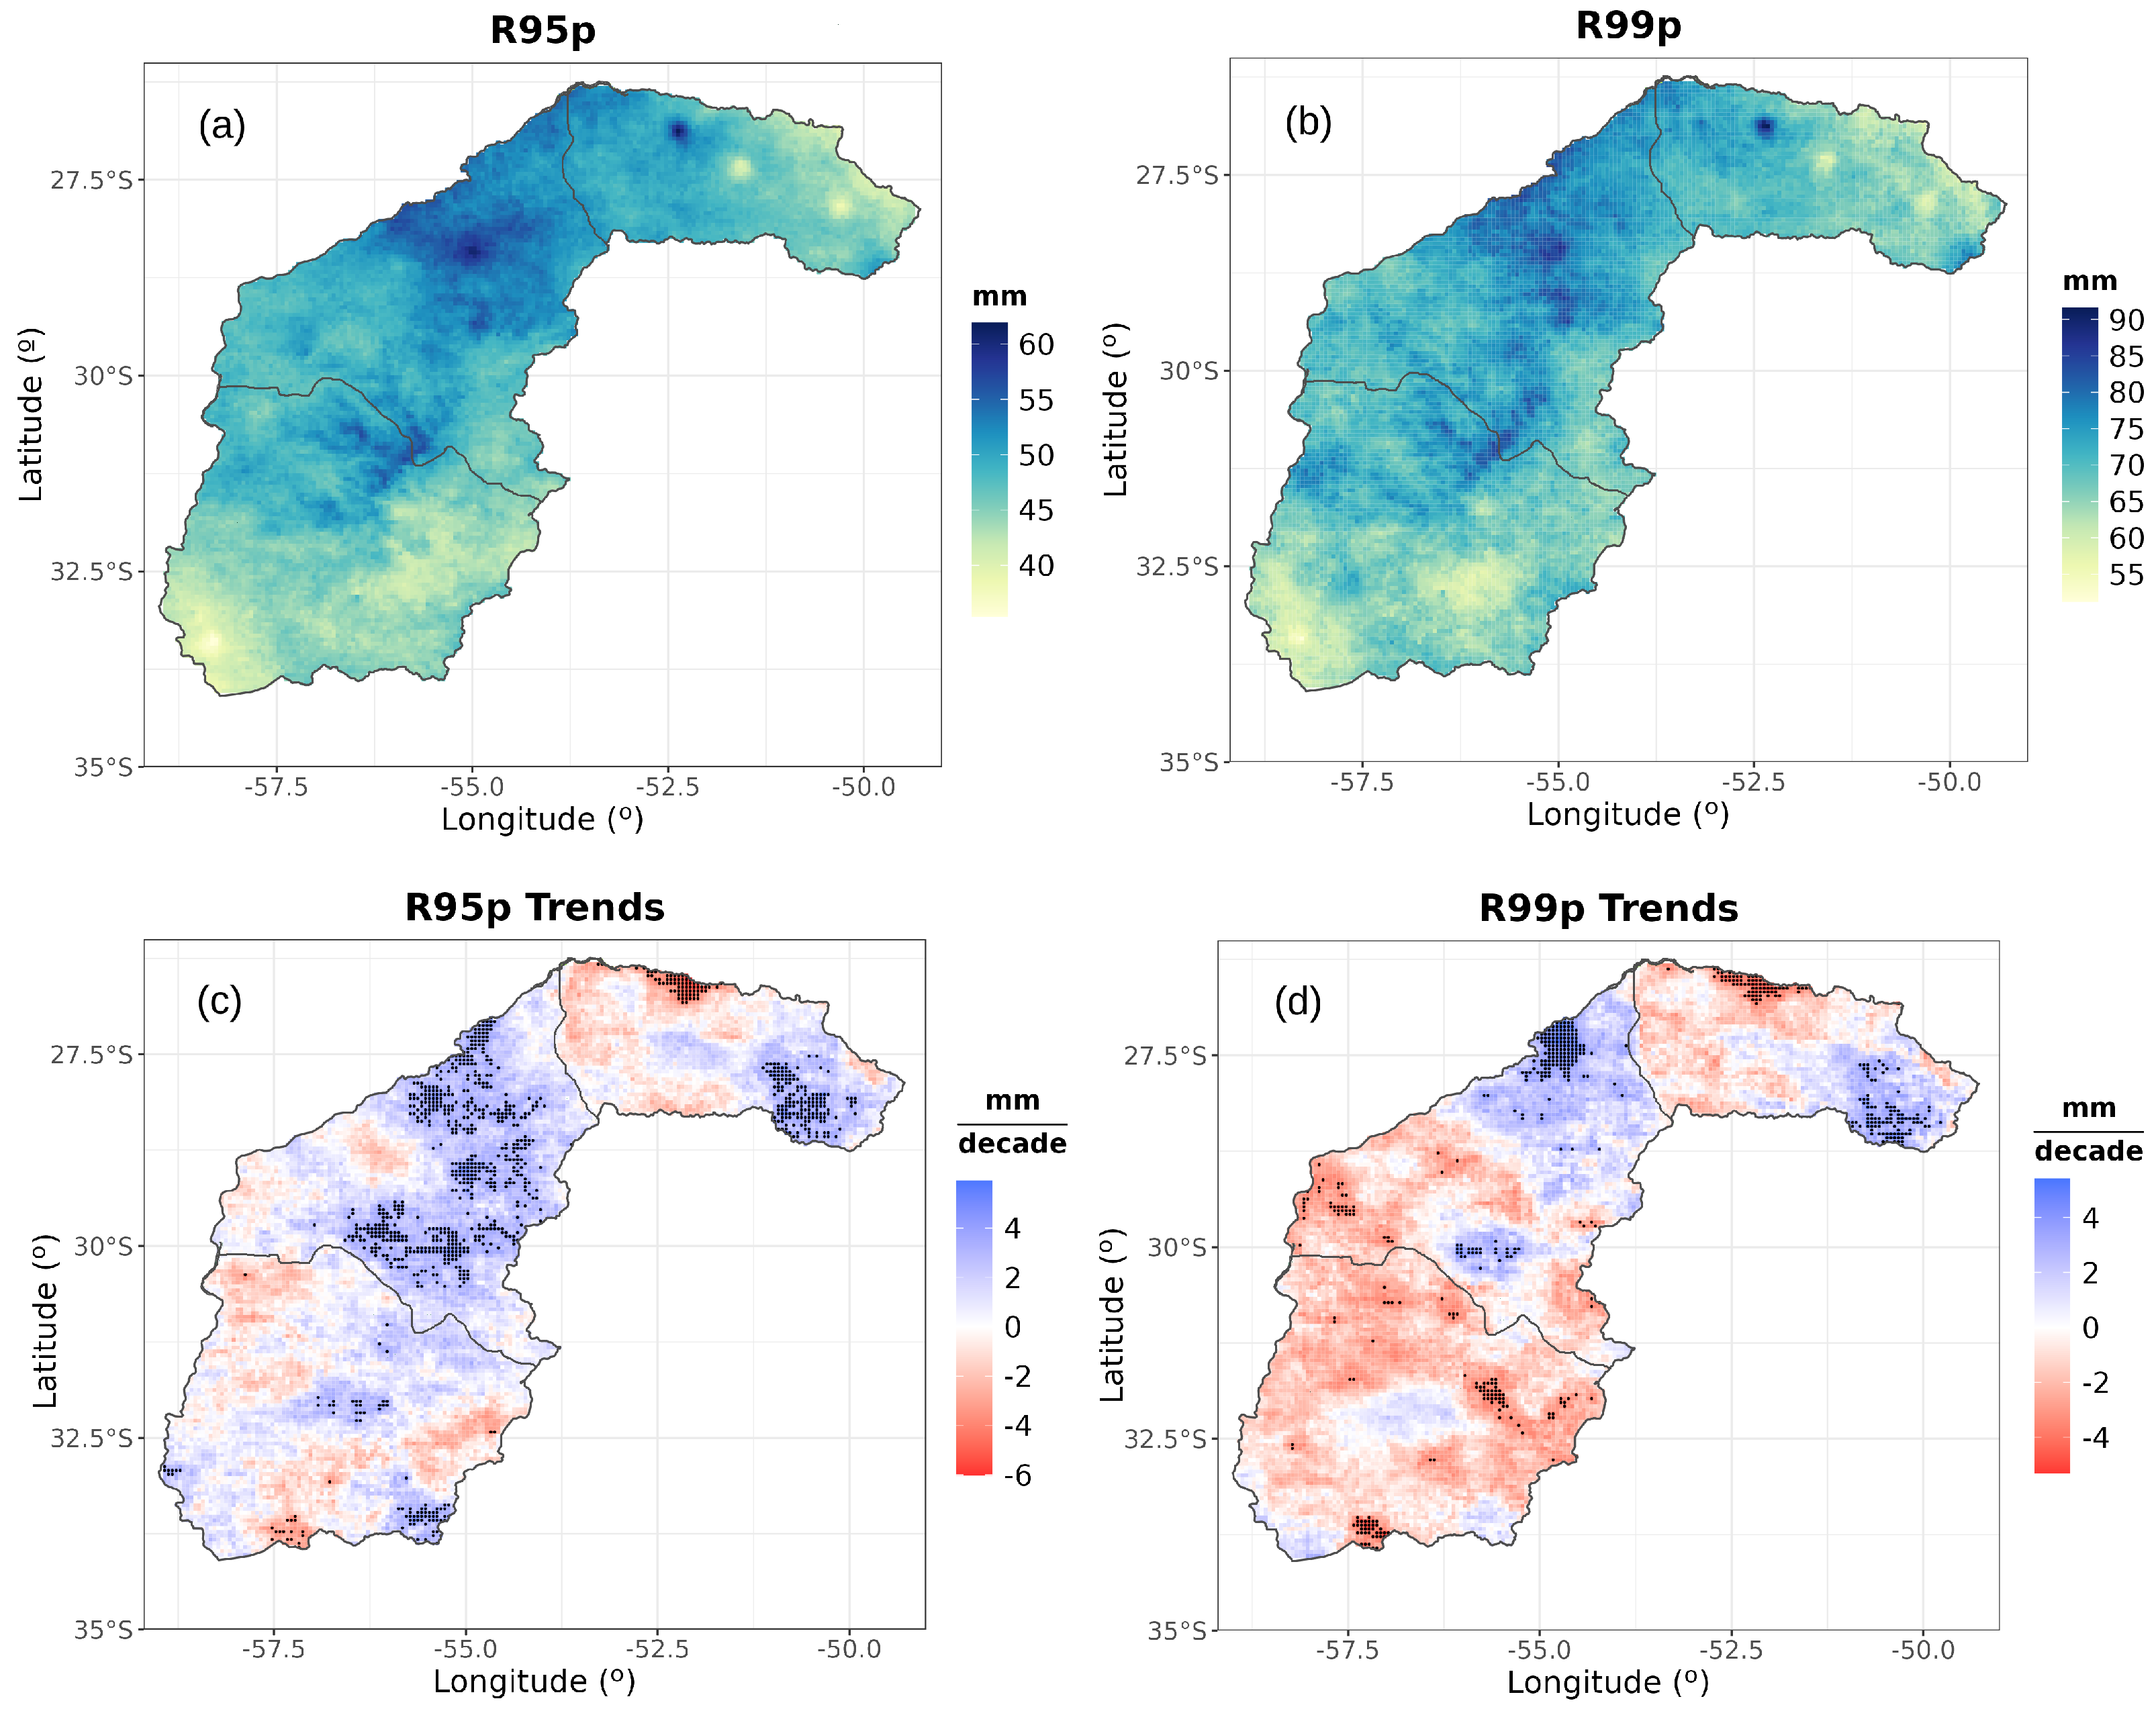
| R95p | Heavy precipitation | Annual total precipitation from daily rainfall >95th percentile | mm |
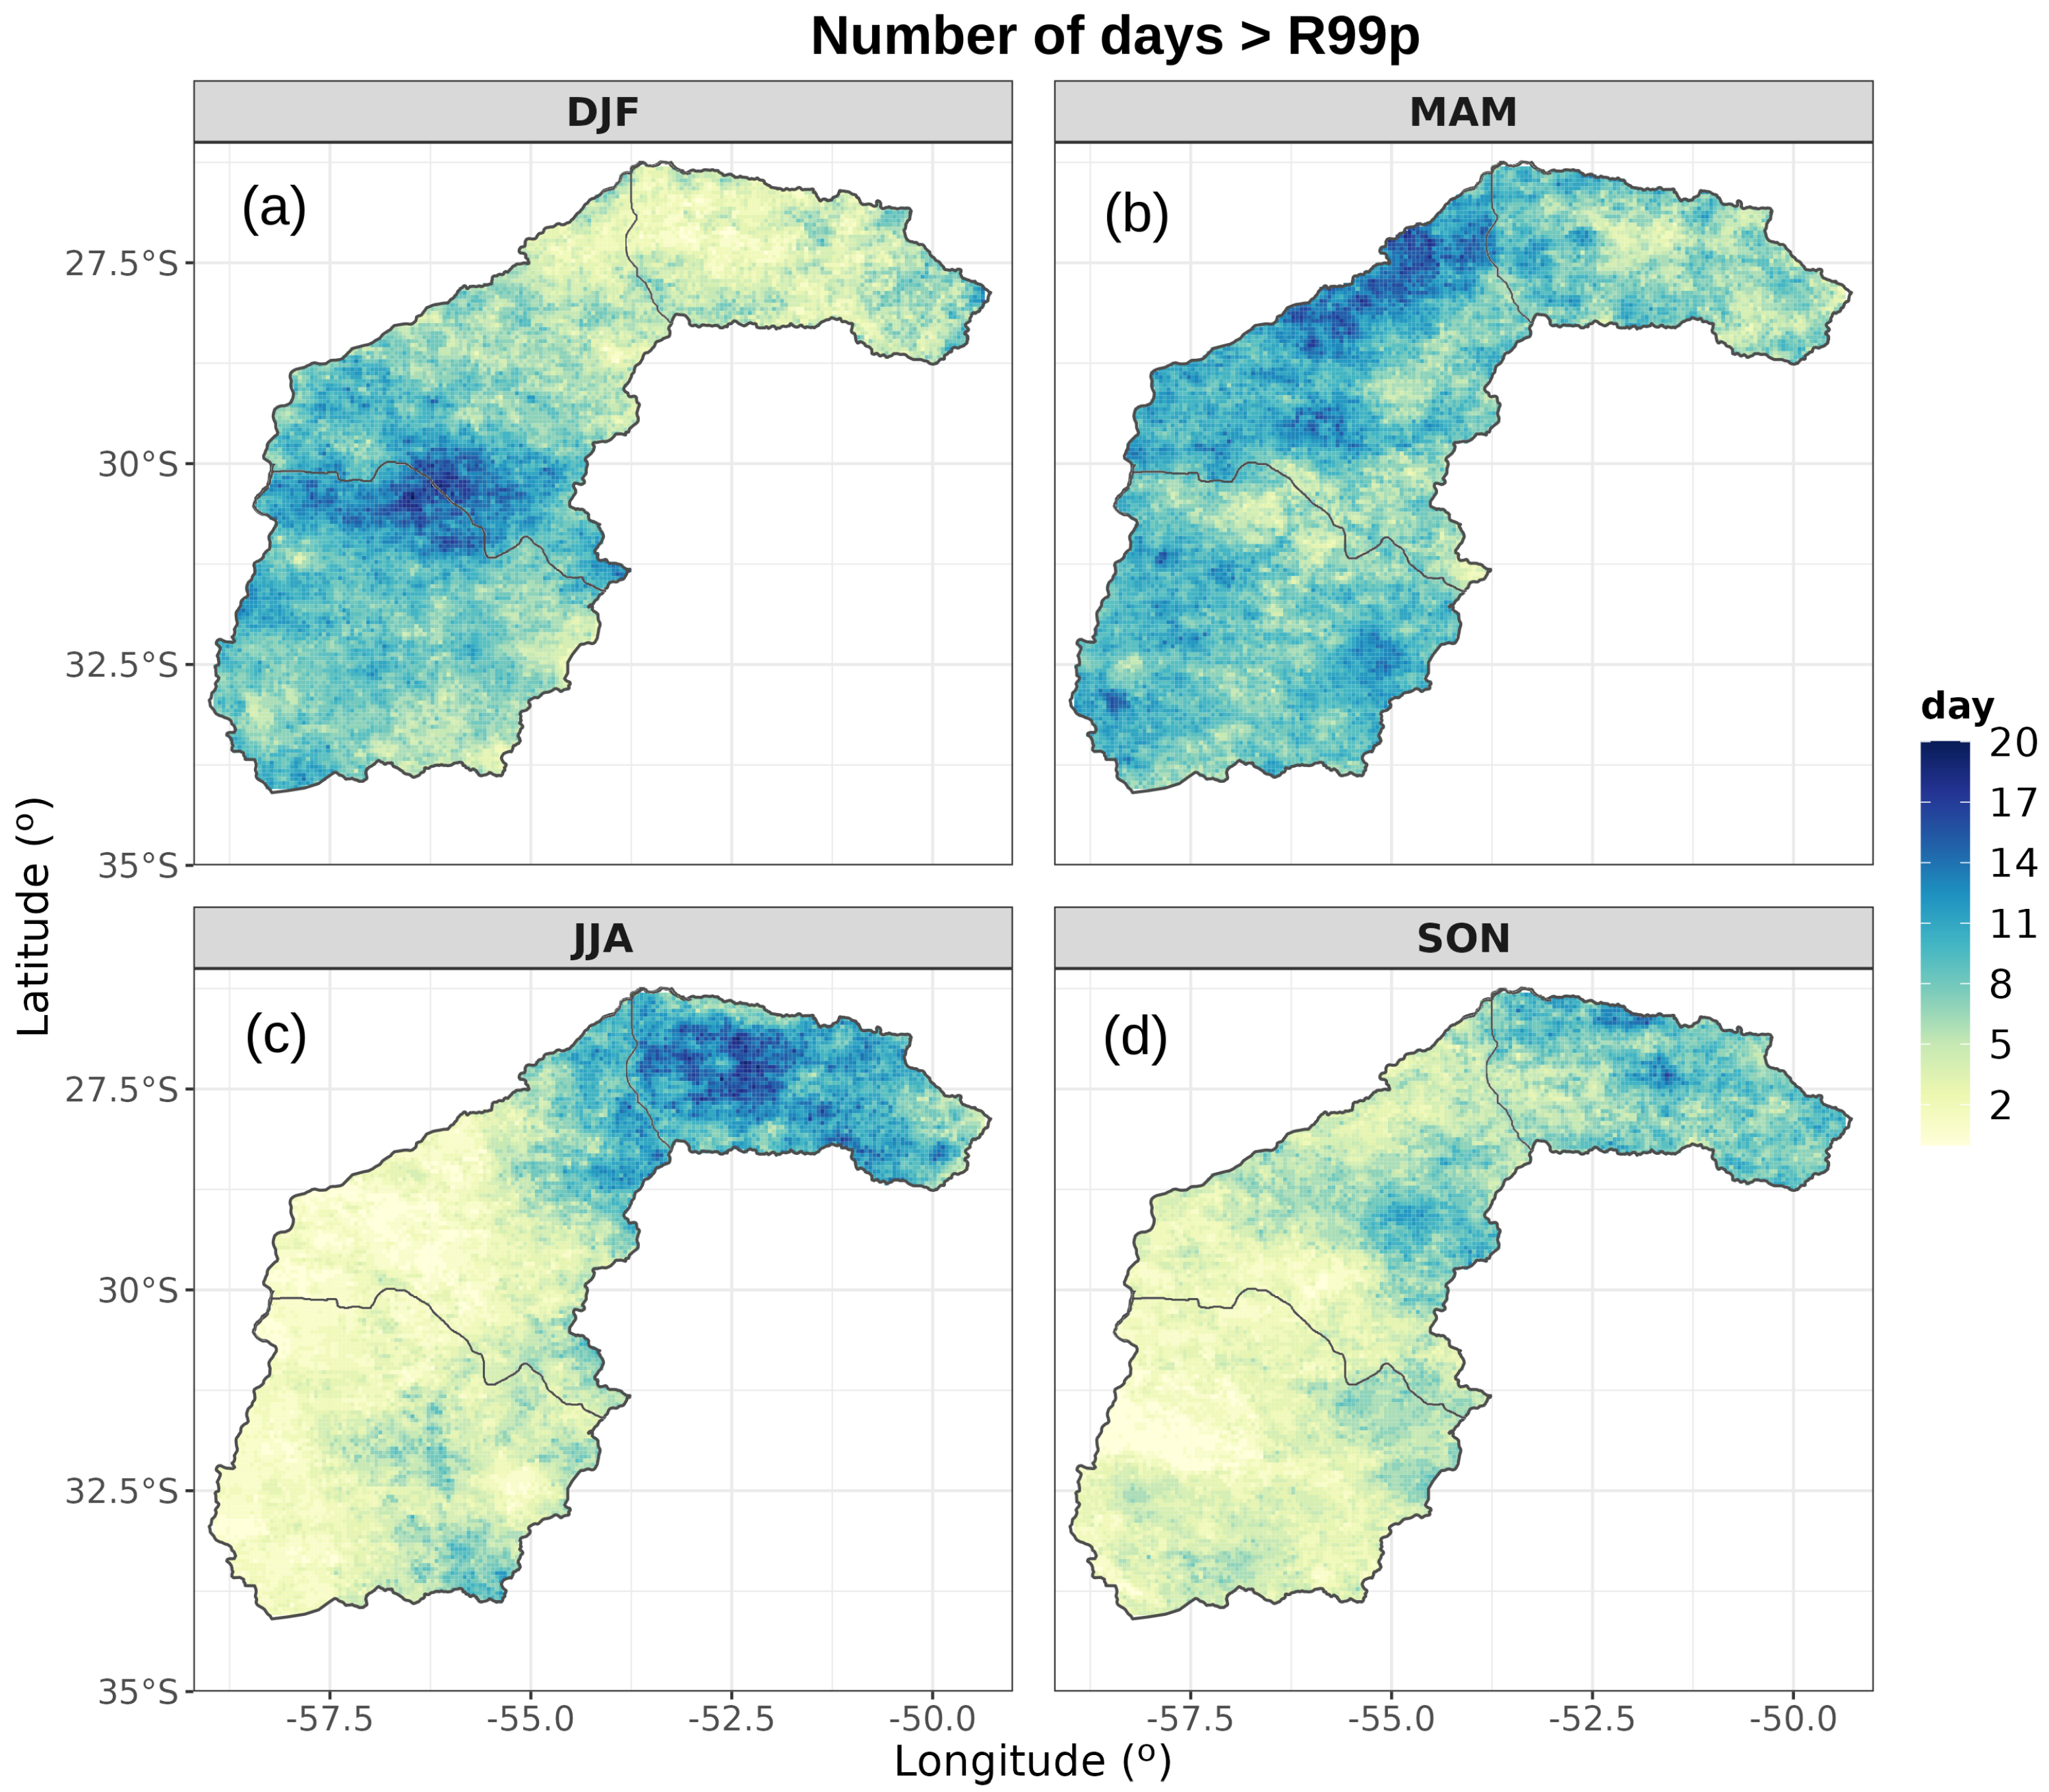
| R99p | Extreme precipitation | Annual total precipitation from daily rainfall >99th percentile | mm |
Disclaimer/Publisher’s Note: The statements, opinions and data contained in all publications are solely those of the individual author(s) and contributor(s) and not of MDPI and/or the editor(s). MDPI and/or the editor(s) disclaim responsibility for any injury to people or property resulting from any ideas, methods, instructions or products referred to in the content. |
© 2024 by the authors. Licensee MDPI, Basel, Switzerland. This article is an open access article distributed under the terms and conditions of the Creative Commons Attribution (CC BY) license (https://creativecommons.org/licenses/by/4.0/).
Share and Cite
Ferreira, V.; Bonfim, O.T.; Maroneze, R.; Mortarini, L.; Valdes, R.H.; Costa, F.D. Precipitation Extremes and Trends over the Uruguay River Basin in Southern South America. Climate 2024, 12, 77. https://doi.org/10.3390/cli12060077
Ferreira V, Bonfim OT, Maroneze R, Mortarini L, Valdes RH, Costa FD. Precipitation Extremes and Trends over the Uruguay River Basin in Southern South America. Climate. 2024; 12(6):77. https://doi.org/10.3390/cli12060077
Chicago/Turabian StyleFerreira, Vanessa, Osmar Toledo Bonfim, Rafael Maroneze, Luca Mortarini, Roilan Hernandez Valdes, and Felipe Denardin Costa. 2024. "Precipitation Extremes and Trends over the Uruguay River Basin in Southern South America" Climate 12, no. 6: 77. https://doi.org/10.3390/cli12060077
APA StyleFerreira, V., Bonfim, O. T., Maroneze, R., Mortarini, L., Valdes, R. H., & Costa, F. D. (2024). Precipitation Extremes and Trends over the Uruguay River Basin in Southern South America. Climate, 12(6), 77. https://doi.org/10.3390/cli12060077