Abstract
Morocco, despite its heavy reliance on imported fossil fuels, which made up 68% of electricity generation in 2020, has recognised its significant renewable energy potential. The Nationally Determined Contribution (NDC) commitment is to reduce emissions by 45.5% from baseline levels with international assistance and abstain from constructing new coal plants. Moreover, the Green Hydrogen Roadmap aims to export 10 TWh of green hydrogen by 2030, as well as use it for local electricity storage. This paper critically analyses this Roadmap and Morocco’s readiness to reach its ambitious targets, focusing specifically on an energy trilemma perspective and using OSeMOSYS (Open-Source energy Modelling System) for energy modelling. The results reveal that the NDC scenario is only marginally more expensive than the least-cost scenario, at around 1.3% (approximately USD 375 million), and facilitates a 23.32% emission reduction by 2050. An important note is the continued reliance on existing coal power plants across all scenarios, which challenges both energy security and emissions. The assessment of the Green Hydrogen Scenarios highlights that it could be too costly for the Moroccan government to fund the Green Hydrogen Roadmap at this scale, which leads to increased imports of polluting fossil fuels for cost reduction. In fact, the emission levels are 39% higher in the green hydrogen exports scenario than in the least-cost scenario. Given these findings, it is recommended that the Green Hydrogen Roadmap be re-evaluated, with a suggestion for a postponement and reduction in scope.
1. Introduction
Despite its limited access to fossil fuels reserves, Morocco possesses a substantial capacity for renewable energy sources. Various initiatives have been implemented to harness this potential, including the construction of the world’s largest concentrated solar power plant [1] and Total Energies’ commitment to invest in a 10 GW green hydrogen production facility [2]. By taking advantage of its favourable geographical location for exports, Morocco aspires to emerge as a leading influencer in the field of renewable energy. Nevertheless, the nation relies heavily on fossil fuels for its energy needs, which significantly contribute to pollution levels. While the country’s rich renewable energy sources hold promise, the intermittent nature of these resources creates challenges in their wide-scale deployment, necessitating a focus on electricity storage [3,4,5]. Small-scale or short-term solutions like pumped hydropower or CSP are established, but the transition towards green hydrogen is gaining traction [6,7,8,9]. Moreover, the Moroccan government has set ambitious targets through the Green Hydrogen Roadmap (GHR), such as the export of 10 TWh of green hydrogen by 2030, 115 TWh by 2050, and 20 TWh for local use.
However, a nuanced assessment of the feasibility of this ambitious Roadmap target is crucial to devise efficient policies and strategies for the swift deployment of green hydrogen, simultaneously reducing the reliance on fossil fuels, enhancing energy security, and mitigating environmental pollution. The potential establishment of a green hydrogen industry may create new economic opportunities and job prospects, especially as Morocco aspires to be a leading green hydrogen exporter to Europe. Despite these advantages, the use of hydrogen warrants critical evaluation due to market competition with batteries and electrification, along with high costs [10].
This paper aims to comprehensively evaluate the least-cost pathway to the integration of electrolysis-based green hydrogen in Morocco’s electricity mix, utilising an integrated energy modelling approach. The study encompasses an assessment of the technical and economic impacts of employing green hydrogen as a clean source of electricity storage, as well as for exports. The scope of this study focuses on hydrogen use for the power sector but will exclude its uses for the transportation and industry sectors. The research question is therefore as follows: Is Morocco ready for the deployment announced in the Green Hydrogen Roadmap with regard to the energy trilemma (Figure 1)? This paper will model different scenarios using OSeMOSYS.
Figure 1.
Energy trilemma (adapted from [11]).
1.1. Background: Morocco’s Energy System
With a population of approximately 37 million people, Morocco has achieved an important electrification rate of 99.9%, making it a leader in electricity access across Africa [12]. In 2020, Morocco’s final electricity consumption amounted to 33.52 TWh [13]. Notably, the country has experienced a consistent annual increase in electricity demand, averaging between 5% and 7% per annum [14]. Projections indicate that by 2030, the expected electricity consumption will exceed 160 PJ [15].
The growing demand for electricity has led to an expansion of Morocco’s installed capacity, starting its “energetic revolution” around 2010. In 2022, the country’s installed capacity stands at 15 GW. Coal accounts for 37%, hydropower 16%, and natural gas 18%, as shown in Figure 2. Morocco’s annual generation from renewable energy (RE) surpassed its generation from oil and gas in 2012 and 2018, respectively [13]. However, Morocco’s hydropower capacity is predicted to decrease in the next decade because of anthropogenic climate change leading to increased droughts in the Atlas Mountains [16,17], and will not fulfil the 12% of total power generation target announced in the NDC [4].
In 2021, power generation increased by 5.3% [14], fulfilling the entire country’s electricity demand for the second year in a row, and exports grew by 36.5% [14]. These exports are expected to increase with the expansion of renewable energies [15]. Moreover, Morocco’s partnership with Xlink to export wind and solar energy to the United Kingdom through undersea cables showcases its willingness to become an RE export leader globally. However, electricity values do not reflect the state of the general energy sector in Morocco. The country remains a net importer of energy at 90% [18], which mainly consist of hydrocarbons [19]. These lead to total annual emissions equalling up to 62.2 Mtons of CO2 [13].
Figure 2.
Total electricity generation by source in Morocco in 2019 [19].
Figure 2.
Total electricity generation by source in Morocco in 2019 [19].

This study analyses the Moroccan electricity system from an energy trilemma perspective. The energy trilemma involves finding a balance among three dimensions: energy security, environmental sustainability, and economic affordability. Energy security focuses on ensuring reliable and uninterrupted access to energy resources to maintain supply stability. Environmental sustainability aims to reduce the environmental impact of energy production and consumption, particularly in terms of greenhouse gas emissions and pollution. Economic affordability concerns the accessibility and cost-effectiveness of energy services for consumers and industries. Navigating this trilemma involves making trade-offs and finding synergies to develop sustainable and equitable energy systems that meet current and future needs while addressing global issues like climate change and energy access. Overall, Morocco’s energy trilemma is graded as “DCC” for security, equity, and sustainability, respectively, by the World Energy Council [20].
Morocco has hosted the UNFCCC COP twice, shining light on its efforts to set an example through ambitious climate targets [21]. The Kingdom’s goals under the Nationally Determined Contributions of the 2016 Paris Agreements are an emission reduction target of 45% from the baseline scenario and 52% of installed capacity being RE by 2030. Morocco also pledged to avoid investing in new coal plants at the 2021 COP26 in Glasgow, as shown in Figure 3.
Figure 3.
Morocco’s climate targets (adapted from [22]).
Morocco articulated an ambitious strategy to become a leader in the hydrogen sector. This plan is laid out in the National Hydrogen Commission’s Roadmap on Green Hydrogen [23], as summarised in Figure 4.
Figure 4.
Green Hydrogen Roadmap objectives (adapted from [23]).
The plan takes a phased approach. It begins with integrating green hydrogen into the industrial sector, followed by exporting and utilising it for electricity storage from 2030 onwards. These ambitious targets aim to stimulate the economy, enhance energy security, and improve the trade balance through green hydrogen exports. The GHR identifies maritime shipping as the main export method, although it should be noted that this method is still in relatively early stages of development, as the first shipping of liquid hydrogen only happened in 2020 from Australia to Japan [24].
1.2. Literature Review
To support these published targets, reduce the dependence on non-renewable fuels, decarbonise its energy system, and support economic development, Morocco is planning on using its high potential for solar and wind energy [6]. The former presents a technical potential of 49,000 TWh/year [23], highlighting significant opportunities for decarbonisation. However, it also underscores the issue of intermittency. Pumped hydropower and Concentrated Solar Power are currently used for electricity storage in Morocco, amounting to approximately 6.25 GWh in 2022 [25]. However, the potential curtailment in Morocco could reach up to 5 TWh by 2050 due to factors like droughts impacting the hydropower potential, indicating the need for additional and more diverse storage solutions [19,26].
Hydrogen serves as a carrier or storage medium for energy rather than being a primary energy source itself. It acts as an intermediary, allowing energy to be stored and transported efficiently. It must be produced from primary energy sources through various methods, including coal gasification, steam methane reforming, and electrolysis. Hydrogen has multiple uses for transport, industry, and electricity storage. In the case of green hydrogen, the electricity is used to split water into hydrogen and oxygen by electrolysis, using solely renewable electricity [27]. The produced hydrogen is then stored in high-capacity tanks, salt caverns, Underground Seasonal Hydrogen Storage facilities, and exhausted hydrocarbon reservoirs for later use [27]. It can therefore provide short- and long-term (inter-seasonal) electricity storage [28], enabling a more reliable and stable supply of electricity [26].
Globally, hydrogen has emerged as a promising fuel for the future, with the 2020s being recognised by some as the “decade of hydrogen” [10], which is considered essential for decarbonisation [29,30] and could represent a way to decrease the reliance on fossil fuels in the context of the energy crisis [31,32,33]. This perception is substantiated by the projected exponential growth of the GH2 electrolysis market, which is estimated to increase by a factor of 1000 by 2040 [27].
Morocco has mostly been learning from Germany’s research on GH2 [19,26,34]. These reports were produced in the context of the German–Moroccan Agreements (PAREMA) [34], which led to the creation of the GHR. This was guided by Germany’s willingness to import GH2 from Morocco, which was demonstrated by the connection established between Tanger and Hamburg’s ports in 2021 [34,35]. Moreover, Morocco’s green hydrogen potential is also recognised internationally, with entities like Deloitte, IRENA, and the IEA citing the country as a prime prospect for European GH2 exports [30,36,37].
The successful deployment of sustainable hydrogen in Morocco will, however, hinge on global demand, low-cost renewable energy availability, sustained growth in renewable energy, water availability, and suitable financing [38]. Additional considerations will involve adherence to GH2 sustainability policies and the impact of hydrogen storage on the Moroccan grid.
Morocco therefore presents great potential for GH2 deployment for local use and exports and has published its targets. This research project recognises, however, the existence of a research gap relating to the assessment of Morocco’s energy system’s readiness for the announced GH2 deployment, especially using an energy trilemma perspective. Employing OSeMOSYS will not only assess the viability of predefined targets but also offer critical information such as the necessary electrolyser capacities, costs associated with deployment, reductions in emissions, and optimal combinations of renewable electricity sources to be integrated with electrolysers and fuel cell technologies, and an analysis of these aspects has not been published previously.
2. Methodology
This section begins by reviewing previous models of Morocco’s energy systems and hydrogen research, highlighting the relevance and suitability of OSeMOSYS, the selected modelling tool. It proceeds to detail the inputs integrated into the OSeMOSYS model. Finally, it outlines the specific scenarios employed.
2.1. Previous Energy System Modelling
Table 1 presents previous OSeMOSYS models focusing on Morocco.
Table 1.
Prior examples of modelling of Morocco’s energy sector using OSeMOSYS.
These studies show that using the OSeMOSYS tool allowed researchers to decipher the necessity and potential for using renewable energy in Morocco to achieve NDC goals.
Table 2 presents energy system modelling papers that were useful to understand the feasibility, advantages, and trade-offs of green hydrogen deployment at a country scale.
Table 2.
Prior examples of modelling of green hydrogen.
These articles indicate that green hydrogen is promising for electricity storage and exports and that utilising OSeMOSYS is appropriate for performing a techno-economic evaluation of the incorporation of green hydrogen at a national level.
Lastly, Table 3 shows previous modelling papers focusing on hydrogen in Morocco.
Table 3.
Prior examples of modelling of green hydrogen in Morocco.
In conclusion, the OSeMOSYS is well suited for green hydrogen energy system modelling, drawing on the tool’s strengths in handling renewable energy sources and storage solutions.
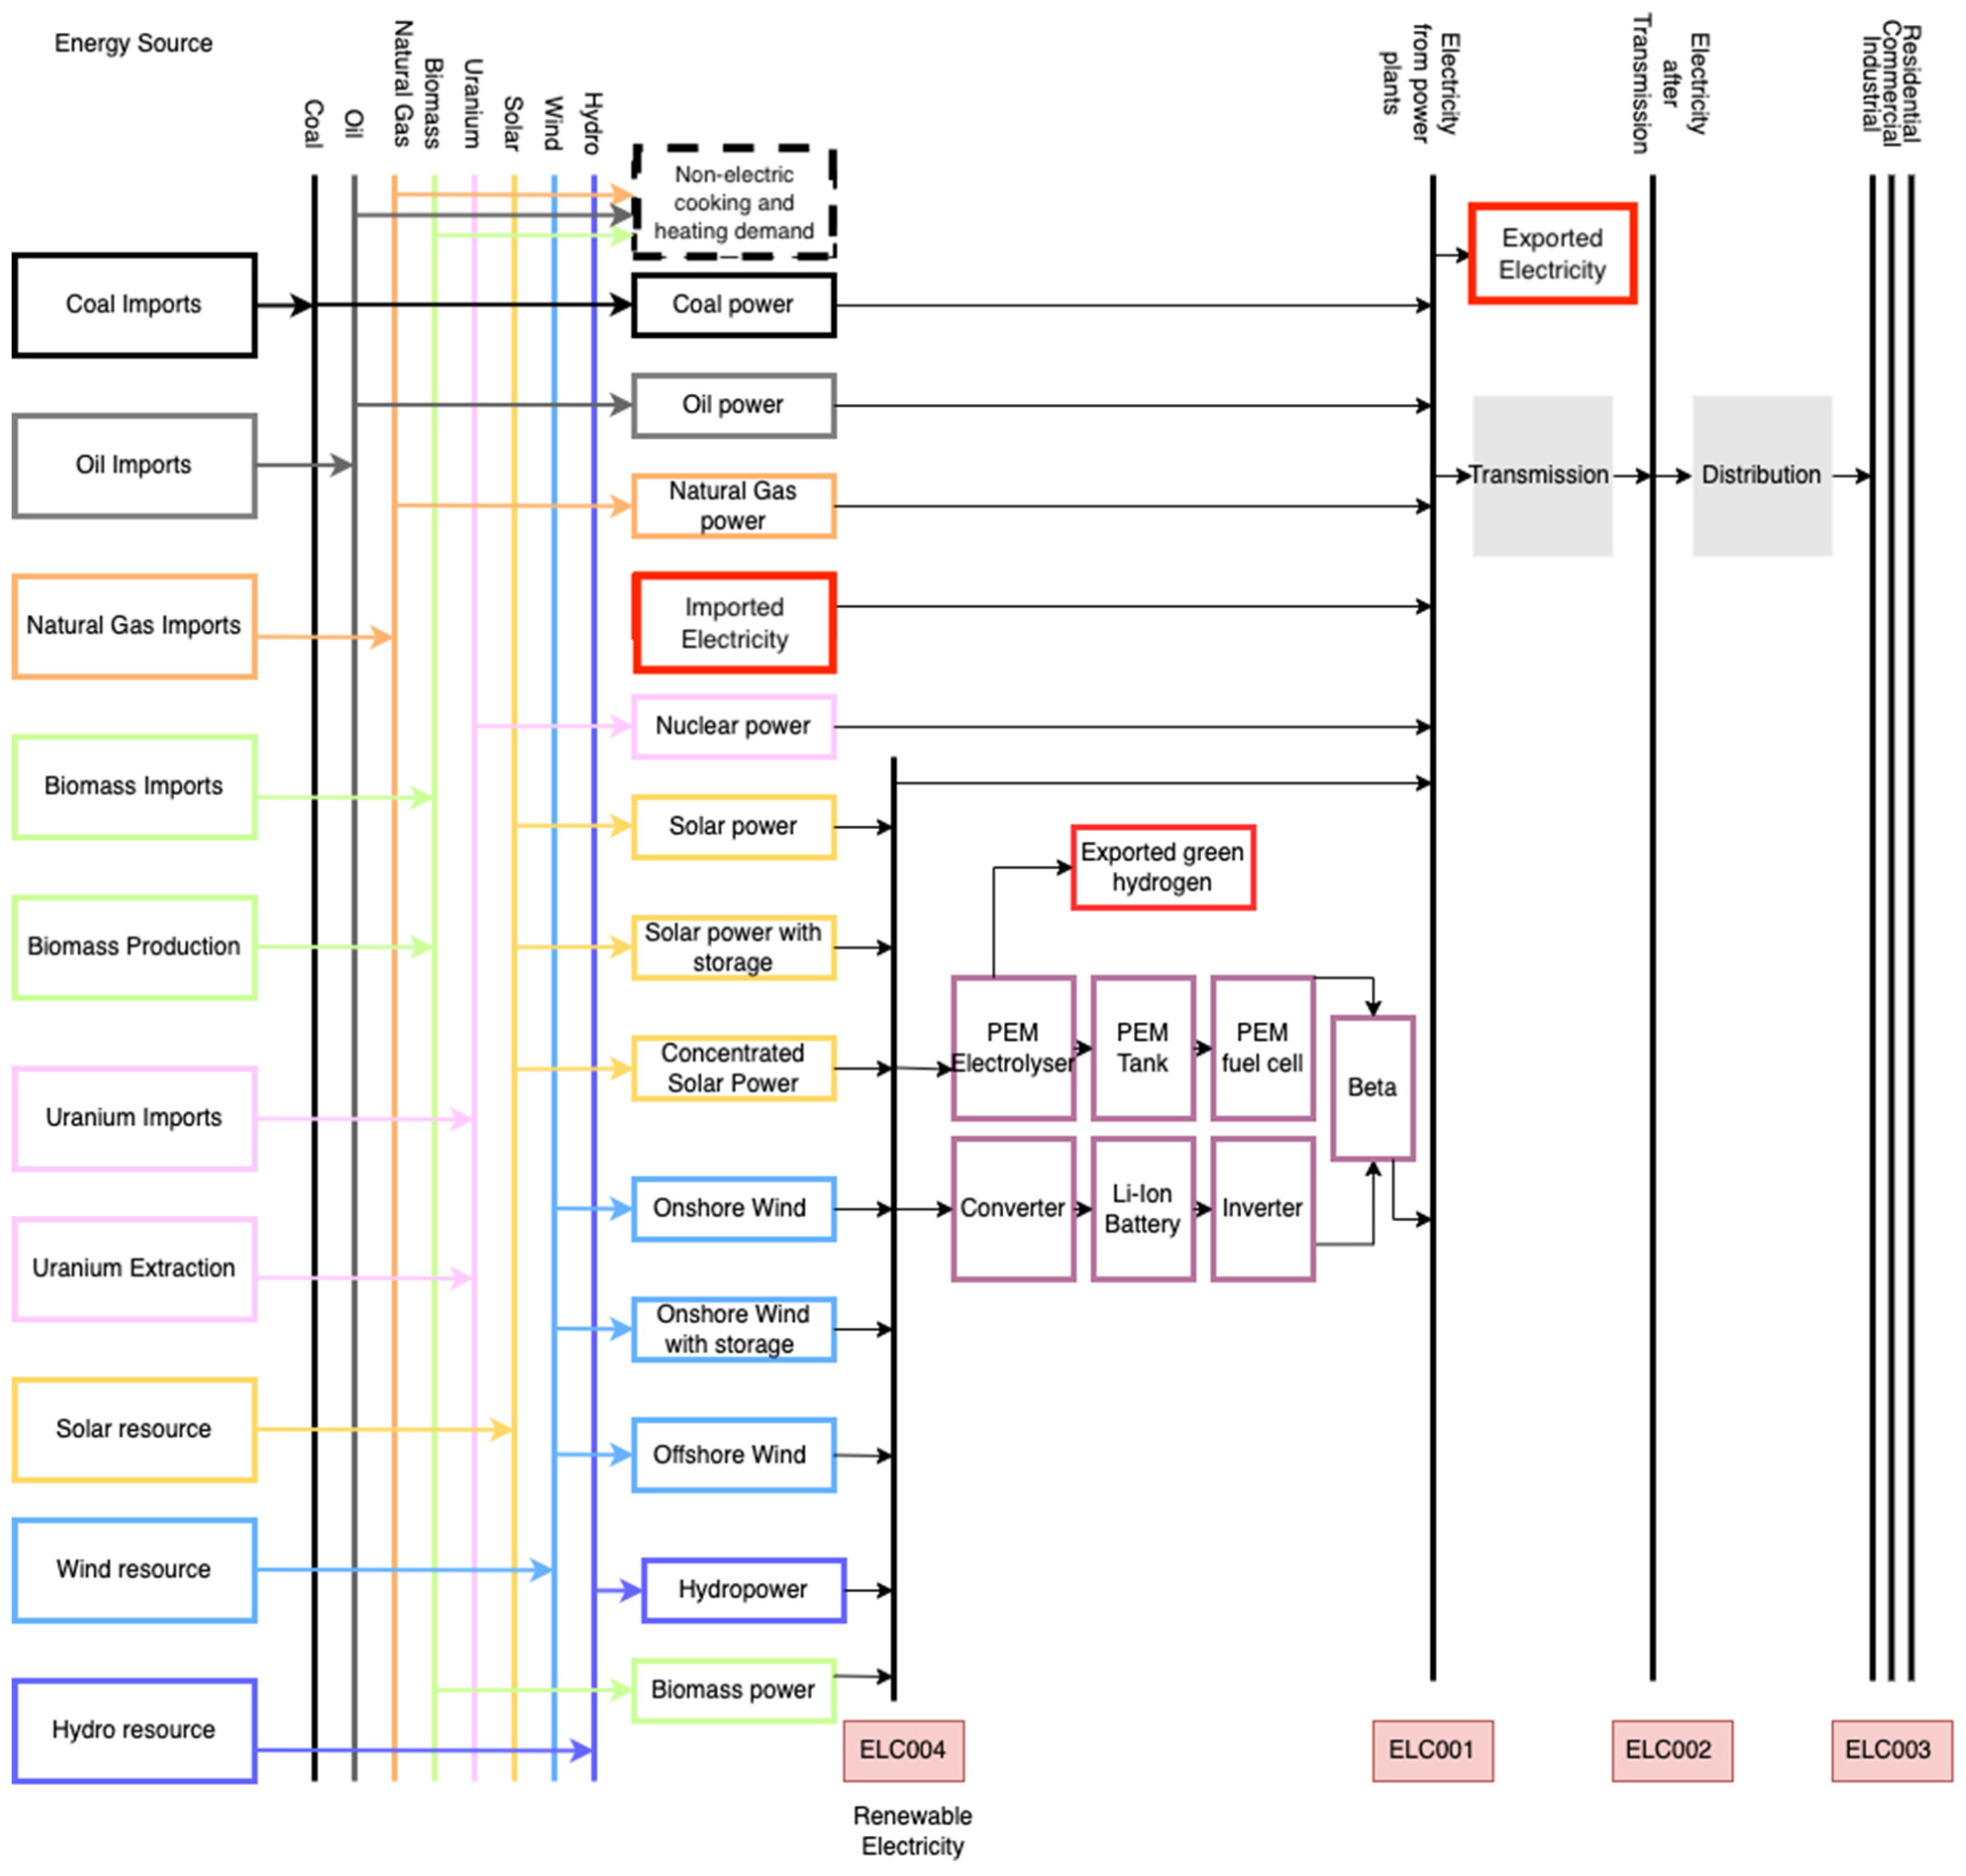
2.2. Energy System Modelling Framework
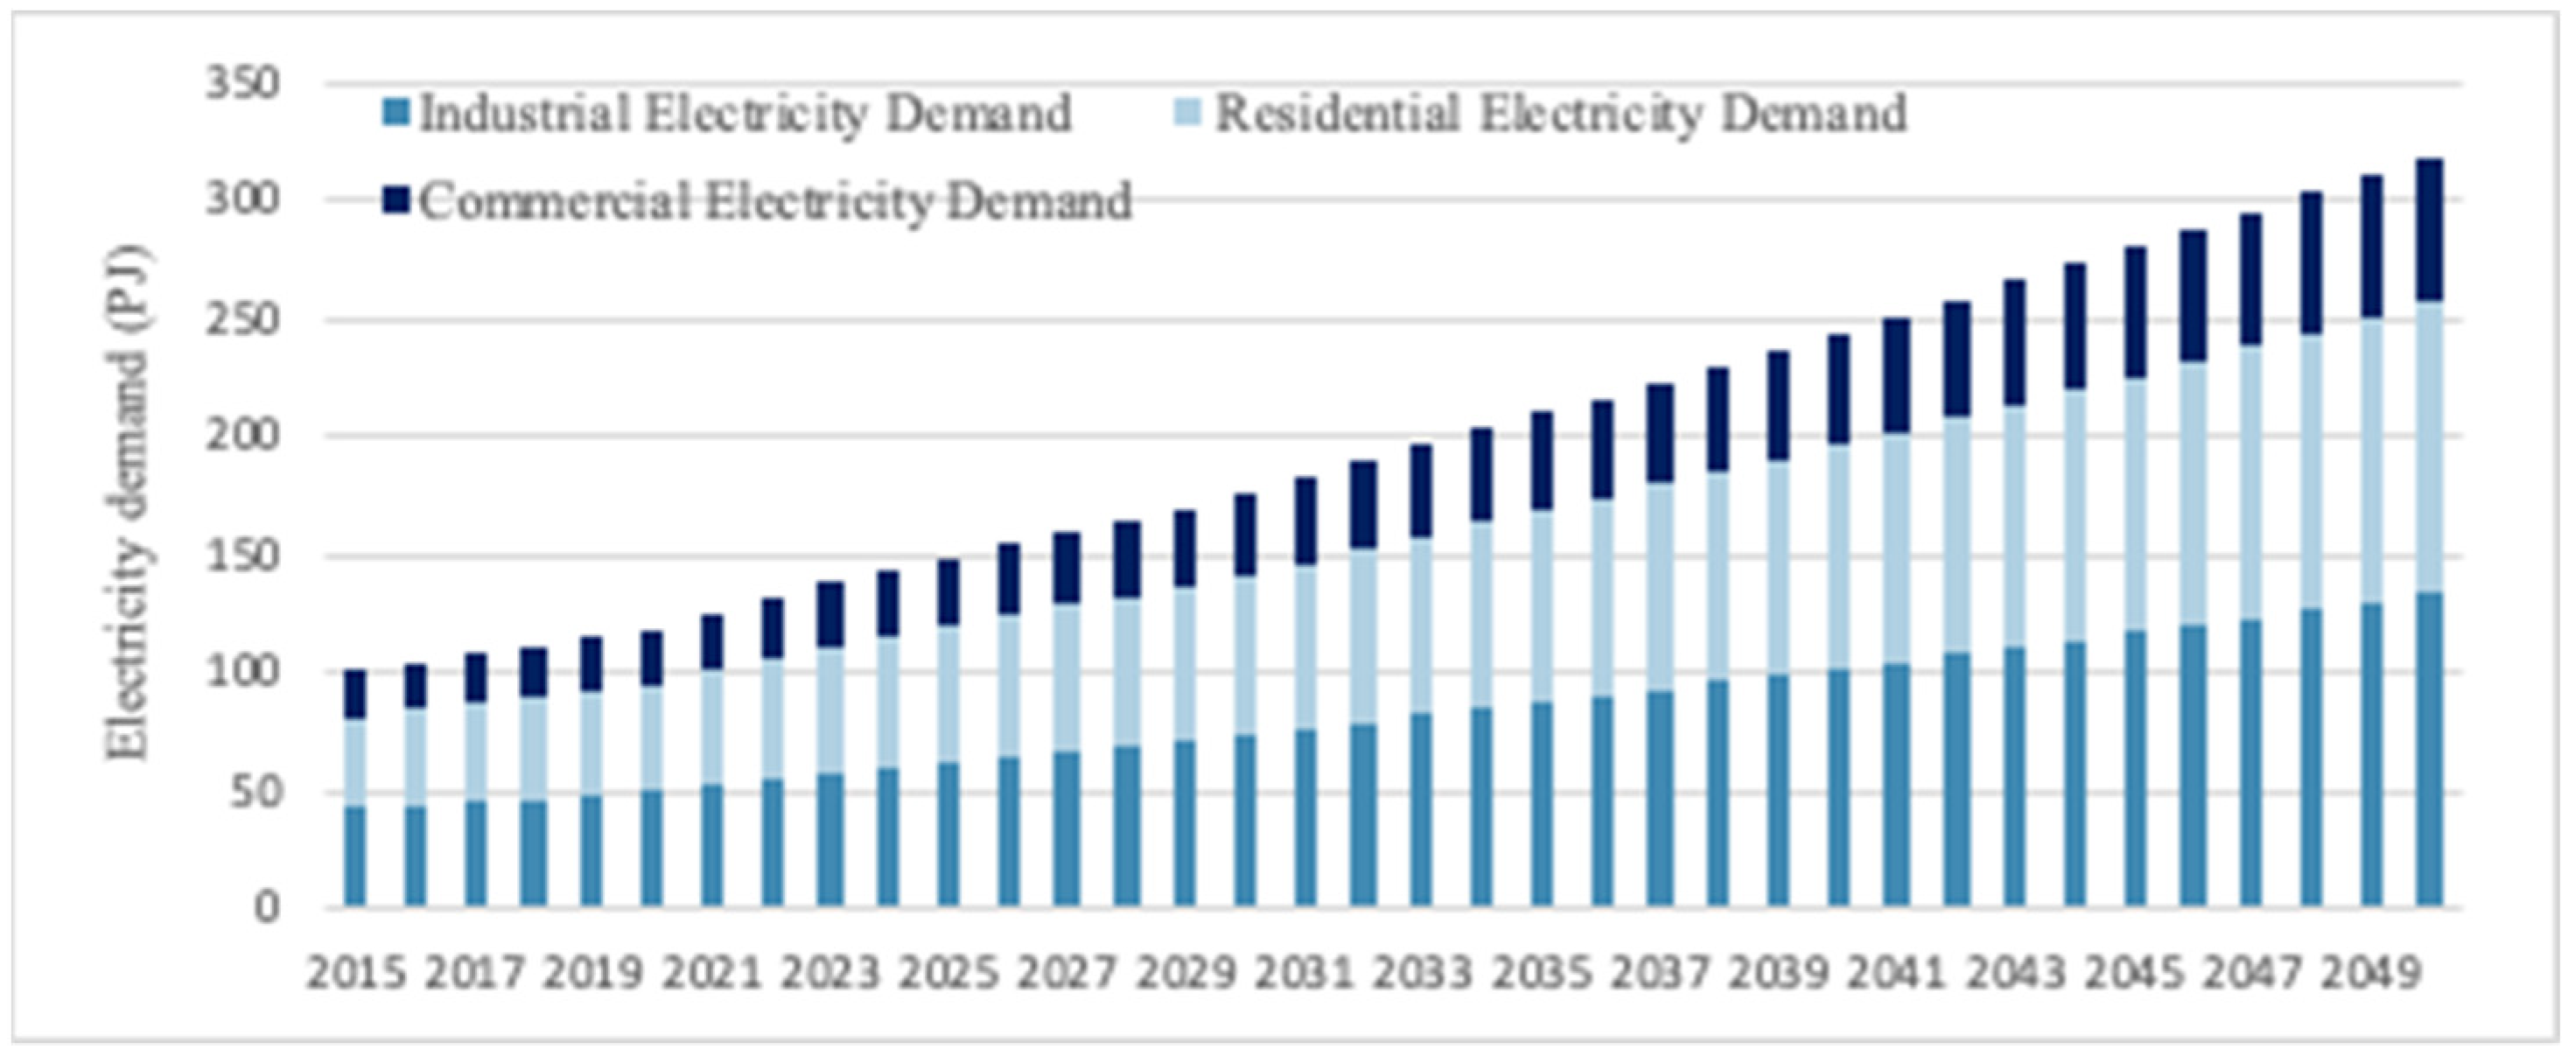
The least-cost modelling approach of OSeMOSYS was deemed suitable for Morocco, as it is considered an emerging economy that heavily relies on international financing to support its energy transition, and places a significant emphasis on cost-minimisation. OSeMOSYS generates long-term pathways with open-source accessibility, allowing other entities such as governments, consultants, and academics to conduct further research using the model [42]. In developing the model for this project, the Simple And Nearly Done (clicSAND) spreadsheet-based interface was used, enhancing OSeMOSYS’ accessibility [42]. OSeMOSYS ensures the fulfilment of all energy demands and related constraints through its solution to various scenarios. The constraints can include potential capacity limits, annual availability, or investment limitations for technologies; OSeMOSYS allows for the generation of the least-cost solution [42].
The data pertaining to various technology and fuel parameters were obtained from the previous model [4], building on the starter-data kit [43] (Appendix A.2). Each technology is characterised by its capital, fixed and variable costs, efficiency, capacity factors, operational lifetimes, maximum capacity potential, and emission intensity. The technologies employed in this study are biomass, coal, oil, natural gas, solar, solar with storage, CSP, hydropower, onshore wind, onshore wind with storage, offshore wind, and nuclear. Furthermore, the model incorporates transmission and distribution networks, as well as “energy-efficient measures” that represent improvements in efficiency, leading to a reduced energy demand. This model uses USD as currency, with 2015 as the base year.
2.3. Inputs
2.3.1. Temporal Modelling Assumptions
The modelling period of 2015–2050 to describe the Moroccan electricity system’s idiosyncrasy. The use of 8 time slices was maintained to minimise the runtime of the model without compromising its level of detail. The time slices describe electricity demand differences between day (6:00 AM to 6:00 PM) and night (6:00 PM to 6:00 AM) for the 4 seasons, autumn, winter, spring, and summer, as shown in Figure 5.
Figure 5.
Morocco’s residential electricity demand, divided into 8 time slices, in 2023 and 2050.
Lastly, the electricity demand increase between 2015 and 2050 because of rapid GDP and population growth [21] are presented in Figure 6.
Figure 6.
Morocco’s projected electricity demand in PJ from 2015 to 2050 (data from [4]).
2.3.2. Historical Generation
The technologies’ historical generations were constrained by updating the Total Technology Annual Activity Upper and Lower Limit parameters slightly above (0.5 PJ) and under the real-life values, and are shown in Appendix A.1.
2.3.3. Residual Capacity
The variations in installed capacities over time, known as residual capacities and detailed in Table 4, were determined by analysing data on power plant capacities [44], operational lifetimes, and planned retirement dates, as outlined in the Residual Capacity Calculator [45]. This assessment only takes power plants that are currently operational or under construction into account. A decrease in residual capacities does not always suggest a decline in the technology’s usage. Rather, it can indicate the absence of scheduled projects as of the current date. For instance, Morocco’s solar energy capacity is forecasted to rise significantly in future decades. However, because the specifics of future solar projects, including their capacities and construction schedules, have not been released, they are not factored into the calculations. Coal, however, stands as an exception. Morocco’s pledge to avoid launching new coal plants [22] means that the decrease in coal capacity is directly linked to the scheduled end-of-life and decommissioning of the numerous existing plants.
Table 4.
Residual capacities updated from the previous model (data from [44]).
Residual capacities reflect the potential for energy production, not constant usage. This distinction matters because actual energy consumption can vary, highlighting that these capacities signify the potential output, not continuous operation.
2.3.4. Power System Flexibility
One of the most consequential changes to the previous model is the addition of caps (Table 5) on the maximum percentage of wind and solar energies in electricity generation due to inherent flexibility concerns.
Table 5.
Maximum percentages of VREs in OSeMOSYS model for flexibility considerations [46].
2.3.5. Addition of Storage
The addition of storage to the OSeMOSYS model followed the Traditional (TRAD) methodology [47] and uses a different time representation to account for years (y) and seasons (s), but also day types (ld), daily time brackets (lh), and time slices (l), to obtain a modelling timeline. For this, the season, day type, and daily time bracket parameters were then added to the Text files.
In terms of storage technologies, batteries and GH2 storage technologies were added to the model. Li-ion battery technologies were chosen, as they present good round-trip efficiency, are the most used globally [47], and the technology is mature. Despite increasing electricity costs, they allow for quicker grid decarbonisation, as they are immediately scalable. Converter and Inverter technologies were added to link the batteries to the power plants and to the grid.
New commodities called ELC004, ELC005, GGH, GGHS, ELC006, and ELC007 were necessary for modelling the storage of green electricity. Lastly, the BETA technology was added to link the renewable electricity (ELC004) back to the grid (ELC001). For the GH2 technologies, PEM electrolysers, tanks, and fuel cells were added, as they present very dynamic behaviour, making them suitable for coupling with renewable energies to produce GH2 [47]; the properties of these technologies are described in Table 6.
Table 6.
Additional technologies for storage added to the OSeMOSYS model (data from [47]).
2.3.6. Addition of Exports
For the Exports scenario, a GH2 export technology was added too, as presented in Figure 7, and is useful for comparing the outputs to that of the storage systems. The capital cost is set to USD 2502, the same as the distribution costs, as the GHR projects the use of mainly maritime exports [23].
Figure 7.
Simplified energy system of Morocco’s electricity system. The arrows indicate the energy flows from production to consumption.
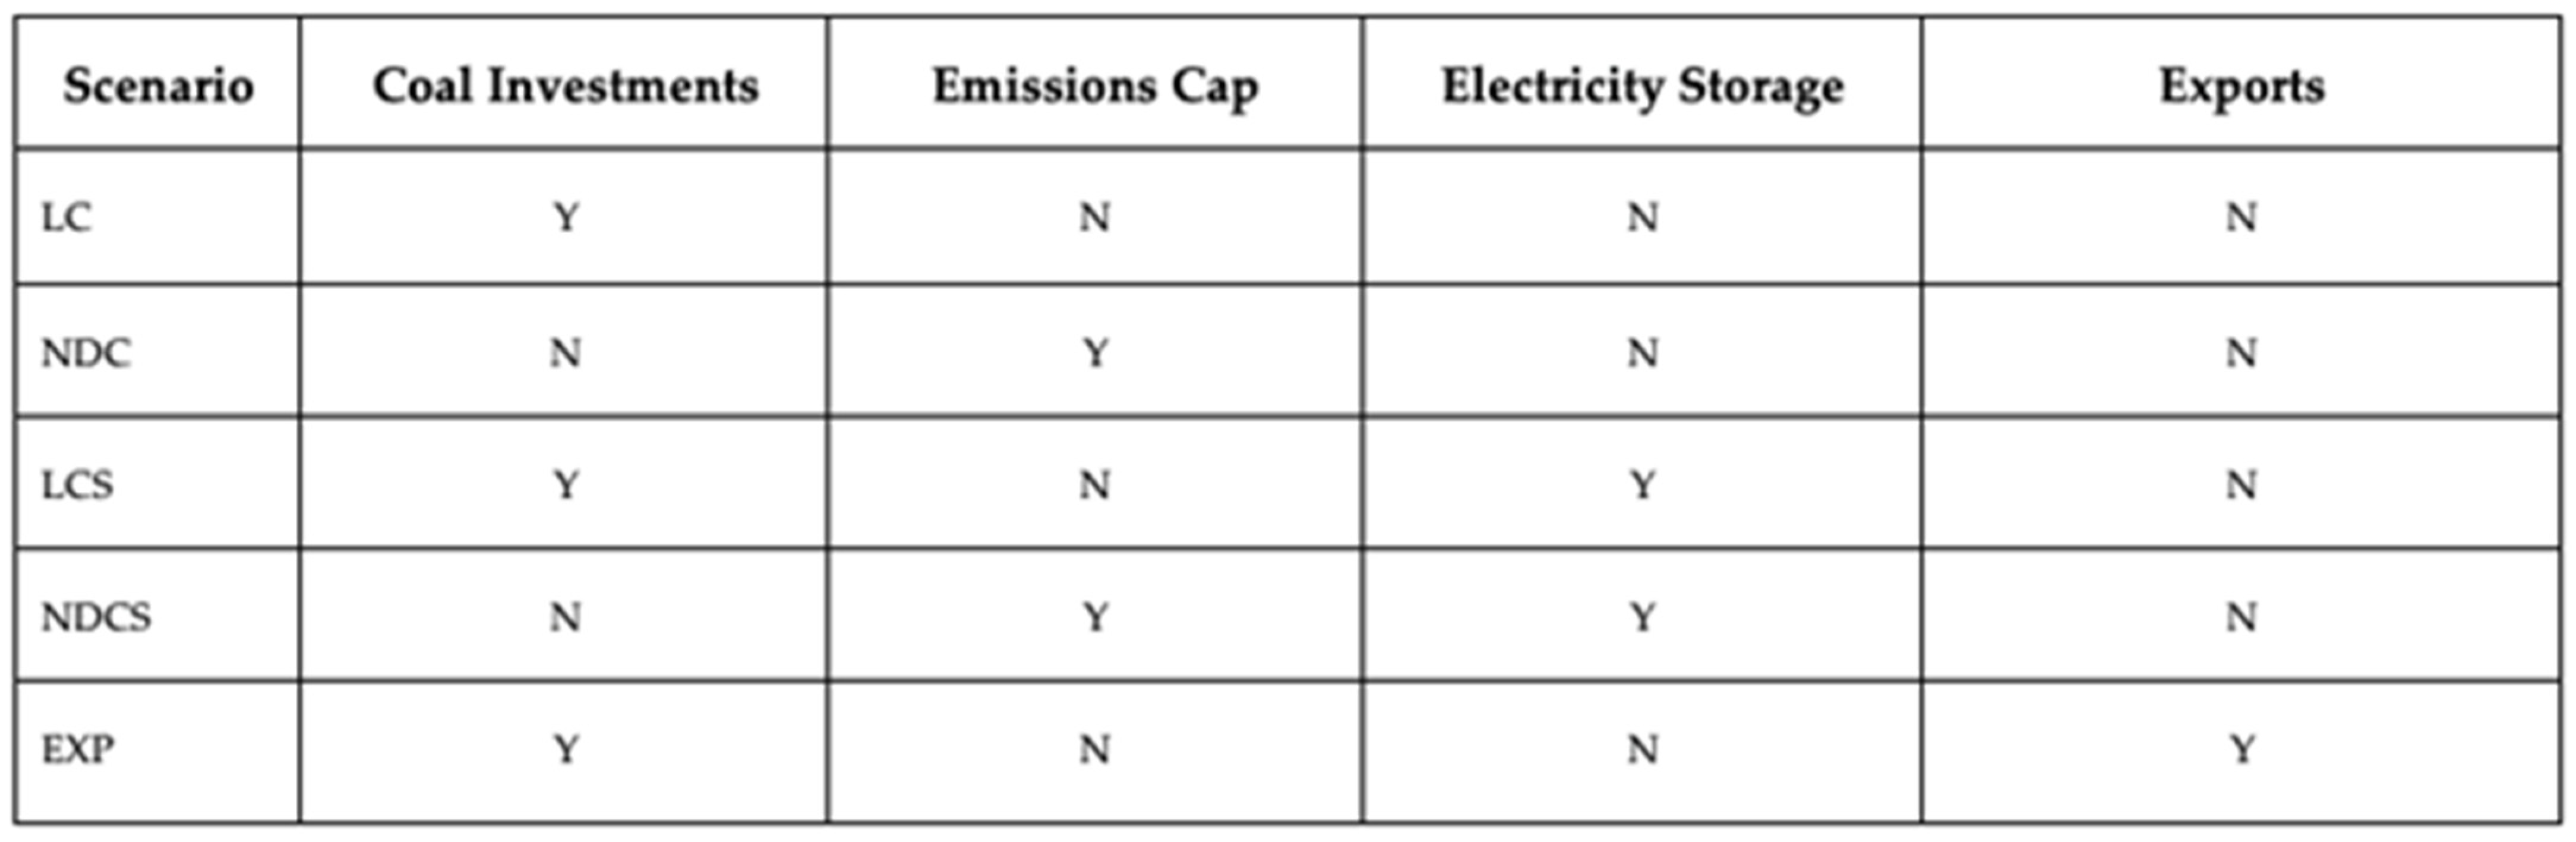
2.4. Description of Scenarios
2.4.1. Base Scenarios
- Least-cost (LC): This least-cost scenario is completely unconstrained.
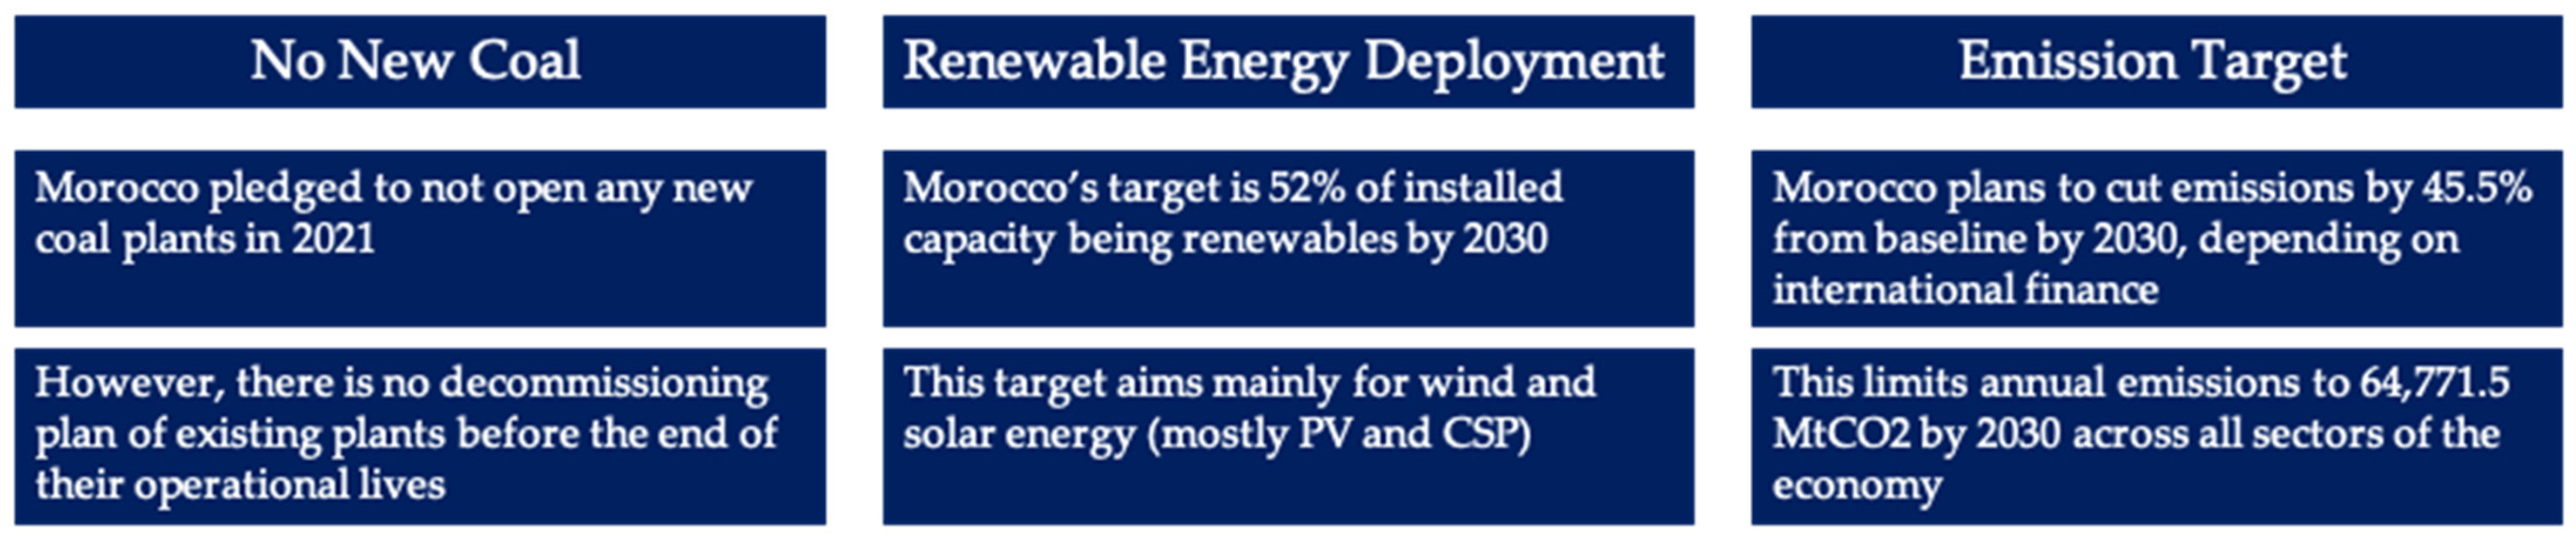
- Nationally Determined Contributions (NDC): The NDC scenario represents Morocco’s climate targets:
- No new coal investments: Max Annual Investments for coal plants is 0, starting in 2021 [48].
- Emission reduction of 45.5% from the baseline scenario by 2030, resulting in 64,771.5 kgCO2 of CO2 annually [22]. However, this value is for all the energy emissions, and this model only focuses on the electricity sector, which represents 22% of total energy emissions in Morocco [13]. The Annual Emissions Limit is therefore set to 14,249 kgCO2 per year, starting in 2030.
2.4.2. Green Hydrogen Scenarios
- Least-Cost with Storage (LCS): Similarly to the LC scenario, the LCS scenario is completely unconstrained. The storage technologies and commodities described previously were added to allow the model to account for RE storage.
- Nationally Determined Contributions with Storage (NDCS): This scenario is constrained in the same ways as the previous NDC scenario and utilizes the storage technologies and commodities detailed in Section 2.3.5.
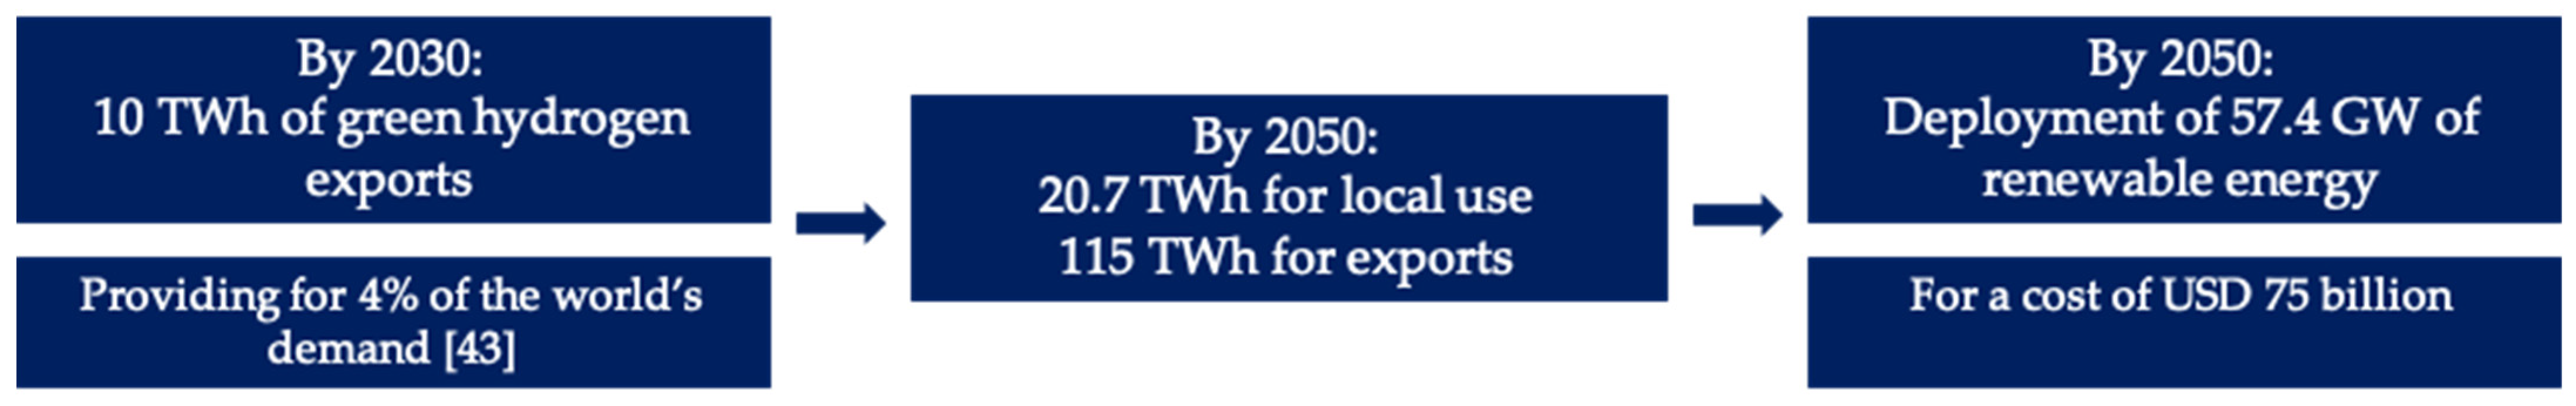
- Exports (EXP): This scenario includes PEM electrolysers and the possibility of exporting GH2. To simulate Morocco’s plan to use hydrogen for exports and to allow for the comparison with the use of GH2 for local electricity storage, this scenario removes batteries and GH2 tanks. Furthermore, for an accurate comparison, the demand in GH2 is set to the same electrolyser production as in the NDCS scenario. This also corresponds to the GHR of exporting 10 TWh of green hydrogen using 6 GW of renewable energy capacity [23].
3. Results and Analysis
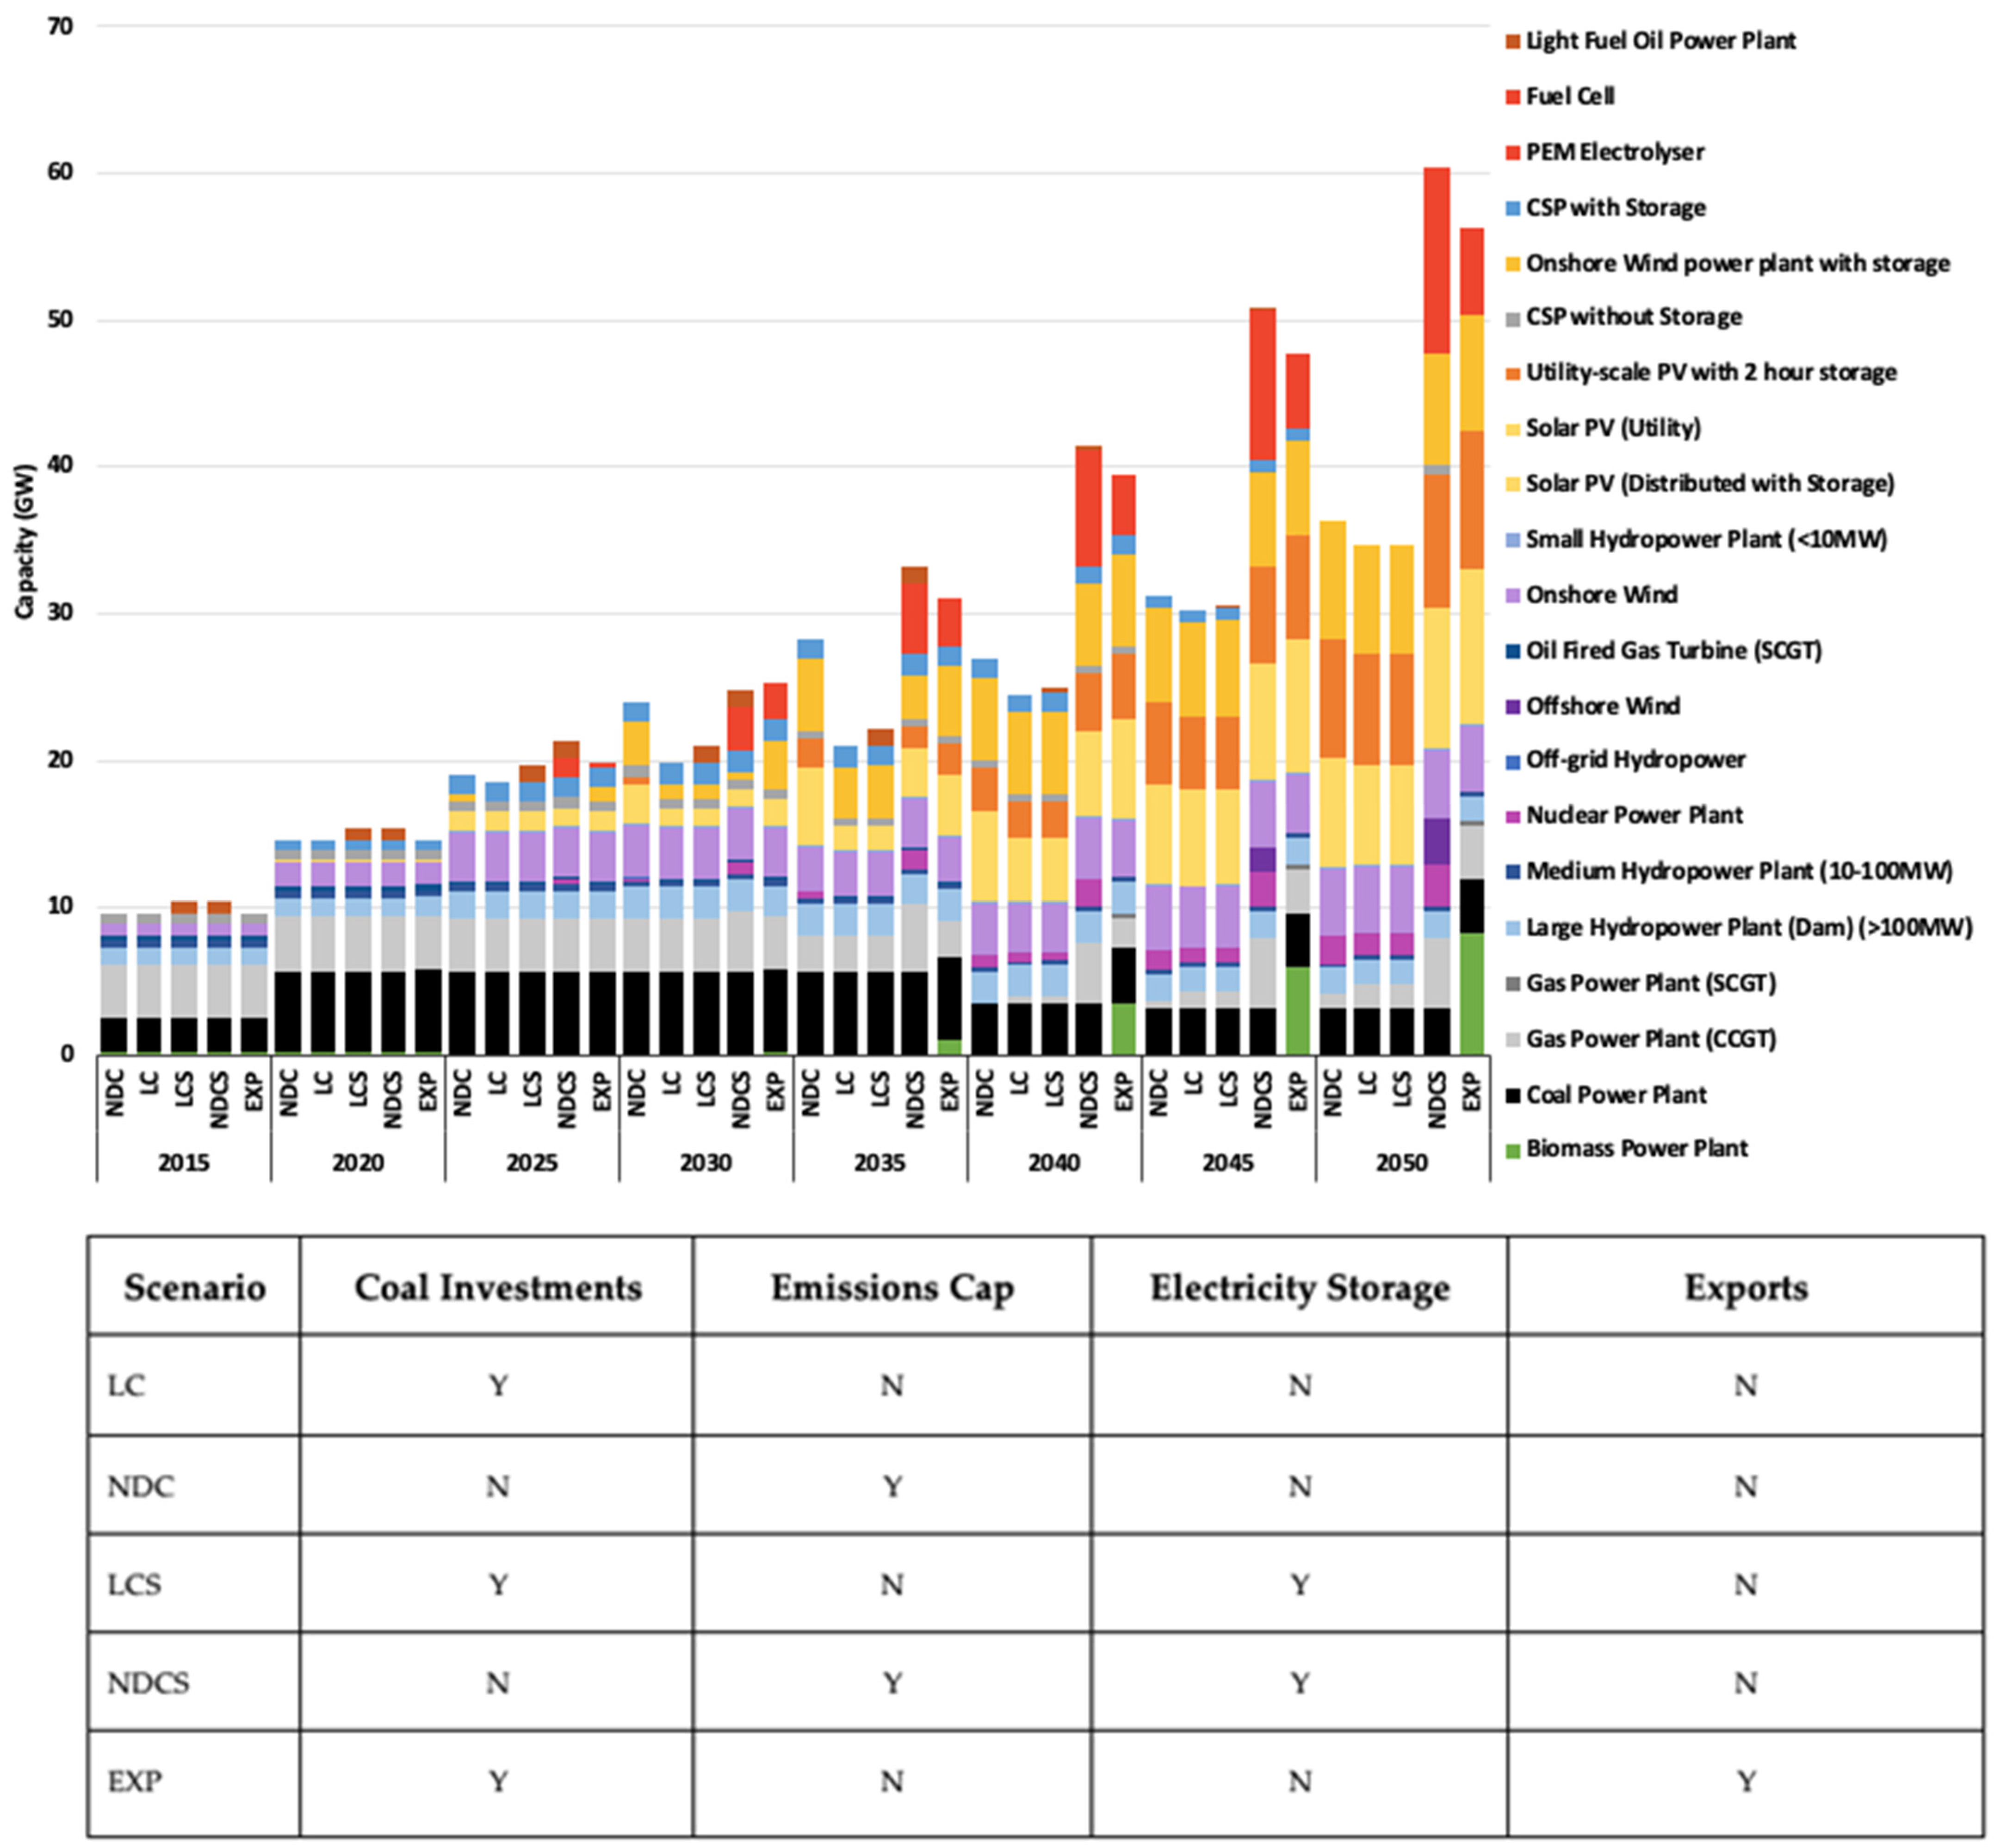
3.1. Electricity Consumption and Installed Capacity
Figure 8 and Figure 9 show the comparison of the annual power generation and installed capacities of the modelled scenarios.

Figure 8.
Comparison of annual power generation for modelled scenarios between 2015 and 2050.
Figure 9.
Comparison of annual installed capacities for modelled scenarios between 2015 and 2050.
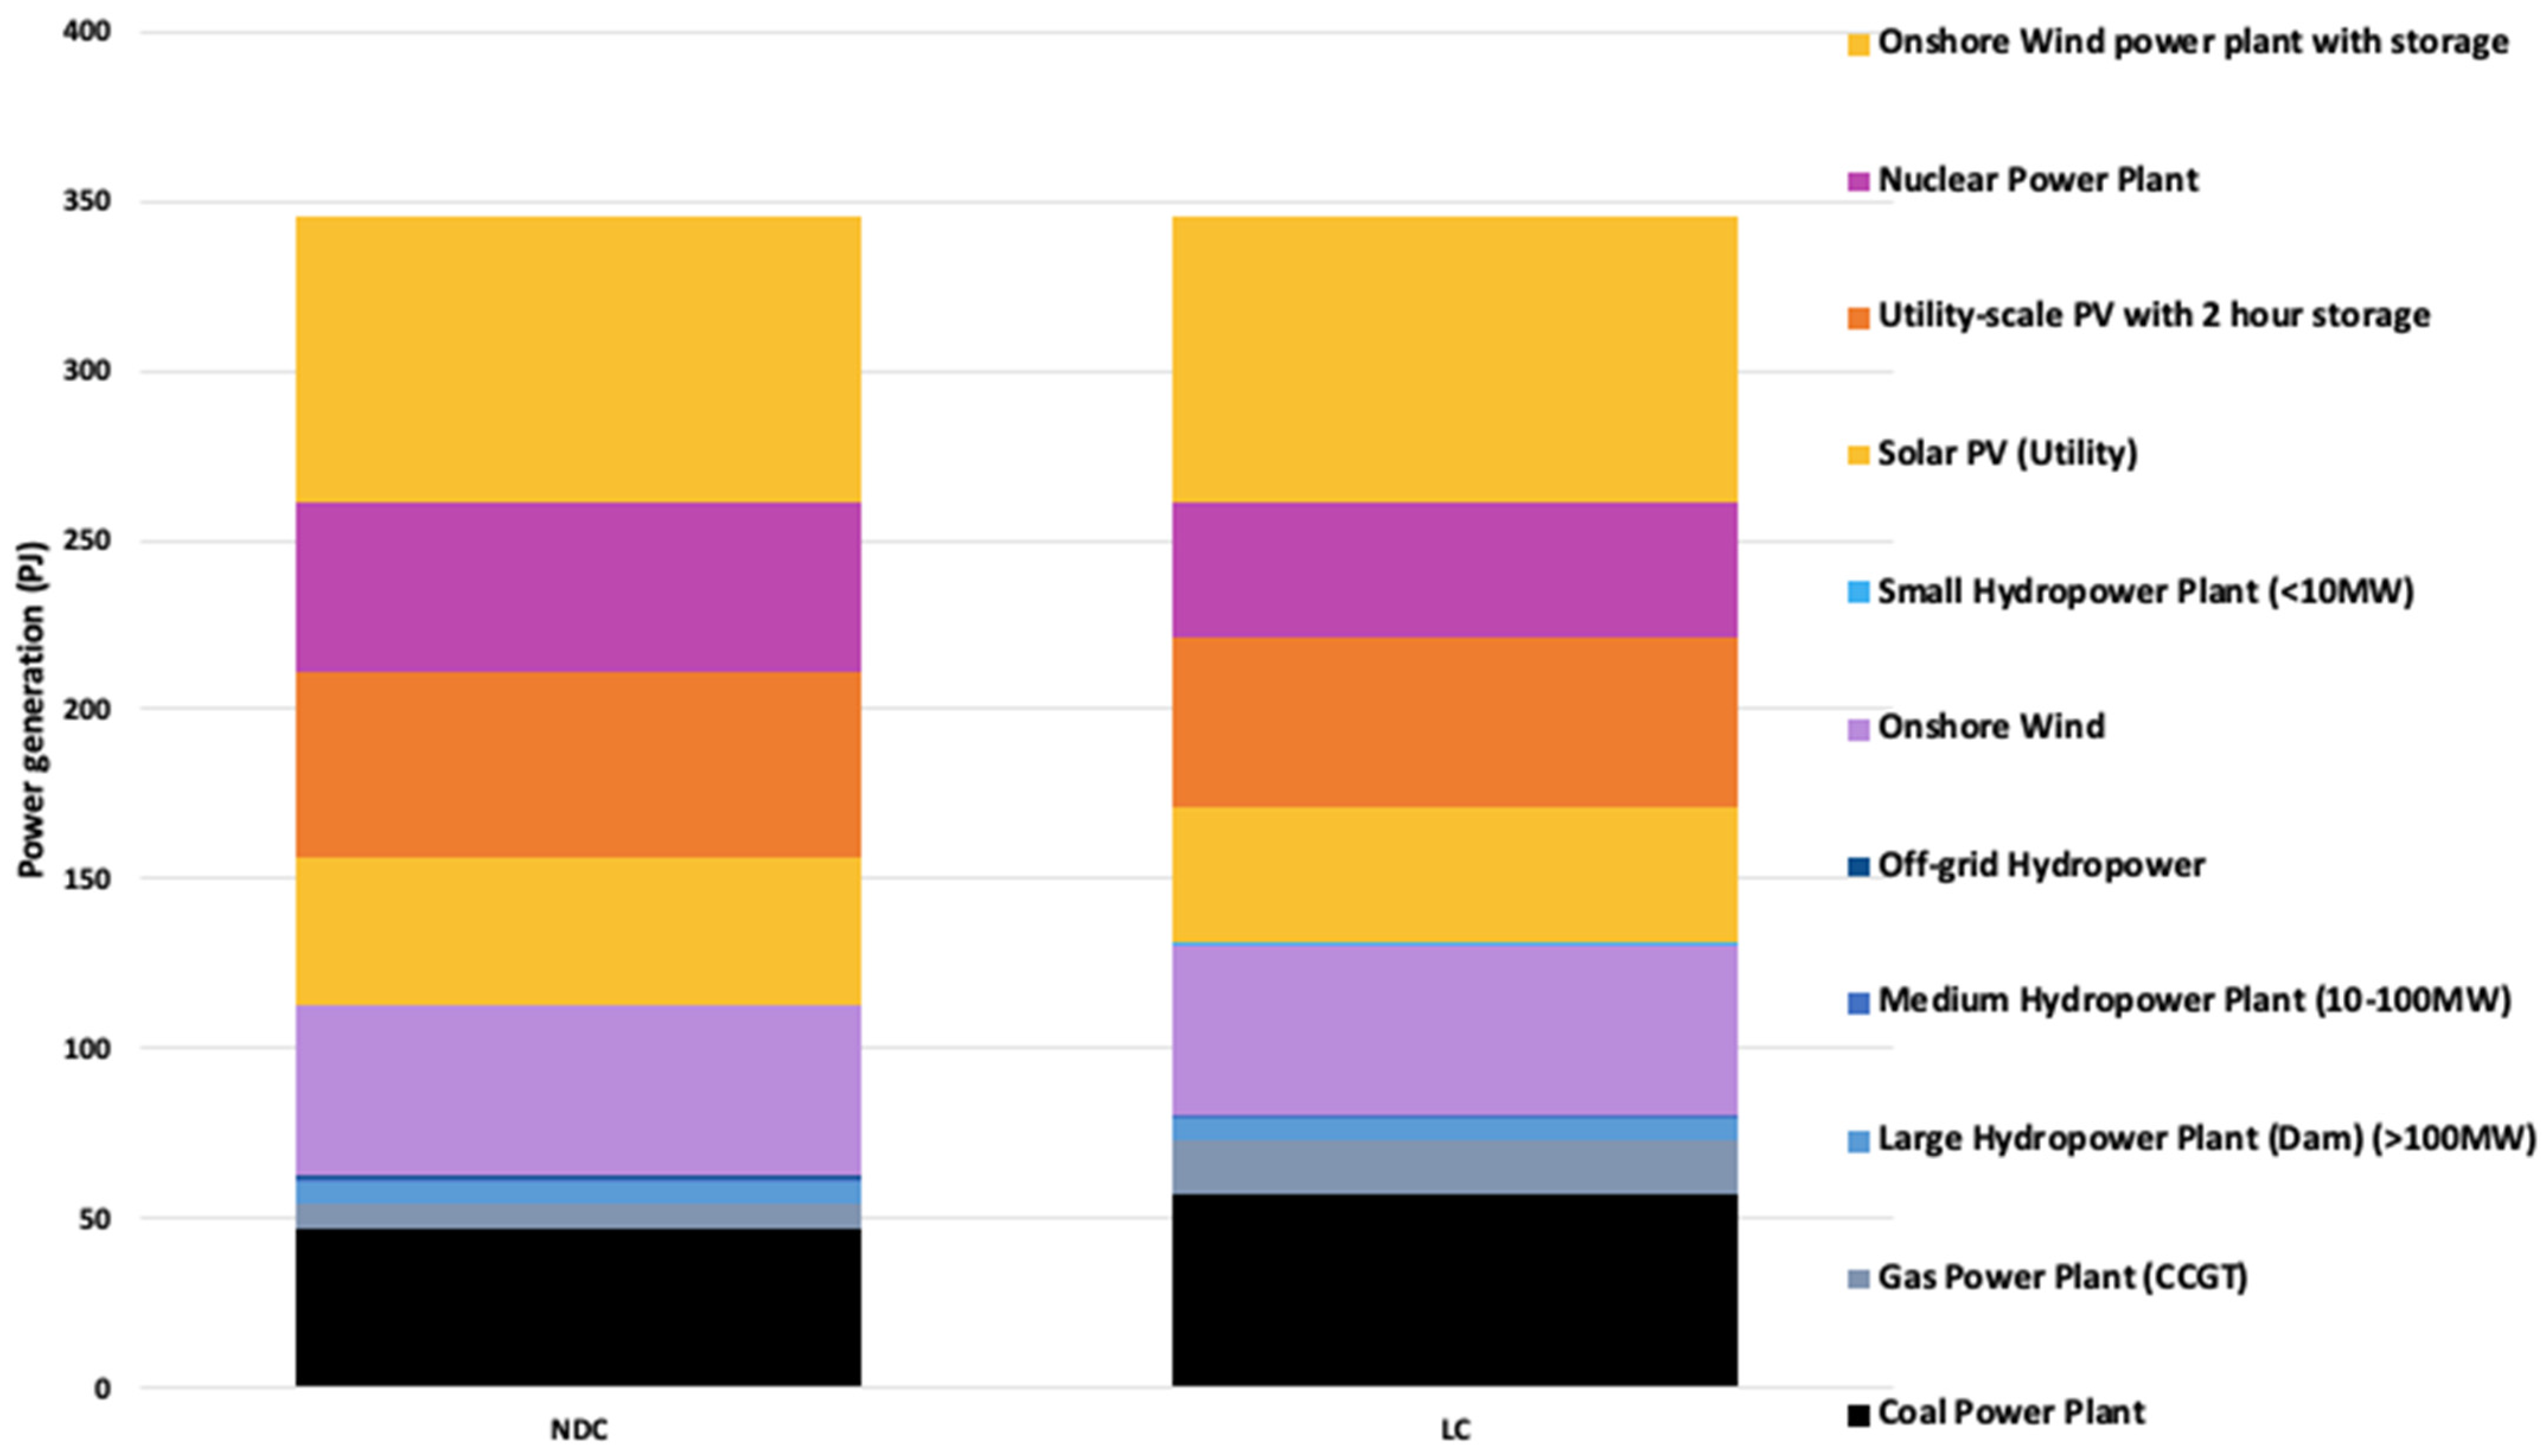
3.1.1. Base Scenario Comparison
Within the NDC scenario, a notable shift occurs in the baseload power generation when compared to the LC: coal is partially supplanted by natural gas (Figure 8). This transition acts as an interim measure during the proliferation of wind and solar energy, and it is influenced by the comparatively lower emission profile of natural gas with coal: 56.1 versus 94.6 kton/PJ. Figure 10 illustrates the power generation mixes for the LC and NDC scenarios in 2050 and shows that natural gas and coal generations both decrease and are replaced by solar energy. This amplification is enabled by solar PV being deployed ahead of their scheduled introduction in the LC scenario (Figure 8). The expeditious implementation is informed by three factors: the requirement to supplant coal-derived electricity, the progressive reduction in solar PV costs, and the abundance of concurrent solar initiatives in Morocco.
Figure 10.
Power generation mix comparison of LC and NDC scenario in 2050.
Furthermore, the NDC scenario presents a superior total installed capacity—approximately 2 to 5 GW more than the LC scenario (Figure 9) because of the inferior capacity factors associated with wind and solar energy, necessitating compensatory measures to accommodate the enhanced electrification.
However, overall, a striking resemblance is observed in the generation mixes of the LC and NDC scenarios for the year 2050. This convergence offers promising indications for Morocco’s progression towards fulfilling its NDC objectives. The LC scenario illustrates that 52% of total installed capacity comes from RE, therefore reaching this NDC goal in 2030. In 2050, 68% of the total power generation is projected to emanate from RESs in the LC (Figure 10).
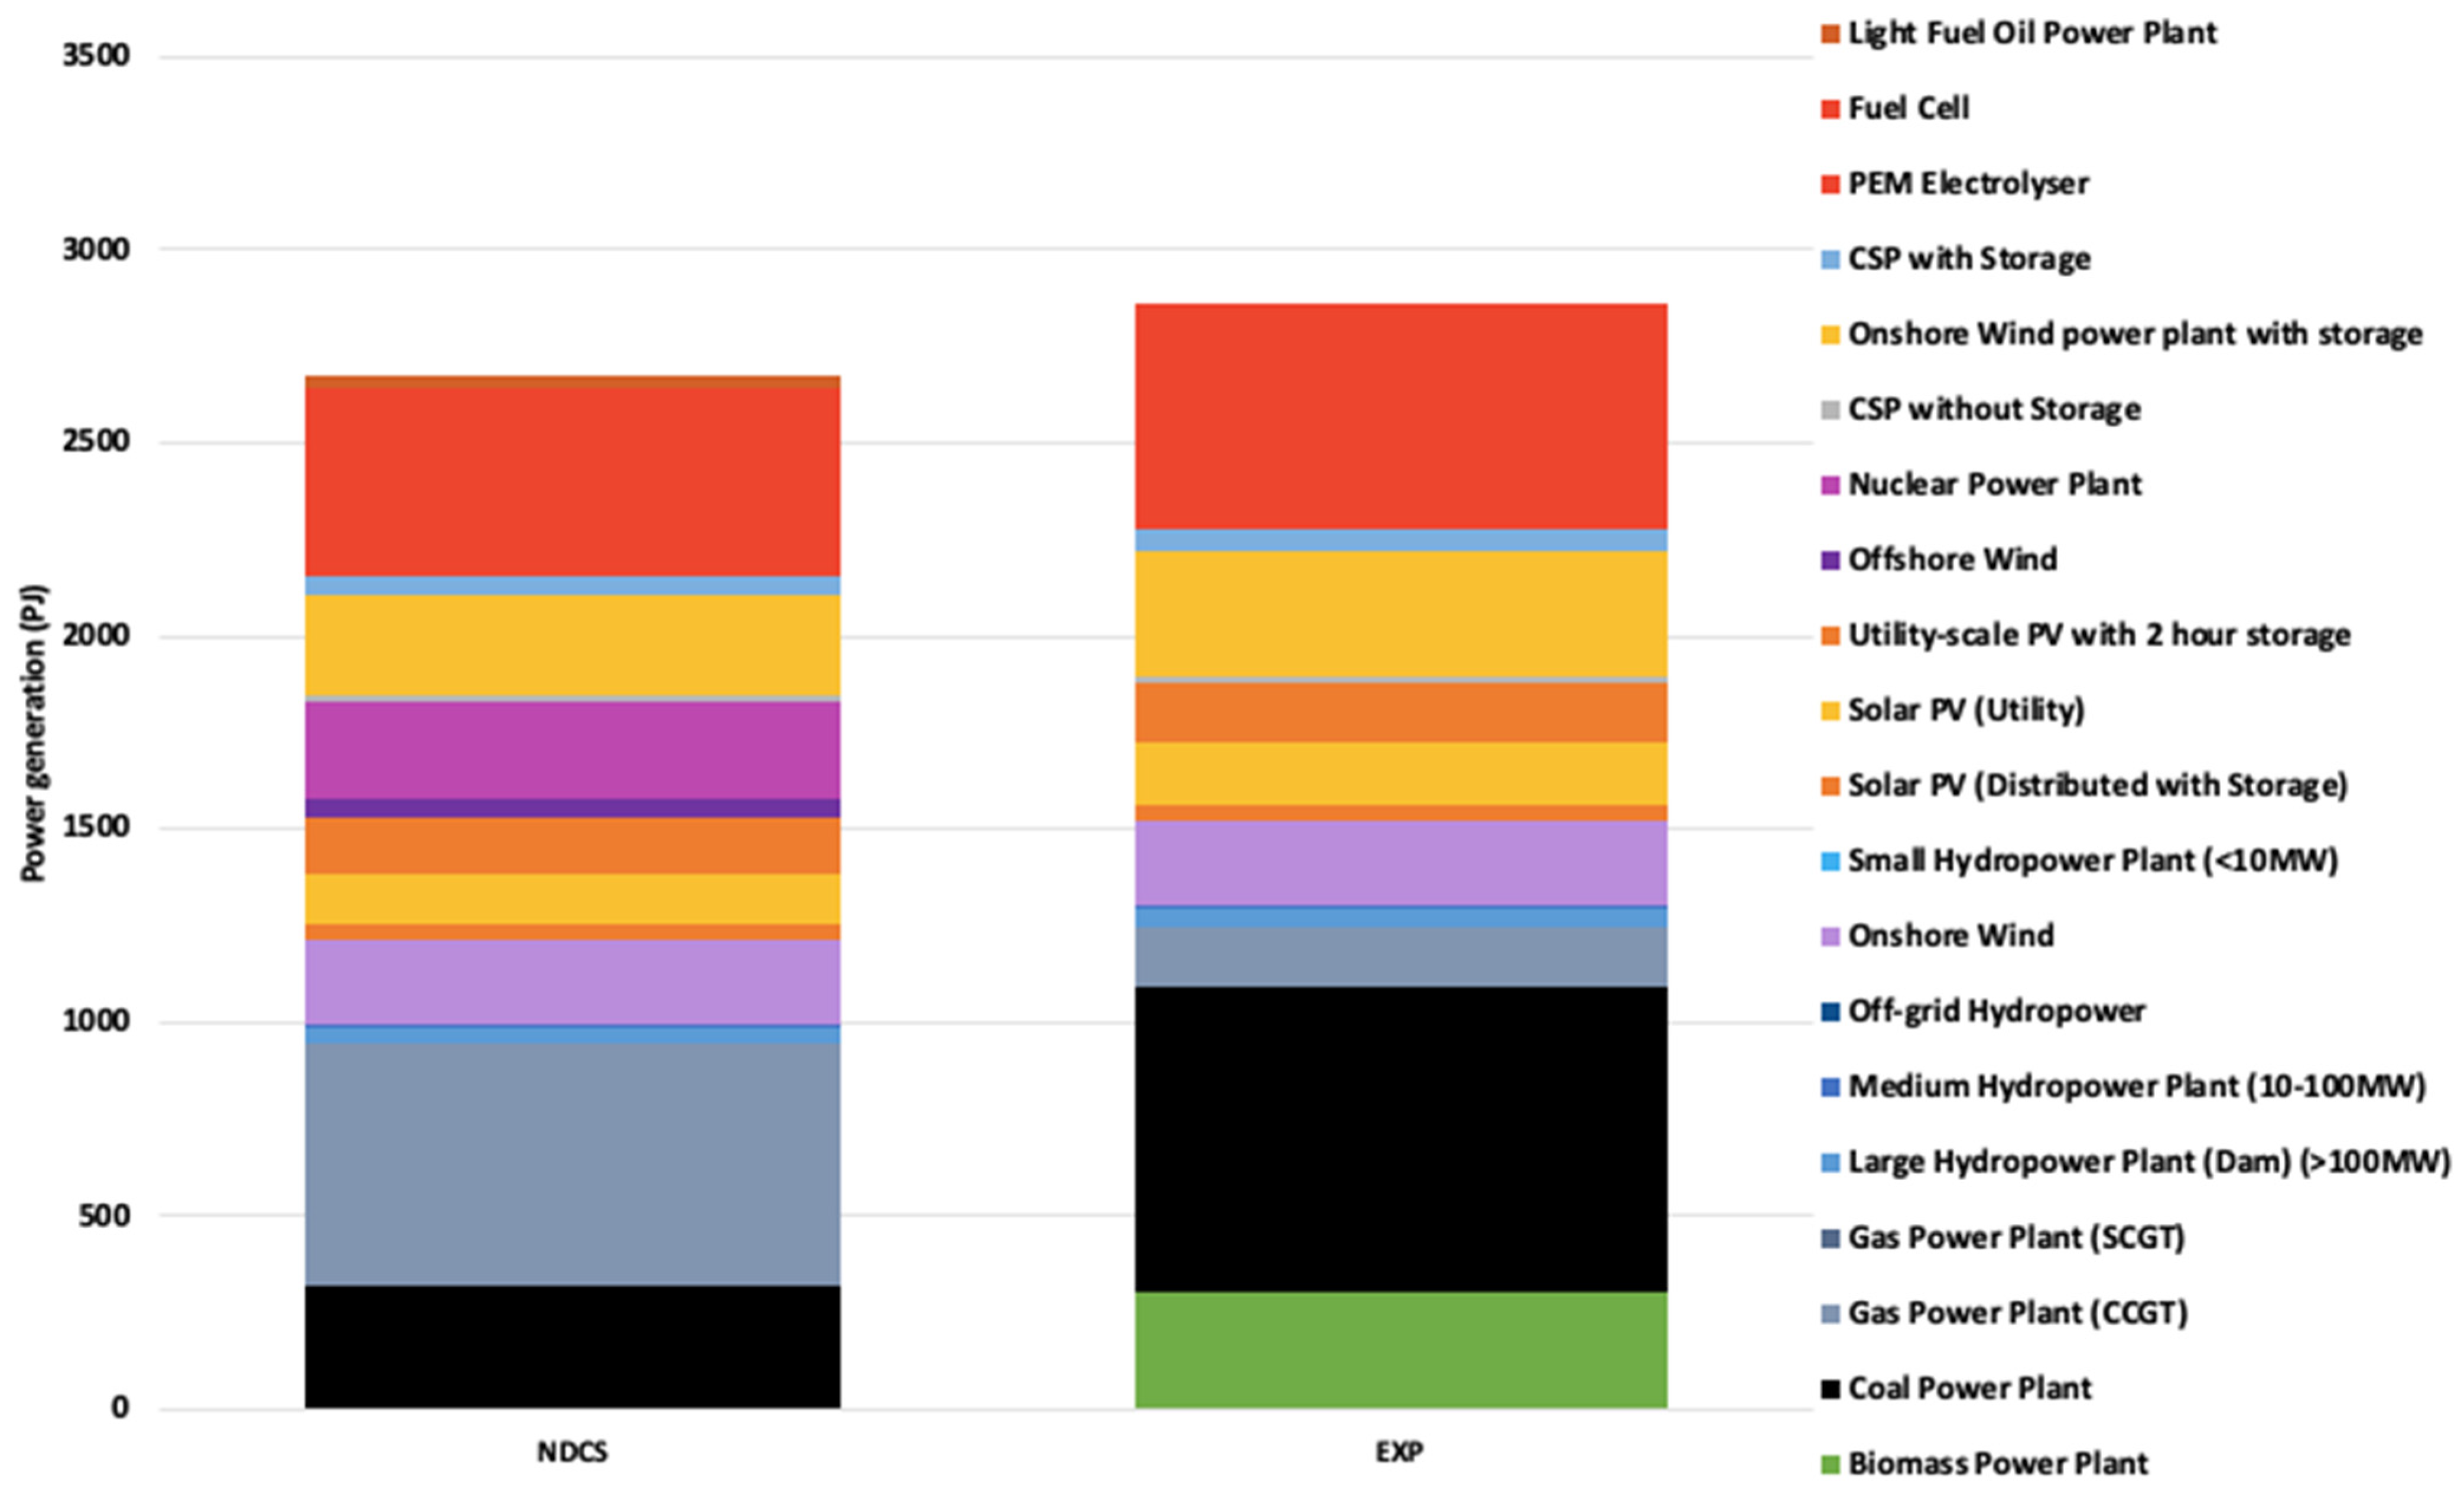
3.1.2. Green Hydrogen Scenarios Sensitivity Analysis
The LC and LCS scenarios show the same installed capacity and power generation mixes, showing that using electricity storage is not considered a cost-minimising solution in this OSeMOSYS scenario.
High power generation is seen in the NDCS and EXP scenarios, as the former stores 150 PJ of green electricity in GH2 tanks (Figure 11), and the latter exports it. The preference for GH2 storage over BESS is attributable to the longer operational lifespans of electrolysers and fuel cells vis à vis batteries. Interestingly, the analysis discerns no selected hybrid configurations integrating both storage systems, probably to reduce grid management budgets.
Figure 11.
Power generation mix comparison of NDCS and EXP scenario in 2050.
In the NDCS scenario, the natural gas generation grows to 122 PJ by 2050 compared to 10 PJ in the NDC (Figure 8). Nuclear energy is chosen for the local baseload electricity generation source, as well as 2 GW of offshore wind by 2050 that can be stored in GH2 tanks and allows the country to reduce emissions. Onshore wind persists as a consistently prioritised option across all scenarios, because of its cost-efficiency compared to offshore wind. This sensitivity analysis thus shows that green hydrogen storage can assist Morocco in eliminating its reliance on environmentally detrimental coal, as it is not chosen in this scenario.
The EXP scenario prioritises cheap biomass and coal for domestic consumption because of the lack of emission constraints, while predominantly reserving renewable electricity for GH2 production for exportation. Moreover, the integration of biomass as a preferred source emanates from the pre-existing flexibility limitations imposed on VREs, as the model exclusively uses renewable energy sources (including biomass) for hydrogen production.
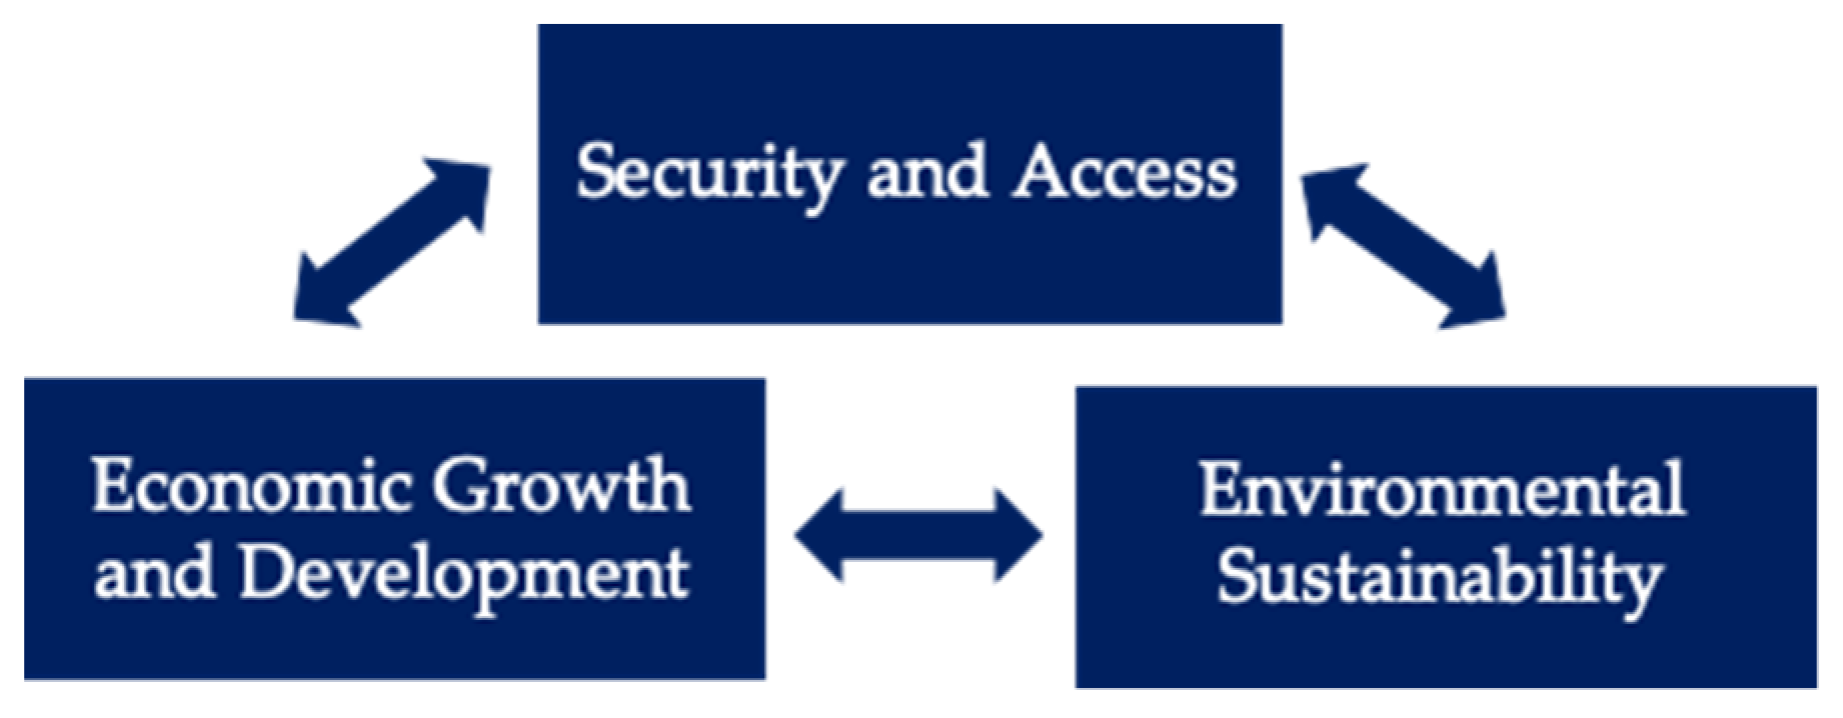
3.2. Analysis with Respect to the Energy Trilemma
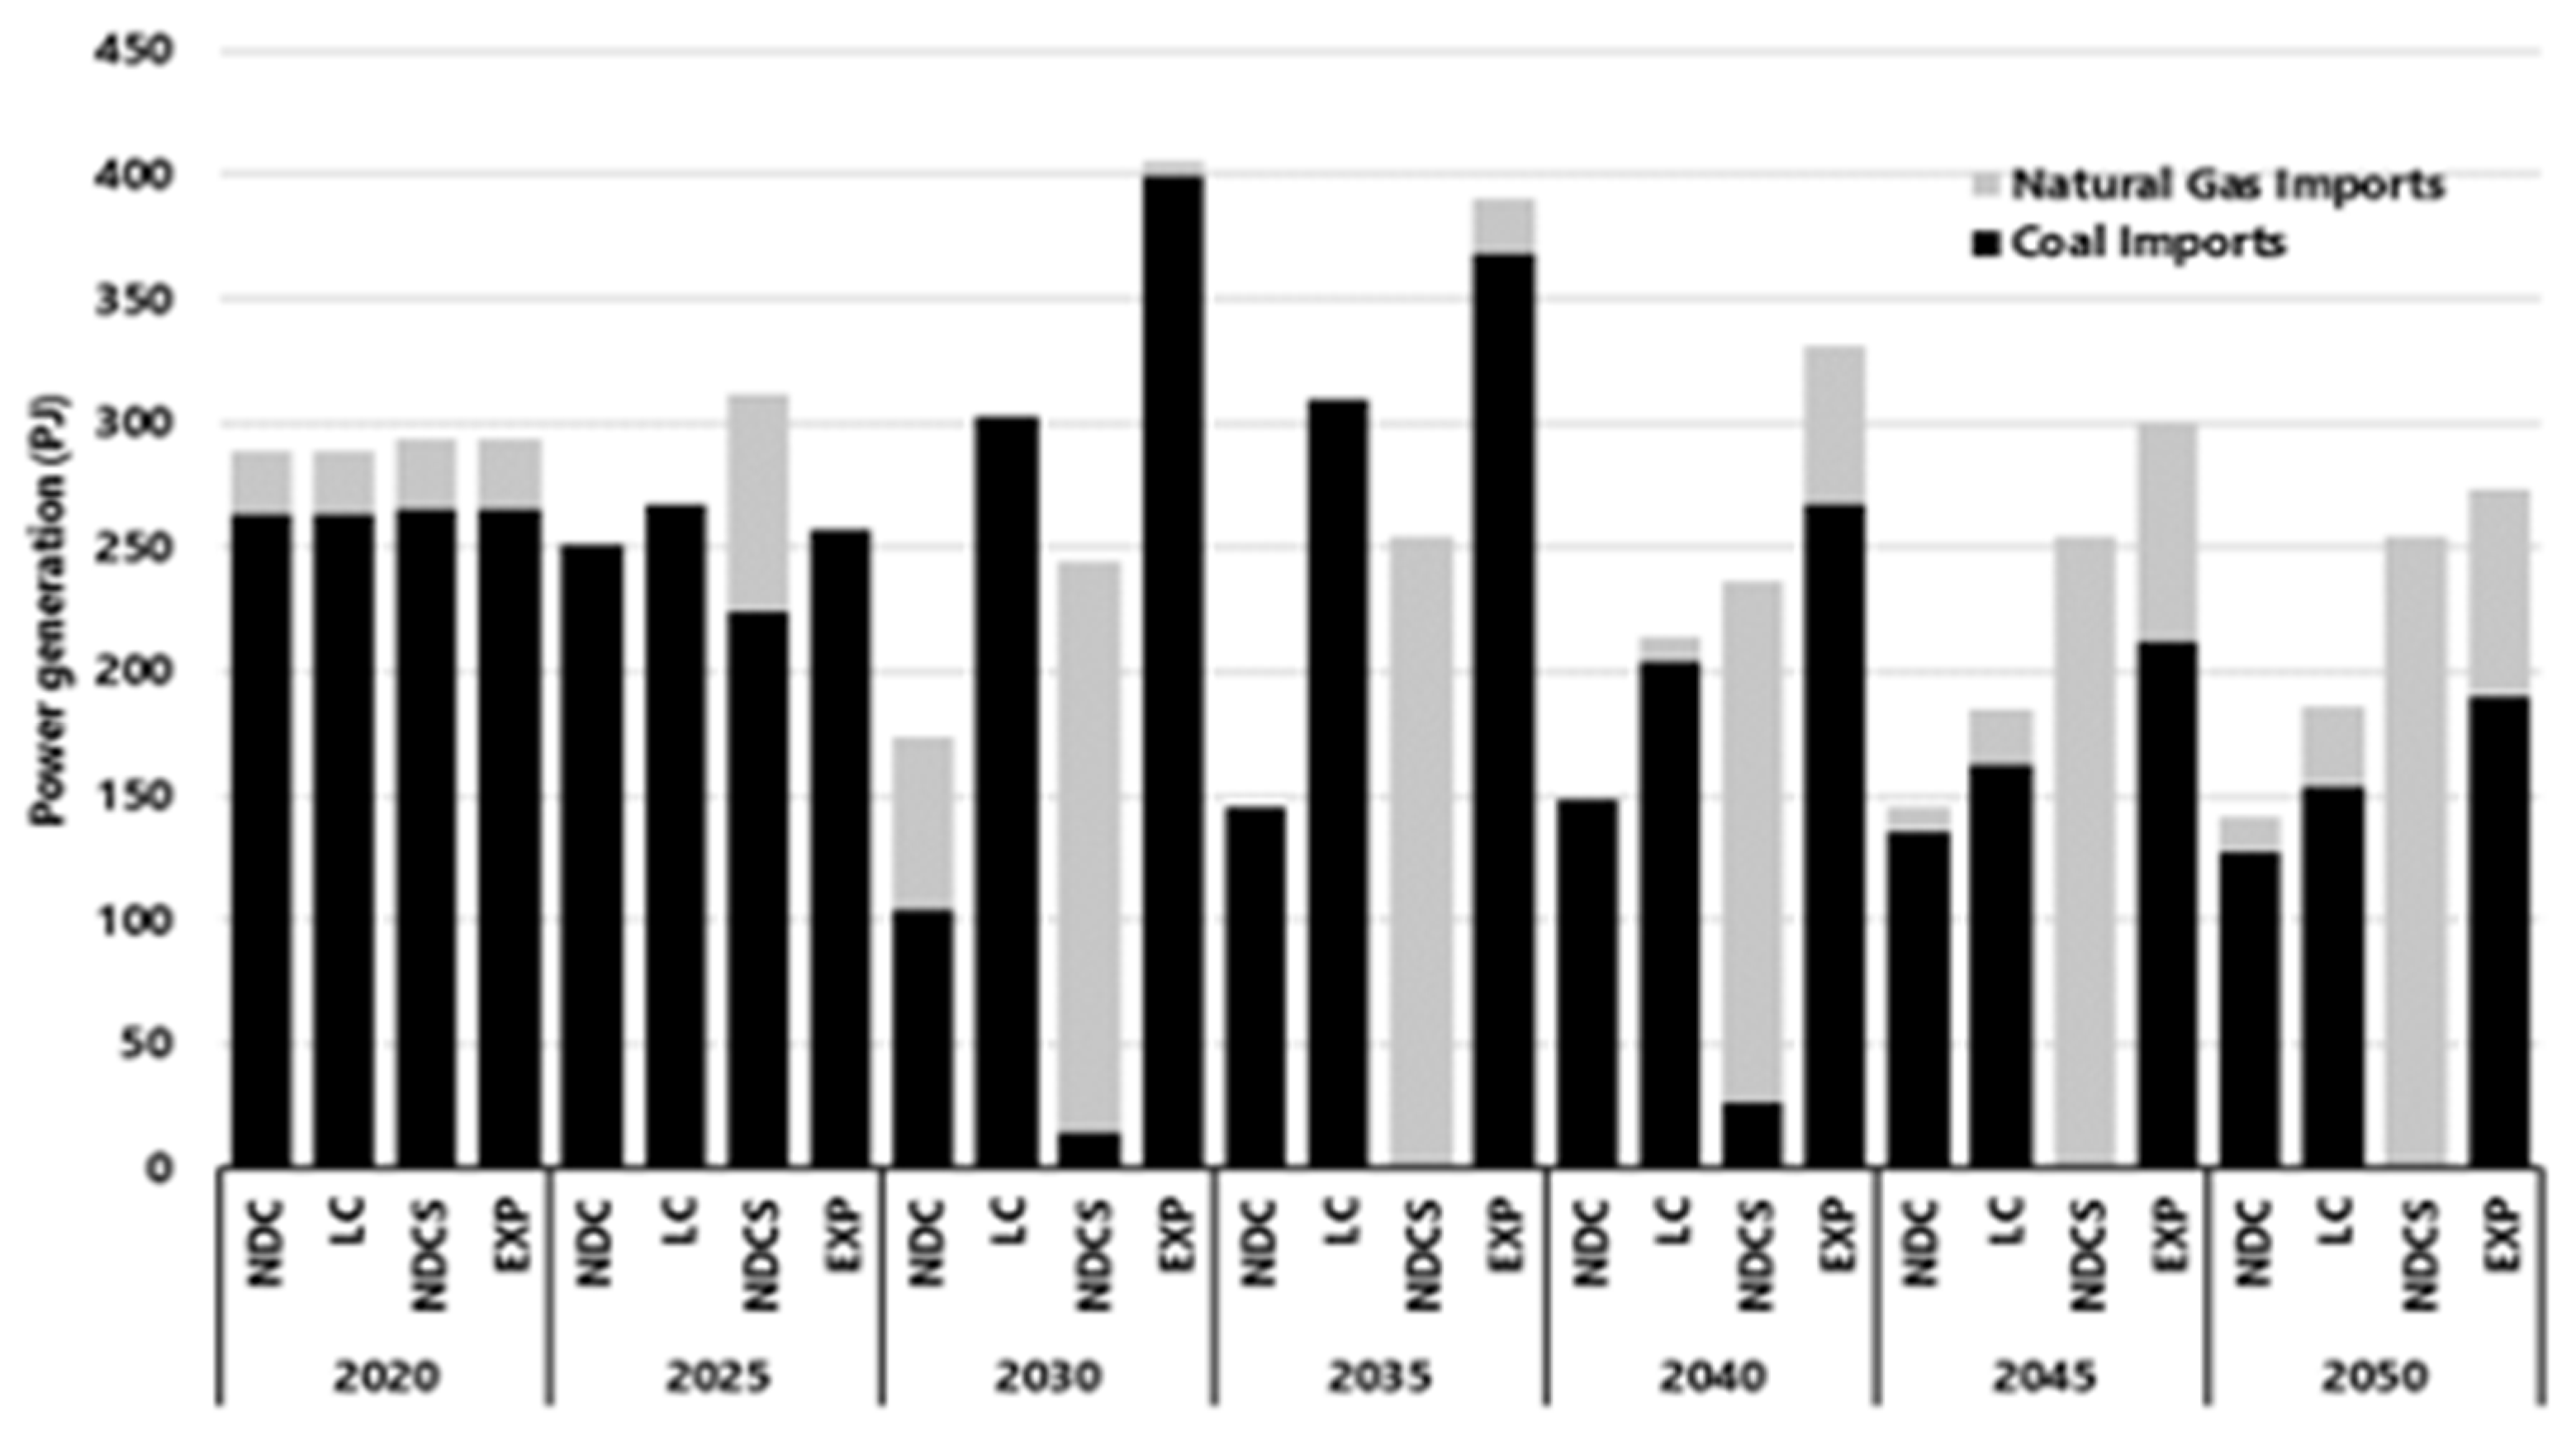
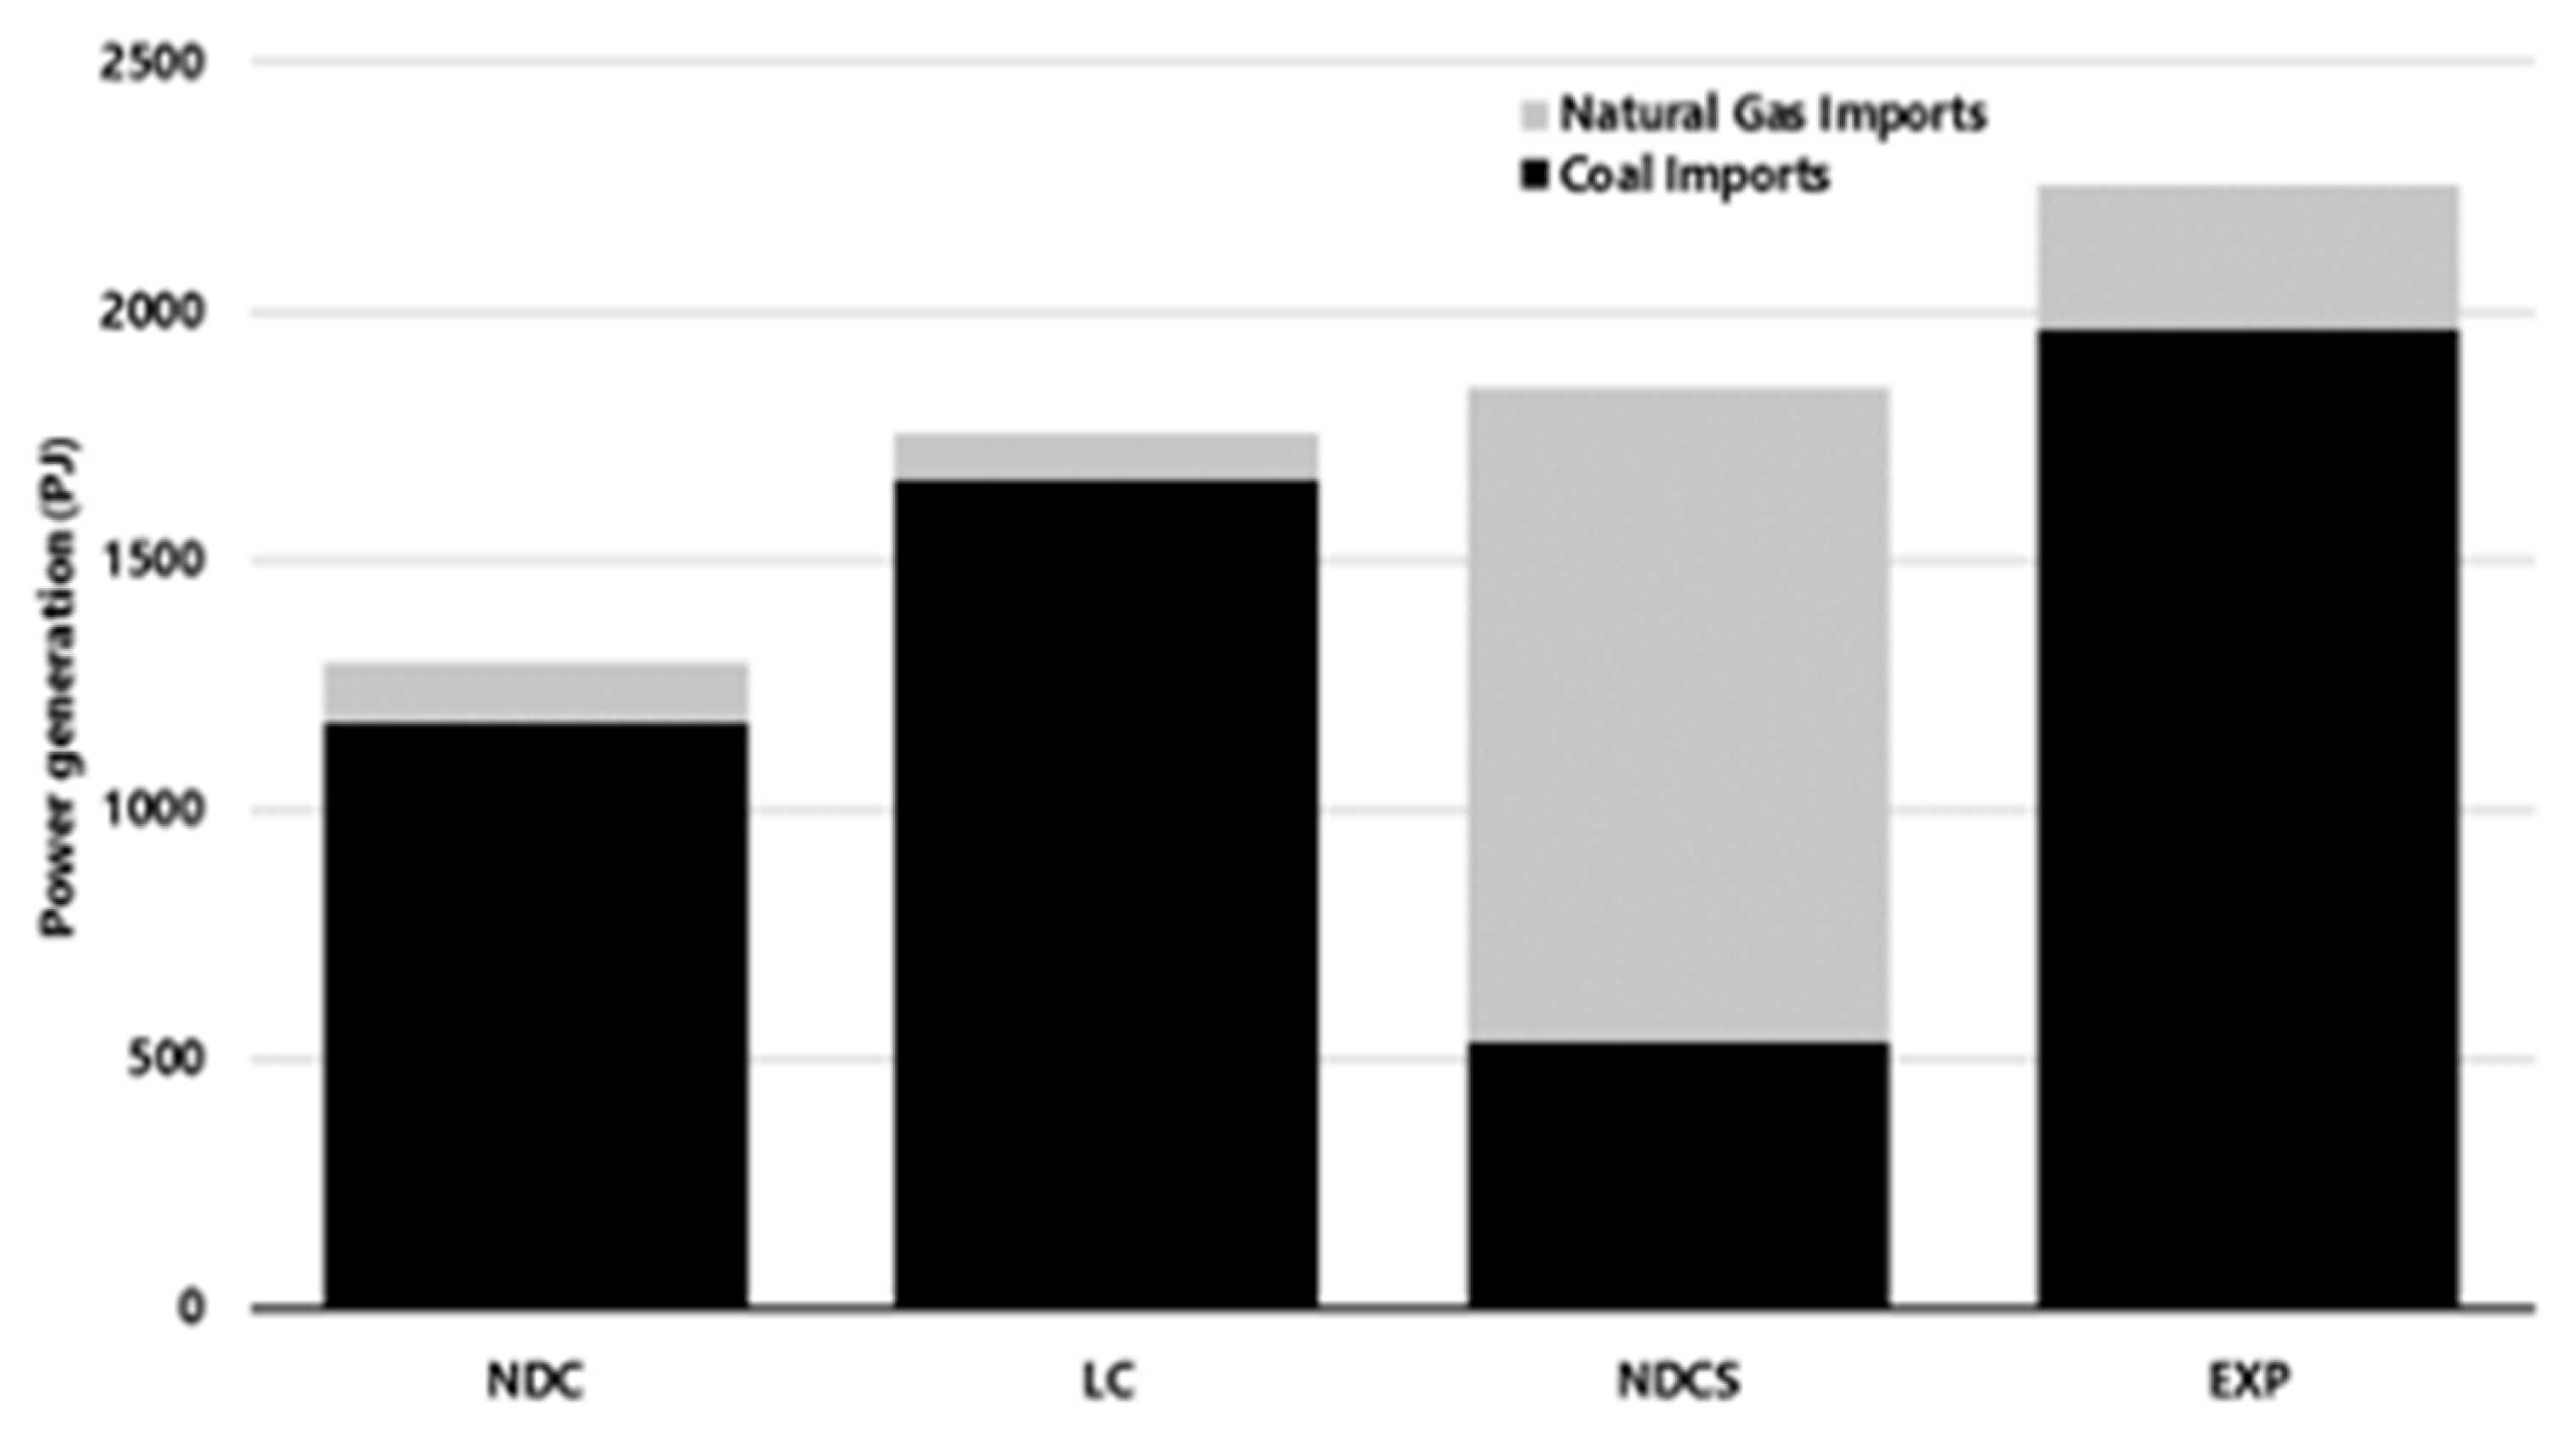
3.2.1. Energy Security: Import and Exports
The EXP scenario projects the exports of 10 TWh equivalent of GH2 by 2030, aligning with the GHR, but only 30 TWh by 2050 (Figure 12), facilitated by an electrolyser capacity of 5.9 GW (Figure 9). This is different from the GHR 115 TWh’s goal, and this change was made to allow for a better comparison with the NDCS scenario. The method for calculation of the export values can be found in Appendix A.3.
Figure 12.
Annual green hydrogen exports in the EXP scenario between 2024 and 2050. These estimations use an electrolyser efficiency of 60% [47].
In the EXP scenario, a prominent increase in exports, especially coal, is observed (Figure 13 and Figure 14) and is a consequence of the high costs associated with PEM electrolysers, which pushes the model to choose cheaper imported fossil fuels for local use for cost minimisation. In the NDCS scenario, a strategic preference for natural gas over coal is shown, aligning with the emission reduction goal, and this preference increases during the electrolyser build-out. The highest imported fuel demand is shown in the EXP scenario (with 2251 PJ), and the lowest is in the NDC scenario (with 6373 PJ). Please note that the LCS scenario is not shown, as it presents the same results as the LC.
Figure 13.
Annual imported fuels for modelled scenarios between 2020 and 2050.
Figure 14.
Accumulated imported fuels for modelled scenarios between 2020 and 2050.
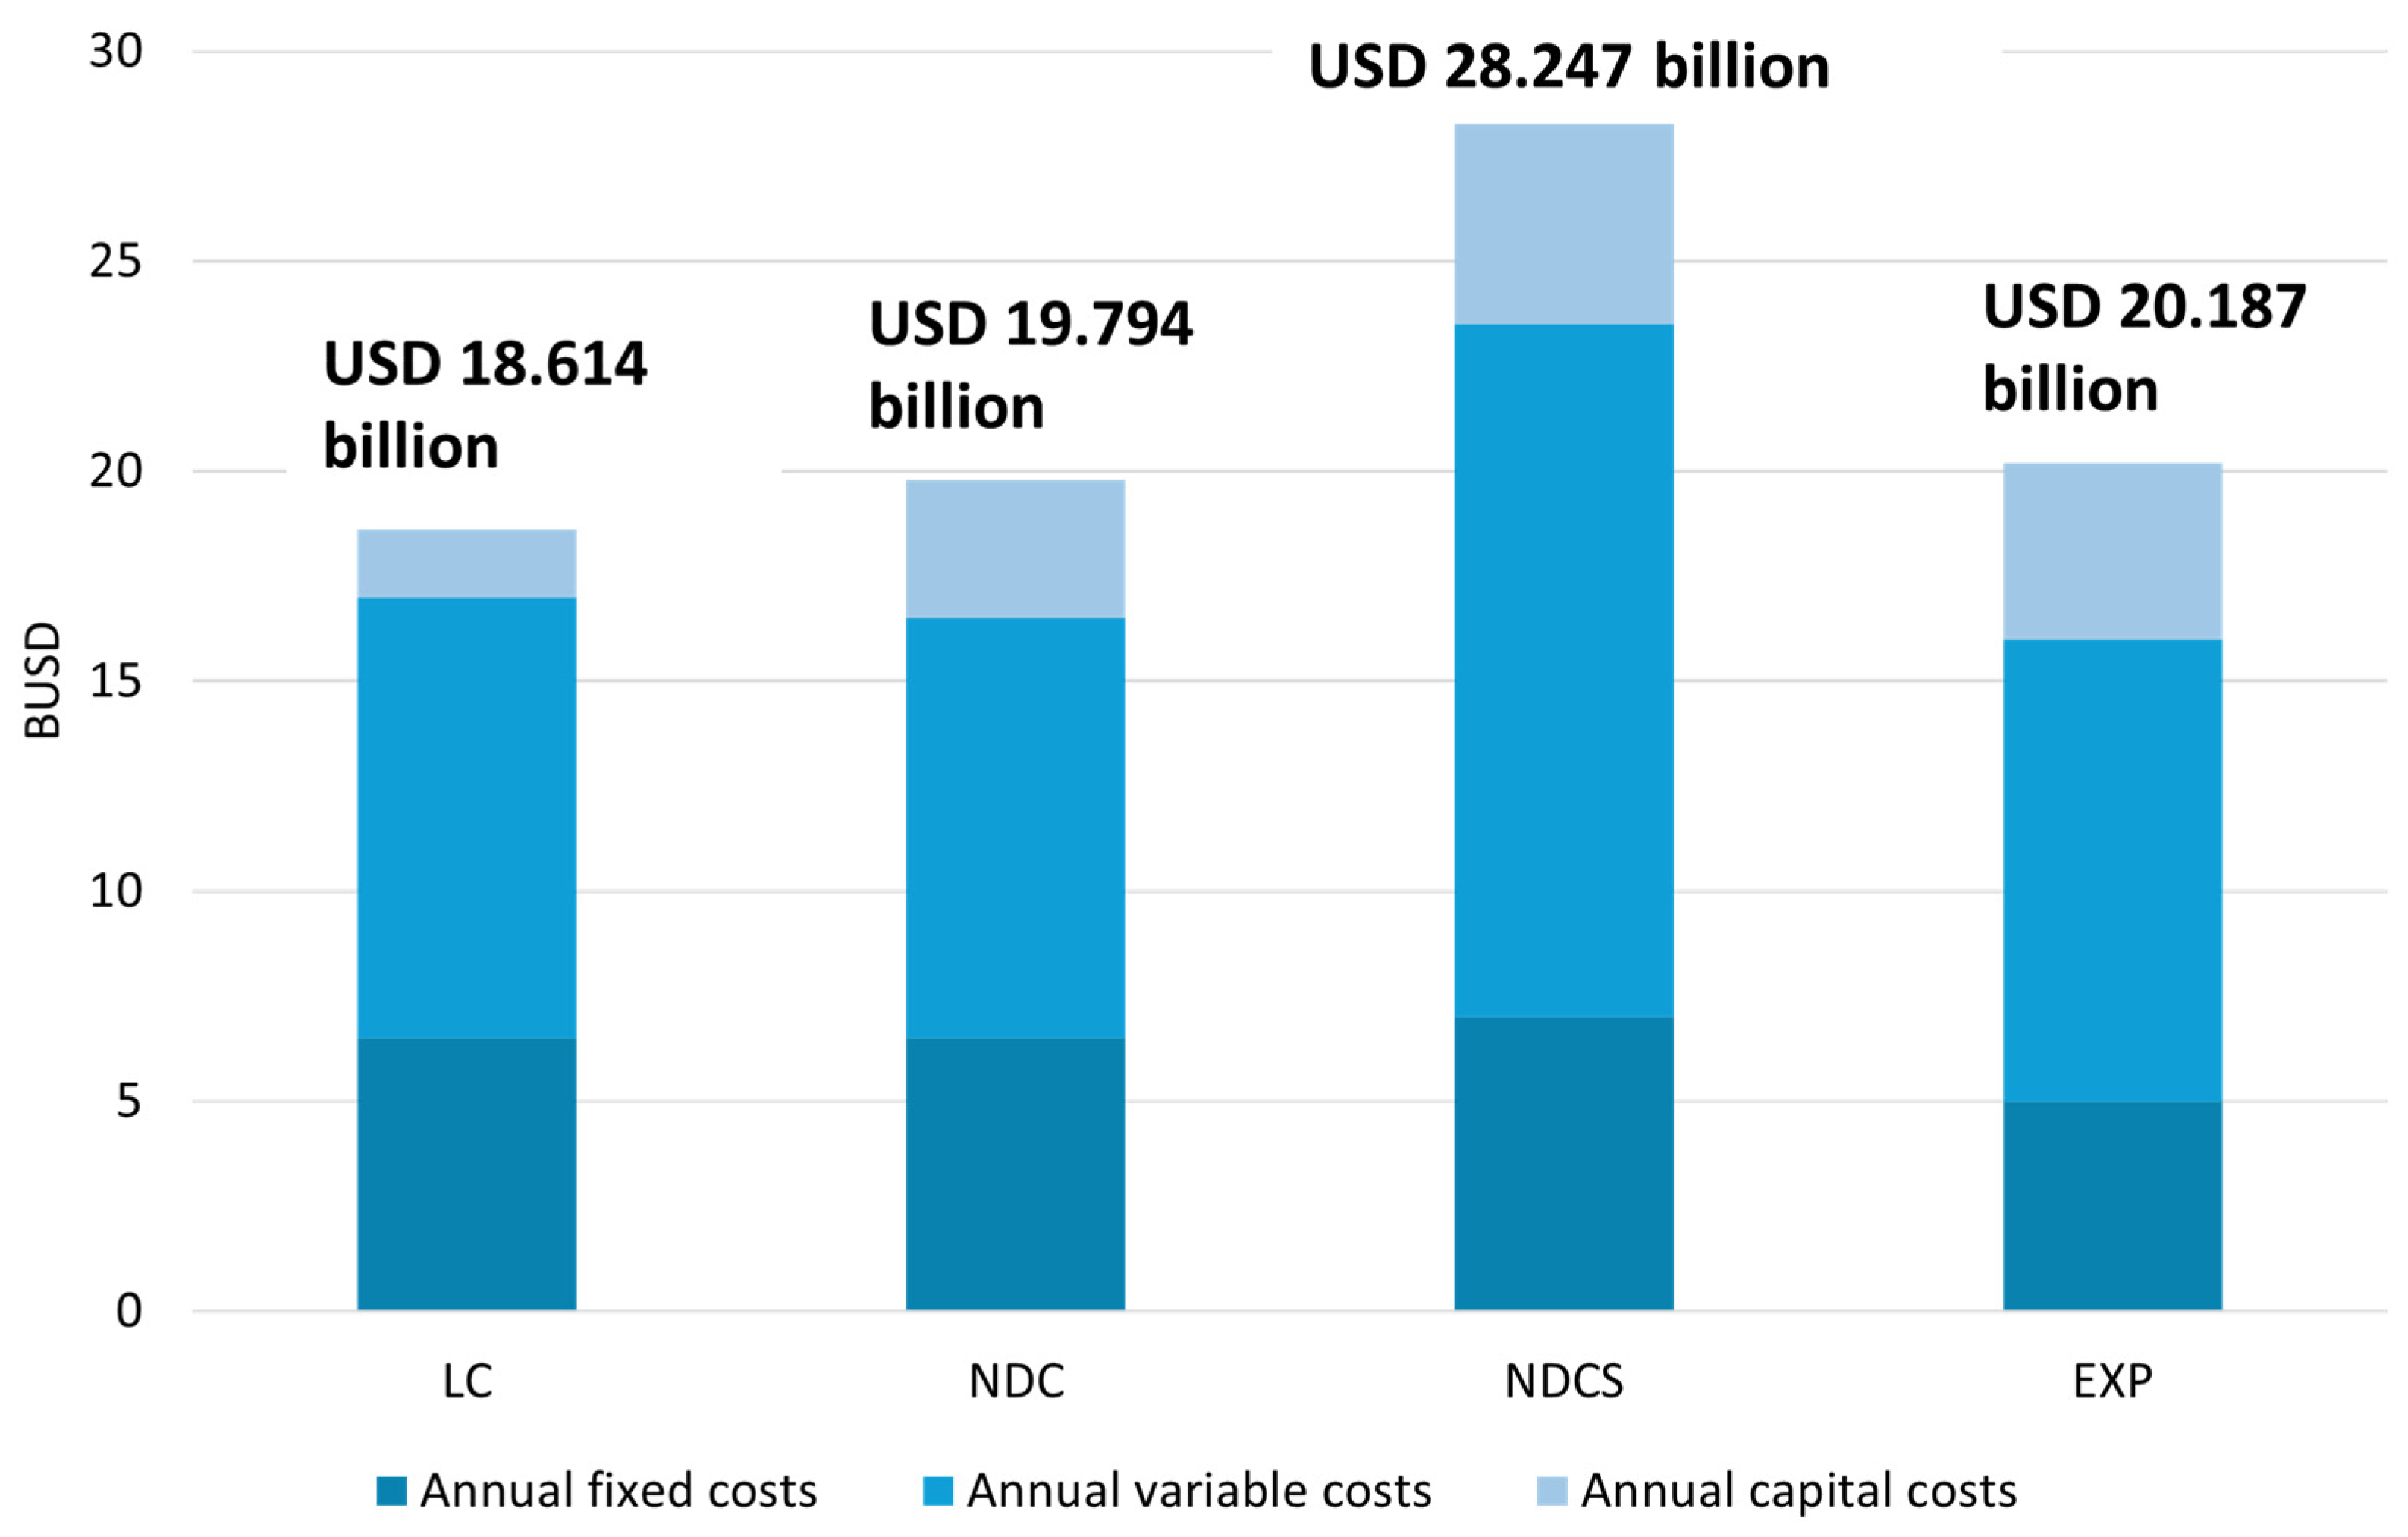
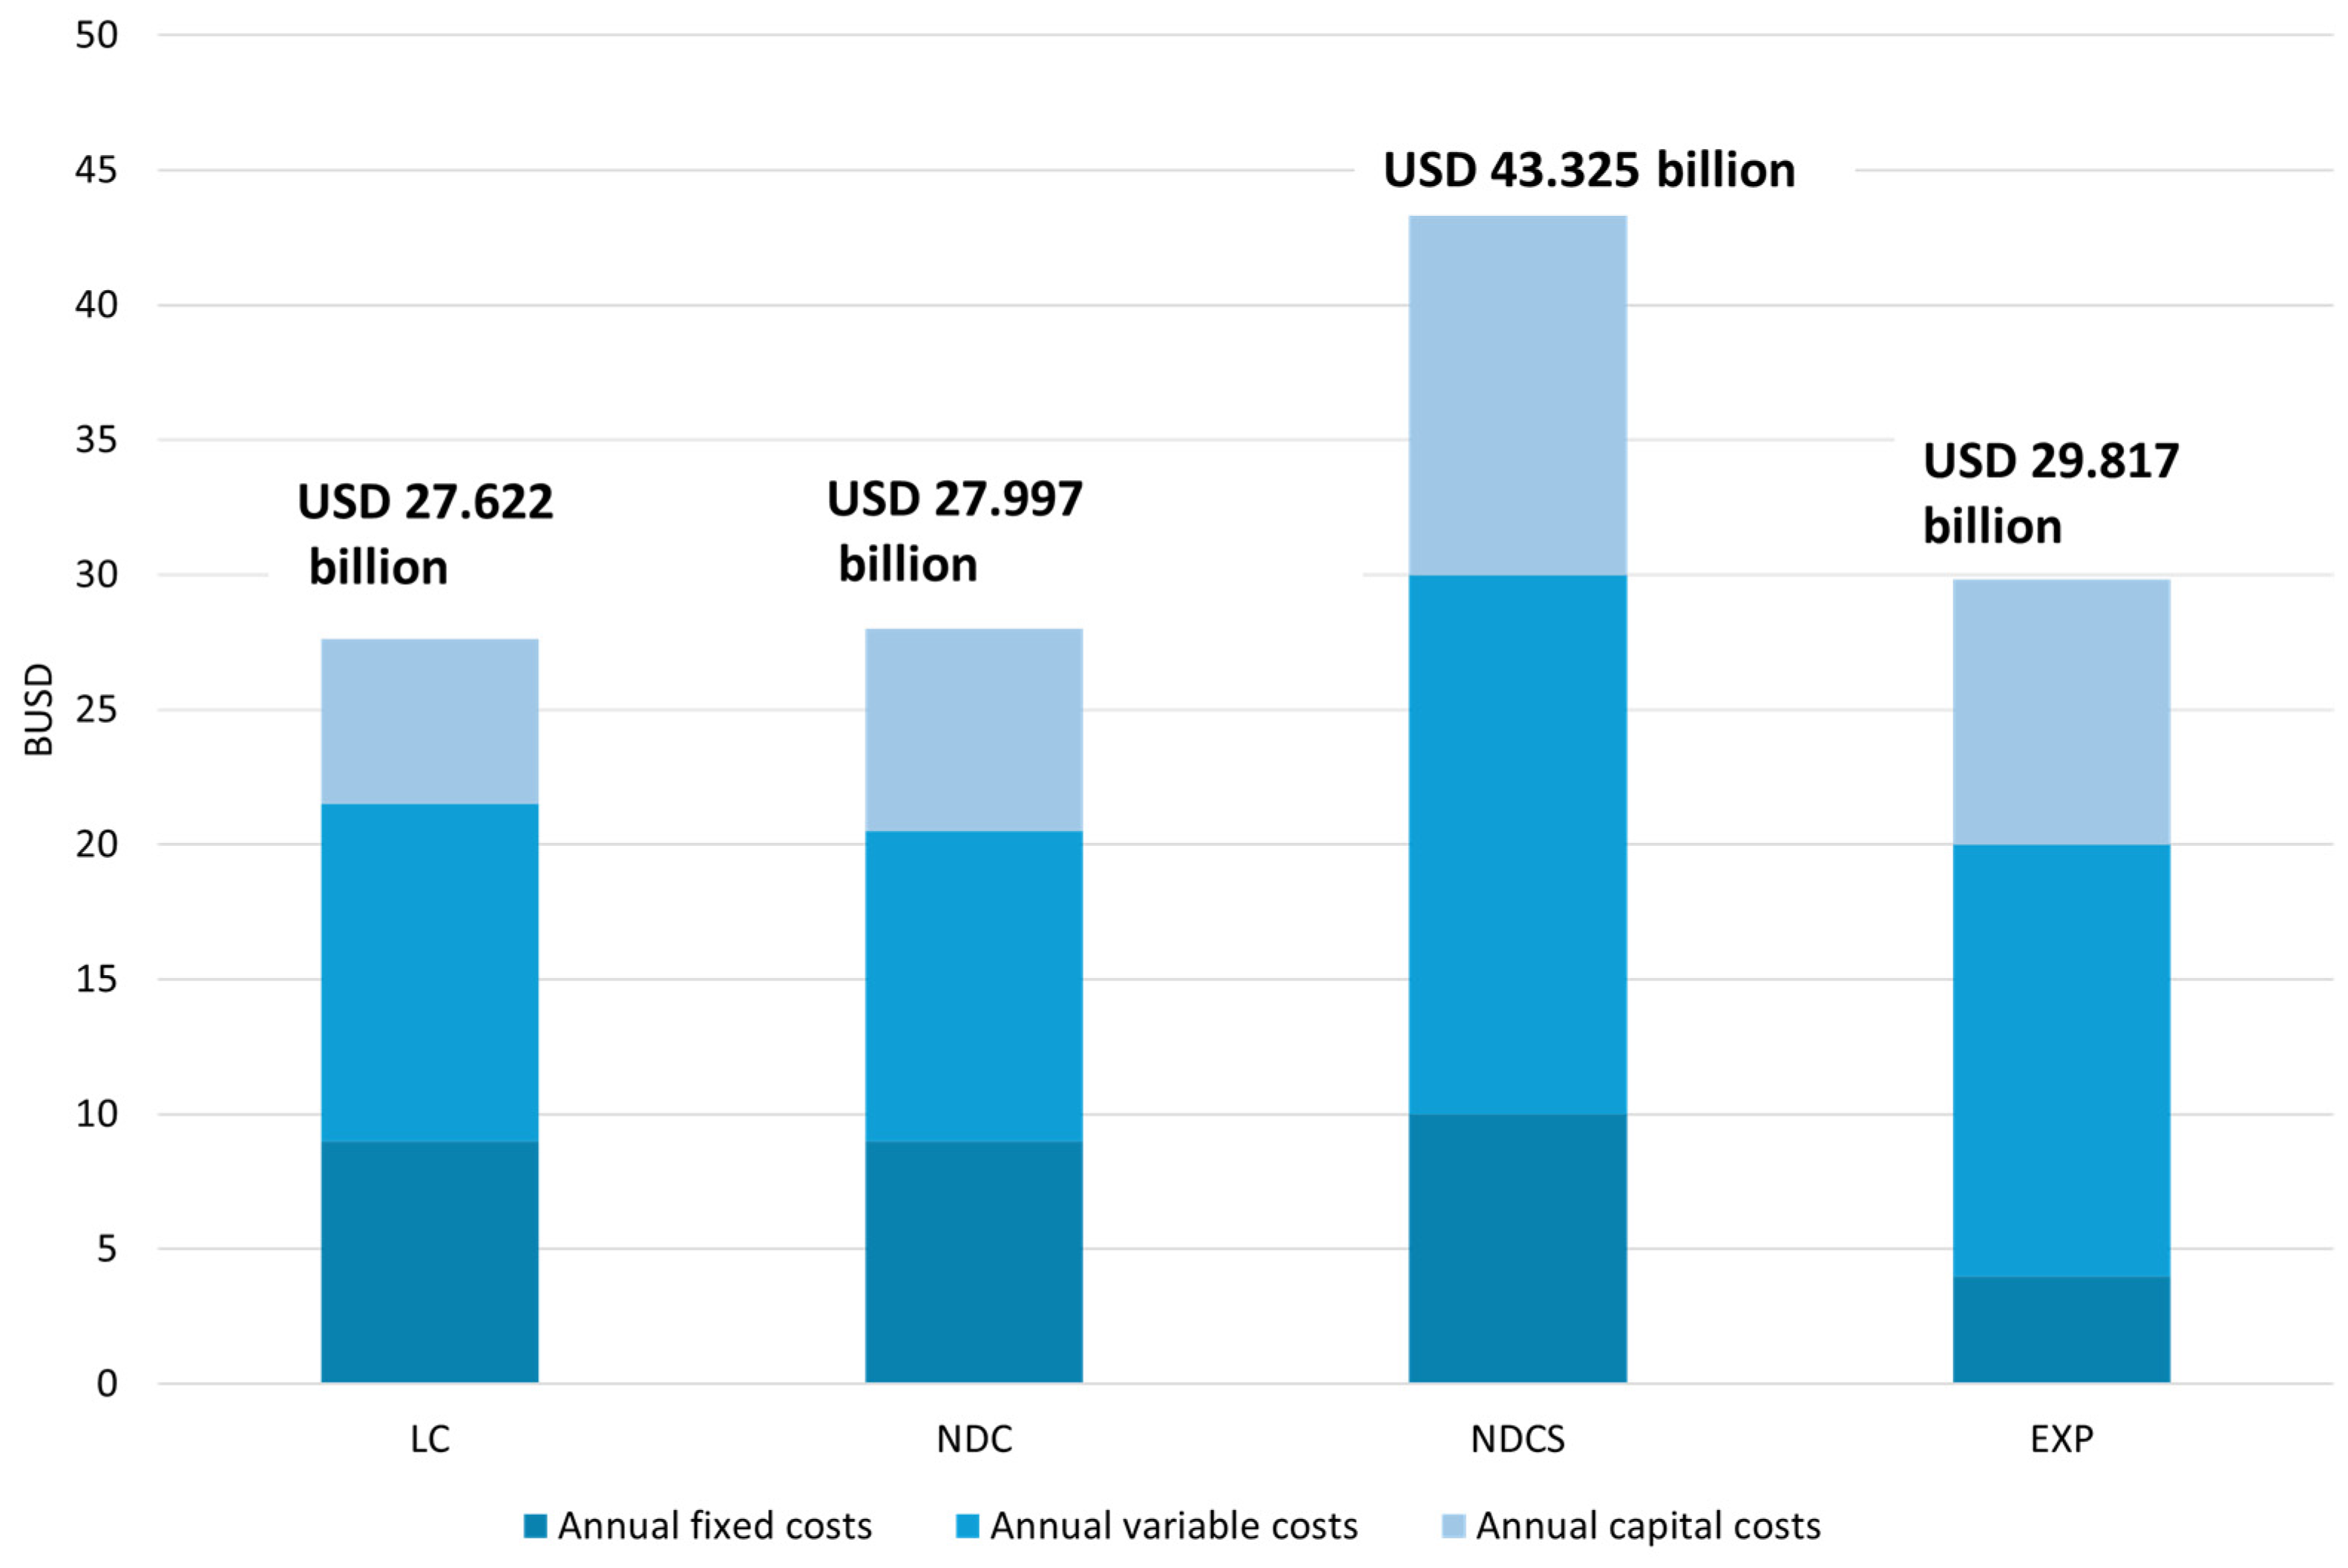
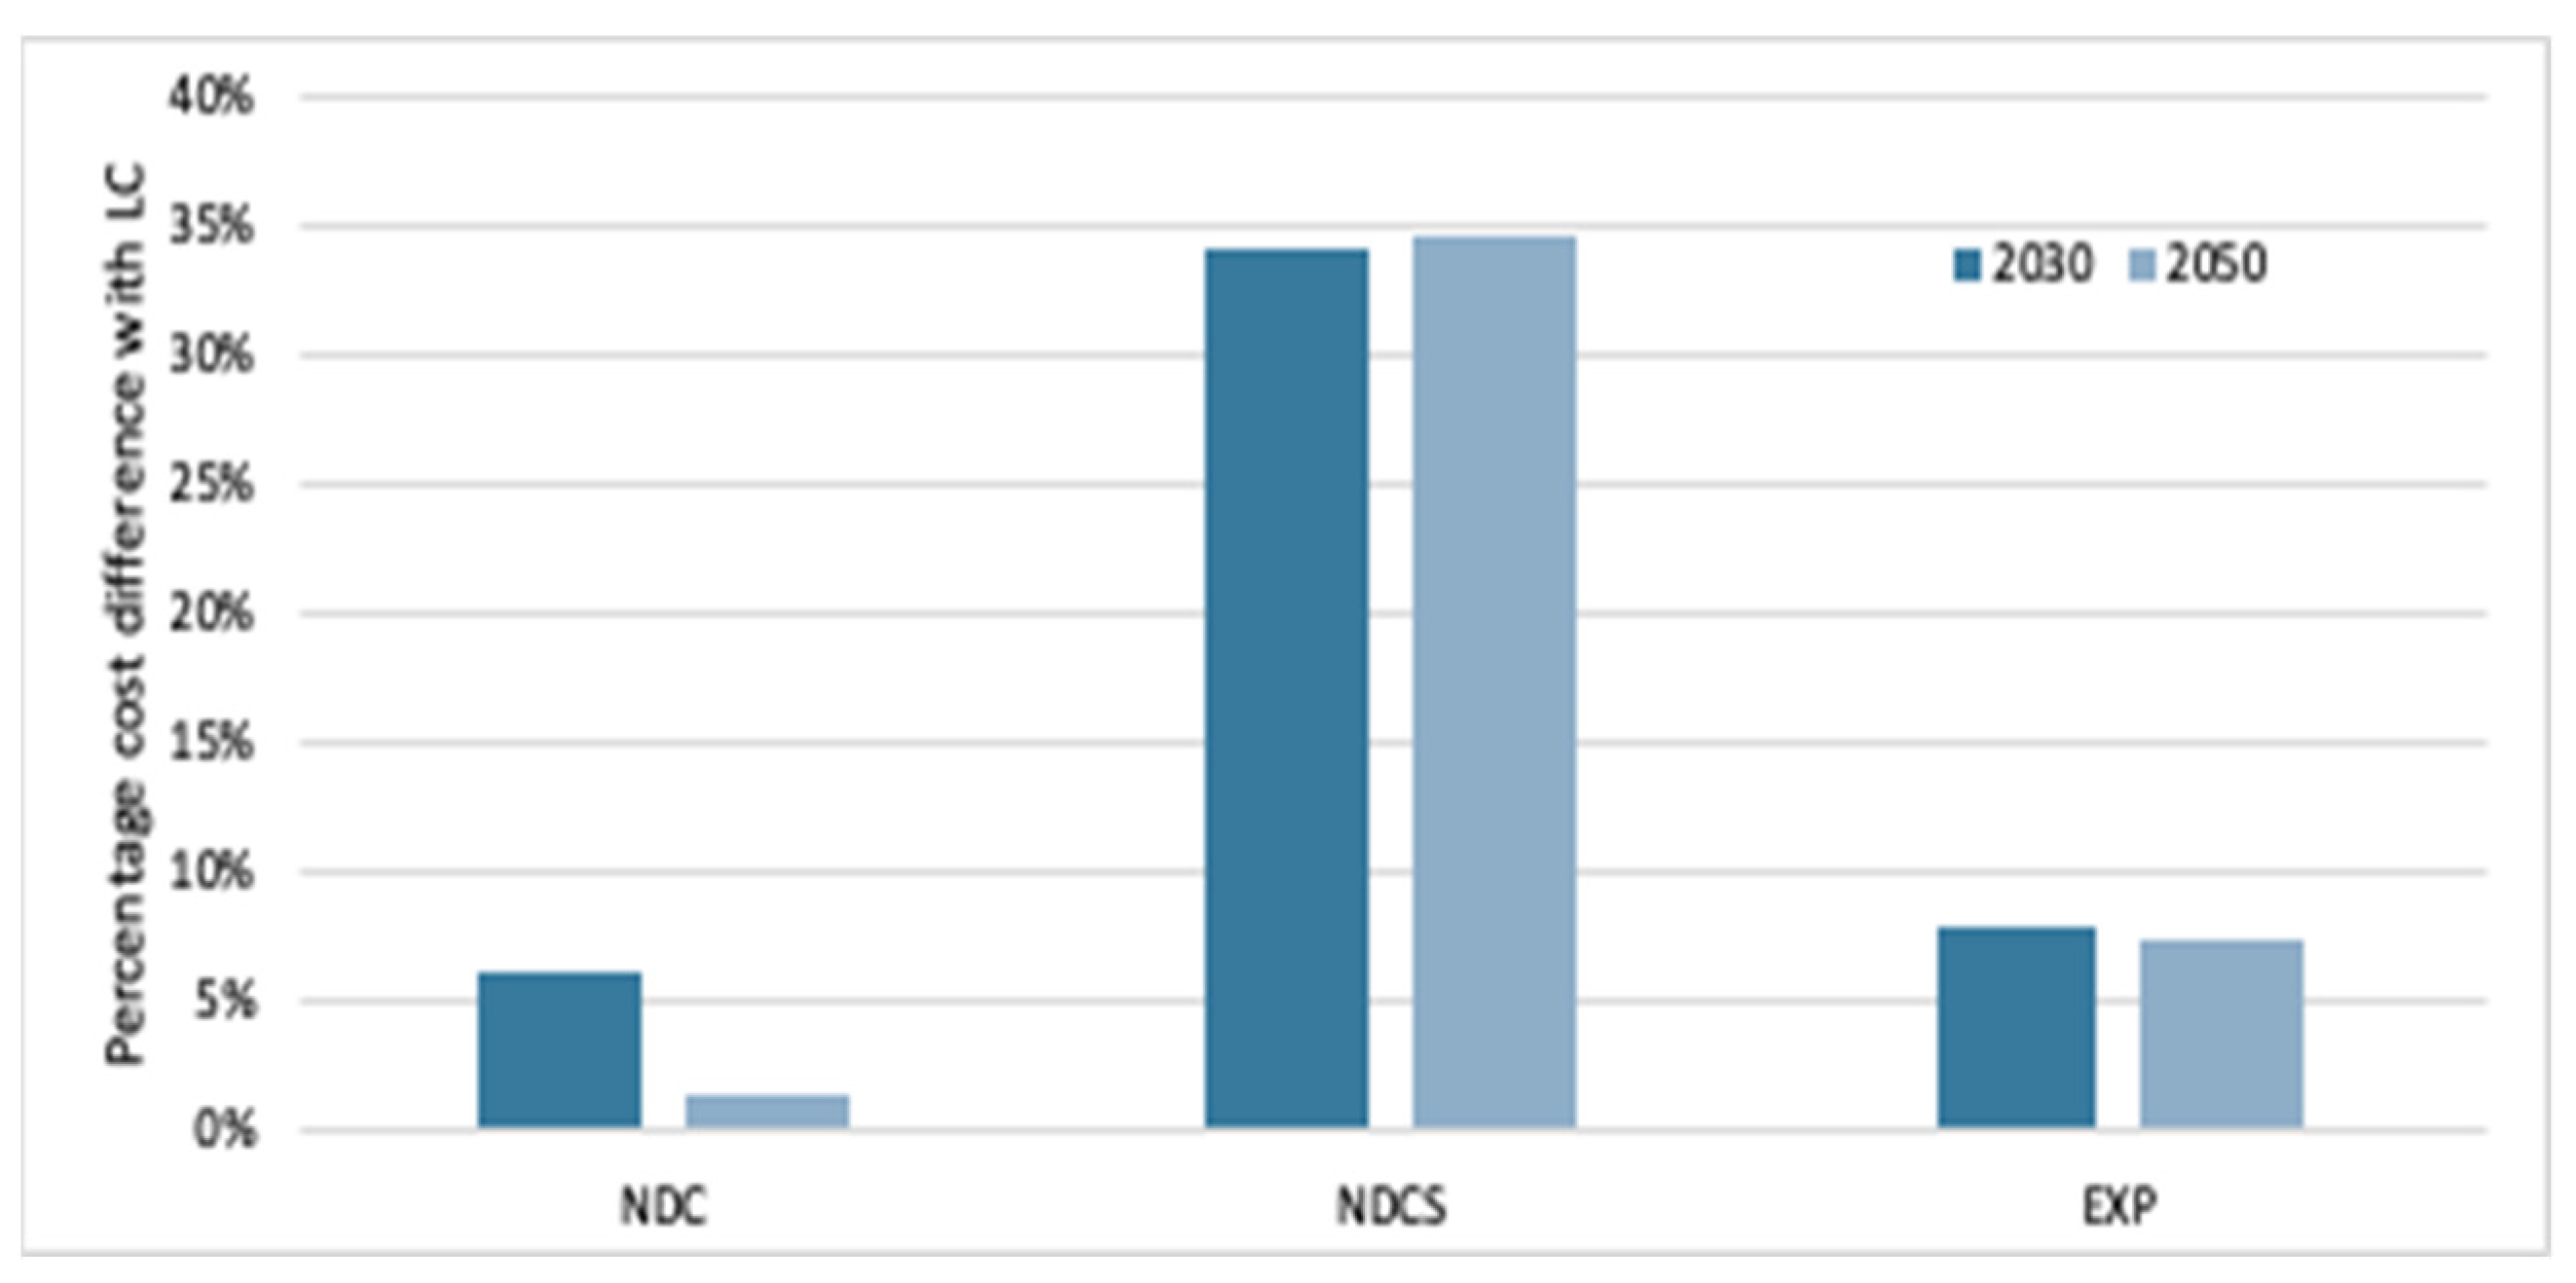
3.2.2. Discounted Costs
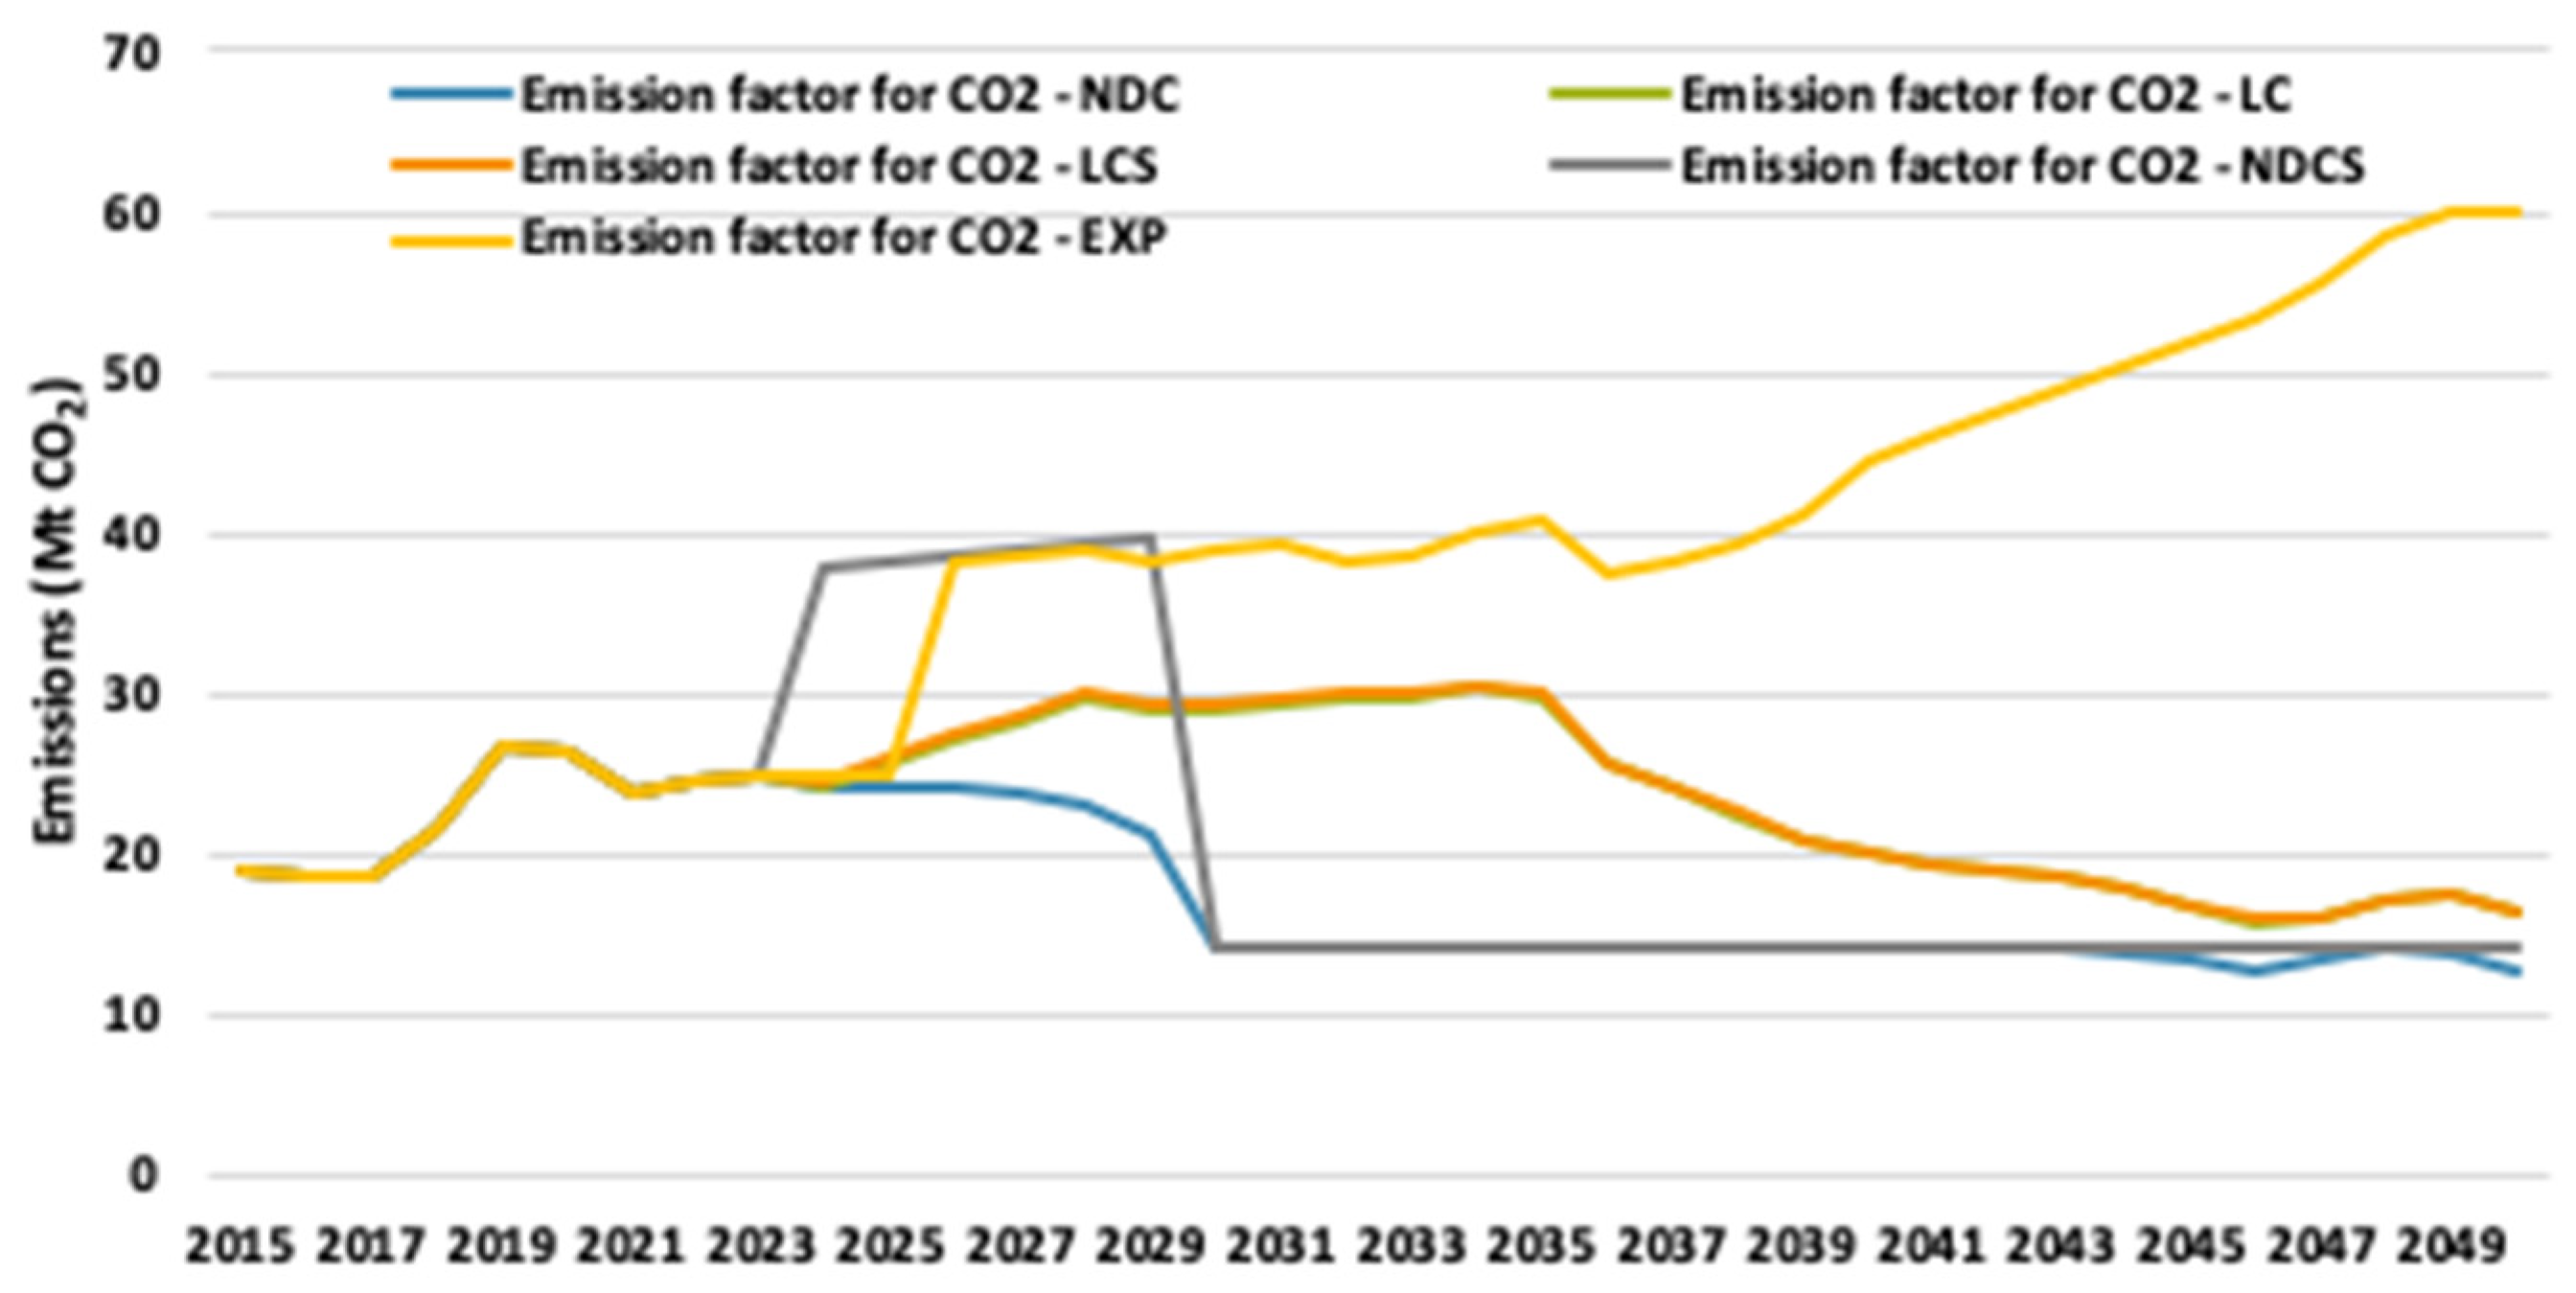
Figure 15 shows the total net present cost between 2015 and 2030 of the modelled scenarios, and Figure 16 shows the same between 2015 and 2050. Both figures consider the revenues from exports in the EXP scenario, which were derived from the OSeMOSYS model, respecting the stipulated constraints in the methodology section, and then calculated considering a price of 0.11 USD/kWh [32]. Moreover, all the net present costs were discounted manually using a 10% discount rate, as the scenarios are designed using the discounted costs but not shown in the results templates used [49] (Appendix A.4).
Figure 15.
Total annual fixed, variable, and capital costs in billion USD of modelled scenarios between 2015 and 2030, using a 10% discount rate.
Figure 16.
Total annual fixed, variable, and capital costs in billion USD of modelled scenarios between 2030 and 2050, using a 10% discount rate.
The small difference (5.9%) in total accumulated costs between the LC and the NDC in 2030 (Figure 17) shows that, to reach their emission reduction target, Morocco must invest rapidly, mainly in the capital costs of new onshore wind and solar projects. However, with total annual costs amounting to USD 27.662 billion and USD 27.997 billion, respectively (Figure 16), by 2050, the disparity of a mere 1.3% (Figure 17) shows that the high initial investment is later compensated for by the decreasing variable costs of imported fossil fuels. This means that if Morocco decides to invest in the cheapest electricity mix modelled, it will be only USD 375 million away from reaching its unconditional emission reduction goals, a conclusion which also corroborates the findings of the previous model [4].
Figure 17.
Discounted cost sensitivity analysis between scenarios and baseline LC scenario.
The incorporation of GH2 technologies increases the costs significantly from the LC: by 34% in the NDCS, and even by 7% in the EXP scenario (Figure 17). It is also USD 12.507 billion cheaper to export GH2 than to use it for local electricity storage, as shown in Table 7. The EXP scenario shows the highest variable costs stemming from the coal imports, and the high capital costs associated with the construction of GH2 technologies in the NDCS and EXP scenarios (Figure 15 and Figure 16). This is explained as the high costs of storage technologies push the model to opt for cheaper baseload technologies such as fossil fuels, importing them because Morocco does not have local resources of coal or gas.
Table 7.
Discounted cost sensitivity analysis between scenarios.
Although GH2 exports via 5.9 GW of PEM electrolysers have a projected potential of USD 17.7 billion by 2050, this potentially lucrative avenue needs to be put in perspective, as it is 7% more expensive than the LC scenario. In fact, before subtracting the revenues from the fixed cost, the EXP scenario was USD 3.5 billion more expensive than the LC by 2030, and USD 9.8 billion more expensive by 2050, because of the high capital costs associated with the GH2 technologies and RE build-out.
3.2.3. Emissions
The substantial reductions in emissions in all the modelled scenarios except EXP revealed in Figure 18 are attributed to the globally diminishing costs of RE technologies, as well as Morocco’s important RE potential. It is also noted that the LC and LCS scenarios show the exact same path of emissions and amount to 163.348 Mt CO2 in 2050.
Figure 18.
Annual CO2 emissions for the modelled scenarios between 2015 and 2050.
The implications of this reduction trend render Morocco’s NDCs pragmatically achievable: compared with the costs mentioned previously, it is understood that a relatively modest increment of 1.3% in investments facilitates a 23.34% reduction in CO2 emissions by 2050. The NDCS scenario shows a 19.59% reduction. Contrastingly, the emission trajectories manifested in the EXP scenarios evidence total emissions that would be 39.52% higher than the LC, at 60.032 Mt CO2, in 2050. This is primarily explained by the model’s predilection for exporting green electricity as hydrogen, whilst using highly polluting coal, gas, and biomass resources for local production. The NDCS scenario shows a 3.73% smaller emission decrease when compared to the NDC scenario, as the slow build-out of expensive GH2 storage technologies forces the model to use imported fossil fuels in the meantime, as shown by the drop in 2030 (when it stops importing coal). However, they both emit 14.250 Mt CO2 in 2050 because of the emission limit set on the model.
Furthermore, a comparison with the baseline scenario used in the official NDC document [22] uncovers a resonance with the findings. Maintaining the premise that the electricity sector constitutes 22% of total emissions, the baseline scenario registers emissions at 31,316 kg CO2, a figure that is similar to the LC emissions in 2030, recorded at 29,595 kg CO2. This displays the accuracy of the modelling conducted in this study.
4. Discussion
4.1. Implications for Morocco’s NDC Goals
This study’s findings indicate that Morocco’s LC scenario falls short on achieving its 2030 NDC targets, despite 68% of its total electricity generation coming from RESs by 2050. However, the “emission gap” of 194.292 Mt CO2 between the LC and NDC scenario between 2015 and 2050 can be closed through a “small” additional investment of USD 375 million. Moreover, despite not planning any new coal plant construction, Morocco is projected to still rely on existing ones in 2050 in all the modelled scenarios due to their low prices and previous extensions of these facilities.
| Identified challenge: Morocco still uses existing coal plants by 2050 in all modelled scenarios. This leads to higher emissions and lessened energy security because of a dependence on exports. |
| Policy recommendation 1: Replace the existing “No New Coal” pledge for a “No Coal by 2030” pledge. This means early decommissioning of existing coal plants. This policy also allows for redirecting coal subsidy funding to wind and solar subsidies. |
Consequences:
|
4.2. Implications for Morocco’s Green Hydrogen Roadmap
The current Green Hydrogen Roadmap’s (GHR’s) target of 57.4 GW of purely RE energies being used to feed into 14 GW of electrolysers by 2050 is striking when compared to the total RE capacity of around 28 GW in the modelled LC scenario for that year. This means that Morocco not only has to multiply its installed RE capacity 10-fold by 2050, but also that two-thirds of it will be used for green hydrogen exports. Moreover, the increased emissions due to coal and gas imports lead to the conclusion that Morocco is not ready to fully fund the published GHR objectives whilst decarbonising.
| Identified challenge: The Green Hydrogen Roadmap could be too ambitious and can therefore lead to industry bottlenecks and detract government funding from the RE deployment priority to green hydrogen technologies. |
| Policy recommendation 2: It is recommended to delay the Roadmap’s ambitions and lower the scope of its objectives. In the meantime, continue using green hydrogen in already started projects but focus on investing in RE rather than expanding GH2 to other sectors such as exports and storage. Some aspects to be included in the new GHR are as follows:
|
4.2.1. Enhance Financial Support Mechanisms to Attract International Funding for the Electrolyser Build-Out for Export Purposes
The results of this analysis have shown that it is more economical for Morocco to export GH2 than to use it for local storage, under the condition of international private and public financing aid. In fact, the potentially lucrative economic avenue availed by GH2 exports via PEM electrolysers, with projection results highlighting potential revenues of USD 17.7 billion by 2050 using 5.9 GW of electrolysers, needs to be put in perspective, as it is still an alternative that would be 7% more expensive than the LC scenario. The GH2 and associated RE technologies are expected to cost an additional USD 9.8 billion by 2050. These costs should therefore be shared through Public–Private Partnerships (PPPs) with the GH2 importers or Independent Power Providers.
As the PAREMA agreements with Germany have started to demonstrate, cultivating these alliances can harness a more extensive array of knowledge and financial assets. Such collaborations enable joint research initiatives, technology transfer—especially as Germany is one of the leaders in electrolysis research—and infrastructure investment. Public–Private Partnerships in Morocco have the potential to accelerate the GH2 transition, as they have proven to be a successful model for the solar energy industry.
Simplifying application procedures for grants, increasing tax incentives such as tax relaxations and subsidies, and other financial support can drive GH2 deployment. A successful example to follow could be China’s Income Tax Preference Policy: electrolyser companies are exempt from paying corporate income tax in the first three years and then just half in the third to sixth year to drive investments in green hydrogen infrastructure projects. This would allow Morocco to attract international investors and help fund the USD 9.8-billion PEM electrolyser and RE projects by 2050 that are described in this analysis.
4.2.2. Diversify Electricity Storage Sources
Whilst batteries were not chosen by this OSeMOSYS model, it is recommended to pair green hydrogen tanks with other types of storage that are available in Morocco, such as pumped hydropower and CSP, to ensure a more resilient storage system.
Moreover, the strategic utilisation of underground storage capabilities, such as SOMAS facilities with potential storage of 200,000 tons, can further enhance efficiency. Co-locating these storage sites with PEM electrolysers fosters optimal synergy between storage and production. Evaluations of these opportunities, including considerations of standalone RE plants coupled with Mesozoic salt deposits for storage, can lead to a more resilient and adaptive GH2 infrastructure. This opportunity for inter-seasonal storage could manifest as one of the main advantages of GH2, as well as decreasing the costs of transmission and of the inputs of the tanks in the model. However, this diversification could also lead to grid management complications and needs to be researched further.
4.3. Limitations and Opportunities for Further Research
This study is subject to several notable data limitations that may impact the accuracy and comprehensiveness of its findings. Firstly, the extrapolation of storage technology costs between the years of 2023, 2030, and 2040 as a linear progression assumes a consistent rate of change, which may not necessarily reflect the dynamic nature of technological advancements, learning curves, and market trends. Further investigation into the cost curves for various storage technologies is therefore recommended. When possible, Morocco-specific techno-economic parameters were selected, but the costs of transmission of GH2 may be underestimated. Moreover, the exclusion of hybrid or integrated systems that combine various storage technologies may limit the study’s applicability to real-world scenarios, where standalone storage solutions may not be the sole approach adopted. Another limitation stems from the time slices used, resulting in limited granularity. The study’s choice of eight time slices might not capture the intricacies of real-world energy demand fluctuations adequately. Consequently, this could result in inaccurate inputs for storage duration and potentially underestimate the capabilities of GH2 technologies. Unlike BESS, which can store energy for a maximum of 8 h, GH2 offers an inter-seasonal storage capability, providing enhanced flexibility [10]. Nevertheless, it is crucial to acknowledge the inefficiencies associated with GH2 production and storage processes. These efficiencies need to be considered when determining discharging rates within OSeMOSYS models for future investigations [47].
Considering these limitations, several avenues for further research emerge:
- Flexibility analysis: Future studies should explore the potential for introducing more renewable capacity using to storage technologies, considering the associated costs and benefits. This could lead to the LCS scenario being prioritised. Employing FlexTool is advised to accomplish this task.
- Environmental Impact Assessment: As water scarcity remains one of the most pressing concerns in Morocco’s context, conducting an EIA that is specifically focused on PEM electrolysers and fuel cells would contribute towards sustainable solutions. Such analysis using CLEWs is recommended.
- Sector Coupling considerations: This involves integrating multiple sectors in energy systems, including electricity generation industries such as the fertiliser industry, which represents a great hope for Morocco’s GH2 deployment but is out of the scope of this paper.
5. Conclusions
This literature review has highlighted a clear research gap: there is limited analysis of Morocco’s approach to green hydrogen deployment and whether its energy sector is prepared, especially when analysed using the energy trilemma framework, and this study was designed to address this gap.
Utilising OSeMOSYS for energy modelling, the study updated existing models for the LC and NDC base scenarios, while also introducing storage and export considerations for the Green Hydrogen Scenarios (LCS, NDCS, and EXP). Through these models, the study juxtaposed costs, emissions, imports, and energy mixes, shedding light on the inherent constraints in Morocco’s green hydrogen ambitions.
The findings revealed that the current trajectory laid out in the Green Hydrogen Roadmap is not harmonised with the existing energy infrastructure in Morocco. If pursued aggressively, there is a risk of increased fossil fuel imports during the critical phase of electrolysers and renewable infrastructure buildout, leading to surging costs. Particularly telling was the result from the NDCS scenario: utilising green hydrogen for storage caused a 34% jump in costs, showcasing that exports using equivalent electrolyser capacity were 28% cheaper. These green hydrogen imports could also lead to a 3.73% smaller emission reduction. This underscores the pressing need for a recalibration of the Green Hydrogen Roadmap, accounting for environmental monitoring and diversified storage solutions. Conversely, the promise of the green hydrogen market in Morocco was evident from the EXP scenario, with projected revenues approximating USD 17.7 billion by 2050. Such potential underscores the merit in attracting international funding, to not only bolster Morocco’s economic ascent but also to further wider decarbonisation objectives.
Further, this study emphasises the imperative for Morocco to prioritise decarbonisation via an enhanced commitment to renewable energy deployment—the NDC scenario demonstrated that with a 1.3% cost increment, emissions could be curtailed by 23.32%. However, the persisting reliance on coal imports across all modelled scenarios underscores the urgency of amplifying wind and solar ventures. A policy shift, such as reallocating coal subsidies to bolster wind and solar projects, emerges as a strategic move. Such a pivot to REs can concurrently pave the way for green hydrogen deployment, aligning with the tenets of the energy trilemma.
Supplementary Materials
The following supporting information can be downloaded at: https://zenodo.org/records/10427703 (accessed on 23 December 2023).
Author Contributions
Conceptualisation, A.C.; methodology, A.C.; formal analysis, A.C.; investigation, A.C.; data curation, A.C.; writing—original draft preparation, A.C.; writing—review and editing, A.C., R.Y., C.C., M.H. and F.P.-N.; supervision, M.H.; project administration, R.Y. All authors have read and agreed to the published version of the manuscript.
Funding
For this research, CCG contributed to funding the time dedicated by the co-authors for the production of this material, and CCG funded the publishing fees associated with the publishing of this material (APC). Climate Compatible Growth (CCG) is a UK aid-funded project which aims to support investment in sustainable energy and transport systems to meet development priorities in the Global South.
Institutional Review Board Statement
This work follows the U4RIA guidelines, which provide a set of high-level goals relating to conducting energy system analyses in countries. This paper was carried out involving stakeholders in the development of models, assumptions, scenarios, and results (Ubuntu/Community). The authors ensured that all data, source codes, and results can be easily found, accessed, downloaded, and viewed (retrievability) and licensed for reuse (reusability), and that the modelling process can be repeated in an automatic way (repeatability). The authors provide complete metadata for reconstructing the modelling process (reconstructability), ensuring the transfer of data, assumptions, and results to other projects, analyses, and models (interoperability) and facilitating peer-review through transparency (auditability).
Data Availability Statement
The data and model code used for this study are fully accessible and licensed under an MIT license. The Supplementary Material is available at the Zenodo repository.
Acknowledgments
This material was produced under the Climate Compatible Growth (CCG) programme, which brings together leading research organisations and is led out of the STEER centre, Loughborough University. CCG contributed by funding the time dedicated by the co-authors for the production of this material, and CCG funded the publishing fees associated with the publishing of this material. CCG is funded by the Foreign, Commonwealth and Development Office (FCDO) of the UK government. However, the views expressed herein do not necessarily reflect the UK government’s official policies.
Conflicts of Interest
The authors declare no conflicts of interest.
Abbreviations
| BESS | Battery Energy Storage System |
| CSP | Concentrated Solar Power |
| GH2 | Green Hydrogen |
| GHG | Greenhouse Gas |
| GHR | Green Hydrogen Roadmap |
| GW | Gigawatt |
| MEM | Ministry of Energy Transition and Sustainable Development |
| Mt | Megaton |
| NDC | Nationally Determined Contributions |
| ONEE | Moroccan National Office for Electricity and Potable Water |
| OSeMOSYS | Open Source energy Modelling System |
| PEM | Polymer Electrolyte Membrane electrolysis |
| PJ | Petajoule |
| PV | Photovoltaic |
| RESs | Renewable Energy Sources |
| TWh | Terawatt-hours |
| VRE | Variable Renewable Energy |
Appendix A
Appendix A.1 presents the detailed updates in the historical electricity generation.
Appendix A.1. Updated Historical Generation of Moroccan Electricity by Source 2015–2022 [13,19]
| Energy Source | Historical Generation (PJ) | |||||||
| 2015 | 2016 | 2017 | 2018 | 2019 | 2020 | 2021 | 2022 | |
| Biomass | 5.04 | 5.21 | 5.38 | 5.55 | 5.72 | 5.89 | 6.25 | 6.62 |
| Coal | 62.11 | 61.65 | 63.66 | 77.04 | 97.34 | 98.44 | 86.18 | 85.23 |
| Geothermal | 0 | 0 | 0 | 0 | 0 | 0 | 0 | 0 |
| Natural Gas | 21.81 | 22.26 | 21.99 | 19.70 | 17.90 | 13.44 | 18.56 | 99,999 |
| Solar | 0.01 | 0.01 | 0.01 | 0.57 | 1.43 | 1.41 | 6.56 | 6.82 |
| Concentrated Solar Power | 1.01 | 2.44 | 2.49 | 3.86 | 5.27 | 5.07 | 5.10 | 5.16 |
| Hydropower | 9.21 | 6.98 | 6.63 | 8.19 | 6.95 | 5.64 | 5.36 | 5.36 |
| Wind | 9.57 | 11.32 | 11.43 | 14.41 | 17.50 | 17.03 | 18.90 | 19.14 |
Appendix A.2 presents the updates conducted to Harland’s [4] OSeMOSYS model.
Appendix A.2. Updates Made to Previous OSeMOSYS Model
| Data Parameter | Technology and Updated Values | Justification and Data Sources |
| For all scenarios | ||
| Residual capacity | -Hydropower. -Concentrated Solar Power. -Wind. -Solar. -Natural Gas. -Coal. -Biomass. | MEM [44] projects detailed and use of the “Residual Capacity Calculator v2” [45]. |
| Total Annual Max Capacity Investment | Same values as residual capacity for 2015–2022 for all technologies: hydropower, CSP, solar, wind, coal, gas, oil, biomass, transmission. For the rest of the modelling period: using the same as Harland [4] but starting in 2023. | This allows for the model to be constrained to not invest in the past [46]. |
| Capital and Fixed Costs | Nuclear power: CapEx = 5124 USD/kW; OpEx = 122 USD/kW. | MEM [44]. |
| TotalTechnologyAnnualActivityLowerLimit | -Coal (2015): 61.6 PJ = 61.61 PJ − 0.5 PJ. Similar method for values until 2020. -Similar method for natural gas and hydropower, biomass, and coal between 2015 and 2022. -For renewables (wind, solar, geothermal, CSP), the Lower Limit is set to 0 | The TotalTechnologyAnnualActivityUpperLimit values were taken from IEA [13] for values until 2020 and converted from MWh to PJ. The values from 2020 to 2022 were taken from the International Trade Administration [19]. As detailed in the Richardson [46] methodology, the Lower Limit is to be slightly smaller (−0.5 PJ) than the actual production value, and the Upper Limit is to be marginally higher when used as constraints for the model to show the actual historical values of electricity production between 2015 and 2022. |
| TotalTechnologyAnnualActivityUpperLimit | -Coal (2015): 62.11 PJ = 61.61 PJ + 0.5 PJ. Similar method for values until 2022. -Similar method for natural gas, solar, CSP, wind, hydro, coal, oil, and biomass between 2015 and 2022. -Geothermal = 0. | In OSeMOSYS, solar, wind, and geothermal energy sources are utilised to their fullest potential given the existing capacity, because they do not require fuel and are cost-effective. Similarly, these technologies are commonly employed at their maximum capacity in real-world scenarios, thereby aligning OSeMOSYS predictions with historical data. |
| Resource Potential | -Biomass TotalAnnualActivityUpperLimit: 5% of total electricity generation. -Natural gas reserve TotalTechnologyModelPeriodActivityUpperLimit: 21,548 PJ. -TotalAnnualMaxCapacity for wind: 25 GW. -TotalAnnualMaxCapacity for solar: 1255 GW. -TotalAnnualMaxCapacity for hydro 1:3 GW. -For PWRWND001, the limit is set to 15% of total electricity demand each year. -For PWRWND002, the limit is set to 10% of total electricity demand each year. -For PWRWND001, the limit is set to 25% of total electricity demand each year. | IEA [30] for 5%, and then calculated: sum of residential + commercial + industrial electricity demand × 0.05. International Renewable Energy Agency [50]) and then calculated: 566 Bm3 × 0.038 GJ/m3 × 1000 PJ/GJ ≈ 21,548 PJ. 2018 hydropower capacity = 1.7 GW + 1.3 GW potential [13,48]. |
| Operational Life | -Extended for technologies in order to account for the possibility to renovate/modernise power plants. PWRSOL001 = 30 years. PWRHYD004 = 50 years. | IRENA [50]. |
| NDC Scenario | ||
| Max Capacity Investments | -Coal = 0 after 2021. -Nuclear = 0.1 after 2023. -Distribution = 99,999 after 2023. | -Respect of the “no new coal” pledge [48]. |
| Annual Emissions Limit | -CO2 = 22% of 64 Mtons from 2030 onwards. | -Respect the pledge to reduce emissions by 45.5% by 2030 from base scenario [22]. |
| LCS and NDCS | ||
| Seasons | 4 | [47,51] |
| DailyTimeBrackets | 8 | [47,51] |
| DayTypes | 1 | [47,51] |
| Capital Cost of Storage | Lithium Ion Batteries: linear decrease between 1600 USD/kw in 2022, 800 USD/kw in 2030, and 600 USD/kw in 2040. | MEM [44] |
| Capital Costs | Electrolysers: linear decrease from 1430 USD/kW in 2021, 1100 USD/kW in 2030, to 850 USD/kW in 2040. Fuel cells: linear decrease from 1670 USD/kW in 2021, 880 USD/kW in 2030, to 715 USD/kW in 2040. | EUR converted into USD in July 2023. |
| Operational Life | Batteries = 15 years Fuel cells = 20 years Electrolysers = 20 years | MEM [44,47]. |
| EXP | ||
| Demand | Green hydrogen export demands: 0 in 2015; 6.24 in 2023; 72.21 in 2030; 121.24 in 2040; 167.15 in 2050. | Following methodology from Climate Compatible Growth [52]. These values correspond to the GGH produced in the NDCS scenario and to the Green Hydrogen Roadmap exports targets [23]. |
Appendix A.3. Calculations of the Export Values
Initial Fixed Costs were obtained using OSeMOSYS following the constraints described in the Methodology section, and then calculated as follows:
Appendix A.4. Calculation of Discounted Costs
The formula used for discounting fixed, variable, and capital costs year by year for all scenarios was as follows:
The discount rate used was 10% for all years. Please note that the revenues from green hydrogen exports are discounted too.
References
- Alami, A. How Morocco Went Big on Solar Energy. BBC. November 2021. Available online: https://www.bbc.com/future/article/20211115-how-morocco-led-the-world-on-clean-solar-energy (accessed on 23 August 2023).
- Rahhou, J. Total Eren to Launch Green Hydrogen Megaproject in Morocco. Morocco World News. February 2022. Available online: https://www.moroccoworldnews.com/2022/02/346892/total-eren-to-launch-green-hydrogen-megaproject-in-morocco (accessed on 22 August 2023).
- Ezzahid, E.; Icharmouhene, R. Le Mix Électrique Optimal au Maroc Eclairages à Partir D’une Modélisation Ascendante. 2021. Available online: https://www.researchgate.net/publication/351038333 (accessed on 25 May 2023).
- Harland, N. Modelling the Feasibility of Energy Security and Decarbonisation in Morocco using OSeMOSYS (Open Source Energy Modelling System). Res. Sq. 2022; preprint. [Google Scholar] [CrossRef]
- Slimani, J.; Kadrani, A.; El Harraki, I.; Ezzahid, E.H. Long-Term Wind Power Development in Morocco: Optimality Assessment using Bottom-up Modeling. In Proceedings of the 2021 Ural-Siberian Smart Energy Conference, USSEC 2021, Novosibirsk, Russia, 13–15 November 2021; pp. 215–220. [Google Scholar]
- Morocco|Green Hydrogen Organisation. 2023. Available online: https://gh2.org/countries/morocco (accessed on 16 May 2023).
- Ourya, I.; Nabil, N.; Abderafi, S.; Boutammachte, N.; Rachidi, S. Assessment of green hydrogen production in Morocco, using hybrid renewable sources (PV and wind). Int. J. Hydrogen Energy 2023, 48, 37428–37442. [Google Scholar] [CrossRef]
- Touili, S.; Merrouni, A.A.; Azouzoute, A.; El Hassouani, Y.; Amrani, A.-I. A technical and economical assessment of hydrogen production potential from solar energy in Morocco. Int. J. Hydrogen Energy 2018, 43, 22777–22796. [Google Scholar] [CrossRef]
- Whitehouse. Morocco’s Green Hydrogen Can Serve Europe Says Greenrock’s Belmamoun; The Africa Report; Whitehouse: Paris, France, 2022.
- Van De Graaf, T. Hydrogen’s Decade. International Monetary Fund. Available online: https://www.imf.org/en/Publications/fandd/issues/2022/12/hydrogen-decade-van-de-graaf (accessed on 18 May 2023).
- World Economic Forum. Energy Transition Index 2020: From Crisis to Rebound. Available online: https://es.weforum.org/reports/fostering-effective-energy-transition-2020 (accessed on 15 August 2023).
- WorldBank. Access to Electricity (% of Population)—Morocco. Available online: https://data.worldbank.org/indicator/EG.ELC.ACCS.ZS?locations=MA (accessed on 12 May 2023).
- IEA. Morocco. Available online: https://www.iea.org/countries/morocco (accessed on 18 May 2023).
- Ortiz, J. Increase in Morocco’s Electricity Exports. Atalayar. February 2022. Available online: https://www.atalayar.com/en/articulo/economy-and-business/increase-moroccos-electricity-exports/20220228141747155302.html (accessed on 8 June 2023).
- Benzohra, O.; Ech-Charqaouy, S.S.; Fraija, F.; Saifaoui, D. Optimal renewable resources mix for low carbon production energy system in Morocco. Energy Inform. 2020, 3, 3. [Google Scholar] [CrossRef]
- IEA. Hydropower Data Explorer—Morocco; IEA: Paris, France, 2021.
- IEA. Changes in Hydropower Capacity Factor in Northern Africa (Morocco), 2020–2099, Relative to the Baseline 2010–2019; IEA: Paris, France, 2020.
- The World Bank. Energy Imports, Net—Morocco. Available online: https://data.worldbank.org/indicator/EG.IMP.CONS.ZS?view=chart&locations=MA (accessed on 27 August 2023).
- International Trade Administration. Morocco—Country Commercial Guide. Available online: https://www.trade.gov/country-commercial-guides/morocco-energy (accessed on 11 May 2023).
- World Energy Council. World Energy Trilemma 2022. 2022. Available online: https://www.worldenergy.org/assets/downloads/World_Energy_Trilemma_Index_2022.pdf?v=1669842216 (accessed on 24 August 2023).
- Fragkos, P. Assessing the energy system impacts of Morocco’s nationally determined contribution and low-emission pathways. Energy Strat. Rev. 2023, 47, 101081. [Google Scholar] [CrossRef]
- Royaume du Maroc. Contribution Determinee au Niveau National-Actualisee; Royaume du Maroc: Rabat, Morocco, 2021. [Google Scholar]
- Royaume du Maroc. Feuille de Route de l’Hydrogène Vert: Vecteur de Transition Énergétique et de Croissance Durable; Royaume du Maroc: Rabat, Morocco, 2021. [Google Scholar]
- Salimi, M.; Hosseinpour, M.; Borhani, T.N. The Role of Clean Hydrogen Value Chain in a Successful Energy Transition of Japan. Energies 2022, 15, 6064. [Google Scholar] [CrossRef]
- Perner, J.; Torres, P. PTX Roadmap for Morocco Final Report. 2020. Available online: www.iresen.org (accessed on 12 June 2023).
- Guerra, O.J.; Zhang, J.; Eichman, J.; Denholm, P.; Kurtz, J.; Hodge, B.-M. The value of seasonal energy storage technologies for the integration of wind and solar power. Energy Environ. Sci. 2020, 13, 1909–1922. [Google Scholar] [CrossRef]
- Osman, A.I.; Mehta, N.; Elgarahy, A.M.; Hefny, M.; Al-Hinai, A.; Al-Muhtaseb, A.H.; Rooney, D.W. Hydrogen production, storage, utilisation and environmental impacts: A review. Environ. Chem. Lett. 2021, 20, 153–188. [Google Scholar] [CrossRef]
- Yue, M.; Lambert, H.; Pahon, E.; Roche, R.; Jemei, S.; Hissel, D. Hydrogen energy systems: A critical review of technologies, applications, trends and challenges. Renew. Sustain. Energy Rev. 2021, 146, 111180. [Google Scholar] [CrossRef]
- Ersoy, S.R.; Terrapon-Pfaff, J.; Pregger, T.; Braun, J.; Jamea, E.M.; Al-Salaymeh, A.; Braunschweig, P.; Bereschi, Z.; Ciobotaru, O.T.; Viebahn, P. Industrial and infrastructural conditions for production and export of green hydrogen and synthetic fuels in the MENA region: Insights from Jordan, Morocco, and Oman. Sustain. Sci. 2023, 19, 207–222. [Google Scholar] [CrossRef]
- IEA. The Future of Hydrogen; June 2019; IEA: Paris, France, 2019.
- Odenweller, A.; Ueckerdt, F.; Nemet, G.F.; Jensterle, M.; Luderer, G. Probabilistic feasibility space of scaling up green hydrogen supply. Nat. Energy 2022, 7, 854–865. [Google Scholar] [CrossRef]
- van Wijk Frank Wouters, A.; Ikken, S.R.B. A North Africa-Europe Hydrogen Manifesto. 2019. Available online: www.dii-desertenergy.org (accessed on 31 May 2023).
- van Renssen, S. The hydrogen solution? Nat. Clim. Chang. 2020, 10, 799–801. [Google Scholar] [CrossRef]
- The German-Moroccan Energy Partnership. 2023. Available online: https://www.energypartnership.ma/home/ (accessed on 14 July 2023).
- Royaume du Maroc. Journal Serbe:Le Port Tanger Med S’impose sur la Nouvelle Carte Énergétique Mondiale. Maroc.ma. January 2021. Available online: https://www.maroc.ma/fr/actualites/journal-serbele-port-tanger-med-simpose-sur-la-nouvelle-carte-energetique-mondiale (accessed on 23 August 2023).
- Deloitte. Green Hydrogen: Energizing the Path to Net Zero; Deloitte: Sydney, Australia, 2023. [Google Scholar]
- IRENA. Geopolitics of the Energy Transformation: The Hydrogen Factor. January 2022. Available online: https://www.irena.org/publications/2022/Jan/Geopolitics-of-the-Energy-Transformation-Hydrogen (accessed on 23 August 2023).
- Eichhammer, W.; Oberle, S.; Händel, M.; Boie, I.; Gnann, T.; Wietschel, M.; Lux, B. Study on the opportunities of ‘Power-To-X’ in Morocco, 10 Hypotheses for discussion; Fraunhofer ISI: Karlsruhe, Germany, 2019. [Google Scholar]
- Vargas-Ferrer, P.; Álvarez-Miranda, E.; Tenreiro, C.; Jalil-Vega, F. Integration of high levels of electrolytic hydrogen production: Impact on power systems planning. J. Clean. Prod. 2023, 409, 137110. [Google Scholar] [CrossRef]
- Koutsandreas, D.; Trachanas, G.P.; Pappis, I.; Nikas, A.; Doukas, H.; Psarras, J. A multicriteria modeling approach for evaluating power generation scenarios under uncertainty: The case of green hydrogen in Greece. Energy Strat. Rev. 2023, 50, 101233. [Google Scholar] [CrossRef]
- Touili, S.; Merrouni, A.A.; El Hassouani, Y.; Amrani, A.-I.; Rachidi, S. Analysis of the yield and production cost of large-scale electrolytic hydrogen from different solar technologies and under several Moroccan climate zones. Int. J. Hydrogen Energy 2020, 45, 26785–26799. [Google Scholar] [CrossRef]
- Howells, M.; Rogner, H.; Strachan, N.; Heaps, C.; Huntington, H.; Kypreos, S.; Hughes, A.; Silveira, S.; DeCarolis, J.; Bazillian, M.; et al. OSeMOSYS: The Open Source Energy Modeling System: An introduction to its ethos, structure and development. Energy Policy 2011, 39, 5850–5870. [Google Scholar] [CrossRef]
- Cannone, C.; Allington, L.; Pappis, I.; Cervantes Barron, K.; Usher, W.; Pye, S.; Howells, M.; Zachau Walker, M.; Ahsan, A.; Charbonnier, F.; et al. CCG Starter Data Kit: Morocco; January 2023; Zenodo: Geneva, Switzerland, 2023. [Google Scholar] [CrossRef]
- MEM. Renewable Energies. Available online: https://www.mem.gov.ma/en/Pages/secteur.aspx?e=2 (accessed on 26 August 2023).
- Richardson, E. OSeMOSYS ResidualCapacity Calculator. 20 June 2023. Available online: https://doi.org/10.5281/zenodo.8066821 (accessed on 22 August 2023).
- Richardson. Starter Data Kit Scenario Constraints. 2023. Available online: https://docs.google.com/spreadsheets/d/1S_iWLzMMdUjahwrYNgFUejUBhIR1bg94/edit#gid=823935327 (accessed on 22 August 2023).
- Novo, R.; Marocco, P.; Giorgi, G.; Lanzini, A.; Santarelli, M.; Mattiazzo, G. Planning the decarbonisation of energy systems: The importance of applying time series clustering to long-term models. Energy Convers. Manag. X 2022, 15, 100274. [Google Scholar] [CrossRef]
- UNFCCC. End of Coal in Sight at COP26. Glasgow. November 2021. Available online: https://unfccc.int/news/end-of-coal-in-sight-at-cop26 (accessed on 3 August 2023).
- Climate Compatible Growth. Visualization Templates—OSeMOSYS ClickSAND. Zenodo. Available online: https://zenodo.org/record/8219219 (accessed on 28 August 2023).
- International Renewable Energy Agency. Energy Profile—Morocco. Available online: https://www.irena.org/-/media/Files/IRENA/Agency/Statistics/Statistical_Profiles/Africa/Morocco_Africa_RE_SP.pdf (accessed on 9 June 2023).
- Marocco, P.; Novo, R.; Lanzini, A.; Mattiazzo, G.; Santarelli, M. Towards 100% renewable energy systems: The role of hydrogen and batteries. J. Energy Storage 2023, 57, 106306. [Google Scholar] [CrossRef]
- Climate Compatible Growth. Building on an OSeMOSYS Starter Data Kit #2: Translating Policy into Modelling Assumptions; Climate Compatible Growth: Loughborough, UK, 2023. [Google Scholar]
Disclaimer/Publisher’s Note: The statements, opinions and data contained in all publications are solely those of the individual author(s) and contributor(s) and not of MDPI and/or the editor(s). MDPI and/or the editor(s) disclaim responsibility for any injury to people or property resulting from any ideas, methods, instructions or products referred to in the content. |
© 2024 by the authors. Licensee MDPI, Basel, Switzerland. This article is an open access article distributed under the terms and conditions of the Creative Commons Attribution (CC BY) license (https://creativecommons.org/licenses/by/4.0/).


