Article

Exploring the Future Rainfall Characteristics over India from Large Ensemble Global Warming Experiments

Research and Development Center, Japan Meteorological Corporation, Osaka 530-0011, Japan
Climate 2023, 11(5), 94; https://doi.org/10.3390/cli11050094
Submission received: 16 March 2023 / Revised: 3 April 2023 / Accepted: 24 April 2023 / Published: 28 April 2023

Abstract

:
We investigated rainfall patterns over India for the period from 1951 to 2010 and predicted changes for the next century (2051–2100) with an assumed 4K warming from large ensemble experiments (190 members). We focused on rainfall patterns during two periods of present-day climate (1951–1980 and 1981–2010) and their projected changes for the near and far future (2051–2080 and 2081–2110). Our analysis found that the northeastern region of India and some southern regions received higher rainfall during the period of 1951–2010, which is consistent with daily observations from the Asian Precipitation Highly Resolved Observational Data Integration Towards Evaluation (APHRODITE). In the warming climate, rainfall events in India are predicted to carry more precipitation, with the northeast and southern regions experiencing stronger rainfall events. The frequency and intensity of these events (with more than 20 mm of rainfall per day, on average) are also expected to increase. Overall, our study suggests that water-related disasters such as flooding and landslides could be much worse in India in the future due to climate warming.

1. Introduction

In India, water-related disasters, including floods, landslides, coastal erosion, and other hazards, have become a growing concern over the last few decades [1]. These calamities are predominantly triggered by rainfall events and are heavily impacted by the amount, intensity, and frequency of precipitation in targeted regions [2,3]. Therefore, it is essential to comprehend precipitation levels and distributions, not just for the present climate but also for future planning and decision-making to alleviate the consequences of climate change [4]. Rainfall distribution over India is highly different across regions and time scales. For example, the northeastern regions and some areas in southern India receive more rainfall than other regions [5,6,7,8]. The western and northwestern regions receive less rainfall than the rest of the country [6,9]. Additionally, there is significant variability in rainfall patterns on different time scales, including seasonal and inter-annual variability. There are several causes for this variability, including natural factors such as El Niño and La Niña events, which can impact the Indian Ocean Dipole, resulting in changes in rainfall patterns. The Indian monsoon is also influenced by the Madden-Julian Oscillation (MJO), which is a pulse of cloud and rainfall that moves eastward over the tropics. The Himalayan Mountain range plays a crucial role in the variability of rainfall in India, acting as a barrier to the moisture-laden winds that come from the southwest during the monsoon season. The topography of the region also affects the distribution of rainfall, with areas on the windward side of mountains receiving more precipitation than areas on the leeward side. In addition to these natural factors, anthropogenic influences such as deforestation, urbanization, and land-use change can also affect rainfall patterns in India. Overall, a combination of natural and human factors contributes to the significant variability in rainfall patterns observed in India. From June through September, most of the rainfall in India occurs, and the spatial pattern of rainfall distribution is highly influenced by the topography of the country. The southwestern regions of India receive the maximum rainfall during this period, while the northwestern regions receive the least amount of rainfall [6]. Moreover, there are variations in rainfall distribution patterns over time. For example, in the last few decades, there has been a decreasing trend in monsoon rainfall over some parts of India, such as central and northwest India [10]. This trend has been attributed to various factors, including changes in land use, atmospheric aerosols, and greenhouse gases [3,11,12,13].
Although numerous studies have examined the rainfall pattern and climatology across the Indian region through observation, reanalysis, and model datasets, the majority of these studies have concentrated on the current climate’s rainfall characteristics [5,14,15,16,17,18,19]. For example, some studies have analyzed the historical rainfall data to understand the spatiotemporal variability of monsoon rainfall [2,6,14]. Others have used climate models to project rainfall patterns over India under different scenarios of greenhouse gas emissions [11,15,20,21]. However, there is a need for a vulnerability study focusing on the effects of climate change on extreme rainfall events considering the concepts of exposure, sensitivity, and adaptive capacity. Exposure refers to the degree to which a system is exposed to climate risks, such as extreme rainfall events. Sensitivity refers to the extent to which a system is affected by such risks, including the potential impacts on infrastructure, livelihoods, and ecosystems. Adaptive capacity refers to the ability of a system to cope with and adapt to climate risks, including measures such as infrastructure upgrades, early warning systems, and community-based disaster preparedness programs. These studies can provide valuable insights into the possible repercussions of climate change on extreme weather events’ frequency and intensity, which are anticipated to rise in the future. Furthermore, understanding the future changes in rainfall patterns is crucial for developing effective adaptation strategies to mitigate the consequences of climate change in several sectors, including infrastructure, water resources, and agriculture [1,22,23,24,25,26]. In recent years, there has been a growing number of studies that have investigated the future changes in rainfall patterns over India using different modeling approaches [8,9,13,27,28,29]. These studies have provided important insights into the possible consequences of climate change on the Indian monsoon and highlighted the need for further research to better understand the complex mechanisms driving the future changes in rainfall patterns over India.
In a study by Kishore et al. [14], it was reported that India experienced an average monthly rainfall of around 99 mm between 1989 and 2007, with the monsoon season (June–July–August–September) receiving approximately 330 mm per month and autumn (October-November) receiving about 52 mm per month. Nayak et al. [30] reported that the 30-year mean rainfall climatology (1981–2010) corresponds to an average of about 3 mm/day of rainfall annually, which is about 7 mm/day during the monsoon season and below 1 mm/day in October–November. However, a recent study by Dey and Mujumdar [31] showed that the rainfall homogeneity over India has significantly changed in recent periods (1951–1980 and 1981–2010) both in terms of the amount and timing. Previous studies have also reported changes in the pattern of rainfall over India. Goswami et al. [6] documented that extreme rainfall events during 1951–2000 over central India have significantly changed. Das and Lohar [32] conducted a study on future rainfall patterns over eastern India and found that the region is likely to experience a 4% increase in rainfall amount in the future climate (2010–2039) as compared to the present climate (1961–2000). Another study conducted by Chaturvedi et al. [20] projected that the rainfall amount over India would increase by 4–5% by 2030 and 6–14% by 2080 compared to the amount in 1961–1990. These findings suggest that future climate change may have a significant impact on the rainfall pattern over India, which would affect the water availability, agriculture, and other sectors in the country.
Although previous studies have examined the rainfall characteristics over India in the present-day climate, there is a lack of information on how these characteristics may change in the far future, particularly beyond 2080 [8,29]. This study aimed to bridge this gap by analyzing 190 ensemble experiment results to investigate rainfall characteristics over India during two present-day climate periods (1951–1980 and 1981–2010), as well as in the near and far future climate periods (2051–2080 and 2081–2110). We aimed to gain insights into how rainfall amounts, intensities, and frequencies may change in response to future climate change, which may assist in decision-making for adaptation and mitigation strategies.

2. Methods and Dataset

In this study, we analyzed 190 ensemble experiment results obtained from the Atmospheric General Circulation Model (AGCM) at a resolution of 60 km. The dataset used for this analysis was produced by the Meteorological Research Institute AGCM (MRI-AGCM) and included 90 experiments for the present climate and 100 experiments for the future climate. The dataset covered the period from 1951 to 2010 for the present climate and the period from 2051 to 2110 with future warming of 4 °C. This dataset, called the d4PDF data, was simulated globally by the MRI-AGCM at a resolution of 60 km [33]. To generate this data, the MRI-AGCM3.2H model was run at a horizontal resolution of approximately 60 km, covering the entire globe. The MRI-AGCM3.2H model includes a number of physical processes that influence weather patterns, including the dynamics of the atmosphere, radiative transfer, and the exchange of heat and moisture between the land, ocean, and atmosphere. The model also includes a representation of the Earth’s surface, including land cover, topography, and sea ice [33]. This model was executed numerous times using slightly varying initial conditions and model parameters to create an ensemble of simulations. The model was fed with various inputs, including sea-surface temperature (SST), sea-ice concentration (SIC), sea-ice thickness (SIT), global-mean concentrations of greenhouse gases, and three-dimensional distributions of ozone and aerosols. A 4K warming scenario was employed to simulate future climate conditions, and climatological SST warming patterns were added to the observational SST after removing the long-term trend component. The experiment involved six CMIP5 models, and for each of the six warming SSTs, 15-member ensemble simulations were carried out, leading to a total of 90 members. The greenhouse gas concentrations were fixed to the projected values of the RCP8.5 scenario for the year 2090. Additional information about this dataset can be found in the Data DIAS data catalog at http://search.diasjp.net/en/dataset/d4PDF_RCM (accessed on 12 December 2021).
We chose these data for our study because they are available in a large set of simulations with different initial conditions or parameters. This allows us to represent the uncertainty associated with the results, which in turn provides valuable insights into how the model responds to different inputs and how reliable the results are. While there are data sources available at higher spatial resolutions, such as 30 km, these datasets may not have as many ensemble members available. This makes it more difficult to represent the uncertainty associated with the results from these datasets.
We utilized AGCM simulations to obtain ensemble rainfall characteristics for India. The first step involved analyzing 190 ensemble experiment results to derive the ensemble rainfall climatology, annual cycle, and frequency distributions for the period 1961–2000 for validation. For climatology and annual cycles, we calculated the total rainfall for each month and year in the dataset and determined the average monthly and annual rainfall across the entire dataset. For the frequency distribution, we used the normal distribution function by characterizing the mean (μ) and the standard deviation (σ). The mean here represents the center of the distribution, and the standard deviation represents the spread of the data. To ascertain the degree of rainfall variability, we calculated the standard deviation of monthly and annual rainfall totals from the mean values for each member of the ensemble. To validate the model’s ability to simulate present climate rainfall characteristics, we used the Asian Precipitation-Highly-Resolved Observational Data Integration Towards Evaluation (APHRODITE) daily datasets for the period 1961–2000. After verifying the model’s capability to simulate present climate rainfall characteristics, we analyzed the same characteristics for two present-day climate periods (1951–1980 and 1981–2010) and their near and far future changes (2051–2080 and 2081–2110). To assess the impact of climate change on rainfall characteristics over India, we calculated the mean difference between the corresponding climate periods (present and future) by subtracting the average value of the rainfall parameter in the present climate period from that in the future climate period. Various parameters, such as mean annual rainfall, monthly rainfall, rainfall frequency, and intensity, were analyzed. The significance of changes in rainfall characteristics was assessed using the student t-test, which was applied to evaluate changes in mean and annual cycles across the climate periods.

3. Results

3.1. Validation of Model Data

Figure 1 shows a comparison of the rainfall climatology between the period of 1961–2000 from APHRODITE observation and the ensemble mean of AGCM experiments. The results indicate that the AGCM ensemble shows a mean rainfall distribution of 3–5 mm/day over central India and 1–3 mm/day over southern India, with a standard deviation varying between 0.2–1 mm/day in comparison to the APHRODITE observation. Notably, the northeastern regions, including the Western Ghat, received the highest amount of rainfall (>7 mm/day) during the same period, which is consistent with the APHRODITE daily observations. These findings suggest that the AGCM ensemble captures the present climate’s mean rainfall distribution fairly accurately. Figure 1c shows the standard deviation of the AGCM ensemble members from their mean values. This standard deviation provides an indication of the degree of variability or spread among the different members of the ensemble. The standard deviation values shown in Figure 1c suggest that, for the most part, each individual member of the ensemble exhibits similar magnitudes across the various regions of India, with deviations of up to 1 mm/d. However, it is noteworthy that the mountainous regions of India, which include the Western Ghats, Northeast India, and the Himalayas, exhibit a higher degree of variability, with standard deviation values exceeding 1 mm/d. This indicates that the precipitation patterns in these regions are more complex and variable than in other parts of India. The higher variability in these regions may be due to their unique topographical features, which can affect the local weather patterns and precipitation distribution. Overall, the standard deviation values presented in Figure 1c provide valuable insights into the range of precipitation variability among the different members of the AGCM ensemble, particularly over mountainous regions.
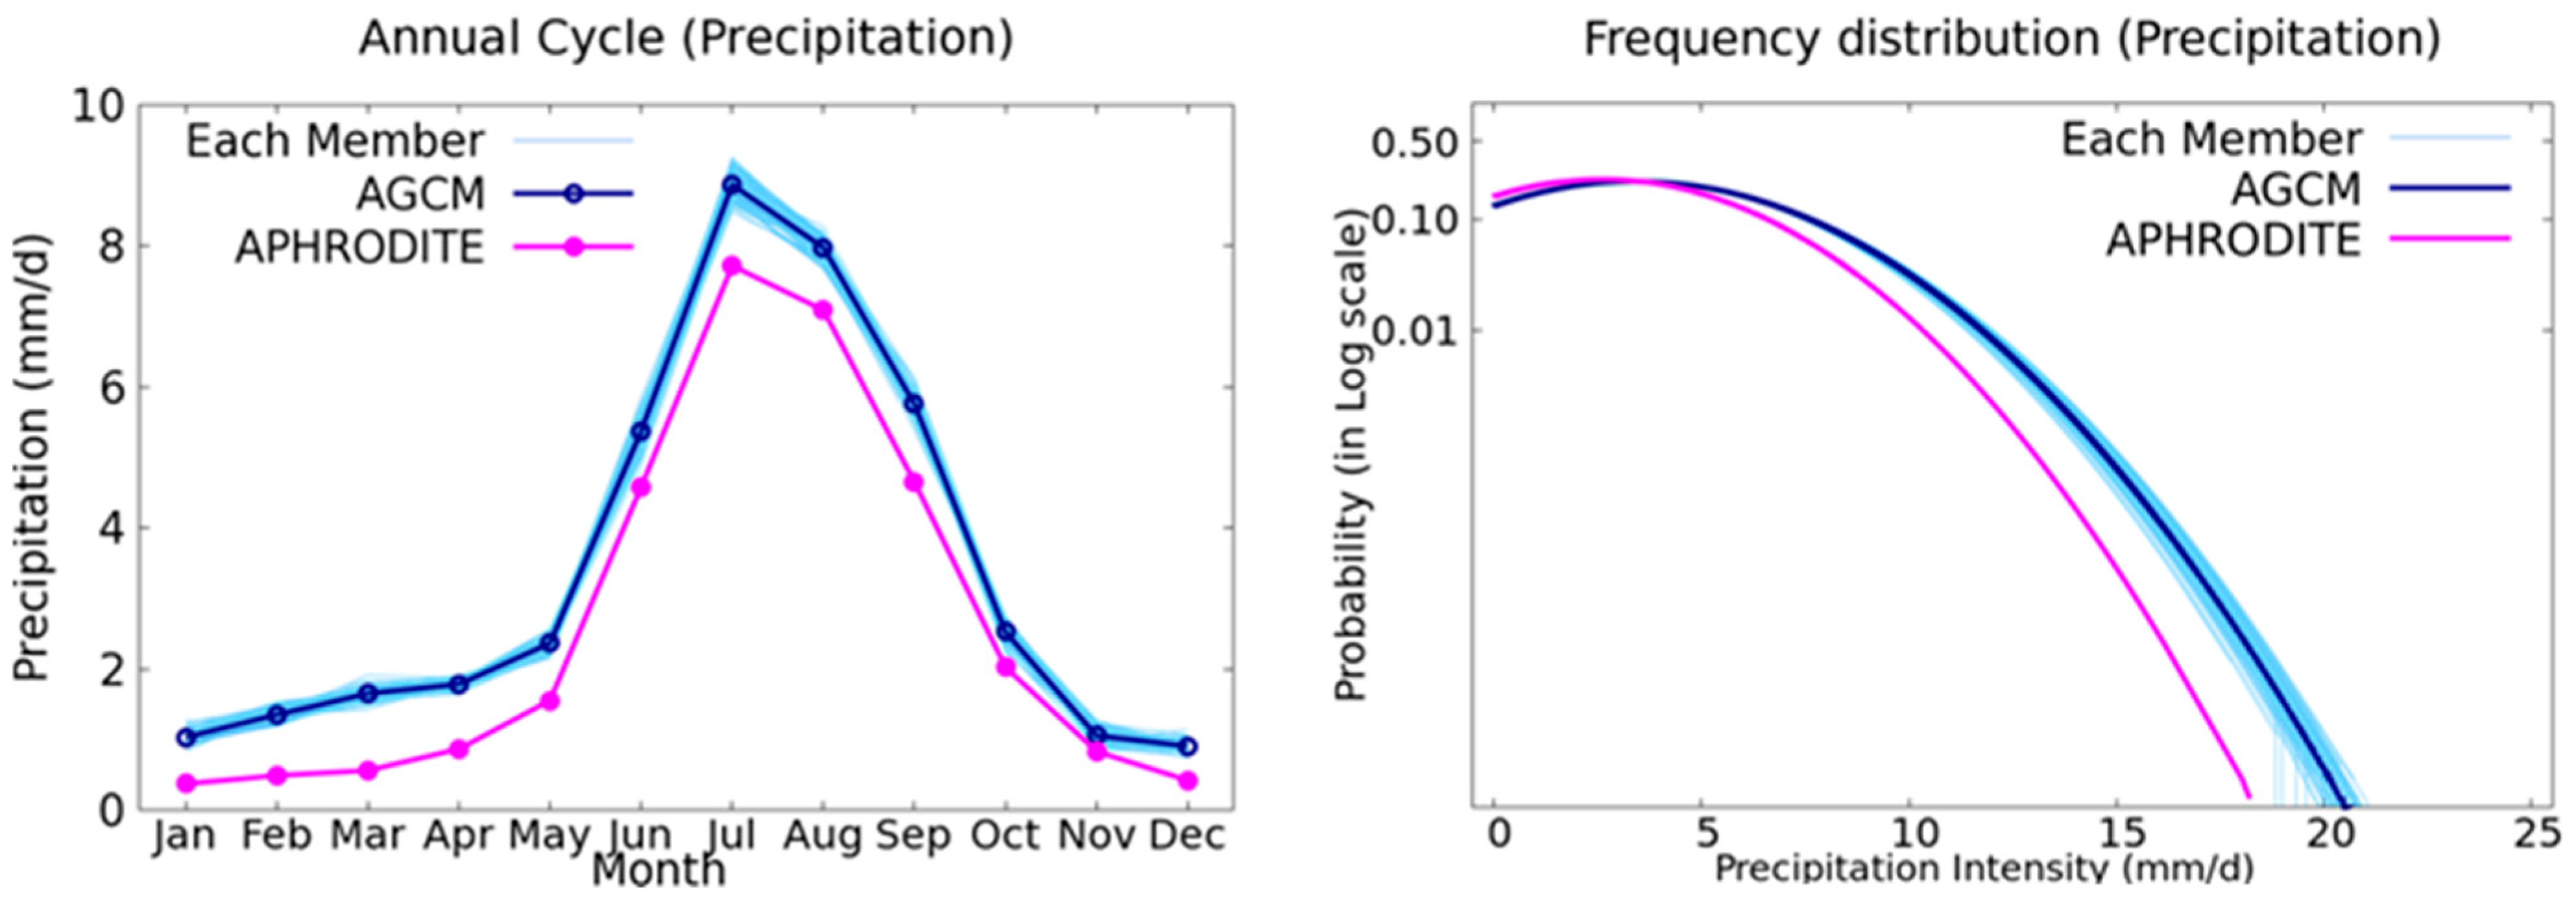
Figure 2 presents the annual cycle and frequency distribution of rainfall climatology over India between 1961 and 2000, as observed by APHRODITE and simulated by the AGCM model. The monsoon season from June to September, which aligns with the southwest monsoon, shows the highest amount of rainfall in both datasets. The peak of the rainfall amount is observed in July, and the rainfall amount starts decreasing in August and September. The rainfall amount during the winter season (December to February) is relatively low over most of the Indian region. The comparison between the AGCM model and APHRODITE observation shows that both distributions display the same qualitative features, which suggests that the model has successfully captured the broad characteristics of rainfall climatology over India. However, there is a slight difference between the model and observation as the AGCM model tends to overestimate the rainfall amount by about 1 mm/d. Additionally, the model is found to capture the annual cycle and frequency distribution of rainfall for the period 1961–2000 quite well. Specifically, the model accurately captures the highest amount of precipitation in the month of July, as observed in APHRODITE. The model accurately represents the amount of rainfall for the months of May, June, and September through December, and this is supported by observations. However, there are some inconsistencies between the model and observation in terms of maximum rainfall intensity, with the model showing a higher intensity of about 20 mm/d compared to the observed value of around 18 mm/d. Despite this, the model is able to accurately represent the frequency of rainfall with an intensity of less than about 7 mm/day, which is an important parameter for understanding the hydrological cycle over India. Each member of the ensemble produces results with similar magnitudes, and there is not much difference between them. The spread of the model’s output is only ±0.5 mm/d, indicating a low level of uncertainty in the model’s predictions. In other words, the ensemble model’s results are consistent and reliable, with little variability among the different members of the model.
Similar studies have been conducted in the past that compare climate models with observations. For instance, Kumar et al. [34] compared the performance of the CMIP5 climate models with observations of temperature and precipitation across the globe. They found that the model had relatively good skill in reproducing the temperature and precipitation patterns, but there were still some discrepancies in terms of the timing and intensity of extreme events. Another study by Nayak et al. [30] assessed the performance of the regional climate modeling system (RegCM4) in India. They found that the RegCM4 was able to capture the observed temperature and rainfall patterns reasonably well, but there were still some inconsistencies in the spatial distribution and intensity of precipitation, particularly in mountainous regions. Overall, these studies and our study indicate that climate models can reproduce the broad characteristics of climate patterns, including mean rainfall distribution, annual cycle, and frequency distribution, but there are still limitations and uncertainties associated with their performance.

3.2. Future Changes in the Rainfall Characteristics

3.2.1. Rainfall Climatology

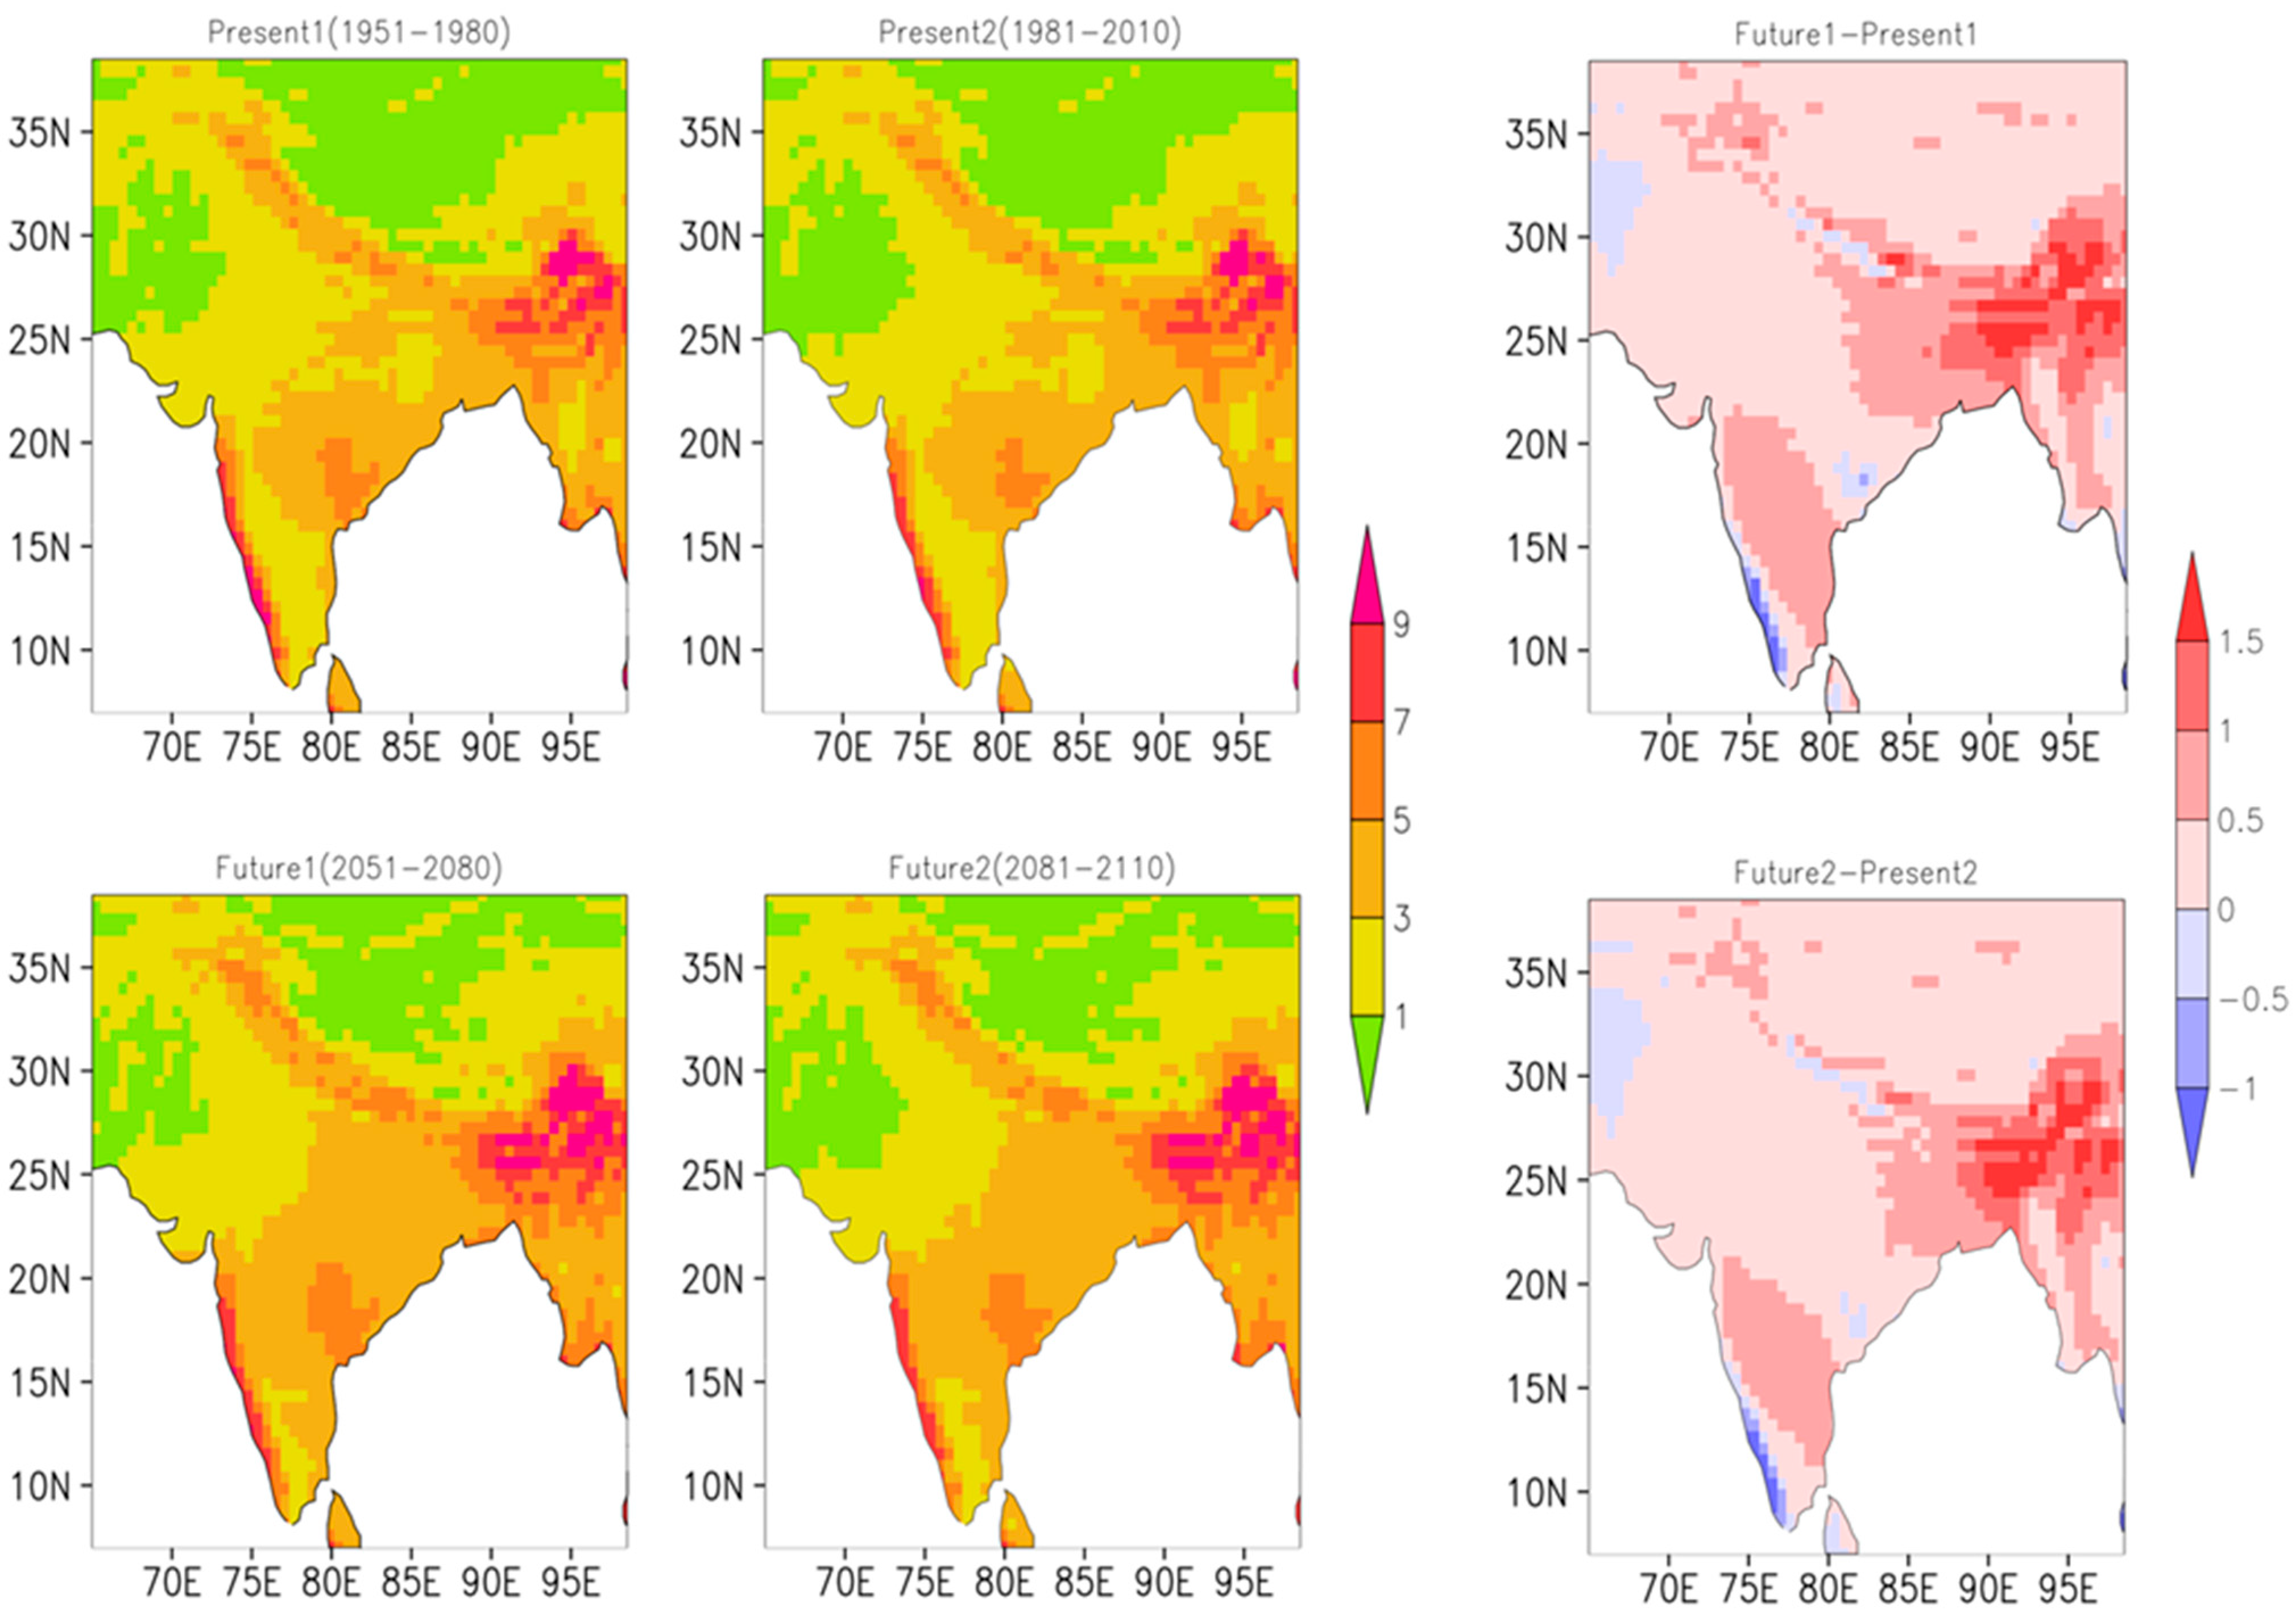
Figure 3 depicts the rainfall climatology for two climate periods of the present day (1951–1980 and 1981–2010), as well as for near future (2051–2080) and far future periods (2081–2110). It shows that the rainfall pattern in 1981–2010 and 1951–1980 is almost the same over almost all regions of India. Similarly, the rainfall pattern during 2051–2080 and 2081–2110 is also almost the same over most of the regions of India. However, the rainfall is increased in both near and far futures by about 1.5 mm/d over almost all regions. Overall, the rainfall events in the future are likely to carry more rainfall to entire Indian regions, with stronger rainfall events predicted over the northeast and southern regions. However, our analysis showed a decrease in rainfall amount along the Western Ghats. We performed the Student’s t-test at each grid point over India at a 95% significance level with the null hypothesis as there is no significant difference in rainfall between the climate periods—1951–1980 and 2051–2080 and 1981–2010 and 2081–2110—in India. We obtained a lower p-value, which means that the differences in rainfall between the climate periods are unlikely to occur by chance. Therefore, the null hypothesis was not supported, and the alternative hypothesis was favored, demonstrating a noteworthy difference in rainfall patterns across these climate periods over India.
There are several studies that have investigated changes in rainfall patterns over India for different climate periods. Goswami et al. [6] examined changes in rainfall patterns over India for the period 1951 to 2000 and found that there has been a significant increase in rainfall during the monsoon season, particularly over the northern regions of India. Another study by Krishnan et al. [7] projected changes in monsoon rainfall over India during the period of 2071–2100 based on different climate scenarios. The study found that there is a high likelihood of increased monsoon rainfall over most regions of India during this period. Chaturvedi et al. [20] projected changes in rainfall patterns over India during the period of 1860–2099 based on different climate scenarios. The study found an increase in rainfall under the warming scenario over most regions of India, with some regions experiencing more significant changes than others. Nayak and Takemi [29] analyzed rainfall trends over India for the periods 1951–2010 and 2051–2100 with a 4K warming and found that there has been an overall increase in rainfall during the period of 2051–2110 compared to the reference period 1951–2051. Overall, the findings of various studies, along with our study, suggest that there is a likelihood of an increase in rainfall over most regions of India in the near and far future. While the specific reasons behind this increase in rainfall may vary, climate change and global warming are known to have an impact on precipitation patterns [24]. As the Earth’s temperature continues to rise, it is expected that the atmospheric moisture content and water cycle will also change, leading to changes in precipitation patterns over different regions (we have discussed more on this in Section 4).

3.2.2. Annual Cycle

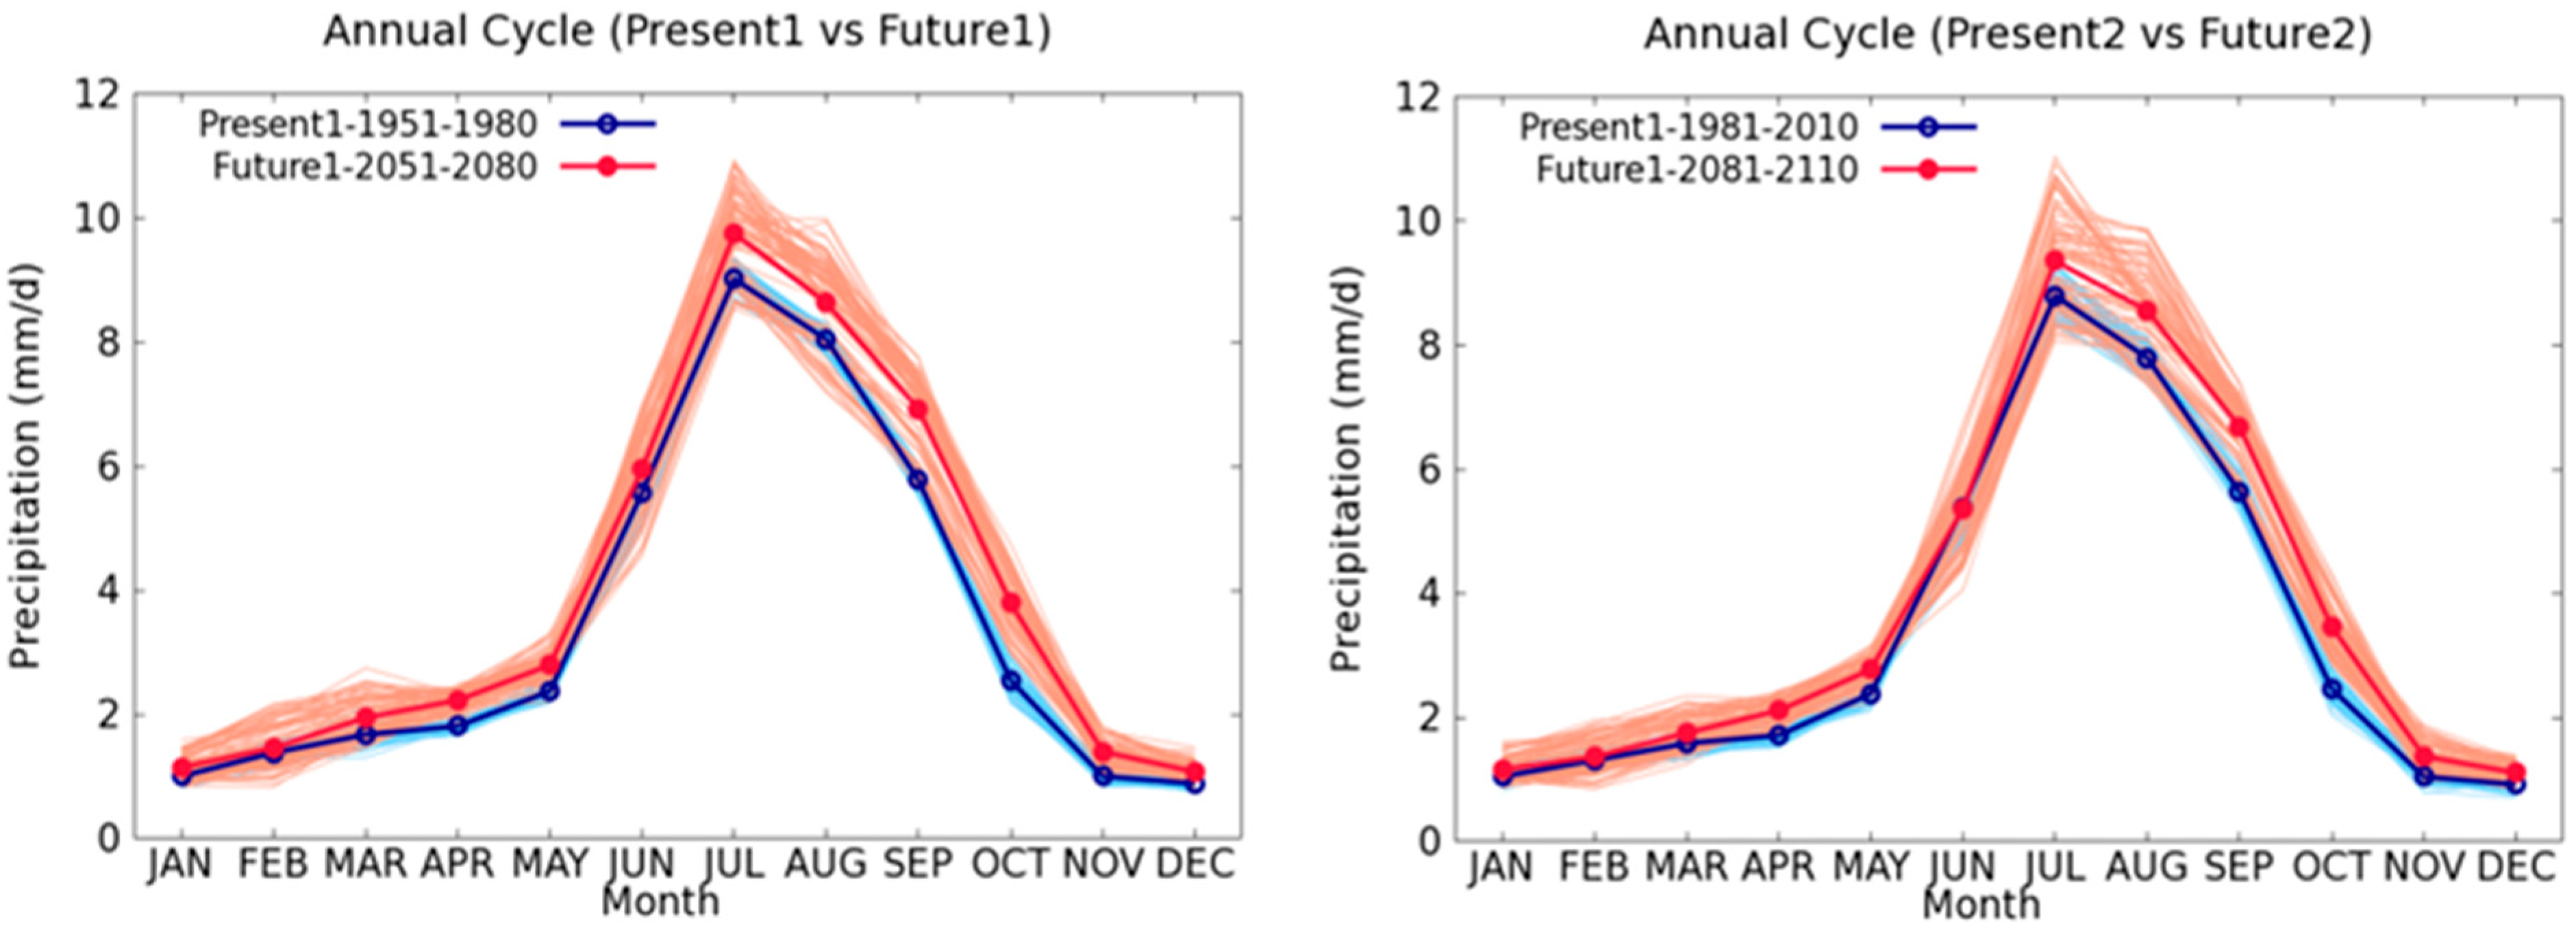
Figure 4 shows the annual cycle of rainfall climatology during two present-day and two future-day climate periods over India. We find that the annual cycle in both present-day climate periods is almost the same, suggesting consistency in the rainfall patterns over India during this time. Similarly, the annual cycle in both future-day climate periods is also almost the same. However, our findings indicate that the warming climate is likely to lead to higher intensified rainfall events in the monsoon and autumn seasons, particularly between July and October. Specifically, we project that the amount of rainfall in July is expected to increase by approximately 1 mm/d in the near future climate, while in August, it is projected to increase by approximately 0.8 mm/d. In September and October, we expect to see a larger increase in rainfall intensity, with an anticipated increase of approximately 1.5 mm/d and 1.7 mm/d, respectively. In the far future climate, we predict even larger increases in precipitation. Specifically, we project that there will be an increase of approximately 0.8 mm/d in July, approximately 1 mm/d in August, and approximately 1.4 mm/d in September and October. Overall, our findings suggest that climate change is likely to have a significant impact on rainfall patterns and intensity, particularly during the monsoon and autumn seasons. The ensemble predicts a spread of ±1 mm/d in the future climate, which means that there is a potential variation of up to 1 mm/d in the predicted rainfall amount. This variation is an uncertainty and implies that while the ensemble model predicts an increase in rainfall in the future climate, the amount of increase is not certain and could range from no additional increase to a further increase of up to 1 mm/d.
The findings suggest that India is expected to experience more precipitation during these periods in the coming years, which could have noteworthy effects on agriculture, water resource management, and the prevalence of natural disasters such as floods. It should be noted that this study employs a range of potential outcomes using ensemble members, and all the individual members show similar changes in rainfall patterns. This increases the confidence in the results and suggests that the increased rainfall intensity is a robust and reliable projection for the future climate. Despite the projected increase in rainfall intensity during the monsoon and autumn seasons, the study finds that there are no major changes in the rainfall amount for other months. This suggests that the changes in rainfall patterns are season-specific and do not affect the overall annual rainfall amount significantly. It is also important to note that most assembly models tend to decrease in accuracy as the projection period increases. This is because the accuracy of assembly models depends on the assumption that the relationships between different variables, such as temperature, precipitation, and atmospheric pressure, remain stable over time. However, as climate change accelerates, these relationships may change in ways that are difficult to predict, leading to reduced accuracy in assembly models. It is, therefore, necessary to consider this circumstance when interpreting the results of assembly models and making decisions based on their projections. To improve the accuracy of long-term projections, it may be necessary to use alternative modeling approaches that explicitly account for the changing relationships between different variables in a changing climate.
Several other studies [16,17,35,36,37] have also analyzed the changes in the annual cycle of rainfall climatology over India in response to future climate scenarios, and their findings are generally consistent with our results. Kumar et al. [35] examined the impact of greenhouse gas-induced warming on the monsoon precipitation over India using high-resolution atmospheric models. The study found that the monsoon precipitation would increase by 5–10% under the future warming scenario, with a stronger increase in the rainfall intensity during the latter part of the monsoon season. Similarly, Shahi et al. [36] analyzed the changes in the annual cycle of rainfall over India in response to future climate scenarios using multiple climate models. The study found that the rainfall intensity would increase during the monsoon season, with a higher increase over the northwestern and central parts of India. The study also found that the rainfall amount in other months would not change significantly. Another study by Seth et al. [38] analyzed the changes in the annual cycle of rainfall over India using the CMIP5 climate model. The study found that the countries of South and Southeast Asia show rainfall increases during most of the rainy seasons in the future warming scenario, with a higher increase in the later part of the monsoon season. The study also found that the rainfall intensity would increase during the monsoon season, leading to a higher risk of floods and other natural disasters.

3.2.3. Frequency Distribution

Figure 5 presents the frequency distribution of rainfalls over India for the aforementioned periods. The results indicated that there is an increase in the frequency and intensity of both the present-day climate periods during their corresponding warming periods. This indicates that under the warming scenario, there will be more rainfall events in India, which will occur more frequently and with greater intensity. Additionally, under a warming scenario, there is a predicted increase in the frequency and intensity of more intense rainfall events (averaging over 20 mm/d) over India. According to the ensembles, the spread of rainfall events in the future climate gradually increases, ranging from no further change in light rainfall events to an additional spread of up to ±5 mm/d in heavy rainfall events. This suggests that there could be a significant increase in the spread of heavy rainfall events in the future climate, while the spread of light rainfall events is expected to remain relatively stable. This suggests that there will be more instances of heavy rainfall over India, which could have significant implications for the country’s water resources and infrastructure. Notably, the outcomes obtained from each of the ensemble experiments demonstrate similar attributes of intensity and frequency for both the near future and far future periods. This strengthens the robustness of the findings, indicating that the observed trends are likely to persist under various climate scenarios.
A study by Kumari and Kumar [39] examined the projected changes in precipitation characteristics over India under future climate scenarios. They found that there would be an increase in the extreme precipitation events and their intensity over the country, particularly during the monsoon season. Similarly, Chaubey et al. [40] also reported an increase in extreme precipitation events and their intensity over India, particularly during the monsoon season. In comparison, a few studies [41,42] found that some Indian regions may not experience a significant change in the extreme precipitation events between present and future climate scenarios. However, these studies reported an increase in the intensity of such events. Overall, while there may be some differences in the specific findings of each study, all of them indicate that extreme precipitation events over India are expected to become both more frequent and intense under future climate scenarios.

4. Discussion and Conclusions

Our study analyzed 190 ensemble experiments to explore rainfall patterns over India during the past 60 years and predict their future changes for the next 100 years. Our focus was on three key aspects of rainfall: amounts, intensities, and frequency distributions. Specifically, we examined two climate periods, 1951–1980 and 1981–2010, for present-day and their projected changes in the near and far future (2051–2080 and 2081–2110). We found that some southern regions and northeast India received heavy rainfall during 1951–2010 and are likely to receive even more in a warming climate (2051–2110). We also found that under a warming scenario, rainfall events are expected to bring more precipitation to nearly all regions of India.
To better understand the mechanisms behind the projected increase in rainfall over India in the future climate, we examined two key factors: surface-specific humidity (Figure 6) and vertical air motion (Figure 7). Our analysis indicates that in both future climate periods, there is a stronger upward motion of air in a warming scenario than in the present climate. Furthermore, we anticipate that specific humidity over the Indian region will rise in response to the warming scenario. This increase in specific humidity and upward motion of air could explain the anticipated intensification of rainfall over India under future warming climate conditions [4,43,44,45,46,47,48,49]. However, it is worth noting that our analysis also indicated weaker vertical motion of air in warming scenarios over the Western Ghats areas. This could lead to decreased precipitation along the coast of western India, particularly along the Western Ghats. This phenomenon has been documented in previous research. For example, wind patterns and atmospheric circulation across the Arabian Sea can have a significant impact on monsoon rainfall over the Western Ghats region [2]. Similarly, a decrease in low-level convergence along the western coast of India can result in diminished rainfall over the area [9].
Furthermore, previous studies indicated that changes in the SST and wind fields over the Arabian Sea would impact the rainfall distribution over the Indian subcontinent [3,50]. Similarly, changes in the SST and atmospheric circulation would affect the frequency and intensity of tropical cyclones that hit the west coast of India, which may, in turn, affect the precipitation patterns in the region [50]. Our finding, combined with previous studies, suggest that the weakening of the vertical motion of air over the Western Ghats region in a future climate can have significant implications for the precipitation patterns along the coast of western India, and further research is needed to understand the underlying mechanisms and potential impacts on the region’s water resources, agriculture, and ecosystem.
We further find that as the climate warms, the intensity and frequency of heavier rainfall events over India, which are defined as those exceeding 20 mm/day on an areal average, are likely to increase. Moreover, analyzing the yearly cycles of the rainfall patterns indicates that the intensities of these heavier rainfall events are projected to increase significantly between July and October. This study aligns with earlier research that has emphasized the impact of climate change on extreme rainfall events, particularly over the South Asian region. For instance, Mishra [21] observed an increase in the intensity and frequency of heavy rainfall events over India during recent decades, which is in line with the warming trend experienced in the region. In addition, Chaubey et al. [51] indicated that climate change has made extreme precipitation events more probable over the Indian subcontinent. A separate study conducted by Pai et al. [52] found a significant rise in the number of extreme precipitation events over India during the past few decades, with a notable increase in the intensity of these events.
The overall study suggests that under a warming scenario, water-related disasters such as local flooding and landslides would be much worse in India. These findings have significant implications for future climate scenarios in India and can help guide the development of effective strategies for water resource management and disaster risk reduction. The study offers valuable insights into how climate change affects rainfall patterns in India, which can inform policy and decision-making to reduce the impact of climate change. In summary, analyzing the climate periods of this study can help us better comprehend the alterations in rainfall trends resulting from global warming. This information is essential for stakeholders and policymakers to make informed decisions.
We recognize that there is the potential for bias to be present. However, we chose not to correct it in this study because we used large ensemble datasets. Bias correction involves adjusting the data to remove any systematic errors that may be present, and it can be a significant and time-consuming task, especially when working with large datasets. In our case, correcting for bias in each individual ensemble would have been a major focus that was beyond the scope of this particular study. Therefore, we recommend further exploration of different bias correction techniques and evaluation of their effectiveness in reducing potential biases in the data. This would not only improve the accuracy and reliability of future analyses but also enhance our understanding of the topic being studied.

Funding

This study was supported by the Integrated Research Program for Advancing Climate Models (TOUGOU, Grant Number JPMXD0717935498) and Program for the advanced studies of climate change projection (SENTAN, Grant Number JPMXD0722678534) funded by the Ministry of Education, Culture, Sports, Science and Technology of Japan, Government of Japan.

Data Availability Statement

This study utilized the database for Policy Decision-making for Future climate change (d4PDF) and the Asian Precipitation-Highly-Resolved Observational Data Integration Towards Evaluation (APHRODITE) daily datasets, which are available at http://search.diasjp.net/en/dataset/d4PDF_RCM (accessed on 12 December 2021) and https://www.chikyu.ac.jp/precip/english/ respectivelly (accessed on 12 December 2021).

Acknowledgments

This study utilized the database for Policy Decision-making for Future climate change (d4PDF), which was archived from the Data Integration and Analysis System (DIAS). The Disaster Prevention Research Institute (DPRI), Kyoto University, Japan, and Tetsuya Takemi, (DPRI), are acknowledged for providing research facilities to conduct this work.

Conflicts of Interest

The authors declare that they have no known competing financial interest or personal relationships that could have appeared to influence the work reported in this paper.

References

  1. IPCC. Managing the risks of extreme events and disasters to advance climate change adaptation. In A Special Report of Working Groups I and II of the Intergovernmental Panel on Climate Change; Field, C.B., V. Barros, T.F., Stocker, D., Qin, D.J., Dokken, K.L., Ebi, M.D., Mastrandrea, K.J., Mach, G.-K., Plattner, S.K., Allen, M., et al., Eds.; Cambridge University Press: Cambridge, UK; New York, NY, USA, 2012; 582p. [Google Scholar]
  2. Rajeevan, M.; Bhate, J.; Jaswal, A.K. Analysis of variability and trends of extreme rainfall events over India using 104 years of gridded daily rainfall data. Geophys. Res. Lett. 2008, 35. [Google Scholar]
  3. Falga, R.; Wang, C. The rise of Indian summer monsoon precipitation extremes and its correlation with long-term changes of climate and anthropogenic factors. Sci. Rep. 2022, 12, 11985. [Google Scholar] [CrossRef] [PubMed]
  4. IPCC. Climate Change 2014: Synthesis Report. In Contribution of Working Groups I, II and III to the Fifth Assessment Report of the Intergovernmental Panel on Climate Change; IPCC: Geneva, Switzerland, 2014. [Google Scholar]
  5. Prakash, S.; Mitra, A.K.; Momin, I.M.; Rajagopal, E.N.; Basu, S.; Collins, M.; Turner, A.G.; Rao, K.A.; Ashok, K. Seasonal intercomparison of observational rainfall datasets over India during the southwest monsoon season. Int. J. Climatol. 2015, 35, 2326–2338. [Google Scholar] [CrossRef]
  6. Goswami, B.N.; Venugopal, V.; Sengupta, D.; Madhusoodanan, M.S.; Xavier, P.K. Increasing trend of extreme rain events over India in a warming environment. Science 2006, 314, 1442–1445. [Google Scholar] [CrossRef] [PubMed]
  7. Krishnan, R.; Sanjay, J.; Gnanaseelan, C.; Mujumdar, M.; Kulkarni, A.; Chakraborty, S. Assessment of Climate Change over the Indian Region: A Report of the Ministry of Earth Sciences (MOES), Government of India; Springer Nature: Berlin/Heidelberg, Germany, 2020; p. 226. [Google Scholar]
  8. Nayak, S.; Takemi, T.; Maity, S. Precipitation and Temperature Climatologies over India: A Study with AGCM Large Ensemble Climate Simulations. Atmosphere 2022, 13, 671. [Google Scholar] [CrossRef]
  9. Kottayil, A.; Xavier, A.; Xavier, P.; Koovekkallu, P.; Mohanakumar, K. Evolution of largescale factors influencing extreme rainfall over south western coast of India. Int. J. Climatol. 2022, 42, 4164–4178. [Google Scholar] [CrossRef]
  10. Jain, S.K.; Kumar, V. Trend analysis of rainfall and temperature data for India. Curr. Sci. 2012, 102, 37–49. [Google Scholar]
  11. Singh, D.; Ghosh, S.; Roxy, M.K.; McDermid, S. Indian summer monsoon: Extreme events, historical changes, and role of anthropogenic forcings. Wiley Interdiscip. Rev. Clim. Change 2019, 10, e571. [Google Scholar] [CrossRef]
  12. Nayak, S.; Mandal, M.; Maity, S. Assessing the impact of Land-use and Land-cover changes on the climate over India using a Regional Climate Model (RegCM4). Clim. Res. 2021, 85, 1–20. [Google Scholar] [CrossRef]
  13. Maity, S.; Nayak, S.; Singh, K.S.; Nayak, H.P.; Dutta, S. Impact of soil moisture initialization in the simulation of Indian summer monsoon using RegCM4. Atmosphere 2021, 12, 1148. [Google Scholar] [CrossRef]
  14. Kishore, P.; Jyothi, S.; Basha, G.; Rao, S.V.B.; Rajeevan, M.; Velicogna, I.; Sutterley, T.C. Precipitation climatology over India: Validation with observations and reanalysis datasets and spatial trends. Clim. Dyn. 2016, 46, 541–556. [Google Scholar] [CrossRef]
  15. Akhter, J.; Das, L.; Deb, A. CMIP5 ensemble-based spatial rainfall projection over homogeneous zones of India. Clim. Dyn. 2017, 49, 1885–1916. [Google Scholar] [CrossRef]
  16. Maity, S.; Satyanarayana, A.N.V.; Mandal, M.; Nayak, S. Performance evaluation of land surface models and cumulus convection schemes in the simulation of Indian summer monsoon using a regional climate model. Atmos. Res. 2017, 197, 21–41. [Google Scholar] [CrossRef]
  17. Maity, S.; Mandal, M.; Nayak, S.; Bhatla, R. Performance of cumulus parameterization schemes in the simulation of Indian Summer Monsoon using RegCM4. Atmósfera 2017, 30, 287–309. [Google Scholar] [CrossRef]
  18. Nayak, S.; Mandal, M.; Maity, S. Customization of regional climate model (RegCM4) over Indian region. Theor. Appl. Climatol. 2017, 127, 153–168. [Google Scholar] [CrossRef]
  19. Nayak, S.; Mandal, M.; Maity, S. RegCM4 simulation with AVHRR land use data towards temperature and precipitation climatology over Indian region. Atmos. Res. 2018, 214, 163–173. [Google Scholar] [CrossRef]
  20. Chaturvedi, R.K.; Joshi, J.; Jayaraman, M.; Bala, G.; Ravindranath, N.H. Multi-model climate change projections for India under representative concentration pathways. Curr. Sci. 2012, 103, 791–802. [Google Scholar]
  21. Mishra, A.K. Quantifying the impact of global warming on precipitation patterns in India. Meteorol. Appl. 2019, 26, 153–160. [Google Scholar] [CrossRef]
  22. Adger, W.N.; Huq, S.; Brown, K.; Conway, D.; Hulme, M. Adaptation to climate change in the developing world. Prog. Dev. Stud. 2003, 3, 179–195. [Google Scholar] [CrossRef]
  23. Abbass, K.; Qasim, M.Z.; Song, H.; Murshed, M.; Mahmood, H.; Younis, I. A review of the global climate change impacts, adaptation, and sustainable mitigation measures. Environ. Sci. Pollut. Res. 2022, 29, 42539–42559. [Google Scholar] [CrossRef]
  24. Nayak, S.; Takemi, T. Atmospheric driving mechanisms of extreme precipitation events in July of 2017 and 2018 in western Japan. Dyn. Atmos. Ocean. 2021, 93, 101186. [Google Scholar] [CrossRef]
  25. Tyagi, N.; Jayal, T.; Singh, M.; Mandwal, V.; Saini, A.; Sahu, N.; Nayak, S. Evaluation of Observed and Future Climate Change Projection for Uttarakhand, India, Using CORDEX-SA. Atmosphere 2022, 13, 947. [Google Scholar] [CrossRef]
  26. Maity, S.; Nayak, S.; Nayak, H.P.; Bhatla, R. Comprehensive assessment of RegCM4 towards interannual variability of Indian Summer Monsoon using multi-year simulations. Theor. Appl. Climatol. 2022, 148, 491–516. [Google Scholar] [CrossRef]
  27. Mishra, A.K.; Singh, V.P. Analysis of drought severity area frequency curves using a general circulation model and scenario uncertainty. J. Geophys. Res. Atmos. 2009, 114. [Google Scholar] [CrossRef]
  28. Guntukula, R. Assessing the impact of climate change on Indian agriculture: Evidence from major crop yields. J. Public Aff. 2020, 20, e2040. [Google Scholar] [CrossRef]
  29. Nayak, S.; Takemi, T. Assessing the impact of climate change on temperature and precipitation over India. In Wadi Flash Floods: Challenges and Advanced Approaches for Disaster Risk Reduction; Sumi, T., Kantoush, S.A., Saber, M., Eds.; Wadi Flash Floods. Natural Disaster Science and Mitigation Engineering: DPRI reports; Springer: Singapore, 2022; pp. 121–142. [Google Scholar]
  30. Nayak, S.; Mandal, M.; Maity, S. Performance evaluation of RegCM4 in simulating temperature and precipitation climatology over India. Theor. Appl. Climatol. 2019, 137, 1059–10751. [Google Scholar] [CrossRef]
  31. Dey, P.; Mujumdar, P.P. On the uniformity of rainfall distribution over India. J. Hydrol. 2019, 578, 124017. [Google Scholar] [CrossRef]
  32. Das, L.; Lohar, D. Construction of climate change scenarios for a tropical monsoon region. Clim. Res. 2005, 30, 39–52. [Google Scholar] [CrossRef]
  33. Mizuta, R.; Murata, A.; Ishii, M.; Shiogama, H.; Hibino, K.; Mori, N.; Arakawa, O.; Imada, Y.; Yoshida, K.; Aoyagi, T.; et al. Over 5000 years of ensemble future climate simulations by 60-km global and 20-km regional atmospheric models. Bull. Am. Meteorol. Soc. 2017, 98, 1383–1398. [Google Scholar] [CrossRef]
  34. Kumar, S.; Merwade, V.; Kinter III, J.L.; Niyogi, D. Evaluation of temperature and precipitation trends and long-term persistence in CMIP5 twentieth-century climate simulations. J. Clim. 2013, 26, 4168–4185. [Google Scholar] [CrossRef]
  35. Kumar, P.; Wiltshire, A.; Mathison, C.; Asharaf, S.; Ahrens, B.; Lucas-Picher, P.; Christensen, J.H.; Gobiet, A.; Saeed, F.; Hagemann, S.; et al. Downscaled climate change projections with uncertainty assessment over India using a high resolution multi-model approach. Sci. Total Environ. 2013, 468, S18–S30. [Google Scholar] [CrossRef] [PubMed]
  36. Shahi, N.K.; Das, S.; Ghosh, S.; Maharana, P.; Rai, S. Projected changes in the mean and intra-seasonal variability of the Indian summer monsoon in the RegCM CORDEX-CORE simulations under higher warming conditions. Clim. Dyn. 2021, 57, 1489–1506. [Google Scholar] [CrossRef]
  37. Almazroui, M.; Saeed, S.; Saeed, F.; Islam, M.N.; Ismail, M. Projections of precipitation and temperature over the South Asian countries in CMIP6. Earth Syst. Environ. 2020, 4, 297–320. [Google Scholar] [CrossRef]
  38. Seth, A.; Rauscher, S.A.; Biasutti, M.; Giannini, A.; Camargo, S.J.; Rojas, M. CMIP5 projected changes in the annual cycle of precipitation in monsoon regions. J. Clim. 2013, 26, 7328–7351. [Google Scholar] [CrossRef]
  39. Kumari, A.; Kumar, P. Evaluation and Future Projection of the Extreme Precipitation over India and its homogeneous regions: A Regional Earth System Model Perspective. Int. J. Climatol 2023. [Google Scholar] [CrossRef]
  40. Chaubey, P.K.; Mall, R.K.; Srivastava, P.K. Changes in Extremes Rainfall Events in Present and Future Climate Scenarios over the Teesta River Basin, India. Sustainability 2023, 15, 4668. [Google Scholar] [CrossRef]
  41. Ghosh, S.; Das, D.; Kao, S.C.; Ganguly, A.R. Lack of uniform trends but increasing spatial variability in observed Indian rainfall extremes. Nat. Clim. Chang. 2012, 2, 86–91. [Google Scholar] [CrossRef]
  42. Vittal, H.; Karmakar, S.; Ghosh, S. Diametric changes in trends and patterns of extreme rainfall over India from pre-1950 to post-1950. Geophys. Res. Lett. 2013, 40, 3253–3258. [Google Scholar] [CrossRef]
  43. Nayak, S.; Dairaku, K. Future changes in extreme precipitation intensities associated with temperature under SRES A1B scenario. Hydrol. Res. Lett. 2016, 10, 139–144. [Google Scholar] [CrossRef]
  44. Nayak, S. Do extreme precipitation intensities linked to temperature over India follow the Clausius-Clapeyron relationship? Curr. Sci. 2018, 115, 391–392. [Google Scholar] [CrossRef]
  45. Roxy, M.K.; Ritika, K.; Terray, P.; Murtugudde, R.; Ashok, K.; Goswami, B.N. Drying of Indian subcontinent by rapid Indian Ocean warming and a weakening land-sea thermal gradient. Nat. Commun. 2015, 6, 7423. [Google Scholar] [CrossRef] [PubMed]
  46. Nayak, S.; Dairaku, K.; Takayabu, I.; Suzuki-Parker, A.; Ishizaki, N.N. Extreme precipitation linked to temperature over Japan: Current evaluation and projected changes with multi-model ensemble downscaling. Clim. Dyn. 2018, 51, 4385–4401. [Google Scholar] [CrossRef]
  47. Nayak, S.; Takemi, T. Dependence of extreme precipitable water events on temperature. Atmósfera 2019, 32, 159–265. [Google Scholar] [CrossRef]
  48. Yoshida, K.; Sugi, M.; Mizuta, R.; Murakami, H.; Ishii, M. Future changes in tropical cyclone activity in high resolution large ensemble simulations. Geophys. Res. Lett. 2017, 44, 9910–9917. [Google Scholar] [CrossRef]
  49. Nayak, S.; Takemi, T. Clausius-Clapeyron scaling of extremely heavy precipitations: Case studies of the July 2017 and July 2018 heavy rainfall events over Japan. J. Meteorol. Soc. Jpn. 2020, 98, 1147–1162. [Google Scholar] [CrossRef]
  50. Kabir, R.; Ritchie, E.A.; Stark, C. Tropical Cyclone Exposure in the North Indian Ocean. Atmosphere 2022, 13, 1421. [Google Scholar] [CrossRef]
  51. Chaubey, P.K.; Mall, R.K.; Jaiswal, R.; Payra, S. Spatio-Temporal Changes in Extreme Rainfall Events Over Different Indian River Basins. Earth Space Sci. 2022, 9, e2021EA001930. [Google Scholar] [CrossRef]
  52. Pai, D.S.; Sridhar, L.; Badwaik, M.R.; Rajeevan, M. Analysis of the daily rainfall events over India using a new long period (1901–2010) high resolution (0.25 × 0.25) gridded rainfall data set. Clim. Dyn. 2015, 45, 755–776. [Google Scholar] [CrossRef]
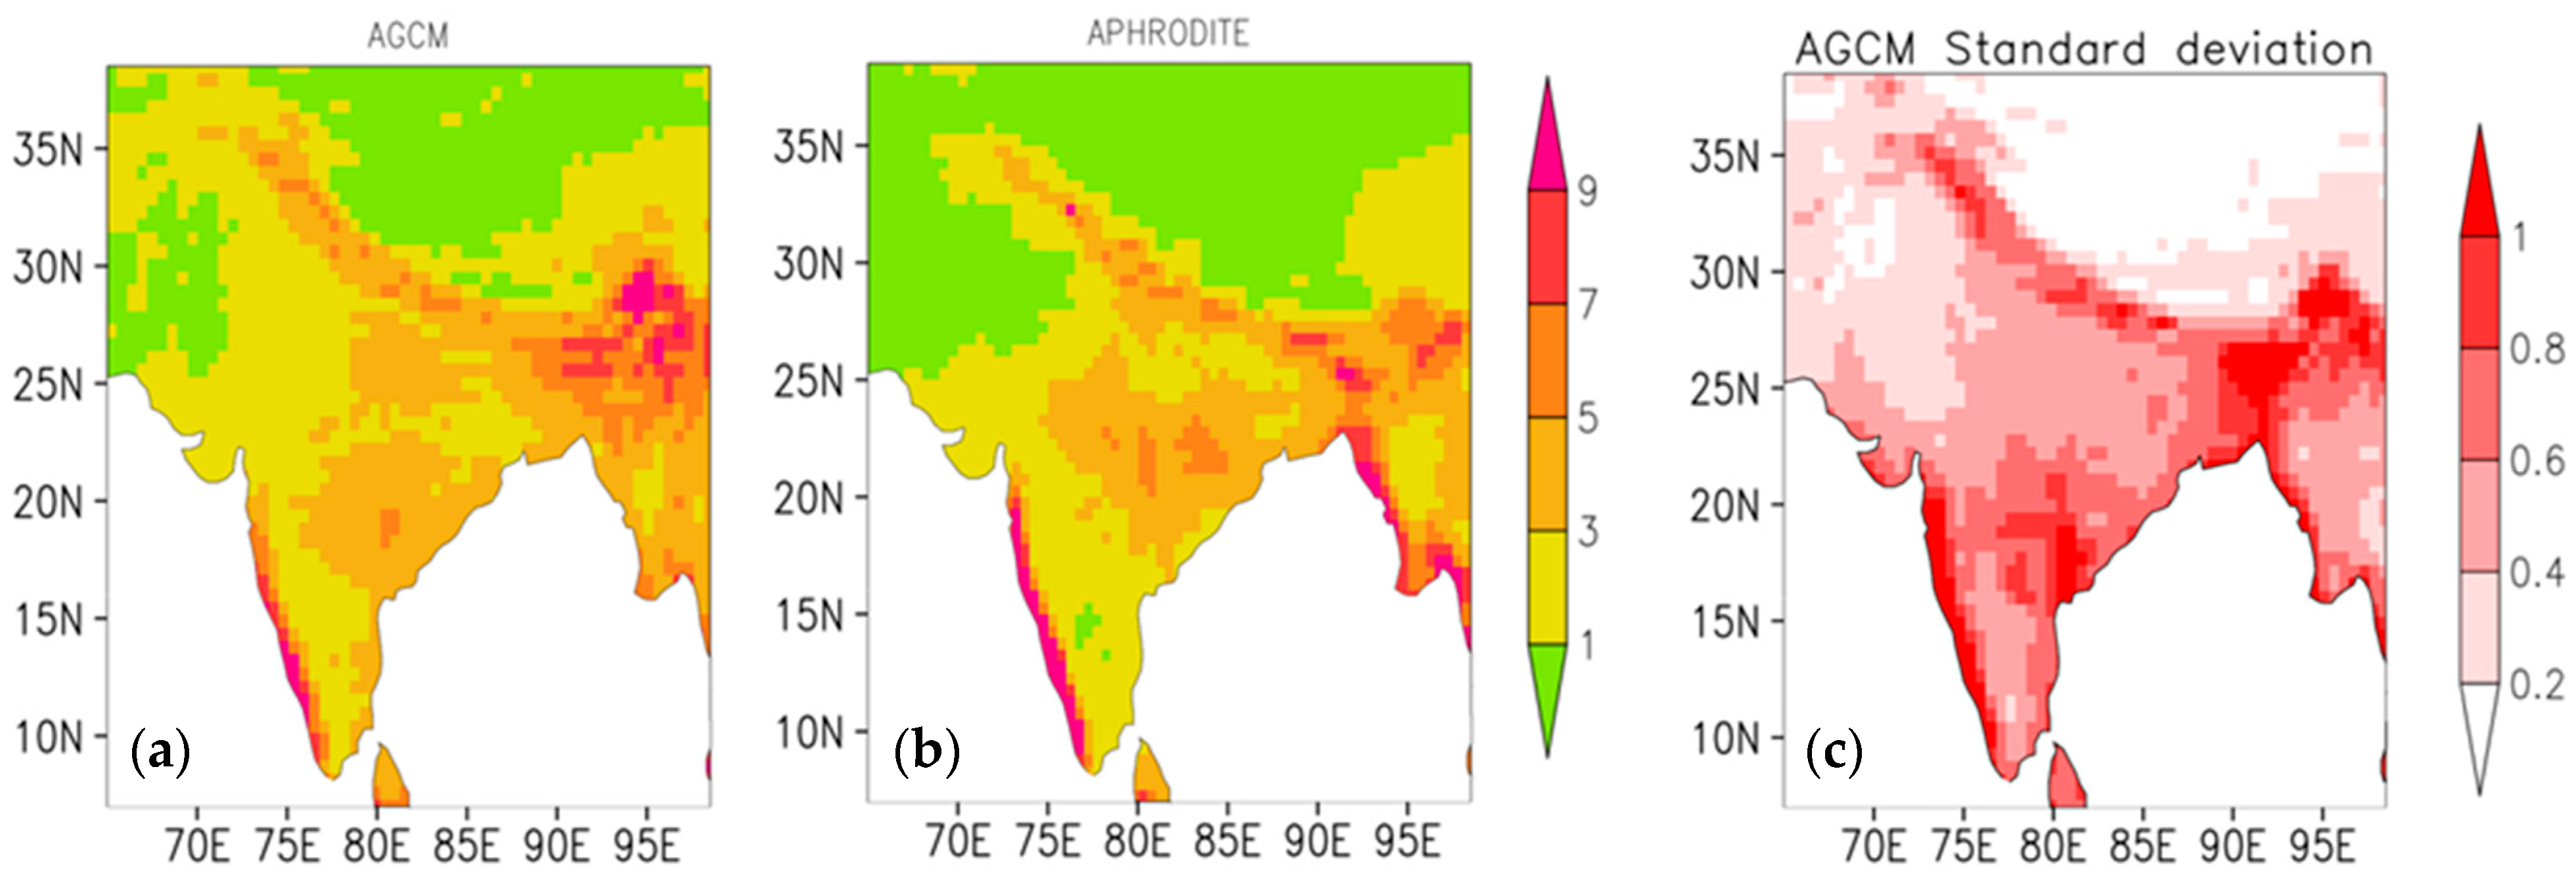
Figure 1. Rainfall climatology (mm/d) for the period 1961–2000 from (a) AGCM; (b) APHRODITE. (c) The standard deviation in the AGCM ensemble from their mean value.
Climate 11 00094 g001
Figure 2. Annual cycle of rainfall climatology and frequency distributions over India for the period 1961–2000.
Climate 11 00094 g002
Figure 3. Rainfall climatology (mm/d) for two climate periods of the present day (1951–1980 and 1981–2010), as well as for near future (2051–2080) and far future periods (2081–2110).
Climate 11 00094 g003
Figure 4. Annual cycle of rainfall climatology for two climate periods of the present day (1951–1980 and 1981–2010), as well as for near future (2051–2080) and far future periods (2081–2110).
Climate 11 00094 g004
Figure 5. Frequency distribution derived from the AGCM ensemble experiment results for two climate periods of the present day (1951–1980 and 1981–2010), as well as for near future (2051–2080) and far future periods (2081–2110).
Climate 11 00094 g005
Figure 6. Specific humidity (g/kg) for two climate periods of the present day (1951–1980 and 1981–2010), as well as for near future (2051–2080) and far future periods (2081–2110).
Climate 11 00094 g006
Figure 7. Vertical velocity (Pa/s) for two climate periods of the present day (1951–1980 and 1981–2010), as well as for near future (2051–2080) and far future periods (2081–2110).
Climate 11 00094 g007
Disclaimer/Publisher’s Note: The statements, opinions and data contained in all publications are solely those of the individual author(s) and contributor(s) and not of MDPI and/or the editor(s). MDPI and/or the editor(s) disclaim responsibility for any injury to people or property resulting from any ideas, methods, instructions or products referred to in the content.