
Assessing Property Exposure to Cyclonic Winds under Climate Change

 ,
, 
Abstract
:1. Introduction
2. Methodology
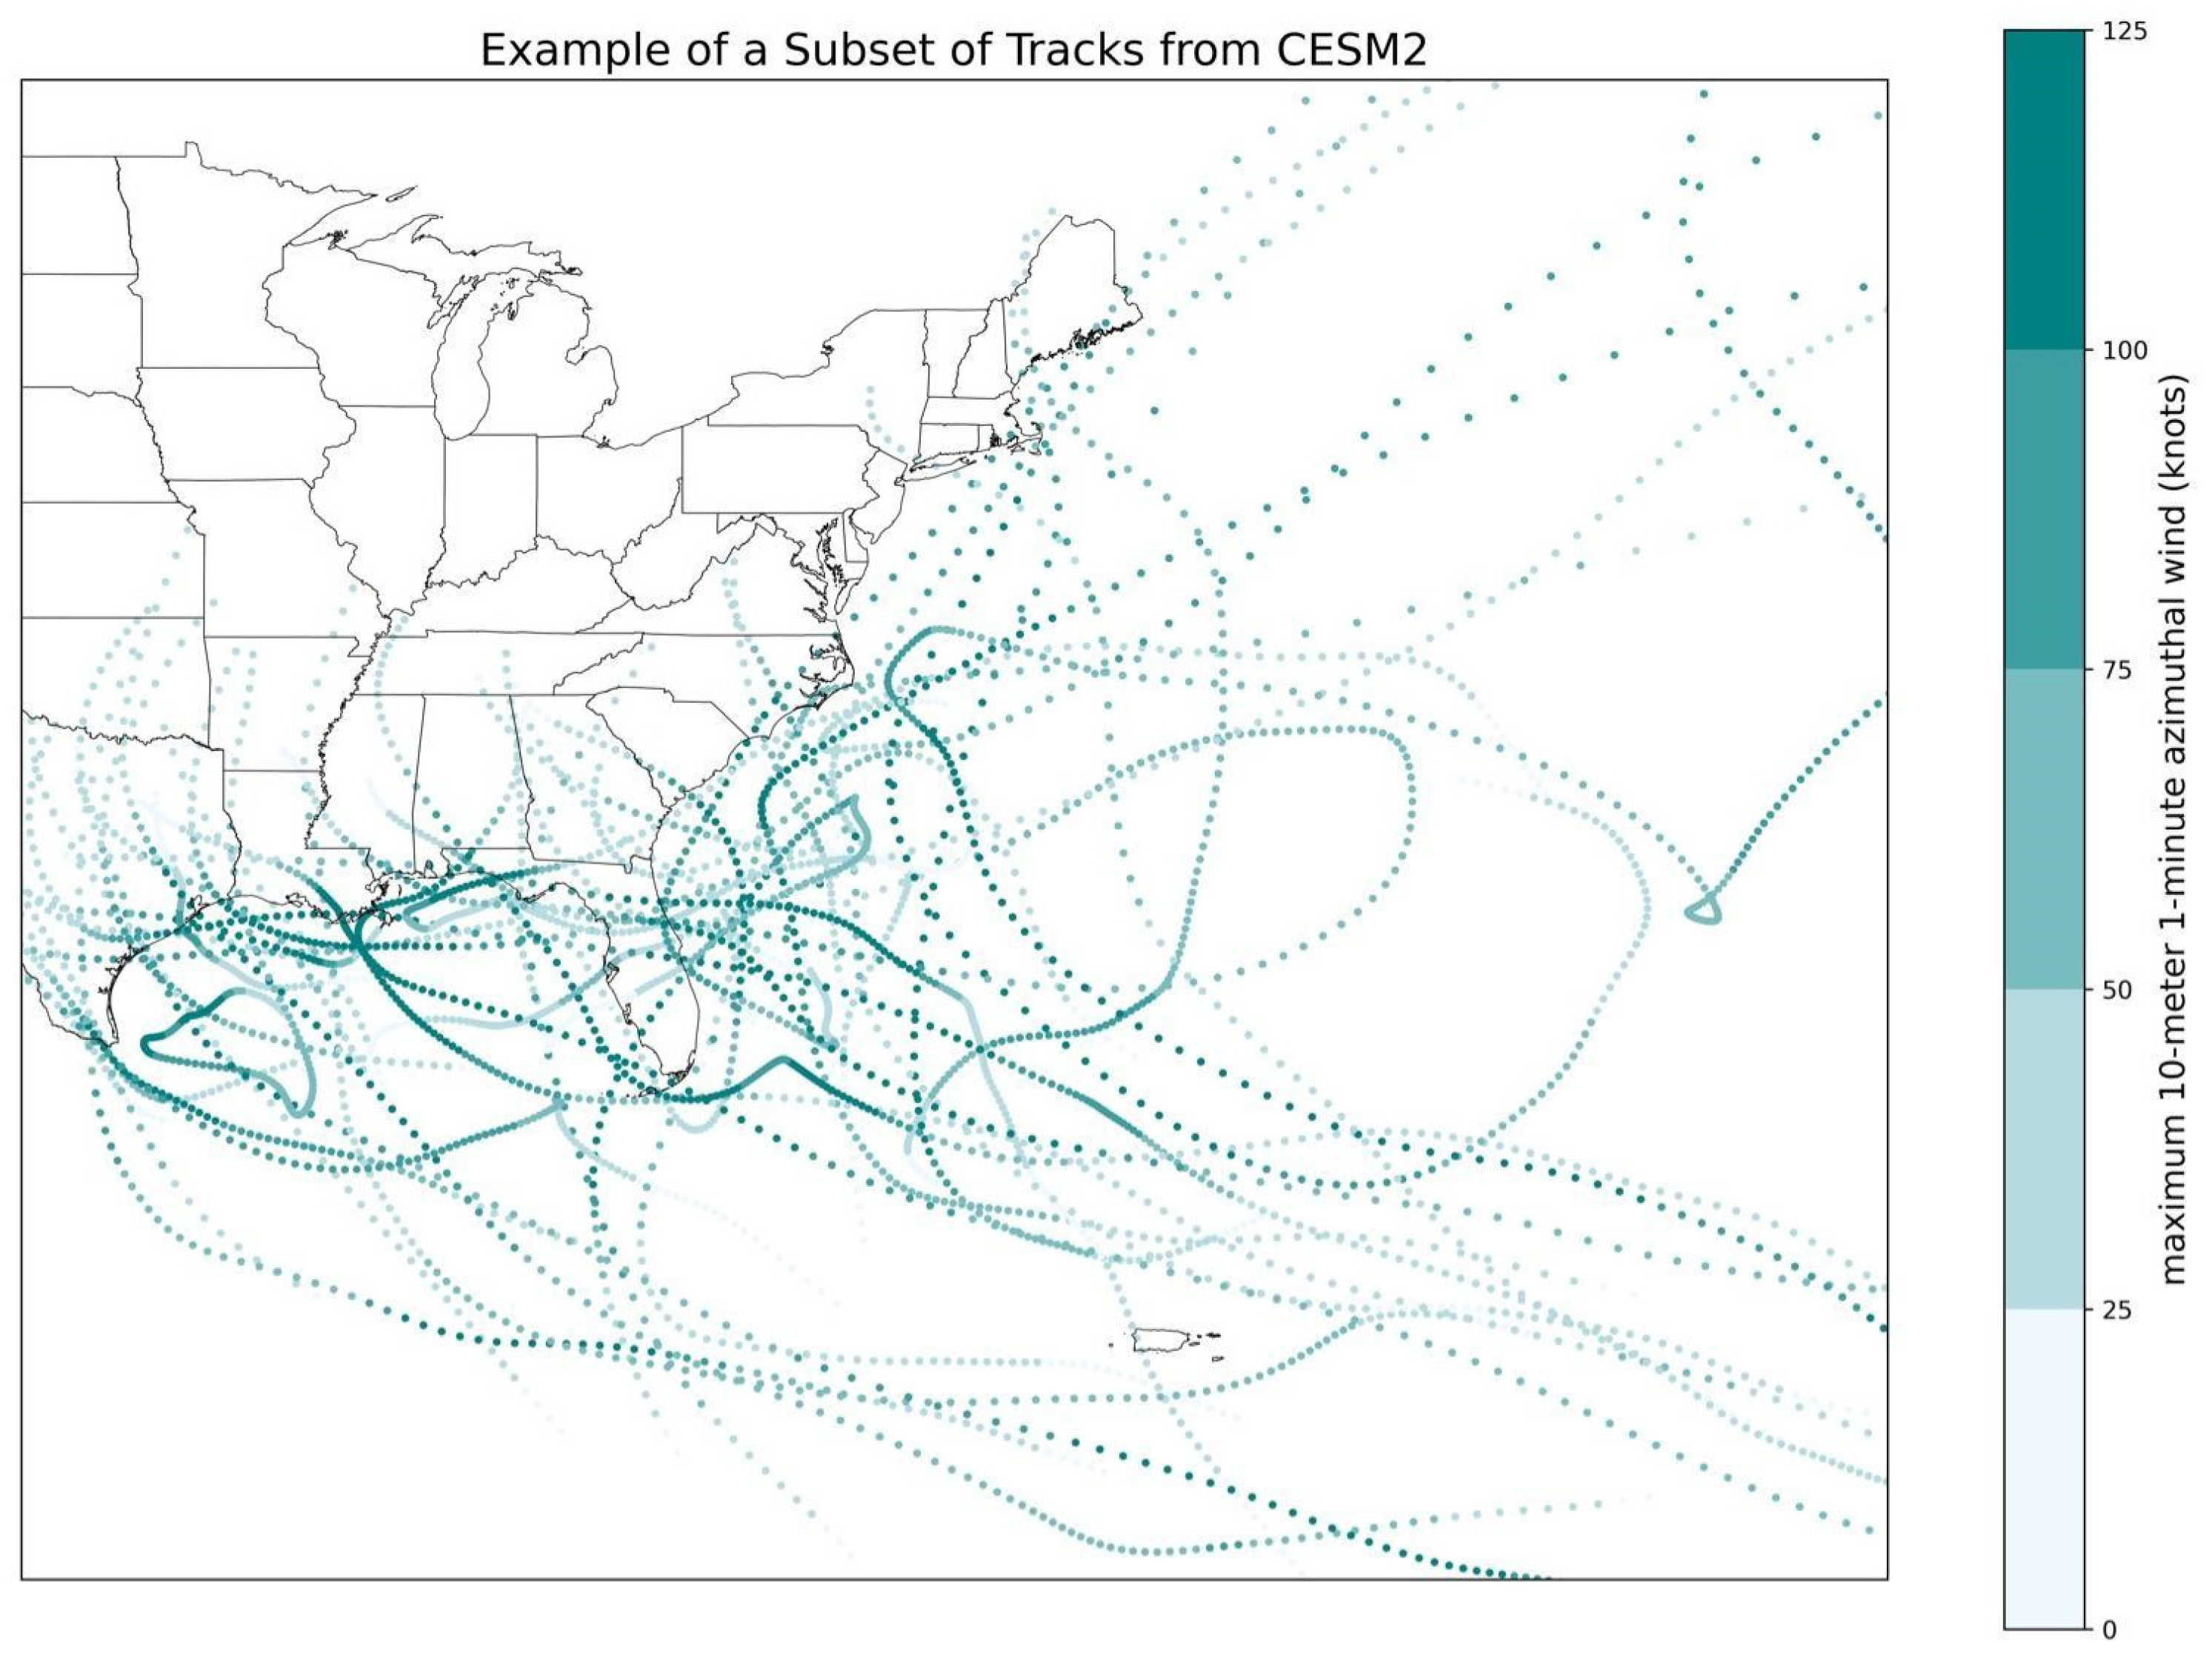
2.1. Hurricane Tracks
2.2. Wind Field Modeling
2.3. Wind Hazard Statistics
2.4. Surface Roughness
- Buildings with a mean roof height of less than or equal to 30 ft = 1500 feet radius;
- Buildings with a mean roof height of greater than 30 ft = 2600 feet radius.
2.5. Calculating Property Exposure
3. Results
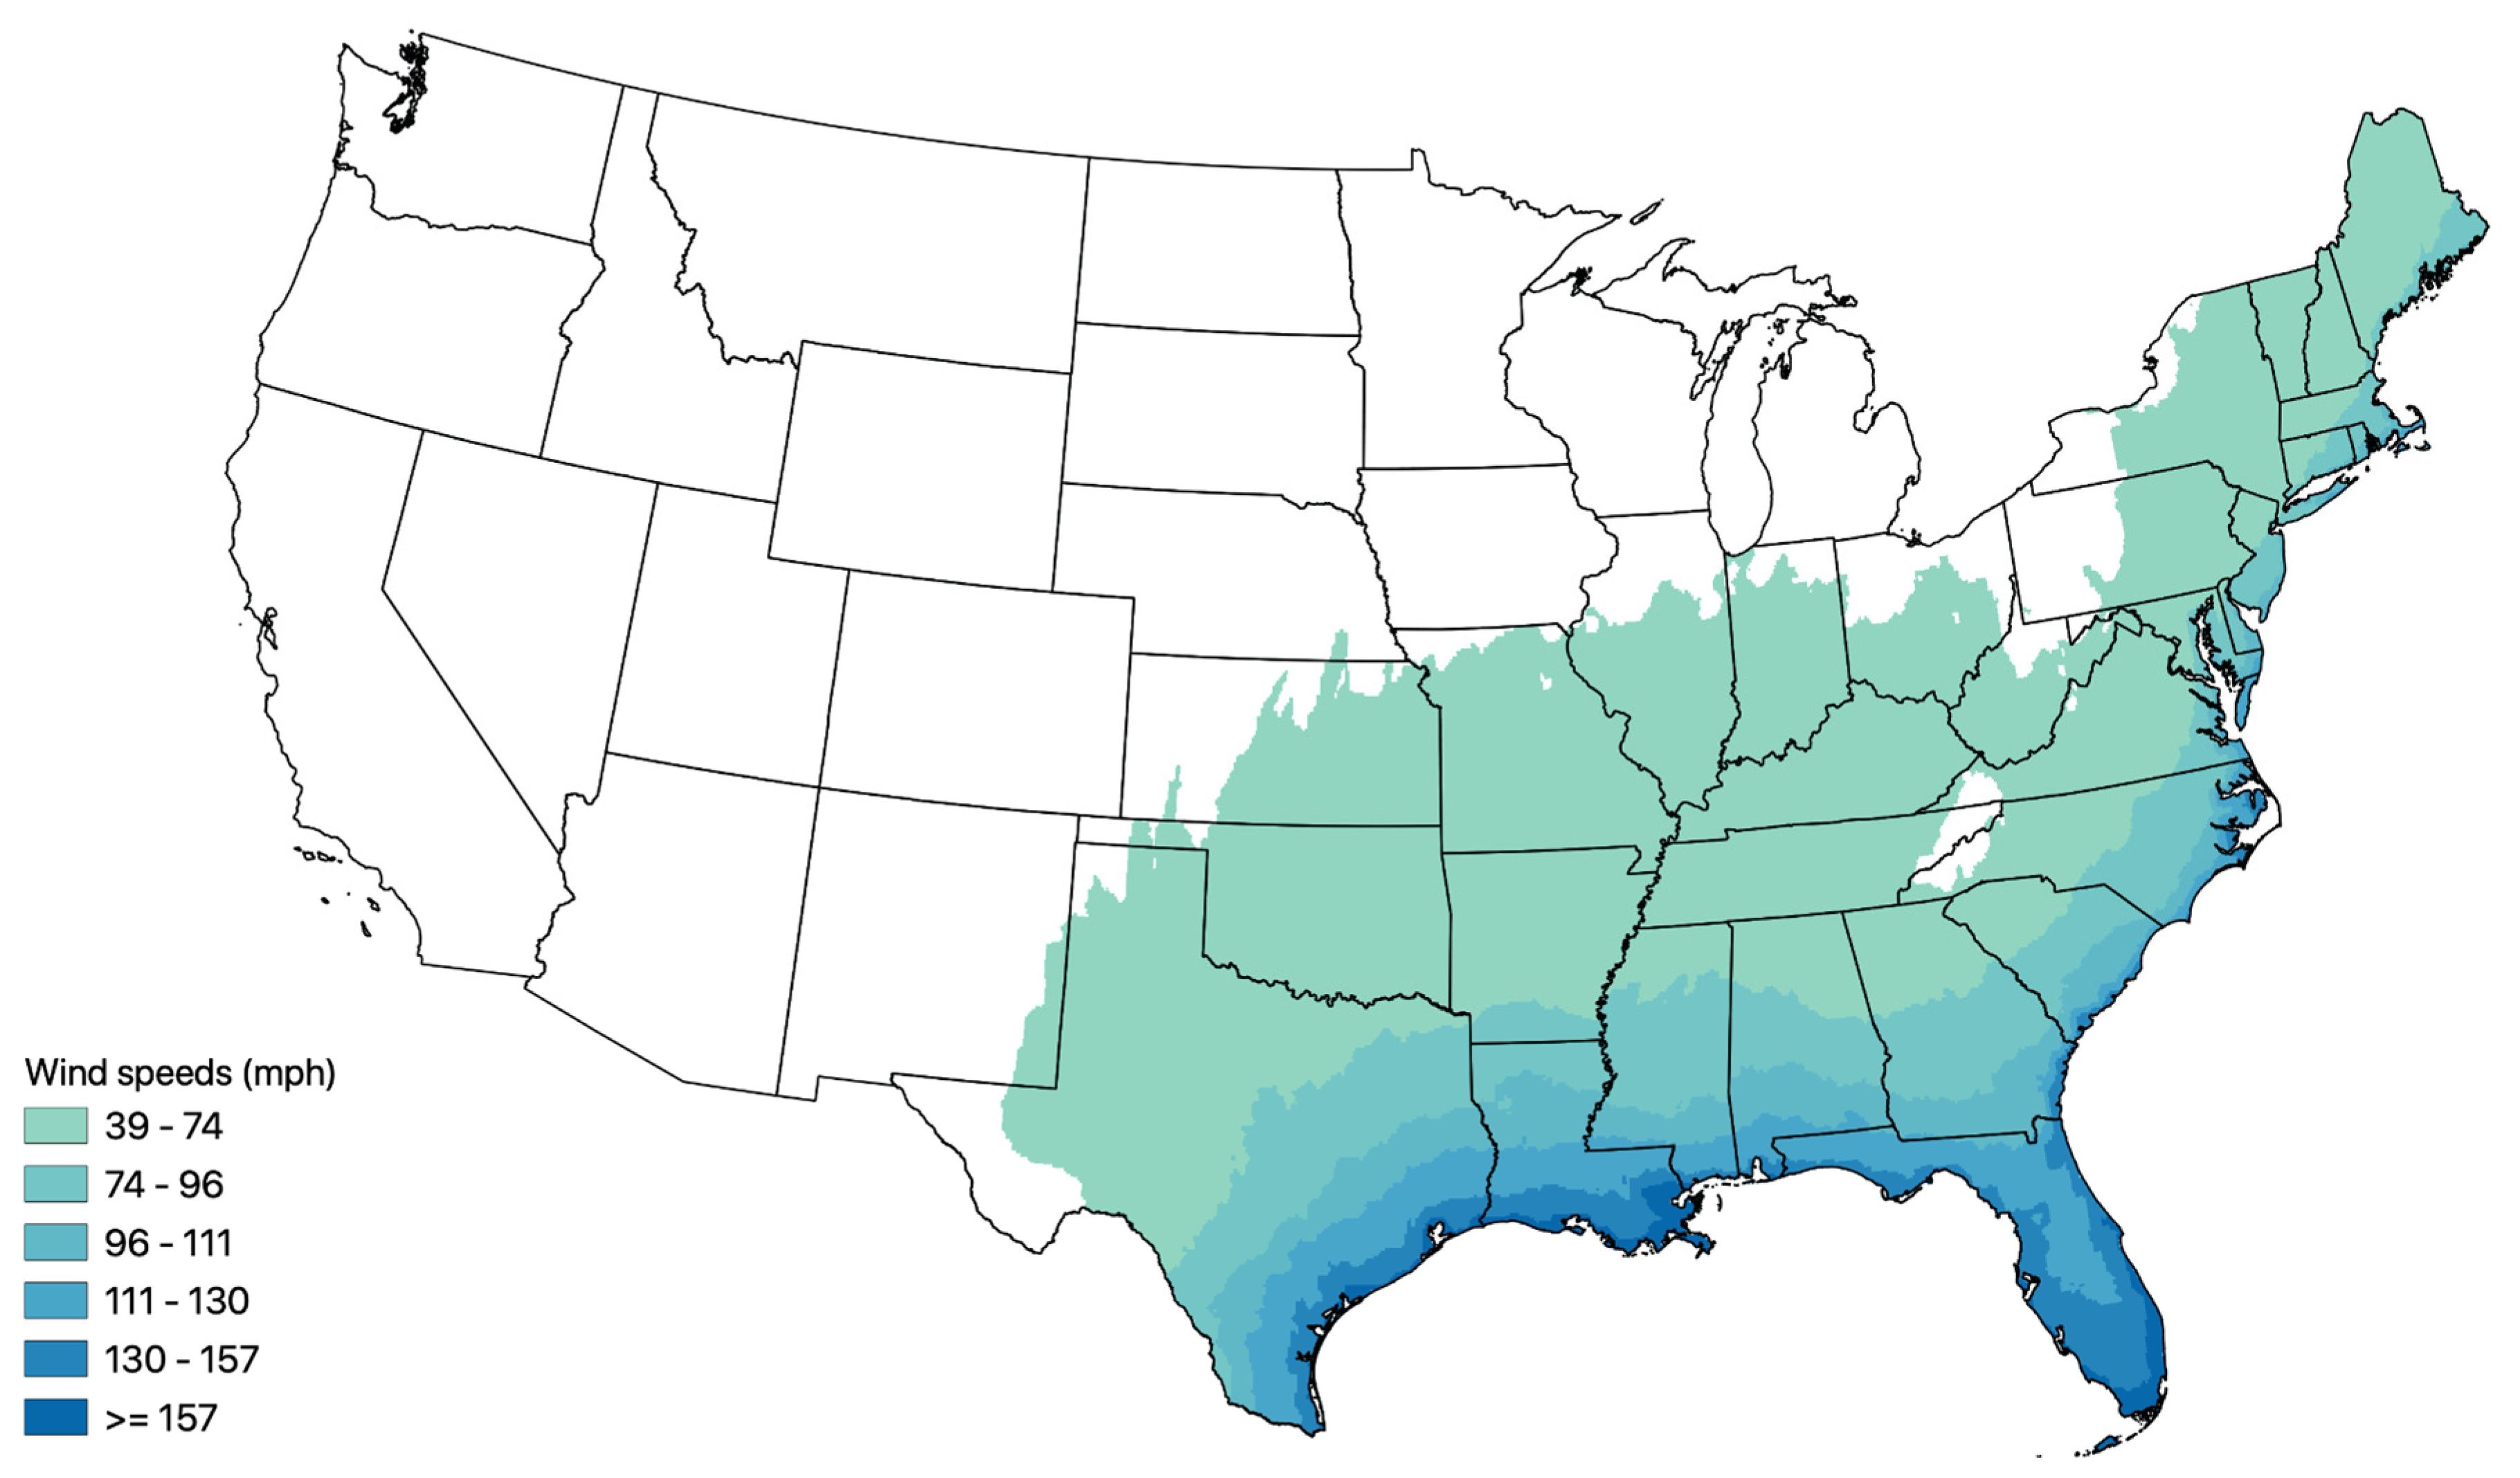
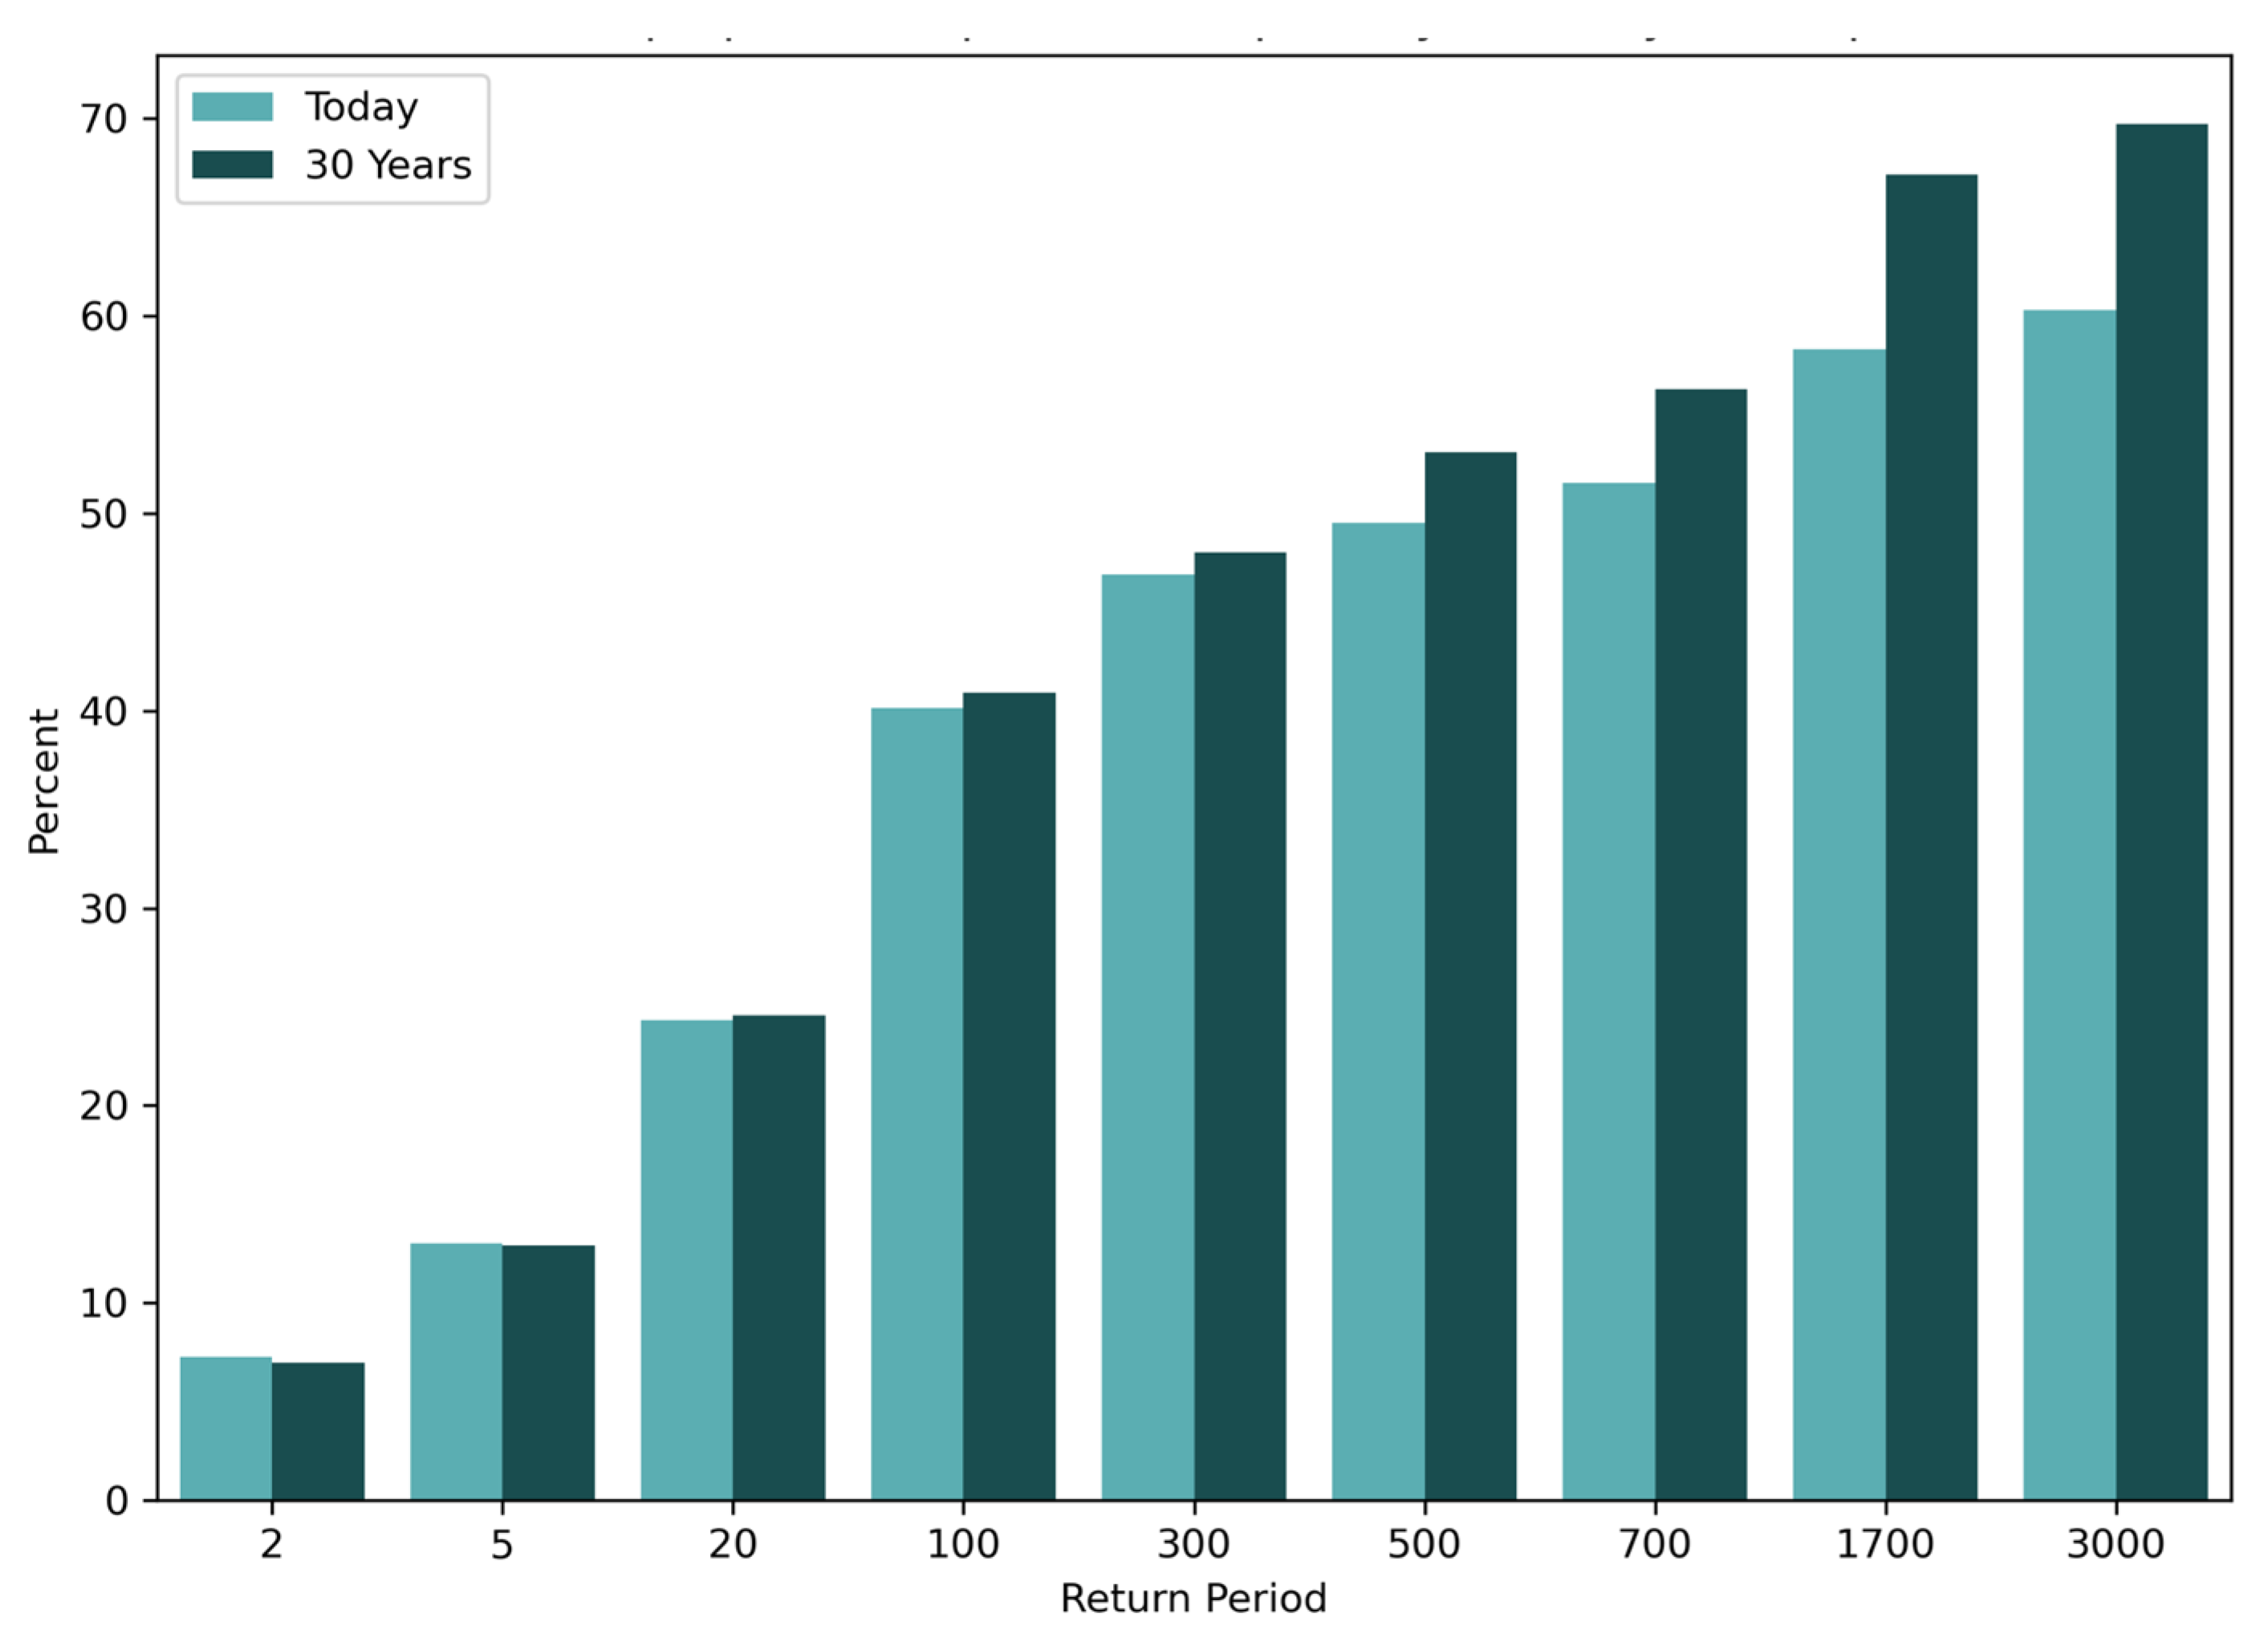
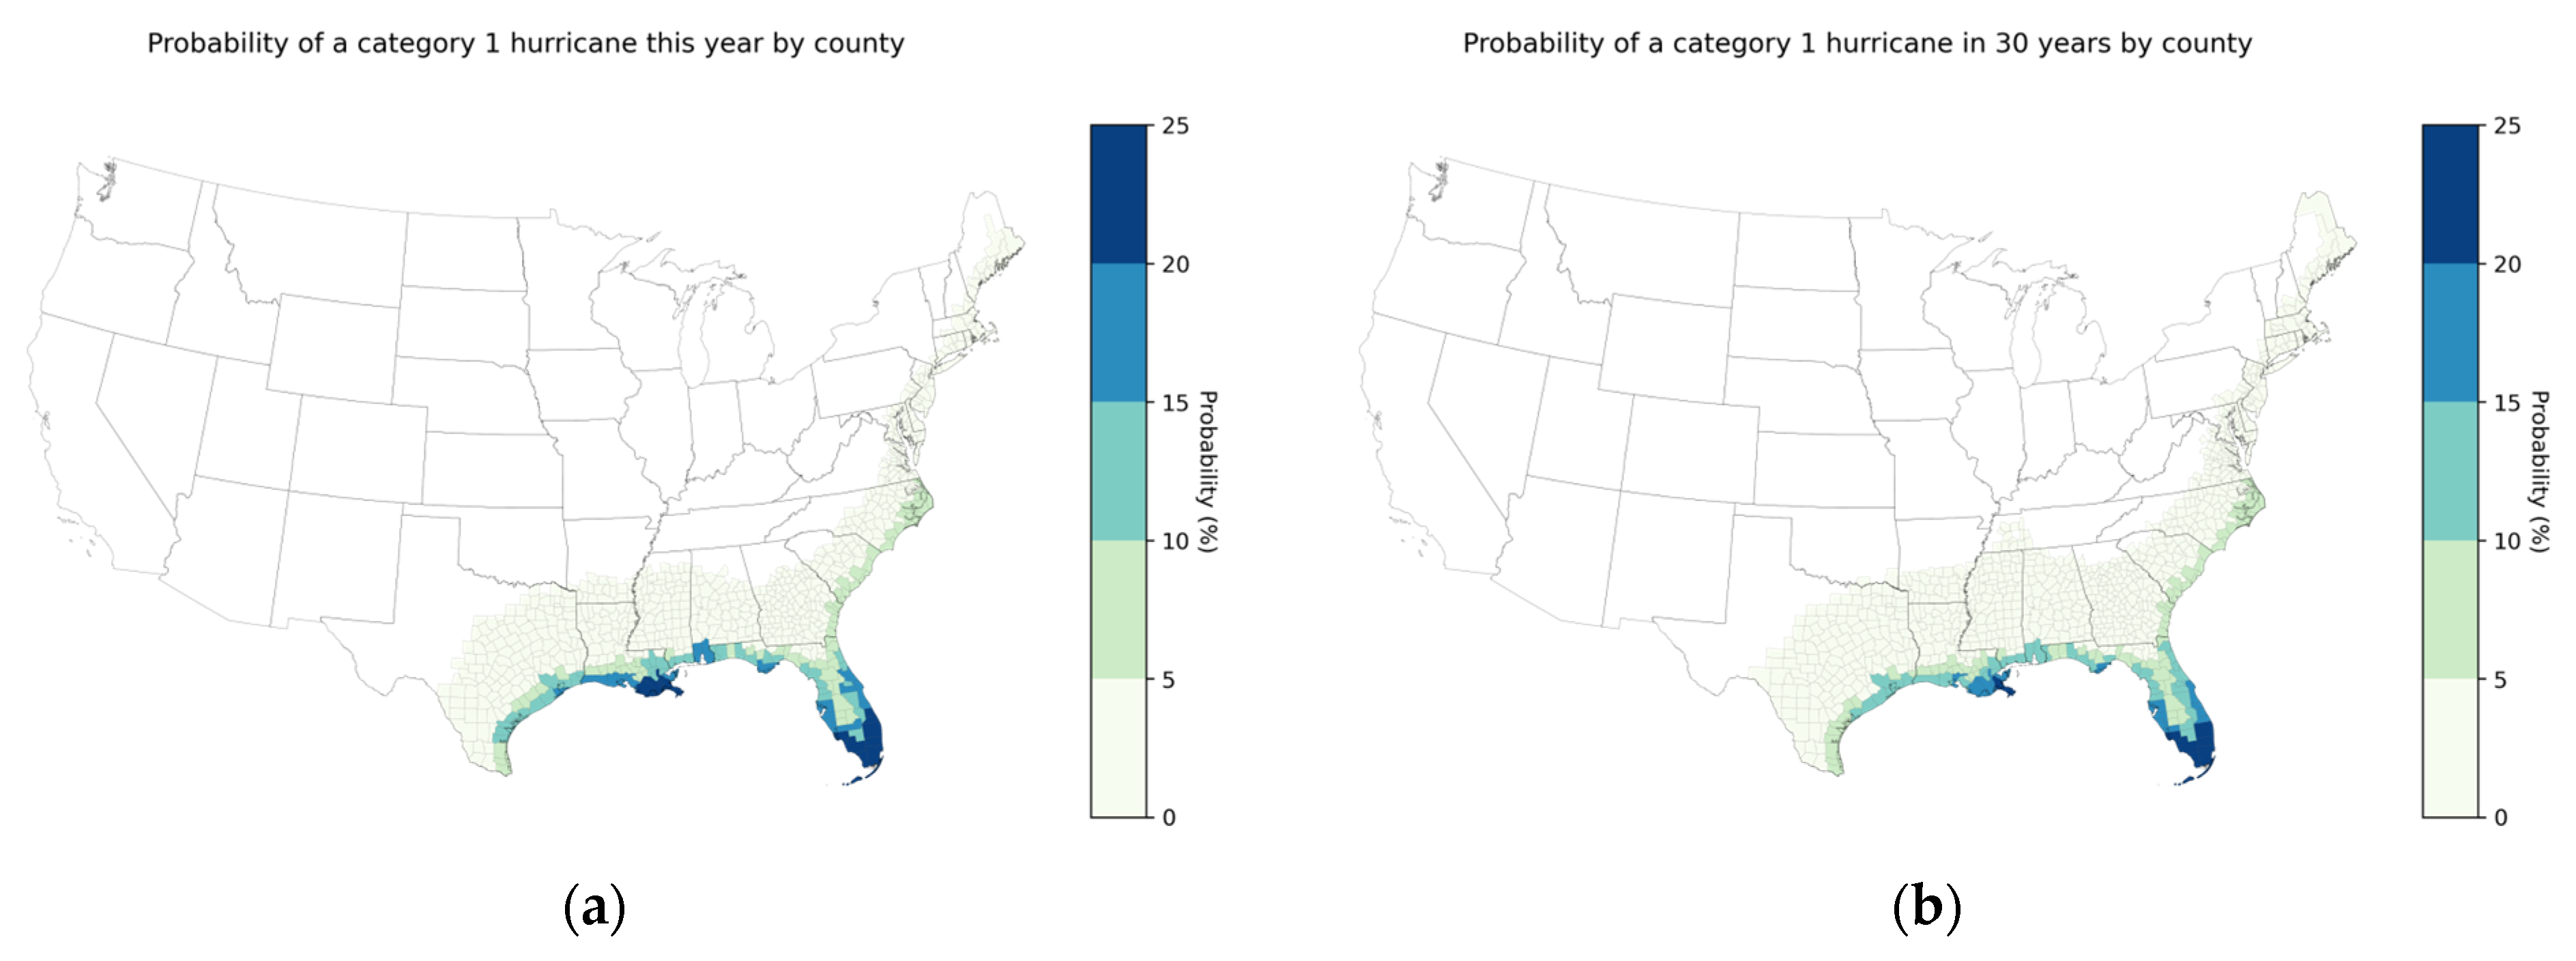
3.1. Overview of National Patterns
3.2. Exposure to Tropical Cyclone Wind Speeds
4. Discussion
Author Contributions
Funding
Data Availability Statement
Conflicts of Interest
Appendix A

| Model Name: | Model Origin: | Model Agency: |
|---|---|---|
| MPI6 | Germany | Max Planck Institute |
| MRI6 | Japan | Meteorological Research Institute, Japan |
| MIROC6 | Japan | Atmosphere and Ocean Research Institute (The University of Tokyo), National Institute for Environmental Studies, and Japan Agency for Marine-Earth Science and Technology |
| ECEARTH | Europe | EC-Earth Consortium |
| UKMO6 | United Kingdom | Hadley Centre for Climate Prediction and Research |
| NORESM6 | Norway | NorESM Climate modeling Consortium (NCC) |
| CESM2 | USA | National Center for Atmospheric Research (NCAR) |
References
- NOAA. Hurricanes. 2020. Available online: https://www.noaa.gov/education/resource-collections/weather-atmosphere/hurricanes (accessed on 12 January 2023).
- NOAA. National Centers for Environmental Information (NCEI) U.S. Billion-Dollar Weather and Climate Disasters (2023). Available online: https://www.ncei.noaa.gov/access/billions/ (accessed on 12 January 2023).
- Cutter, S.L.; Emrich, C. Are natural hazards and disaster losses in the US increasing? EOS Trans. Am. Geophys. Union 2005, 86, 381–389. [Google Scholar] [CrossRef]
- CoreLogic. Estimated Losses from Hurricane Ian Wind, Storm Surge are Between $28 Billion and $47 Billion in Costliest Florida Storm Since Hurricane Andrew. CoreLogic. 2022. Available online: https://www.corelogic.com/press-releases/corelogic-estimated-losses-from-hurricane-ian-wind-storm-surge-are-between-28-billion-and-47-billion-in-costliest-florida-storm-since-hurricane-andrew/ (accessed on 12 January 2023).
- Knutson, T.R.; Sirutis, J.J.; Garner, S.T.; Vecchi, G.A.; Held, I.M. Simulated reduction in Atlantic hurricane frequency under twenty-first-century warming conditions. Nat. Geosci. 2008, 1, 359–364. [Google Scholar] [CrossRef]
- Wang, S.; Toumi, R. More tropical cyclones are striking coasts with major intensities at landfall. Sci. Rep. 2022, 12, 5236. [Google Scholar] [CrossRef] [PubMed]
- Kossin, J.P.; Knapp, K.R.; Olander, T.L.; Velden, C.S. Global increase in major tropical cyclone exceedance probability over the past four decades. Proc. Natl. Acad. Sci. USA 2020, 117, 11975–11980. [Google Scholar] [CrossRef] [PubMed]
- Li, L.; Chakraborty, P. Slower decay of landfalling hurricanes in a warming world. Nature 2020, 587, 230–234. [Google Scholar] [CrossRef] [PubMed]
- Kossin, J.P.; Emanuel, K.A.; Vecchi, G.A. The poleward migration of the location of tropical cyclone maximum intensity. Nature 2014, 509, 349–352. [Google Scholar] [CrossRef] [PubMed]
- Reisinger, A.; Howden, M.; Vera, C.; Garschagen, M.; Hurlbert, M.; Kreibiehl, S.; Mach, K.J.; Mintenbeck, K.; O’Neill, B.; Pathak, M.; et al. The Concept of Risk in the IPCC Sixth Assessment Report: A Summary of Cross-Working Group Discussions; Intergovernmental Panel on Climate Change: Geneva, Switzerland, 2020.
- Emanuel, K.; Ravela, S.A.; Vivant, E.A.; Risi, C.A. A Statistical-Deterministic Approach to Hurricane Risk Assessment. Bull. Amer. Meteor. Soc. 2006, 87, 299–314. [Google Scholar] [CrossRef]
- Eyring, V.; Bony, S.; Meehl, G.A.; Senior, C.A.; Stevens, B.; Stouffer, R.J.; Taylor, K.E. Overview of the Coupled Model Intercomparison Project Phase 6 (CMIP6) experimental design and organization. Geosci. Model Dev. 2016, 9, 1937–1958. [Google Scholar] [CrossRef]
- Bates, P.D.; Quinn, N.; Sampson, C.; Smith, A.; Wing, O.; Sosa, J.; Savage, J.; Olcese, G.; Neal, J.; Schumann, G.; et al. Combined modeling of US fluvial, pluvial, and coastal flood hazard under current and future climates. Water Resour. Res. 2021, 57, e2020WR028673. [Google Scholar] [CrossRef]
- Emanuel, K.; DesAutels, C.; Holloway, C.; Korty, R. Environmental control of tropical cyclone intensity. J. Atmos. Sci. 2004, 61, 843–858. [Google Scholar] [CrossRef]
- Emanuel, K.A. Downscaling CMIP5 climate models shows increased tropical cyclone activity over the 21st century. Proc. Natl. Acad. Sci. USA 2013, 110, 12219–12224. [Google Scholar] [CrossRef] [PubMed]
- Emanuel, K. Effect of upper-ocean evolution on projected trends in tropical cyclone activity. J. Clim. 2015, 28, 8165–8170. [Google Scholar] [CrossRef]
- Emanuel, K. Climate and tropical cyclone activity: A new model downscaling approach. J. Clim. 2006, 19, 4797–4802. [Google Scholar] [CrossRef]
- Marks, D.G. The beta and advection model for hurricane track forecasting; NOAA Technical Memorandum NWS NMC 70. Release: Washington, DC, USA, 1992.
- Chavas, D.R.; Emanuel, K.A. A QuikSCAT climatology of tropical cyclone size. Geophys. Res. Lett. 2010, 37, L18816. [Google Scholar] [CrossRef]
- Emanuel, K.; Rotunno, R. Self-Stratification of Tropical Cyclone Outflow. Part I: Implications for Storm Structure. J. Atmos. Sci. 2011, 68, 2236–2249. [Google Scholar] [CrossRef]
- Vickery, P.J.; Wadhera, D.; Powell, M.D.; Chen, Y. A Hurricane Boundary Layer and Wind Field Model for Use in Engineering Applications. J. Appl. Meteorol. Climatol. 2009, 48, 381–405. [Google Scholar] [CrossRef]
- Federal Emergency Management Agency (FEMA). HAZUS Hurricane Model Technical Manual, HAZUS 5.1. 2021. Available online: https://www.fema.gov/sites/default/files/documents/fema_hazus-hurricane-model-technical-manual-5-1.pdf (accessed on 12 January 2023).
- US Geological Survey (USGS). National Land Cover Database (NLCD) 2019 Products, version 2.0; US Geological Survey Data Release: Reston, VA, USA, 2021.
- ASCE Standard ASCE/SEI 7-22; Minimum Design Loads for Buildings and Other Structures. American Society of Civil Engineer: Reston, VA, USA, 2022.
- Ho, E. Variability of Low Building Wind Lands. Ph.D. Thesis, University of Western Ontario, London, ON, Canada, 1992. [Google Scholar]
- Lightbox. Lightbox Property Data. 2023. Available online: https://www.lightboxre.com/data/ (accessed on 15 February 2023).
- McAllister, T.P.; Wang, N.; Ellingwood, B.R. Risk-informed mean recurrence intervals for updated wind maps in ASCE 7-16. J. Struct. Eng. 2018, 144, 06018001. [Google Scholar] [CrossRef] [PubMed]
- Vickery, P.J.; Skerlj, P.F. Hurricane Gust Factors Revisited. J. Struct. Eng. 2005, 131, 825–832. [Google Scholar] [CrossRef]


| Model Name | Model Origin | Model Agency |
|---|---|---|
| MPI6 | Germany | Max Planck Institute |
| MRI6 | Japan | Meteorological Research Institute, Japan |
| MIROC6 | Japan | Atmosphere and Ocean Research Institute (The University of Tokyo), National Institute for Environmental Studies, and Japan Agency for Marine-Earth Science and Technology |
| ECEARTH | Europe | EC-Earth Consortium |
| UKMO6 | United Kingdom | Hadley Centre for Climate Prediction and Research |
| NORESM6 | Norway | NorESM Climate Modeling Consortium (NCC) |
| CESM2 | USA | National Center for Atmospheric Research (NCAR) |
| Wind Gust Speeds (mph) by Return Period and Year | ||||||||||
|---|---|---|---|---|---|---|---|---|---|---|
| County | RP 5 (2023) | RP 5 (2053) | RP 20 (2023) | RP 20 (2053) | RP 100 (2023) | RP 100 (2053) | RP 500 (2023) | RP 500 (2053) | RP 3000 (2023) | RP 3000 (2053) |
| St. Bernard, LA | 92 | 90 | 133 | 131 | 182 | 179 | 218 | 218 | 230 | 242 |
| Plaquemines, LA | 99 | 95 | 141 | 138 | 183 | 182 | 215 | 218 | 232 | 244 |
| Monroe, FL | 102 | 99 | 141 | 138 | 183 | 180 | 212 | 215 | 230 | 244 |
| Galveston, TX | 90 | 87 | 131 | 128 | 175 | 174 | 211 | 214 | 232 | 244 |
| Terrebonne, LA | 96 | 93 | 137 | 136 | 179 | 180 | 209 | 215 | 228 | 244 |
| Iberia, LA | 91 | 88 | 133 | 133 | 179 | 182 | 209 | 216 | 228 | 247 |
| Lafourche, LA | 96 | 92 | 138 | 136 | 179 | 179 | 207 | 211 | 221 | 239 |
| Chambers, TX | 87 | 84 | 128 | 125 | 172 | 173 | 207 | 211 | 227 | 241 |
| Vermilion, LA | 88 | 87 | 131 | 132 | 175 | 179 | 207 | 214 | 227 | 243 |
| Miami-Dade, FL | 101 | 97 | 138 | 137 | 180 | 180 | 207 | 212 | 229 | 242 |
| Jefferson, TX | 88 | 86 | 127 | 127 | 172 | 173 | 207 | 210 | 228 | 237 |
| Orleans, LA | 87 | 84 | 127 | 124 | 173 | 170 | 207 | 210 | 225 | 239 |
| St. Mary, LA | 90 | 87 | 129 | 129 | 174 | 177 | 206 | 211 | 227 | 242 |
| Cameron, LA | 88 | 86 | 127 | 128 | 172 | 173 | 206 | 211 | 225 | 238 |
| Collier, FL | 100 | 97 | 138 | 137 | 177 | 174 | 206 | 212 | 224 | 238 |
| Jefferson, LA | 95 | 92 | 138 | 134 | 179 | 178 | 206 | 211 | 221 | 239 |
| Broward, FL | 100 | 97 | 137 | 134 | 175 | 174 | 206 | 211 | 227 | 239 |
| Palm Beach, FL | 100 | 96 | 136 | 133 | 172 | 173 | 205 | 209 | 227 | 238 |
| St. Tammany, LA | 87 | 83 | 125 | 123 | 172 | 166 | 205 | 207 | 223 | 238 |
| Harrison, MS | 87 | 83 | 127 | 124 | 173 | 169 | 204 | 205 | 219 | 230 |
| County | RP 500 Wind Gust (2023) | RP 500 Wind Gust (2053) | Change in RP 500 Wind Gust | RP 3000 Wind Gust (2023) | RP 3000 Wind Gust (2053) | Change in RP 3000 Wind Gust |
|---|---|---|---|---|---|---|
| Jasper, SC | 155 | 170 | 15 | 170 | 207 | 37 |
| Amelia, VA | 73 | 87 | 14 | 84 | 108 | 23 |
| Goochland, VA | 72 | 86 | 14 | 81 | 102 | 22 |
| Chesterfield, VA | 83 | 97 | 14 | 95 | 115 | 20 |
| Culpeper, VA | 63 | 77 | 14 | 73 | 90 | 17 |
| Fauquier, VA | 63 | 77 | 14 | 73 | 91 | 18 |
| Colonial Heights, VA | 82 | 96 | 14 | 92 | 114 | 22 |
| Screven, GA | 108 | 122 | 14 | 119 | 145 | 26 |
| Hopewell, VA | 83 | 97 | 14 | 95 | 115 | 20 |
| Powhatan, VA | 70 | 84 | 14 | 81 | 101 | 20 |
| Accomack, VA | 138 | 152 | 14 | 155 | 177 | 22 |
| Hampton, SC | 127 | 140 | 13 | 138 | 166 | 28 |
| King and Queen, VA | 106 | 119 | 13 | 119 | 141 | 22 |
| King William, VA | 90 | 102 | 13 | 100 | 123 | 23 |
| Somerset, MD | 125 | 138 | 13 | 141 | 163 | 22 |
| Orange, VA | 59 | 72 | 13 | 68 | 86 | 18 |
| Richmond, VA | 79 | 92 | 13 | 88 | 111 | 23 |
| Burke, GA | 97 | 110 | 13 | 113 | 133 | 20 |
| Petersburg, VA | 83 | 96 | 13 | 93 | 114 | 20 |
| Alamance, NC | 70 | 83 | 13 | 83 | 100 | 17 |
| County | Probability of at Least Category 1 Winds (2023) | Probability of at Least Category 1 Winds (2053) | Absolute Increase in Probability of Category 1 Winds | % Increase in Probability of Category 1 Winds |
|---|---|---|---|---|
| Gloucester, VA | 1.8% | 2.8% | 1.0% | 58.5% |
| Isle of Wight, VA | 1.5% | 2.5% | 1.0% | 69.0% |
| York, VA | 1.8% | 2.8% | 1.0% | 55.0% |
| Mathews, VA | 2.0% | 3.0% | 1.0% | 47.8% |
| Poquoson, VA | 2.1% | 3.1% | 0.9% | 45.0% |
| Newport News, VA | 1.9% | 2.9% | 0.9% | 47.9% |
| Hampton, VA | 2.3% | 3.2% | 0.9% | 40.9% |
| Martin, NC | 2.3% | 3.2% | 0.9% | 38.2% |
| James City, VA | 0.8% | 1.6% | 0.9% | 110.3% |
| Middlesex, VA | 1.6% | 2.4% | 0.8% | 53.5% |
| Norfolk, VA | 2.6% | 3.4% | 0.8% | 32.2% |
| Suffolk, VA | 1.8% | 2.7% | 0.8% | 44.6% |
| Glynn, GA | 6.8% | 7.6% | 0.8% | 12.1% |
| Bertie, NC | 3.0% | 3.8% | 0.8% | 27.1% |
| Portsmouth, VA | 2.0% | 2.8% | 0.8% | 40.1% |
| Lancaster, VA | 1.5% | 2.3% | 0.8% | 52.0% |
| Clay, FL | 8.9% | 9.7% | 0.8% | 8.5% |
| Effingham, GA | 1.5% | 2.3% | 0.7% | 48.7% |
| Monmouth, NJ | 1.2% | 1.8% | 0.7% | 60.0% |
| Chowan, NC | 3.5% | 4.2% | 0.7% | 19.3% |
Disclaimer/Publisher’s Note: The statements, opinions and data contained in all publications are solely those of the individual author(s) and contributor(s) and not of MDPI and/or the editor(s). MDPI and/or the editor(s) disclaim responsibility for any injury to people or property resulting from any ideas, methods, instructions or products referred to in the content. |
© 2023 by the authors. Licensee MDPI, Basel, Switzerland. This article is an open access article distributed under the terms and conditions of the Creative Commons Attribution (CC BY) license (https://creativecommons.org/licenses/by/4.0/).
Share and Cite
Shu, E.G.; Pope, M.; Wilson, B.; Bauer, M.; Amodeo, M.; Freeman, N.; Porter, J.R. Assessing Property Exposure to Cyclonic Winds under Climate Change. Climate 2023, 11, 217. https://doi.org/10.3390/cli11110217
Shu EG, Pope M, Wilson B, Bauer M, Amodeo M, Freeman N, Porter JR. Assessing Property Exposure to Cyclonic Winds under Climate Change. Climate. 2023; 11(11):217. https://doi.org/10.3390/cli11110217
Chicago/Turabian StyleShu, Evelyn G., Mariah Pope, Bradley Wilson, Mark Bauer, Mike Amodeo, Neil Freeman, and Jeremy R. Porter. 2023. "Assessing Property Exposure to Cyclonic Winds under Climate Change" Climate 11, no. 11: 217. https://doi.org/10.3390/cli11110217
APA StyleShu, E. G., Pope, M., Wilson, B., Bauer, M., Amodeo, M., Freeman, N., & Porter, J. R. (2023). Assessing Property Exposure to Cyclonic Winds under Climate Change. Climate, 11(11), 217. https://doi.org/10.3390/cli11110217