Article

Assessing the Effects of Drought on Rice Yields in the Mekong Delta

1
Department of Environmental Engineering, College of Environment and Natural Resources, Can Tho University, Can Tho 900000, Vietnam
2
Institute for Global Environmental Strategies, Hayama 240-0115, Kanagawa, Japan
3
Centre for Climate Change & Water Research (C3WR), Suresh Gyan Vihar University, Jaipur 302017, India
4
Department of Environmental Management, College of Environment and Natural Resources, Can Tho University, Can Tho 900000, Vietnam
5
Department of Water Resources, College of Environment and Natural Resources, Can Tho University, Can Tho 900000, Vietnam
6
College of Technology, Can Tho University, Can Tho 900000, Vietnam
7
Department of Geography, School of Environment and Earth Sciences, Central University of Punjab, VPO-Ghudda, Bathinda 151401, India
*
Author to whom correspondence should be addressed.
Climate 2023, 11(1), 13; https://doi.org/10.3390/cli11010013
Submission received: 26 October 2022 / Revised: 23 December 2022 / Accepted: 28 December 2022 / Published: 3 January 2023

Abstract

:
In contrast to other natural disasters, droughts may develop gradually and last for extended periods of time. The World Meteorological Organization advises using the Standardized Precipitation Index (SPI) for the early identification of drought and understanding of its characteristics over various geographical areas. In this study, we use long-term rainfall data from 14 rain gauge stations in the Vietnamese Mekong Delta (1979–2020) to examine correlations with changes in rice yields. Results indicate that in the winter–spring rice cropping season in both 2016 and 2017, yields declined, corresponding with high humidity levels. Excessive rainfall during these years may have contributed to waterlogging, which in turn adversely affected yields. The results highlight that not only drought, but also humidity has the potential to adversely affect rice yield.

1. Introduction

Droughts occur in virtually all climatic zones, and cause adverse impacts to natural habitats, ecosystems, society and the economy [1]. Droughts have been considered as a silent hazard [2,3,4,5]. Several recent studies have indicated that agricultural production has been found to decline significantly due to increased drought frequency and severity [4,5]. For example, the severe Australian drought in 2006 reduced the national winter cereal crop by 36%, leaving many farmers in a financial crisis [6]. Drought in the Kingdom of Eswatini in 2015–2016 caused a 30% reduction in income [6]. Cunha et al. (2019) notes that most regions of Brazil have faced extreme droughts over the last 60 years [7]. Furthermore, 26 drought events in the USA from 1980 to 2019 have resulted in estimated losses of at least USD 249 billion [8].
Droughts also severely influence the socioeconomic development of the Lower Mekong Basin (LMB) counties of Thailand, Cambodia, Laos and Vietnam, and negatively affect the livelihoods of about 85% to 90% of people living in the rural areas of the region. The LMB experienced extreme drought events in 1992, 1999, 2003, and 2015–2016, which led to massive economic losses due to crop damage and adverse effects on the environment and farmers’ livelihoods. The most extreme drought, in 2016, caused 1.7 billion USD of damages in Thailand and caused water shortages in 18 out of 25 provinces, affecting 2.5 million people, in Cambodia. In Vietnam, the cost of the drought in 2016 was estimated at 669 million USD, and the estimated recovery costs amounted to approximately 1.5 billion USD [9].
In the Vietnamese Mekong Delta (VMD), drought has significantly reduced rice yields. Unlike other natural disasters, drought develops slowly, develops in a ladder-like pattern, and is difficult to predict [10]. As a result, a drought index is required to assess the effects of drought. Many drought indicators are currently utilized both domestically and internationally to assess the level of drought and the level of moisture [11]. For varied topographic and hydrological conditions, individual indices may be appropriate. As a result, to improve the accuracy of drought detection in areas with numerous water sources, various indicators can be used. The standardized precipitation index (SPI), which is based on rainfall over several time periods, was chosen by the World Meteorological Organization for the assessment of meteorological drought in 2009 [1,12]. Additionally, different levels of constraint can be assessed using the SPI indicator [10]. Furthermore, the SPI can be used to assess different levels of drought [10]. Rainfall data are frequently recorded in a variety of locations, making it easy to calculate the SPI. Meteorological drought was assessed by using SPI [13,14] and the impacts on the development and growth of rice were evaluated [11]. Additionally, SPI can be predicted using a climate change dataset. Climate change data were utilized in a study by Ty et al. to calculate the SPI for the VMD [15]. Their findings indicated that while the frequency of drought will not increase until the year 2047, it will become increasingly more severe in the VMD, where the probability of a drought occurring across the entire region ranged from 23% to 34% [15]. Their study also revealed that dry and wet conditions could be correlated with the average annual rice yield, as well as seasonal rice yields [2]. Extreme wet conditions are common in the coastal areas of the VMD under the influence of tropical storms, and can occur for several months. In particular, Ca Mau province exhibits this characteristic [16]. Meanwhile, the inland provinces of the VMD have been found to mostly be affected by prolonged drought [17,18].
Within the VMD, recent droughts have both affected rice yields and resulted in forest fires, in particular the droughts of 1982, 1998, the 1992–1993 winter–spring cropping season, 2009–2010, 2006–2007, and 2009–2010 [19]. Droughts are typically categorized as socioeconomic, meteorological, agricultural, or hydrological droughts.
Droughts also strongly influenced saline intrusion in the VMD; the storage in Tonlé Sap and flow to Kratié are two main upstream factors that have impacts on the VMD’s downstream water supply and saline intrusion. Major salinity events, as well as droughts, occurred in the VMD during years of climatic extremes [17,20]. In addition, El Niño phenomena impacted the dry season of 2015–2016, causing the rainy season to arrive late and end early, with a decreased volume of rainfall. Additionally, low discharge volumes in the Mekong River have allowed saline waters further upstream. The timing, intensity, and frequency of climate and weather extremes in Vietnam specifically, and in Southeast Asia generally, including the Mekong River basin, have noticeably increased according to the examination of hydrometeorological data from 1975 to 2020. As a result, increased frequency and magnitude of salinity and drought events in the VMD are causing increased economic and environmental repercussions [21,22].
To identify a timely pathway for drought adaptation, it is therefore vital to recognize and understand the spatial and temporal degrees of drought. It is established that the SPI is a somewhat appropriate index for the topographical and climatic features of the VMD. The region’s drought state is therefore evaluated using the SPI. The main objectives of this study were to estimate SPI for rainy periods of three, six, and nine months, as well as for the summer–autumn rice cropping season (April to July) and autumn–winter season (December to March), to assess agricultural dryness and create isodrought maps for each season.

2. Materials and Methods
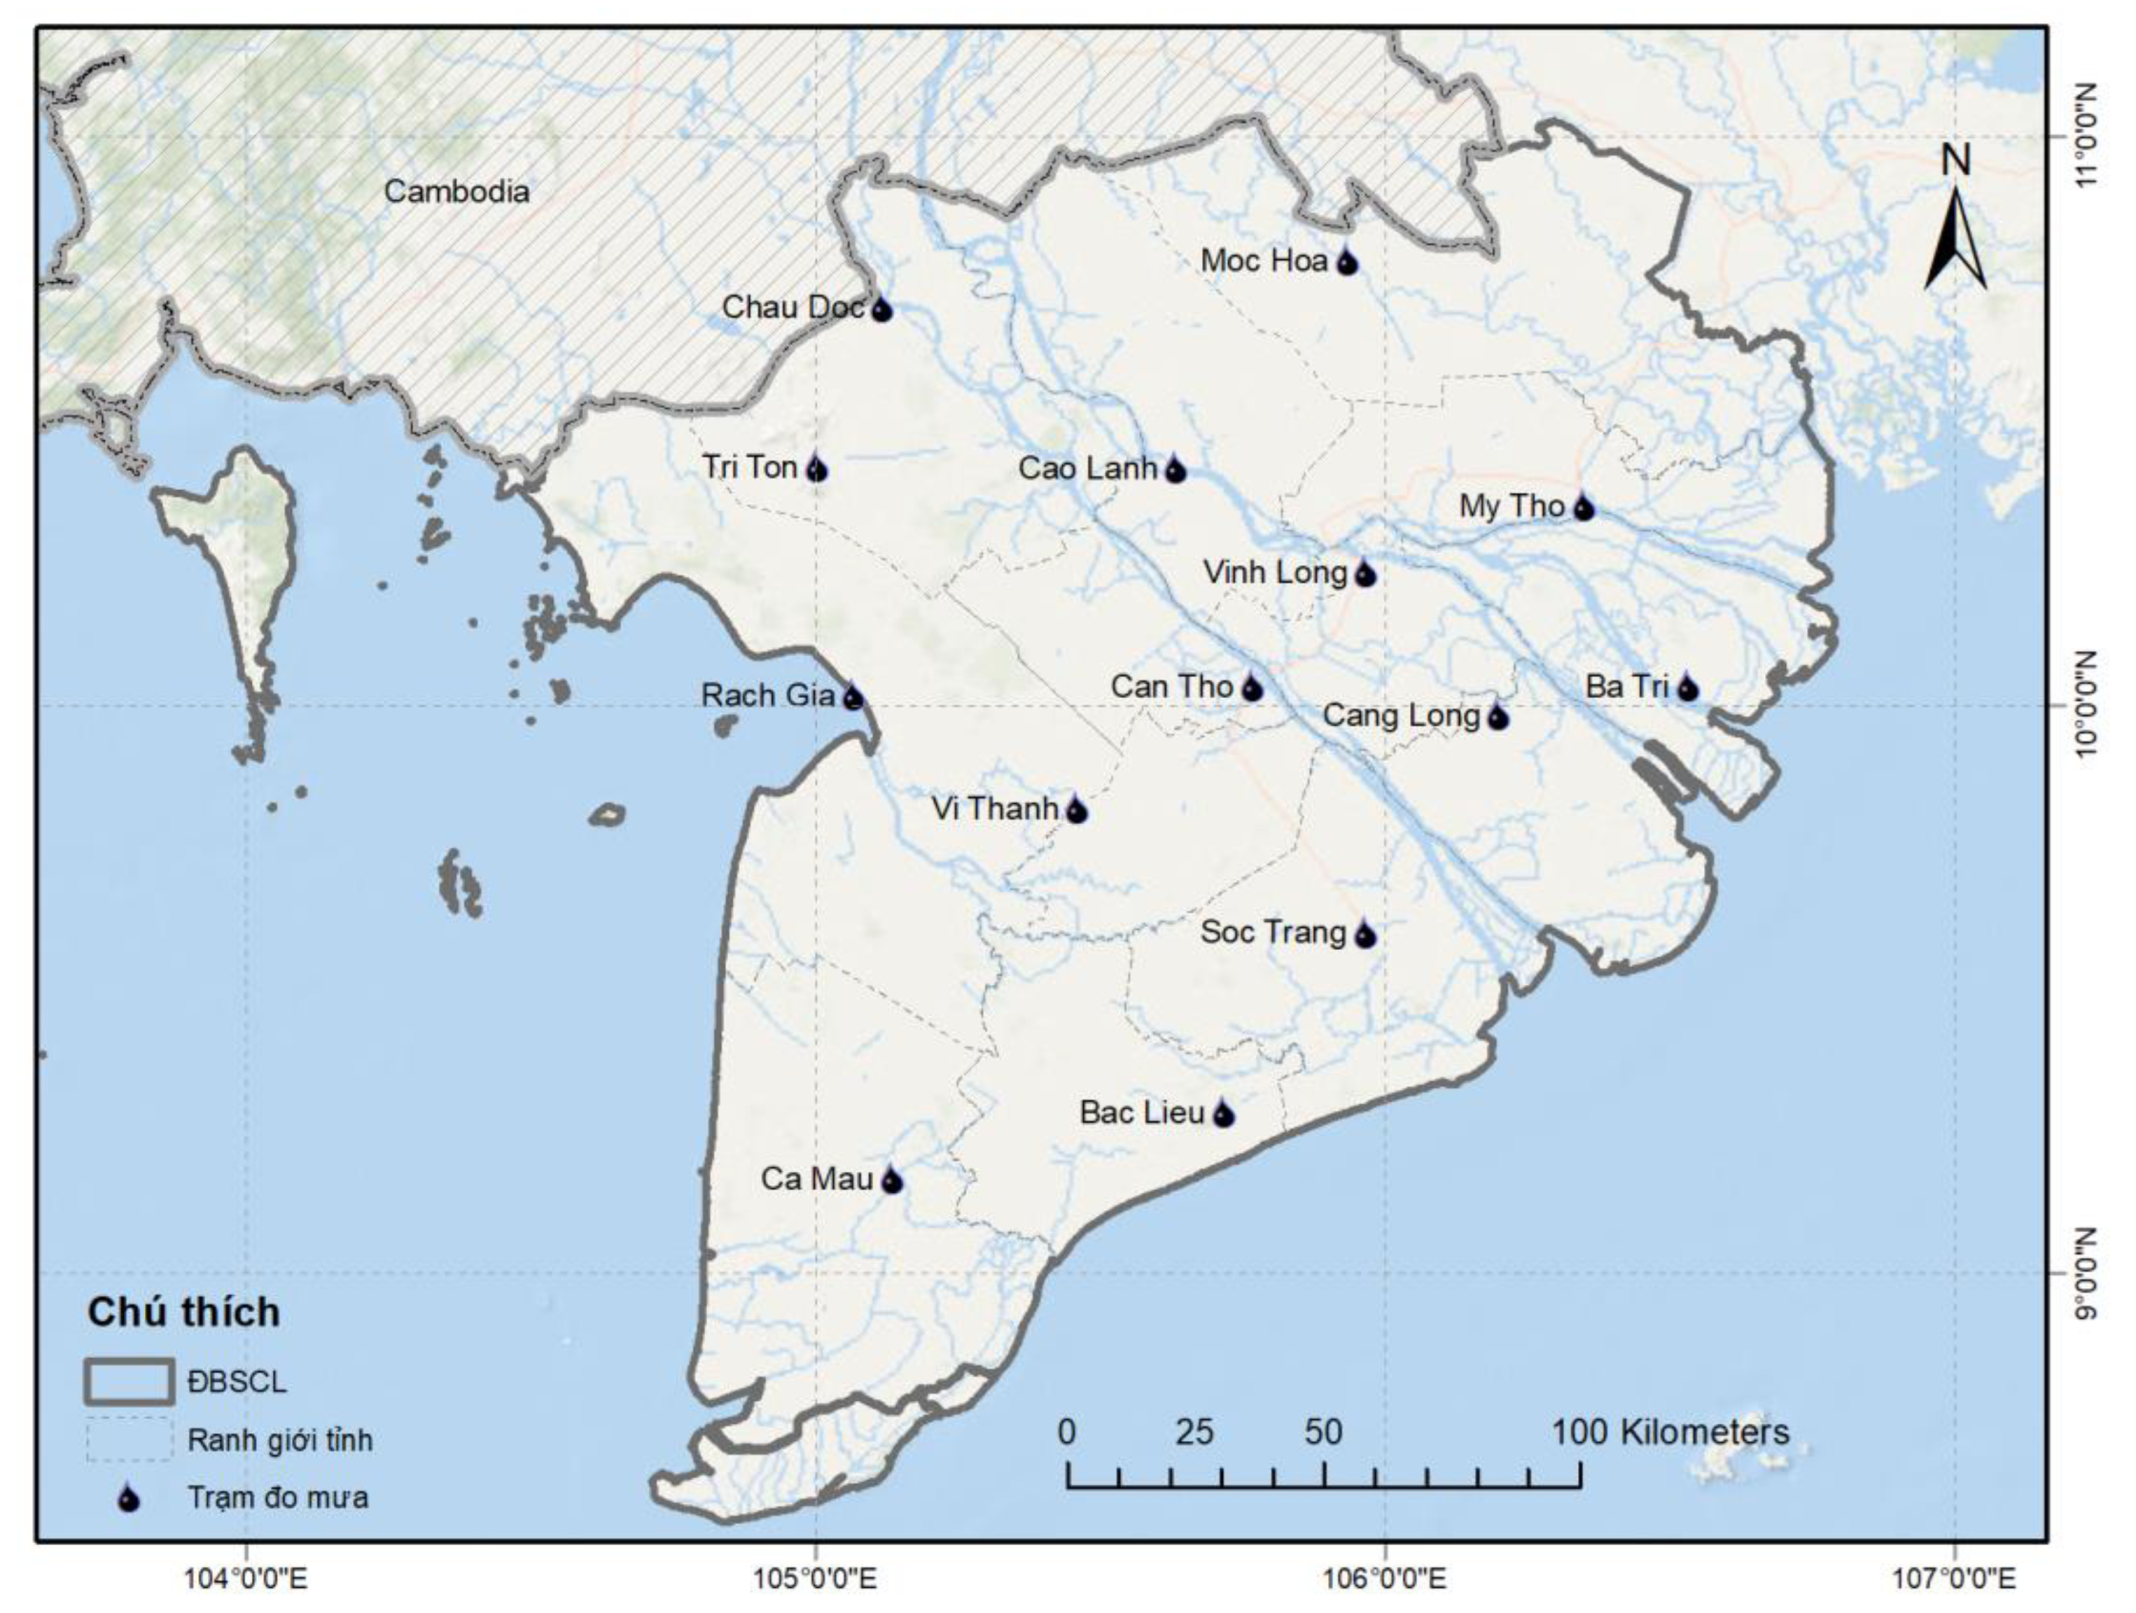
2.1. Study Area

With a total area of up to 40.6 thousand square kilometers (12% of the country’s total area), the VMD is home to 13 provinces and cities with a combined population of 17,273,630 (18% of the nation’s total population) in the year 2019 Figure 1. The population density was 1.45 times greater than the national average at 423 people per square kilometer. The VMD contributes roughly 50% of the nation’s rice production, 95% of its export rice production, about 65% of its aquaculture production, 60% of its export fish, and 70% of its types of fruits [23]. Furthermore, rice is grown on more than 3.2 million hectares, accounting for more than 50% of global rice production and more than 90% of global rice exports each year [24]. The predicted area for autumn–winter rice production in 2021 was 719.7 thousand ha, a loss of 4.4 thousand ha from the autumn–winter crop in the previous year, due to the conversion to fruit crops and the impact of insufficient seeds being sowed for the summer–autumn crop in time for rice to be harvested [25].
The VMD contains abundant water resources (the Tien and Hau rivers), but these are unevenly distributed according to the seasons, and influenced by tides in three directions (East Sea, West Sea and the area bordering the East and West seas) through the river system. In the dry season, the average flow is about 2500 m3/s, yet there are times when it is lower than 1500 m3/s. The impacts of hydropower, economic activities, excessive groundwater exploitation and climate change have led to a decrease in upstream flows reaching the VMD, while a lack of water in the dry season increases the risk of drought and saltwater intrusion. The discharge volumes of the Mekong River water flowing into the VMD decrease significantly in March or April, leading to saline intrusion [26]. The dry season of 2015–2016 was considered to be a high salinity season, but in the dry season of 2019–2020, a salinity drought began to appear from mid-December 2019, nearly 1 month earlier than in the dry season of 2015–2016 and more than 3 months earlier compared with the long-term average [26].
Both drought and saltwater intrusion affected production in the VMD during the 2015–2016 dry season. According to [27], the salinity drought in 2019–2020 lasted for nearly two-thirds of the dry season and remained at a high level throughout the year [27]. At its peak, in 2016, areas 25 km inland were affected; but in 2019 the area affected extended more than 40 km inland. Notably, water with a salinity of 4‰ penetrated inland to distances of 100 km along the Hau River, 75 km along the Ham Luong River, 70 km along the Co Chien River, and almost 60 km along the Cua Tieu River, the Cua Dai River and the Cai Long River, respectively.

2.2. Estimated SPI for Each Period and Rice Cropping Seasons

Numerous drought indices, such as SPI, SPEI, and ARI, have been developed to describe drought and help with the quantitative evaluation of drought severity. Some of these have been selectively applied in some areas of the VMD [16,28,29,30,31]. Among the indices, SPI has been widely used worldwide [2,4,5,6,7,11,14,32,33]. Therefore, the SPI was selected to calculate the impact of drought on agriculture and establish its frequency using time steps of 3, 6, and 9 months, as well as for the seasons (summer –autumn and winter–spring) for the entire VMD. According to SPI 3, SPI 6, and SPI 9 months, summer–autumn and winter–spring crops, the current climate is arid. For each period, the SPI was estimated and the hierarchy of humidity and drought based on the SPI computed and graded in accordance with Formula (1) and Table 1, respectively.
Assuming a precipitation series at a given timescale X = x1, x2, x3, …, xn, n = 1, 2, 3, …, n represents the length of the series, and the distribution function f (x, θ) can best describe the distribution of the precipitation series X.
X ~ f ( x ,   θ )
where θ is the parameter set of the function f(x) that can be estimated based on the sample series X.
The cumulative distribution function can be expressed as:
F ( x ) = 0 x f ( x , θ ) d x
Equation (2) can be used to determine the cumulative probability of each observed precipitation event, xi. The SPI then undergoes an equiprobability transformation from the cumulative probability to the unit variance, zero mean, standard normal random variable Z.
S P I = Φ 1 ( F ( X ) )
where Φ−1 (•) is the inverse of a standard normal cumulative distribution function Φ (•) with zero mean and unit variance. Considering the fact that some kinds of distribution functions are not defined for x = 0, such as the Gamma function, an adapted statistic H (x) can be expressed as Equation (4).
H ( x ) = q + ( 1 q ) F ( x )
where q is the probability of no precipitation, which can be computed by simply dividing the number of months (N) by the number of months (n) that have no precipitation (Vicente-Serrano, 2006) [34]. Equation (5) can then be used to describe the SPI computation process.
S P I = Φ 1 ( H ( X ) )
In this study, we used the SPI-based drought classification for Vietnam, in which SPI = −0.25 signifies the onset of drought conditions [17,35]. Drought begins when the SPI first falls below the negative value of 0.25 or less, and ends when the SPI returns to a positive value of 0.25 or higher (Table 1).

2.3. Temporal Analysis

The application of the seasonal Mann–Kendall test was used for the piezometric time series data to enable further data interpretation for drought conditions. The magnitude of the slope was computed using the Sen’s slope test as shown in Equation (6) [36].
S k = i = 1 n S i
Kendall’s S statistic Si for each season is summed to form the overall statistic, Sk. Mann–Kendall statistics provide an indication of whether a trend exists, and if so, whether the trend is positive or negative, based on a range between −1 and 1, for each pair of data points depending on the sign of the difference between the values. The Mann–Kendall equation, which is based on the value of the S statistic, is calculated using the equation shown as Equation (7).
S = i = 1 n 1 j = i + 1 n s g n ( x j x i )
where xi and xj are sequential data values, n is the length of time series, and:
s g n ( x j x i ) = {       1           i f ( x j x i ) > 0       0           i f ( x j x i ) = 0 1           i f ( x j x i ) < 0
Mann (1945) and Kendall (1975) [37,38] stated that when n ≥ 8, S is almost normally distributed with the following mean and variance:
E ( S k ) = 0
Value of S at near zero, positive, and negative imply no significant, upward, and downward trends, respectively. The magnitude of S measures the strength of the trend. Note that if the absolute value of S is greater than the critical value of S, this indicates that trends are statistically significant.
V a r ( S k ) = 1 18 [ n ( n 1 ) ( 2 n + 5 ) i = 1 n t i ( t i 1 ) ( 2 t i + 5 ) ]
where ti is the number of ties of the extent i, and n is the number of observations in the set. The standard Zsk statistic is calculated as follows:
Z s k = { S k 1 V a r ( S k )             S k > 0 0                             S k = 0 S k + 1 V a r ( S k )             S k < 0
where Z s k pursues the standard normal distribution with μ = 0 and δ = 1.The Sen’s slope was used to determine the magnitude of the trend. The Z statistic is formed and compared with a critical point from the standard normal distribution. The magnitude of a time series trend was evaluated by a simple nonparametric procedure developed by Sen; T i is between any two values of a time series (which gives a total of n(n−1)/2 pairs of data could be calculated by:
T i = x j x i j i
where x j and x i are values at time j and i (1 < i < j < n), n is the number of data. The median of these n values of Ti is represented as Sen’s estimator of slope. Positive and negative values of Ti indicate upward and downward trends in the time series, respectively.

2.4. Spatial Analysis of Drought Status

Agglomerative Hierarchical Clustering (AHC) is a common approach applied in many previous studies, using the squared Euclidean distance and Ward’s method [39,40,41]. This technique can group single objects into clusters with similarity based on certain criteria, making data simple and easy to comment on. The fourteen stations were grouped using hierarchical cluster analysis. As stations of similarity, Ward’s approach, employing squared Euclidean distances, was used [39]. The findings of the cluster analysis were interpreted using the dendrogram. The linkage distance, expressed as the dissimilarity level, was used to calculate the geographic variability of water quality using AHC. The connectivity distance shown on the x axis was then standardized by multiplying the quotient by 100 [39,40].

3. Results and Discussion

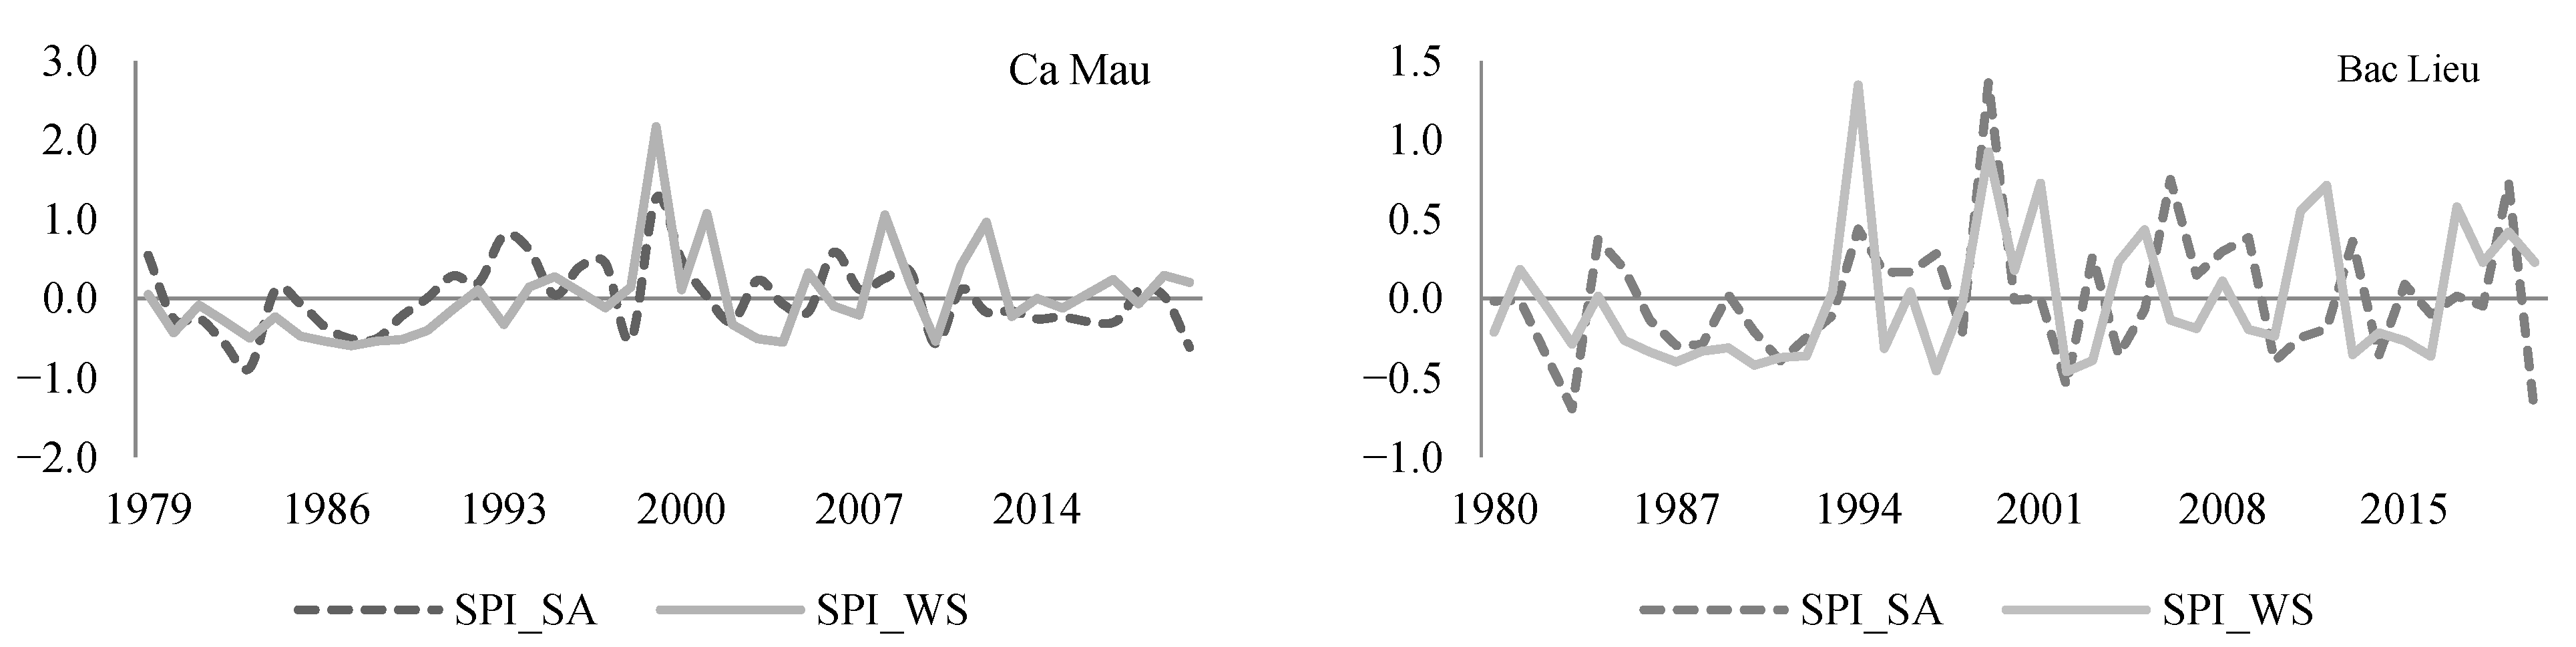
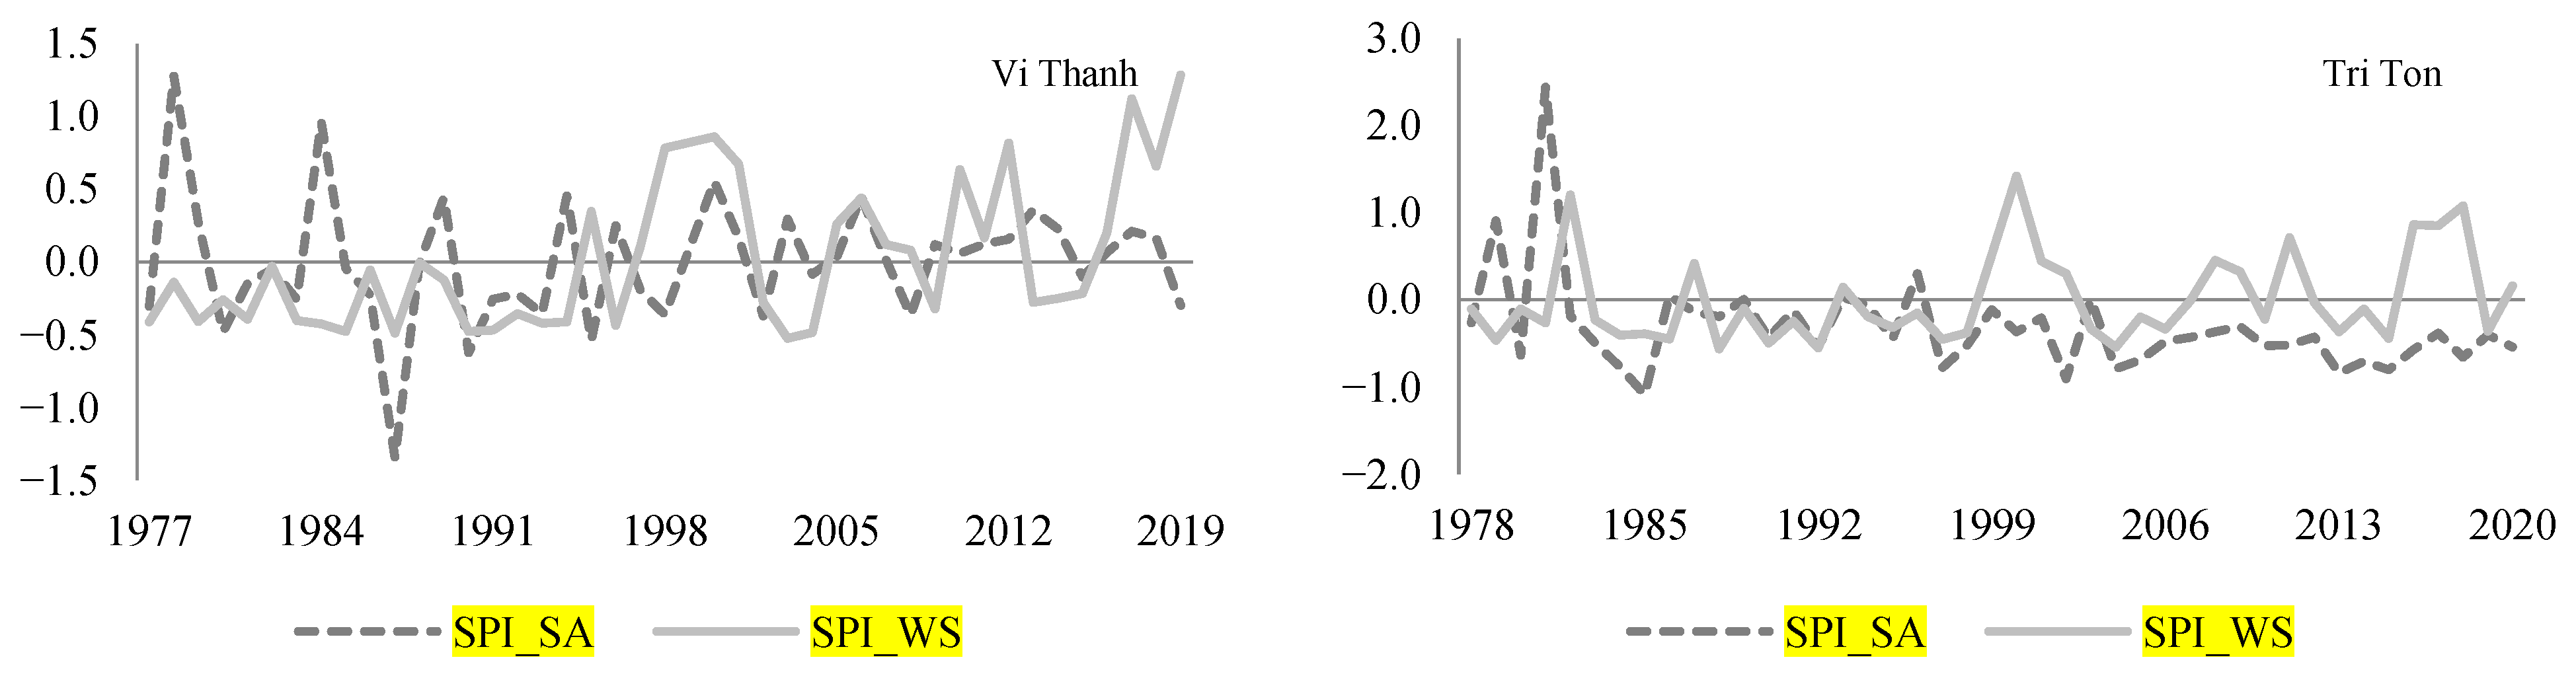
3.1. Temporal Analysis Using SPI 12−Month Drought

The results of the temporal analysis using the SPI 12−month drought data over the VMD are shown in Figure 2. The Mann–Kendall test showed that although the severity of the drought tended to decrease at coastal stations, with the exception of Soc Trang station, the trend was not statistically significant. Meanwhile, interior meteorological stations showed reduced rainfall, suggesting that the degree of drought is increasing. Among the stations (Tri Ton, Moc Hoa, Can Tho, Cang Long, and Chau Doc), only Tri Ton station showed an increased drought trend at the computed p-value, lower than the significant level alpha = 0.05.

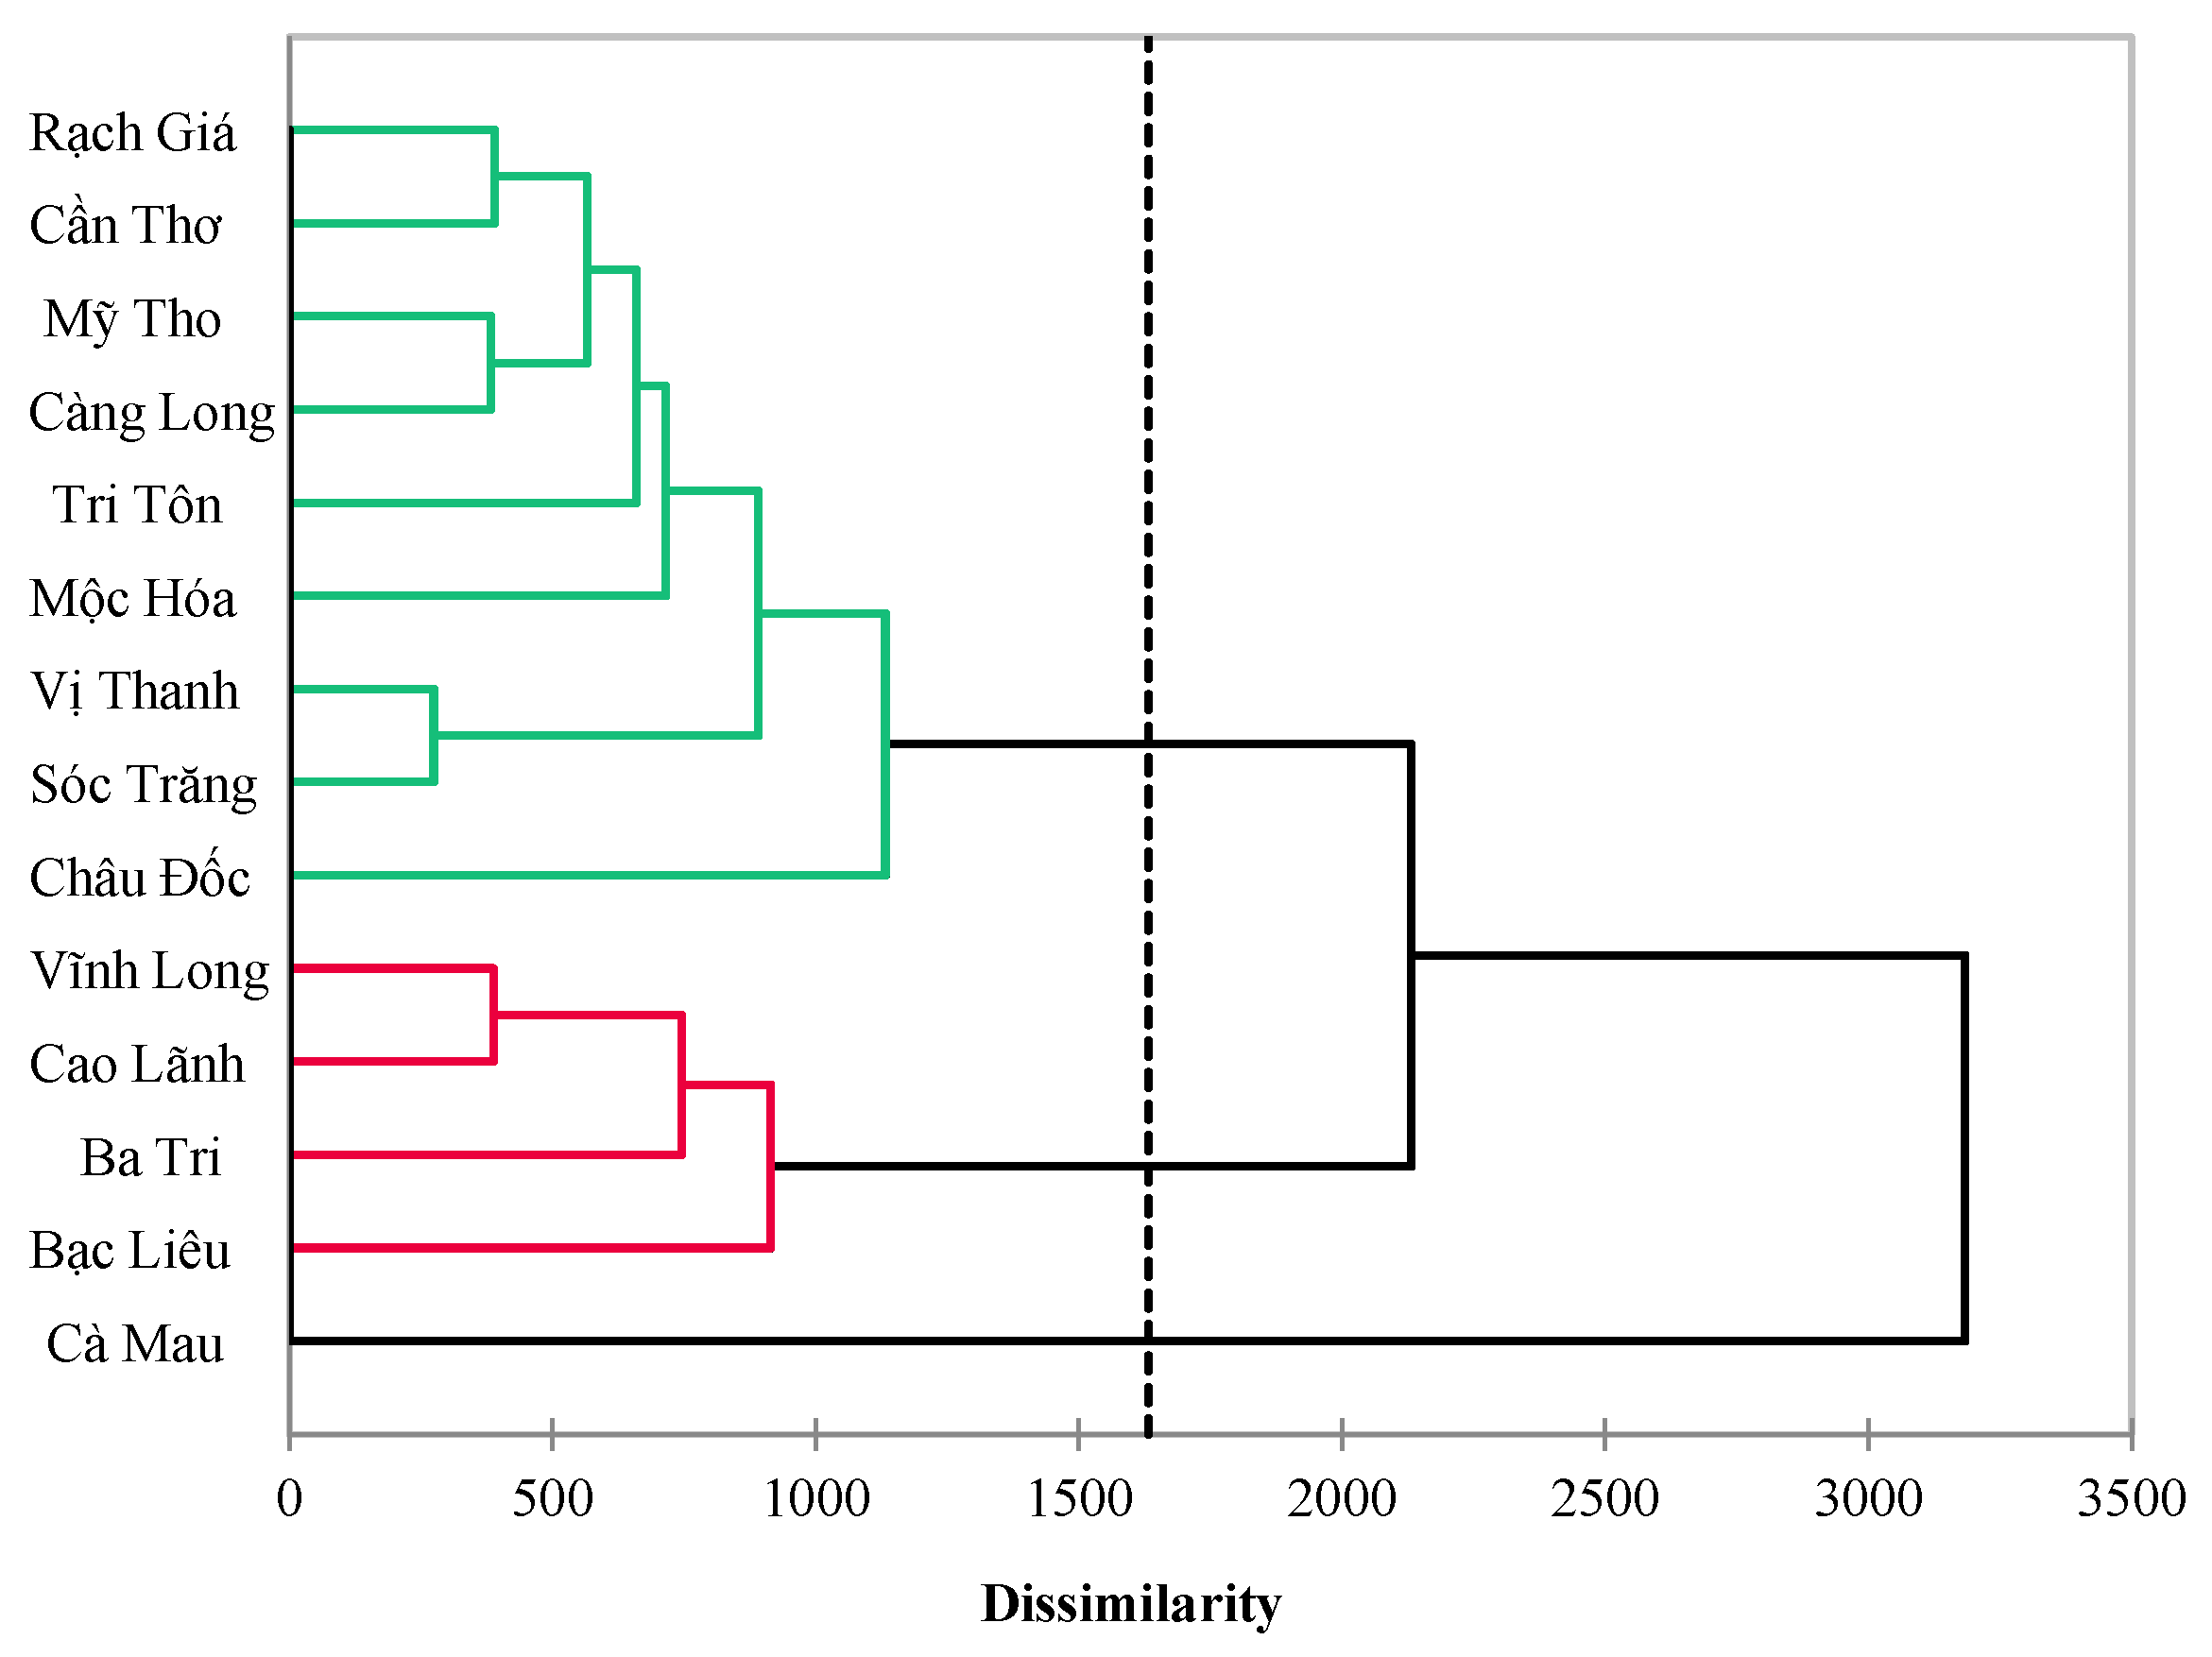
3.2. Cluster Analysis Using AHC Technique

Compared with SPI 6 and SPI 9, SPI 3 highlighted more variation and susceptibility to extremes (too dry or too humid) (Figure A1). Figure 3, Figure 4 and Figure 5 display the findings of a cluster analysis for the three consecutive periods of 3 months, 6 months, and 9 months. According to the cluster analysis results, there were the same number of clusters and stations in each cluster for the 3, 6, and 9-month drought periods (SPI 3, SPI 6, and SPI 9). These were Cluster 1 (Ca Mau), Cluster 2 (Bac Lieu, Ba Tri, Cao Lanh, and Vinh Long), and Cluster 3 (Cang Long, Can Tho, Chau Doc, Moc Hoa, My Tho, Rach Gia, Soc Trang, Vi Thanh, Tri Ton). Cluster 1 has only one station, Ca Mau, which is the most unique station in the Mekong Delta, experiencing both extreme drought and extreme flooding. The drought severity in Cluster 2 tends to decrease, although this decrease is not statistically significant, according to the Mann–Kendall test results. Cluster 3 contains stations where the severity of drought fluctuates over time.

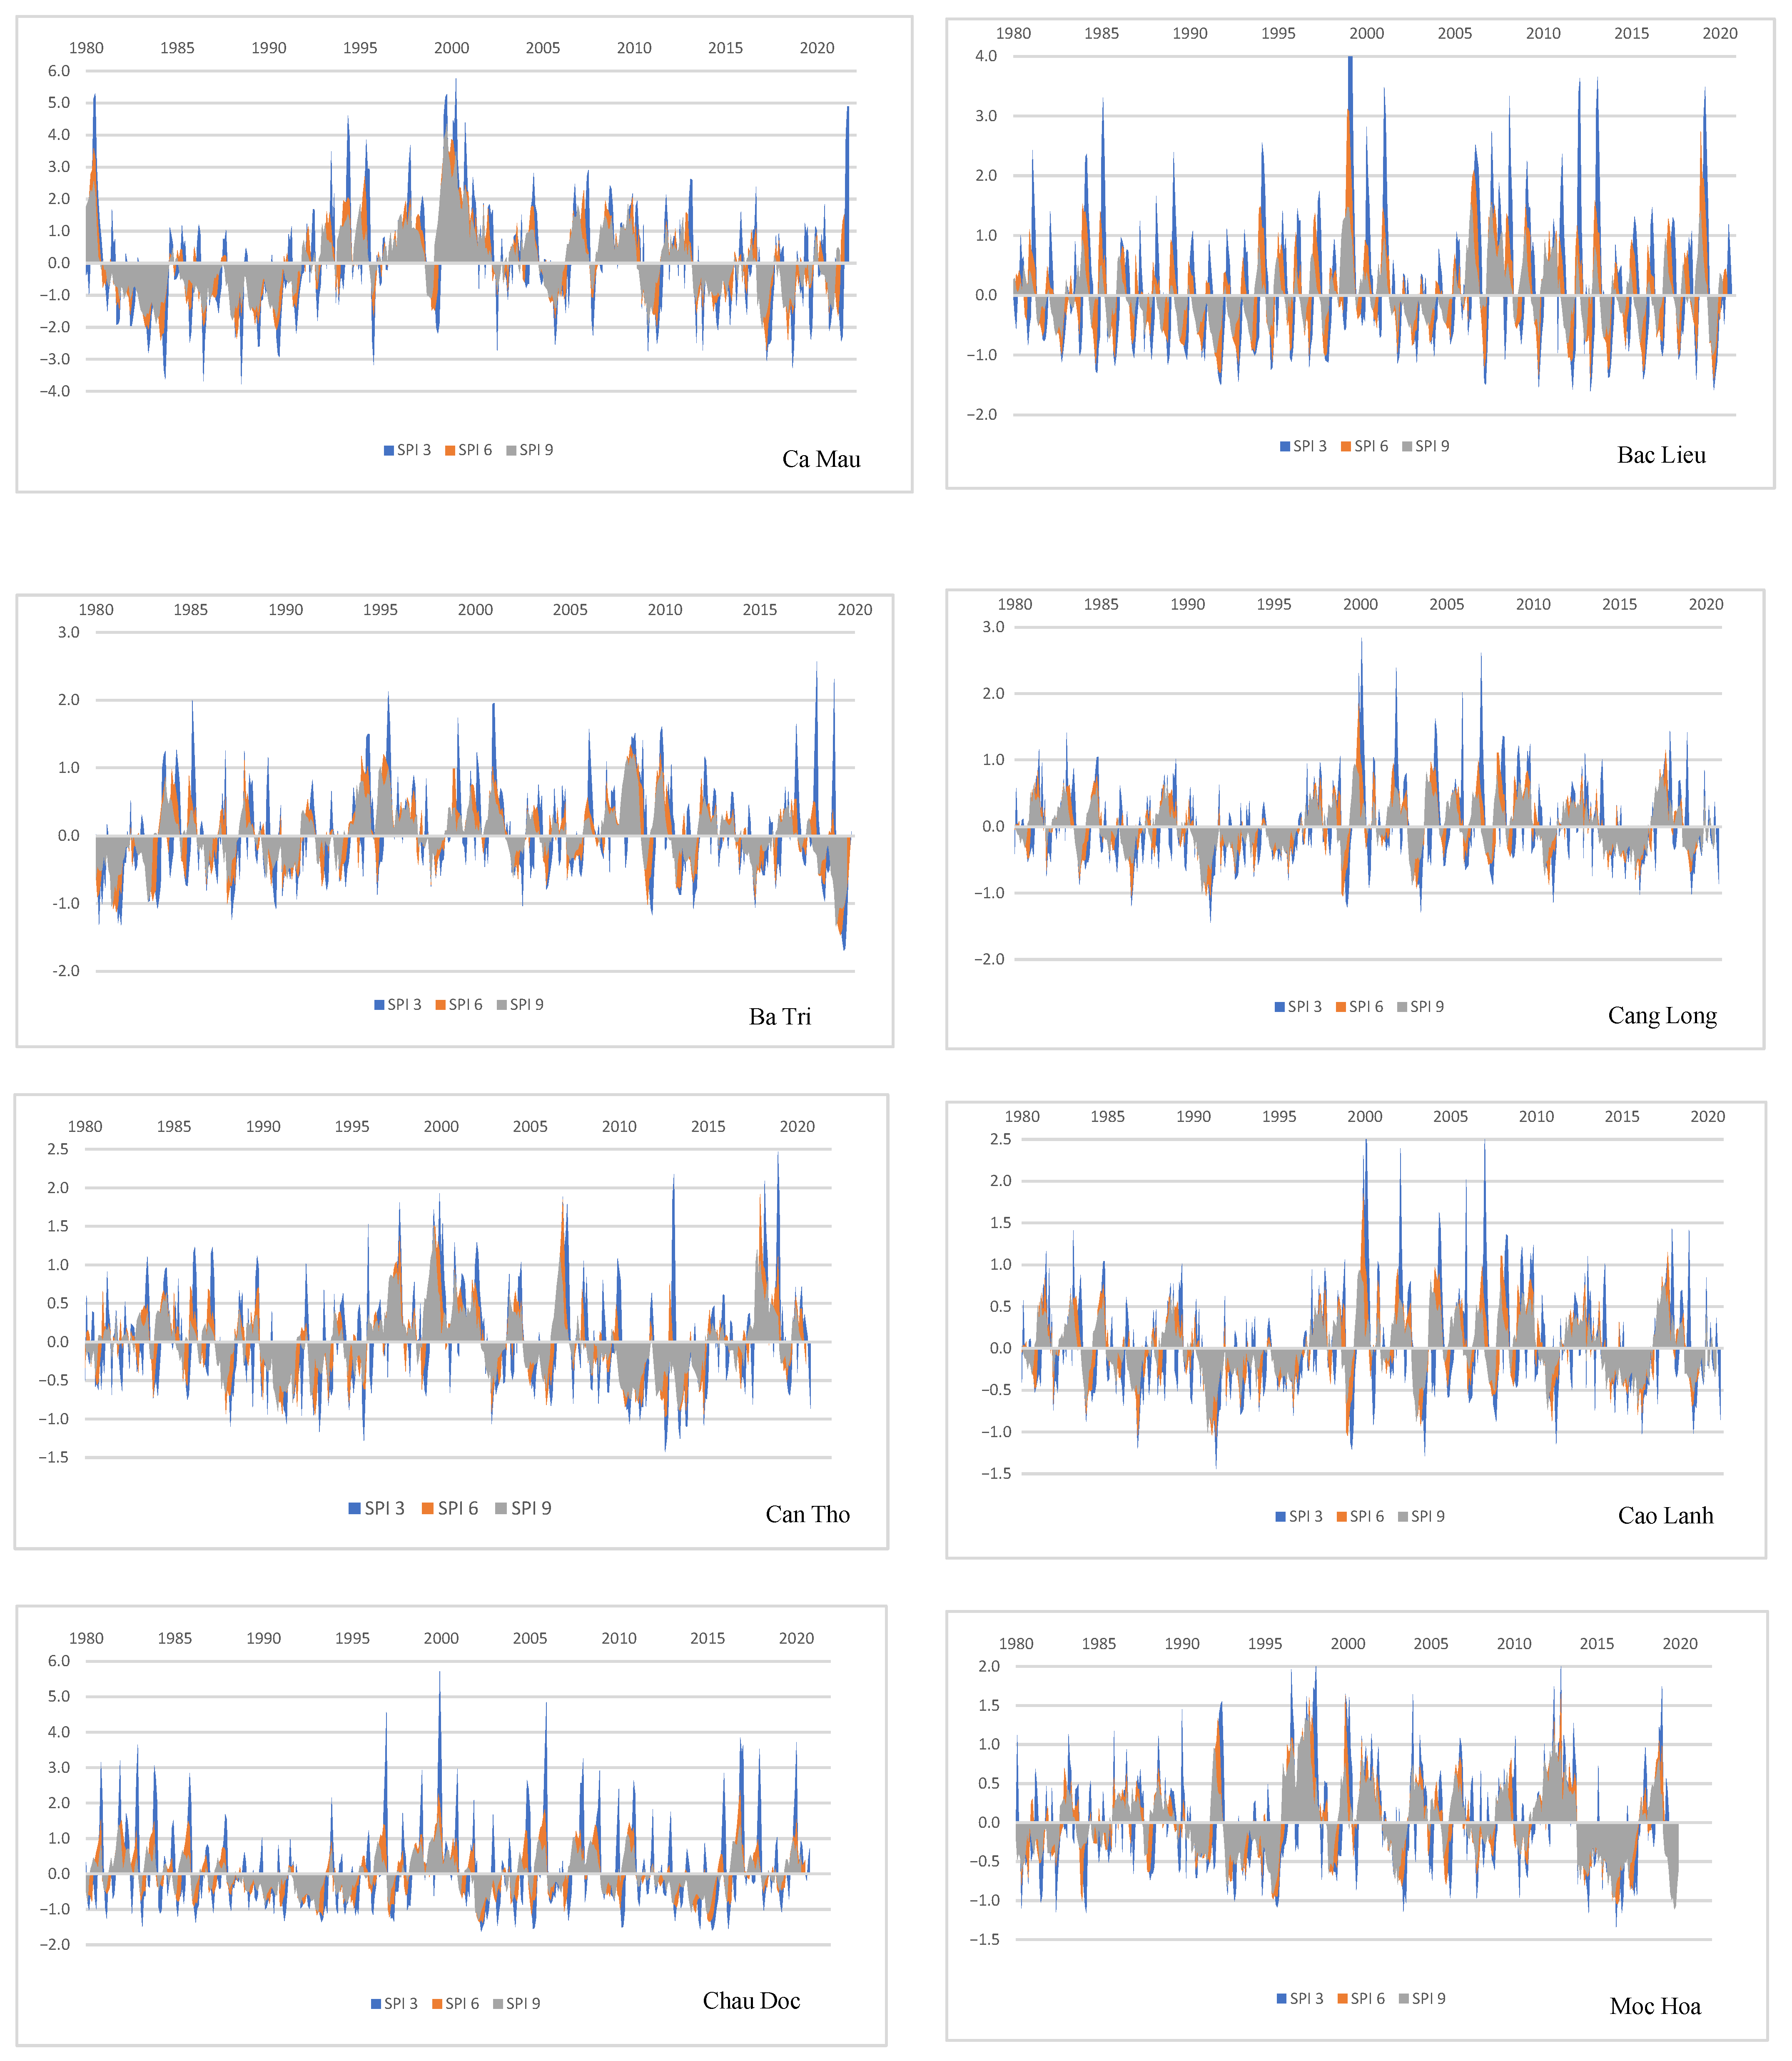
3.3. SPI 3-Month, SPI 6-Month, SPI 9-Month, and SPI 12-Month Drought Patterns

AHC analysis for SPI 3, SPI 6 and SPI 9 gave similar results with three clusters: Cluster 1 (Ca Mau), Cluster 2 (Bac Lieu, Ba Tri, Cao Lanh, Vinh Long), Cluster 3 (Cang Long, Can Tho, Chau Doc, Moc Hoa, My Tho, Rach Gia, Soc Trang, Vi Thanh, Tri Ton). Figure A2 shows the seasonal SPI for each meteorological station in the VMD, and Figure 6 and Figure 7 show the mean seasonal SPI and mean seasonal rice yields in the VMD.
The seasonal mean SPI in the VMD shows that a slight to moderate drought occurred in both the summer–autumn and winter–spring rice cropping seasons during both 1978 and 1995. During the period from 1996–2008, our data show that most of the summer–autumn and winter–spring seasons were moderately wet periods. However, there was a partial drought in 2002 for both summer–autumn and winter–spring seasons. The period from 2009–2019 displays a clear difference between the summer–autumn and autumn–winter seasons; specifically, the winter–spring season was wet, while the summer–autumn season exhibited drought. These results also support Lien’s similar research [19].
Winter–spring rice yields declined in 2016 and 2017 at the same time as high humidity levels (Figure 5). The excessive rainfall during this time may have contributed to waterlogging, which in turn may have affected rice yield. Years of poor rice yield in both the summer–autumn and the autumn–winter crops first began in 2001 and 2002, corresponding with the presence of mild drought in both seasons (Figure 5). In 2009, the summer–autumn rice yield corresponded with slight drought. In contrast to the overall trend, rice production was low in the research area for the two consecutive years (2016 and 2017) which coincided with a slight drought in the summer–autumn crop, but high humidity in the winter–spring crop. The area affected by the drought was not taken into account in this study. However, Lien et al. [19] demonstrated that the occurrence of drought corresponds to times when the VMD experienced recent losses in agricultural production due to both drought and saltwater intrusion, such as in the years 2002, 2004–2005, 2006–2007, and 2009–2010 [19]. Another study also revealed that rice crops were highly affected by drought and saline intrusion in the VMD [42]. These results are also consistent with the timing of yield reduction during drought. Therefore, it can be seen that not only drought, but also humidity potentially reduces rice yields.
The SPI, SPI3, SPI6, and SPI9 analysis of the summer–autumn and winter–spring seasons reveals that the overall pattern of drought in the VMD ranged from low to medium drought in the period 1978–2015, while wet conditions occurred in the period 2016–2008, and mild drought from 2008–2019. In order to examine drought variance through time and space, the study mapped 3 periods using SPI 12-month drought patterns (Figure 8).
The West coastal region showed moisture levels varying from slightly moist to severely wet throughout each of the three periods during 1980 and 2019, whether experiencing drought or wet periods. Regularly occurring slight to moderate droughts affected the northwest hinterlands of the VMD. Thereafter, the extent of the drought slowly subsided and conditions became wet towards the East and West seas. Between 1978 and 1995, a large drought spread from the interior to the East Coast and then progressively subsided toward the West Coast. The spatial distribution of drought during the period 1996–2008 is comparable to that of 1978–1995; however, during this time, the distribution of drought in both the interior and coastal East Sea areas was decreasing, while the West Coast areas were becoming more humid and with increased humidity levels. SPI 12 provides a general overview of how wetness and drought are distributed in the VMD. It has been pointed out that seasonal variation led to a change in rice seeding time to ensure productivity [43], and the reduction of precipitation caused a drop in rice yield [44]. Therefore, differences in the level of seasonal variation and in 3-month, 6-month, or 9-month droughts, as well as the crop’s growth stages, need to be carefully investigated.

4. Conclusions

The fluctuation of SPI values in consecutive periods of 3-, 6-, and 9-month drought differs in the three groups: Cluster 1 (Ca Mau), Cluster 2 (Bac Lieu, Ba Tri, Cao Lanh, and Vinh Long), and Cluster 3 (Can Tho, Can Tho, Chau Doc, Moc Hoa, My Tho, Rach Gia, Soc Trang, Vi Thanh, and Tri Ton). These results demonstrate that not only physical, but also geographical factors influence the distribution of drought in the VMD. Furthermore, drought in the VMD varies seasonally. Linking drought events to seasonal SPIs reveals that the seasonal SPI is responsible for the majority of average yield reduction events in the VMD. Rice productivity was shown to be affected not only by drought, but also by high humidity.
The VMD’s pattern of drought generally demonstrates that both rice cropping seasons experienced drought from 1978–1995. High humidity levels were present in both the summer–autumn and winter–spring harvests between 1996 and 2005. It should be noted that there is a distinction between the two seasons from 2006–2019: summer–autumn crops tend to be dry, but winter–spring crops are typically wet. However, considering the geographical characteristics and comparing these results taking different spatial scales into consideration will give these research findings more credibility and relevance; this is a limitation for this work and can be considered for future study. Moreover, there is a strong positive association between drought and salinity. This emphasizes the importance of holistic management plans looking into the system dynamics.

Author Contributions

Conceptualization, K.L. and H.V.T.M.; methodology, P.K., L.H.B.N., H.V.T.M., K.L. and T.V.T.; software, G.M., N.D.G.N., S.K.S., S.K., H.V.T.M. and N.T.T.; formal analysis, N.T.T., B.T.B.L. and K.L.; data curation, L.H.B.N., T.G.H. and B.T.B.L.; writing—original draft preparation, P.K., N.K.D., T.V.T., H.V.T.M., G.M., N.D.G.N., S.K.S., S.K. and K.L.; writing—review and editing, P.K., K.L. and N.K.D. All authors have read and agreed to the published version of the manuscript.

Funding

This research received no external funding.

Institutional Review Board Statement

Not applicable.

Informed Consent Statement

Not applicable.

Data Availability Statement

Not applicable.

Conflicts of Interest

The authors declare no conflict of interest.

Appendix A

Figure A1. The SPI 3, SPI 6 and SPI 9 at 14 meteorological stations in the VMD.
Climate 11 00013 g0a1aClimate 11 00013 g0a1b
Figure A2. The winter−spring (WS) SPI and summer−autumn (SA) SPI at 14 meteorological stations in the VMD.
Climate 11 00013 g0a2aClimate 11 00013 g0a2bClimate 11 00013 g0a2c

References

  1. Tfwala, C.; Mengistu, A.; Seyama, E.; Mosia, M.; van Rensburg, L.; Mvubu, B.; Mbingo, M.; Dlamini, P. Nationwide Temporal Variability of Droughts in the Kingdom of Eswatini: 1981–2018. Heliyon 2020, 6, e05707. [Google Scholar] [CrossRef] [PubMed]
  2. Dow, K. News Coverage of Drought Impacts and Vulnerability in the US Carolinas, 1998–2007. Nat. Hazards 2010, 54, 497–518. [Google Scholar] [CrossRef]
  3. Popova, Z.; Ivanova, M.; Martins, D.; Pereira, L.; Doneva, K.; Alexandrov, V.; Kercheva, M. Vulnerability of Bulgarian Agriculture to Drought and Climate Variability with Focus on Rainfed Maize Systems. Nat. Hazards 2014, 74, 865–886. [Google Scholar] [CrossRef]
  4. Vicente-Serrano, S.M.; Quiring, S.M.; Pena-Gallardo, M.; Yuan, S.; Dominguez-Castro, F. A Review of Environmental Droughts: Increased Risk under Global Warming? Earth-Sci. Rev. 2020, 201, 102953. [Google Scholar] [CrossRef]
  5. Dahal, P.; Shrestha, N.S.; Shrestha, M.L.; Krakauer, N.Y.; Panthi, J.; Pradhanang, S.M.; Jha, A.; Lakhankar, T. Drought Risk Assessment in Central Nepal: Temporal and Spatial Analysis. Nat. Hazards 2016, 80, 1913–1932. [Google Scholar] [CrossRef] [Green Version]
  6. Wong, G.; Lambert, M.; Leonard, M.; Metcalfe, A. Drought Analysis Using Trivariate Copulas Conditional on Climate States. J. Hydrol. Eng. 2010, 15, 129–141. [Google Scholar] [CrossRef]
  7. Bevacqua, A.G.; Chaffe, P.L.; Chagas, V.B.; AghaKouchak, A. Spatial and Temporal Patterns of Propagation from Meteorological to Hydrological Droughts in Brazil. J. Hydrol. 2021, 603, 126902. [Google Scholar] [CrossRef]
  8. NOAA Defense Meteorological Satellite Program. Available online: https://ngdc.noaa.gov/ngdc.html (accessed on 1 May 2019).
  9. Mekong River Commission. Drought Management Strategy for the Lower Mekong Basin 2020–2025. Available online: https://www.mrcmekong.org/resource/ajg4ye (accessed on 4 June 2022).
  10. Nguyen, H.T.; Tran, V.H.; Tu, T.N. Research on Droughts Based on the Drought Index (K) on Binh Thuan Province. Vietnam J. Hydrometeorol. 2022, 734, 34–49. [Google Scholar]
  11. Hong, N.V.; Phan, T.T.; Giai, N.S. Possibilities of Use the Standardized Precipitation Index (SPI) in Assessing Influence of Dry and Wet Conditions to Rice Crop Yield in Can Tho and Hau Giang Provinces. J. Sci. Clim. Chang. 2018, 5, 36–42. [Google Scholar]
  12. World Meteorological Organization. The Drought Indices. Available online: https://public.wmo.int/en (accessed on 23 July 2022).
  13. Le, M.-H.; Kim, H.; Moon, H.; Zhang, R.; Lakshmi, V.; Nguyen, L.-B. Assessment of Drought Conditions over Vietnam Using Standardized Precipitation Evapotranspiration Index, MERRA-2 Re-Analysis, and Dynamic Land Cover. J. Hydrol. Reg. Stud. 2020, 32, 100767. [Google Scholar] [CrossRef]
  14. Moreira, E.E.; Coelho, C.A.; Paulo, A.A.; Pereira, L.S.; Mexia, J.T. SPI-Based Drought Category Prediction Using Loglinear Models. J. Hydrol. 2008, 354, 116–130. [Google Scholar] [CrossRef] [Green Version]
  15. Ty, T.V.; Hoai, D.T.T.H.; Minh, H.V.T. Mapping Meteorological Drought in the Mekong Delta under Climate Change. Cantho Univ. J. Sci. 2015, 226–233. [Google Scholar]
  16. Minh, H.V.T.; Kumar, P.; Van Ty, T.; Duy, D.V.; Han, T.G.; Lavane, K.; Avtar, R. Understanding Dry and Wet Conditions in the Vietnamese Mekong Delta Using Multiple Drought Indices: A Case Study in Ca Mau Province. Hydrology 2022, 9, 213. [Google Scholar] [CrossRef]
  17. Minh, H.V.T.; Lavane, K.; Ty, T.V.; Downes, N.K.; Hong, T.T.K.; Kumar, P. Evaluation of the Impact of Drought and Saline Water Intrusion on Rice Yields in the Mekong Delta, Vietnam. Water 2022, 14, 3499. [Google Scholar] [CrossRef]
  18. Van Ty, T.; Lavane, K.; Nguyen, P.C.; Downes, N.K.; Nam, N.D.G.; Minh, H.V.T.; Kumar, P. Assessment of Relationship between Climate Change, Drought, and Land Use and Land Cover Changes in a Semi-Mountainous Area of the Vietnamese Mekong Delta. Land 2022, 11, 2175. [Google Scholar]
  19. Lien, M.K.; Thai, T.H.; Trung, T.D.B.; Dai, H.V.; Diep, D.N. Drought Characteristics in the Mekong Delta. Vietnam J. Hydrometeorol. 2016, 5, 1–5. [Google Scholar]
  20. To, V.T. Assessment of Drought and Saltwater Intrusion; Causes and Forecast of Drought and Saline Intrusion in the Coming Time in the Mekong Delta from an Expert Perspective. Available online: http://dmc.gov.vn/news-detail/assessment-causes-and-forecasts-of-drought-saltwater-intrusion-in-the-mekong-delta-from-expert-perspective-cd9902-32.html?lang=en-US (accessed on 25 October 2022).
  21. Nguyen, V.B.; Tran, T.L.H.; Trien, T.; Van, P.D.T. Impacts of Saline Intrusion on Agriculture and Aquaculture in the Tran De District, Soc Trang Province. Cantho Univ. J. Sci. 2017, 94–100. [Google Scholar]
  22. Be, N.V.; Tri, V.P.Đ.; Hang, T.T.L.; An, N.T. Impacts of Saline Intrusion on Water Resource Management for Agricultural Production in Long Phu District, Soc Trang Province. Cantho Univ. J. Sci. 2017, 104–112. [Google Scholar]
  23. Vietnam News Agency Overview of the Mekong Delta Region. 2022. Available online: https://www.vietnamplus.vn/ (accessed on 26 August 2022).
  24. Vietnames Broadcast Mekong Delta with the Role of Ensuring National Food Security. Available online: https://vovworld.vn/ (accessed on 26 August 2020).
  25. Ministry of Planning and Investment. Agricultural, Forestry and Fishery Production in November and 11 Months of 2022. Available online: https://www.mpi.gov.vn/en/Pages/tinbai.aspx?idTin=56171&idcm=49 (accessed on 10 September 2022).
  26. Magazine Numbers and Facts Drought, Saltwater Intrusion in the Mekong Delta Situation and Solutions. Available online: https://consosukien.vn/ (accessed on 26 August 2022).
  27. Ngan an Hạn Hán, Xâm Nhập Mặn ở Đồng Bằng Sông Cửu Long Thực Trạng và Giải Pháp. Available online: https://consosukien.vn/han-han-xam-nhap-man-o-dong-bang-song-cuu-long-thuc-trang-va-giai-phap.htm (accessed on 10 August 2022).
  28. Wilhite, D.A. Quantification of Agricultural Drought for Effective Drought Mitigation and Preparedness: Key Issues and Challenges. In Proceedings of the Agricultural Drought Indices: Proceedings of an Expert Meeting, 2–4 June 2010, Murcia, Spain; pp. 13–21.
  29. Feng, P.; Wang, B.; Liu, D.L.; Yu, Q. Machine Learning-Based Integration of Remotely-Sensed Drought Factors Can Improve the Estimation of Agricultural Drought in South-Eastern Australia. Agric. Syst. 2019, 173, 303–316. [Google Scholar] [CrossRef]
  30. Yahaya, T.I.; Muhammed, M. Assessing Rainfall Variability Impacts Using Agricultural Index (ARI) on Cassava Growth in Ilorin Area of Kwara State, Nigenia. Int. J. Environ. Policy Issues Geo-Stud. Forum 2013, 6, 158–170. [Google Scholar]
  31. Pandžić, K.; Likso, T.; Pejić, I.; Šarčević, H.; Pecina, M.; Šestak, I.; Tomšić, D.; Strelec Mahović, N. Application of the Self-Calibrated Palmer Drought Severity Index and Standardized Precipitation Index for Estimation of Drought Impact on Maize Grain Yield in Pannonian Part of Croatia. Nat. Hazards 2022, 113, 1237–1262. [Google Scholar] [CrossRef]
  32. Agnew, C. Using the SPI to Identify Drought. In Proceedings of the Drought Network News (1994–2001); National Drought Mitigation Center: London, UK, 2000; Volume 12, p. 8. [Google Scholar]
  33. Soleimani, H.; Ahmadi, H.; Zehtabian, G. Comparison of Temporal and Spatial Trend of SPI, DI and CZI as Important Drought Indices to Map Using IDW Method in Taleghan Watershed. Ann. Biol. Res. 2013, 4, 46–55. [Google Scholar]
  34. Vicente-Serrano, S.M. Differences in Spatial Patterns of Drought on Different Time Scales: An Analysis of the Iberian Peninsula. Water Resour. Manag. 2006, 20, 37–60. [Google Scholar] [CrossRef]
  35. Thang, N.V.; Khiem, M.V. The Assessment and Estimate Dry Condition by SPI Indicator for the VMD Bu Using the SPI Index. Vietnam J. Hydrometeorol. 2017, 6, 1–9. [Google Scholar]
  36. Hirsch, R.M.; Slack, J.R.; Smith, R.A. Techniques of Trend Analysis for Monthly Water Quality Data. Water Resour. Res. 1982, 18, 107–121. [Google Scholar] [CrossRef] [Green Version]
  37. Mann, H.B. Nonparametric Tests against Trend. Econom. J. Econom. Soc. 1945, 13, 245–259. [Google Scholar] [CrossRef]
  38. Kendall, M. Rank Correlation Methods, 4th ed.; Charles Griffin: London, UK, 1975. [Google Scholar]
  39. Shrestha, S.; Kazama, F. Assessment of Surface Water Quality Using Multivariate Statistical Techniques: A Case Study of the Fuji River Basin, Japan. Spec. Sect. Environ. Risk Emerg. Manag. 2007, 22, 464–475. [Google Scholar] [CrossRef]
  40. Singh, K.P.; Malik, A.; Sinha, S. Water Quality Assessment and Apportionment of Pollution Sources of Gomti River (India) Using Multivariate Statistical Techniques—A Case Study. Anal. Chim. Acta 2005, 538, 355–374. [Google Scholar] [CrossRef]
  41. Minh, H.V.T.; Kurasaki, M.; Ty, T.V.; Tran, D.Q.; Le, K.N.; Avtar, R.; Rahman, M.; Osaki, M. Effects of Multi-Dike Protection Systems on Surface Water Quality in the Vietnamese Mekong Delta. Water 2019, 11, 1010. [Google Scholar] [CrossRef] [Green Version]
  42. Nguyen-Trung, K. Vulnerability to Natural Disasters: The Case of Vietnam’s Mekong Delta. In Vulnerability in a Mobile World; Forbes-Mewett, H., Ed.; Emerald Publishing Limited: Bingley, UK, 2019; pp. 71–90. ISBN 978-1-78756-912-6. [Google Scholar]
  43. Nguyen, V.H.; Yen, H.P.H. Seasonal Variation and Its Impacts in Rice-Growing Regions of the Mekong Delta. Int. J. Clim. Chang. Strat. Manag. 2021, 13, 483–491. [Google Scholar] [CrossRef]
  44. Kang, H.; Sridhar, V.; Mainuddin, M.; Trung, L.D. Future Rice Farming Threatened by Drought in the Lower Mekong Basin. Sci. Rep. 2021, 11, 9383. [Google Scholar] [CrossRef]
Figure 1. The study area, with locations of the 14 meteorological stations in the 13 provinces of the VMD.
Climate 11 00013 g001
Figure 2. SPI 12−month drought trends over the 14 meteorological stations of the VMD. The x axis denotes SPI 12−month drought.
Climate 11 00013 g002aClimate 11 00013 g002b
Figure 3. Continuous term of 3 months, SPI 3-month drought divided into 3 clusters by AHC analysis.
Climate 11 00013 g003
Figure 4. Continuous term of 6 months, SPI 6-month drought divided into 3 clusters by AHC analysis.
Climate 11 00013 g004
Figure 5. Continuous term of 9 months, SPI 9-month drought divided into 3 clusters by AHC analysis.
Climate 11 00013 g005
Figure 6. The arithmetic mean SPI of summer–autumn and winter–spring rice cropping seasons across 14 meteorological stations in the VMD for the period 1978–2019.
Climate 11 00013 g006
Figure 7. The arithmetic means of summer–autumn and winter–spring rice yields in the 13 provinces in the VMD.
Climate 11 00013 g007
Figure 8. The isoline of average SPI 12−month drought in the VMD: (a) period 1978–1995; (b) period 1996–2008; and (c) period 2009–2019.
Climate 11 00013 g008aClimate 11 00013 g008b
Table 1. The classification of drought and wet periods according to the SPI.
Drought LevelsSPI ValuesDrought LevelsSPI Values
Normal0–0.24Normal(−0.24)–0
Very slightly wet0.25–0.49Very slight drought(−49)–(−0.25)
Slightly wet0.5–0.99Slight drought(−0.99)–(−0.5)
Moderately wet1–1.44Moderate drought(−1.44)–(−1)
Severely wet1.5–1.99Severe drought(−1.99)–(−1.5)
Extremely wet>2Extreme drought<(−2)
Disclaimer/Publisher’s Note: The statements, opinions and data contained in all publications are solely those of the individual author(s) and contributor(s) and not of MDPI and/or the editor(s). MDPI and/or the editor(s) disclaim responsibility for any injury to people or property resulting from any ideas, methods, instructions or products referred to in the content.

