Article

Observed Zonal Variations of the Relationship between ITCZ Position and Meridional Temperature Contrast

Department of Earth, Environmental and Planetary Sciences, Brown University, Providence, RI 02912, USA
*
Author to whom correspondence should be addressed.
Climate 2022, 10(3), 30; https://doi.org/10.3390/cli10030030
Submission received: 11 January 2022 / Revised: 11 February 2022 / Accepted: 21 February 2022 / Published: 23 February 2022

Abstract

:
While the zonal-mean position of the intertropical convergence zone (ITCZ) is well explained using the zonal-mean energetic framework, the regional variations of the ITCZ have been more difficult to characterize. We show a simple metric, the interhemispheric tropical sea surface temperature (SST) contrast, is useful for estimating the local ITCZ position over seasonal and interannual timescales in modern observations. We demonstrate a linear correspondence between the SST contrast and ITCZ position across oceanic sectors. Though consistently linear, the sensitivity of the ITCZ position to the SST contrast varies from ~1°/K to ~7°/K depending on location. We also find that the location of the Western Pacific interannual ITCZ is negatively correlated with the temperature of the North Atlantic Ocean. This result may help put constraints on past and future regional migrations of the ITCZ.

1. Introduction

A central feature of the tropical climate is the intertropical convergence zone (ITCZ), a band of intense convection arising from the convergence of the trade winds [1]. The ITCZ coincides with the ascending branch of the Hadley circulation, a thermally direct cell that transports energy from the tropics towards the poles [2]. At low levels, moisture converges at the ITCZ; while in the upper troposphere, energy diverges out of the tropics [3]. Over the seasonal cycle, the rainband associated with the ITCZ is observed to migrate into the warmer hemisphere, and the ITCZ is thought to migrate in response to radiative forcing over long timescales [4,5].
It has long been recognized that tropical rainfall is connected to the local distribution of sea surface temperature (SST; see [6] and references therein). The SST is closely related to the near-surface moist static energy, and consequently to variations of gross moist stability [7,8,9]. Moreover, the spatial pattern of SST can induce pressure gradients and drive low-level convergence [10,11]. Yet, the ITCZ does not simply follow the local SST maximum [12], and the ITCZ is increasingly thought to be influenced by nonlocal processes. A large volume of studies over the past two decades supports the idea of extratropical influence on ITCZ position [13], particularly by means of a change in the atmospheric energy transport [2,14,15,16,17,18,19,20]. This energetic framework relates the energy flux between the northern and southern hemispheres to the off-equatorial position of the Hadley cell, which is primarily responsible for moving energy across the equator [3,18,21]. Thus, an ITCZ north of the equator implies a southward atmospheric energy transport and an ITCZ south of the equator, a northward atmospheric energy transport. While the energetic framework holds in the zonal mean, it is less clear how the ITCZ in a given region will respond to a change in the atmospheric energy transport. When applied to the regional variations of the ITCZ, the energetic framework has had mixed success [22,23], which implies the need to account for both meridional and zonal energy fluxes [24], as well as the vertical structure of convection [25].
Understanding the regional migrations of the ITCZ, and their relation to the zonal-mean energetic framework, is of considerable importance in paleoclimate [26]. There is a seeming inconsistency of models, which simulate that the zonal-mean ITCZ shifted <1° since the Last Glacial Maximum [27], and paleoclimate proxies, which indicate regional migrations of ~5° [28,29]. In models, the response of the zonal-mean ITCZ to climate forcing is in general not useful for characterizing the response of the ITCZ in a given region, which can differ from the zonal mean in both magnitude and direction [30]. It is therefore necessary to understand the factors controlling the regional migrations of the ITCZ.
In the present study, we show a simple metric, the interhemispheric tropical SST contrast, is useful for characterizing the zonally heterogeneous migrations of the ITCZ over seasonal and interannual timescales in modern observations. On a global scale, it has been shown that the ITCZ position is correlated with the interhemispheric SST contrast [31,32]. A similar idea has been applied to select locations [33,34,35], but the strength of the relationship has not been systematically tested in all regions, nor has it been quantified. A recent study of idealized model simulations has shown that the SST contrast is a reliable predictor of the ITCZ position over the annual cycle [36], which is further motivation to detail this relationship in the observations. In the following, we show that the local ITCZ position and underlying SST contrast are correlated over seasonal and interannual timescales in all ocean basins. Yet, the sensitivity of the ITCZ position to the SST contrast varies from ~1°/K to ~7°/K across longitudes, with smallest sensitivities observed in the Atlantic and largest in the Central Pacific and Indian. These results may be useful for understanding the local processes behind regional migrations of the ITCZ and may have an application to paleoclimate. The latter is suggested by the work of McGee et al. [27], who made use of the global relationship between the ITCZ position and SST contrast to infer past migrations of the ITCZ from SST proxies. By showing that SST confers reliable insight into the zonally heterogeneous migrations of the ITCZ, at least in modern observations, we argue that some form of this relationship may be useful for mapping tropical precipitation through recent geological history and bridging the discrepancy between paleoclimate proxies and models.

2. Materials and Methods

Precipitation data come from the Tropical Rainfall Measuring Mission (TRMM) and Global Precipitation Measurement (GPM) mission satellites [37]. We selected a time period beginning on 1 January 1998 and terminating on 31 December 2018. The spatial resolution is 0.25° × 0.25°, and the product is averaged monthly. Measurements of SST are supplied by the Met Office Hadley Centre Sea Ice and Sea Surface Temperature (HadISST) globally complete dataset, gridded to 1° × 1° resolution and averaged monthly [38].
There is no universally adopted index for the ITCZ position. In this study, we make use of two common indices: the latitude of the precipitation centroid (PC) and the latitude of maximum precipitation (PM). For a given year and month, we calculate at each longitude the area-weighted integral of precipitation from 20° S to 20° N. The precipitation centroid is then determined to be the latitude PC for which the area-weighted integral from 20° S to PC equals half of the total precipitation at that longitude, interpolated to the midpoint when PC falls between two discretely spaced latitudes [39]. For a given year and month, the precipitation maximum is the latitude of maximum area-weighted precipitation at each longitude. We use the precipitation centroid as our primary index for ITCZ position and use the precipitation maximum to constrain the ITCZ position when it is ambiguous (see Section 3.2). This is necessary because the ITCZ is spatially heterogeneous. In the Atlantic and Eastern Pacific, the ITCZ is characterized by a single thin rainband; in the Warm Pool, the ITCZ is broad and diffuse; in the Indian, a monsoon circulation predominates the boreal summer; and in the Central Pacific, and Eastern Pacific in February/March, a double ITCZ is present [1]. It is difficult for a single index to capture the local ITCZ position in every case. We rely mostly on the precipitation centroid, since it incorporates the full spatial distribution of precipitation, and use it without alteration in our basin-wide analysis (Section 3.1). However, in our longitudinal analysis (Section 3.2), which is more subject to variability because it involves fewer data points, we exclude the centroid that falls outside of the neighborhood of the precipitation maximum, specifically when |PC − PM| > 3°, as a case when the ITCZ position is ambiguous.
We calculate the local interhemispheric SST contrast (ΔSST) as the difference between the area-weighted mean northern hemisphere SST (from 0° to 20° N) and mean southern hemisphere SST (from 20° S to 0°) at each longitude. Only those longitudes are included where 95% of grid boxes from 20° S to 20° N are oceanic. We follow previous studies in performing a linear regression analysis of the precipitation centroid and interhemispheric SST contrast [27,31,40]. In Section 3.1, we show the average relationship in ocean basins and sectors of the Pacific; and in Section 3.2, we show the relationship at individual longitudes. The regions of interest are borrowed from Waliser and Gautier [1]. They include global, Indian (60° E–100° E), Pacific (110° E–100° W), Atlantic (10° W–40° W), Western Pacific (110° E–150° E), Central Pacific (160° E–160° W), and Eastern Pacific (100° W–140° W).

3. Results

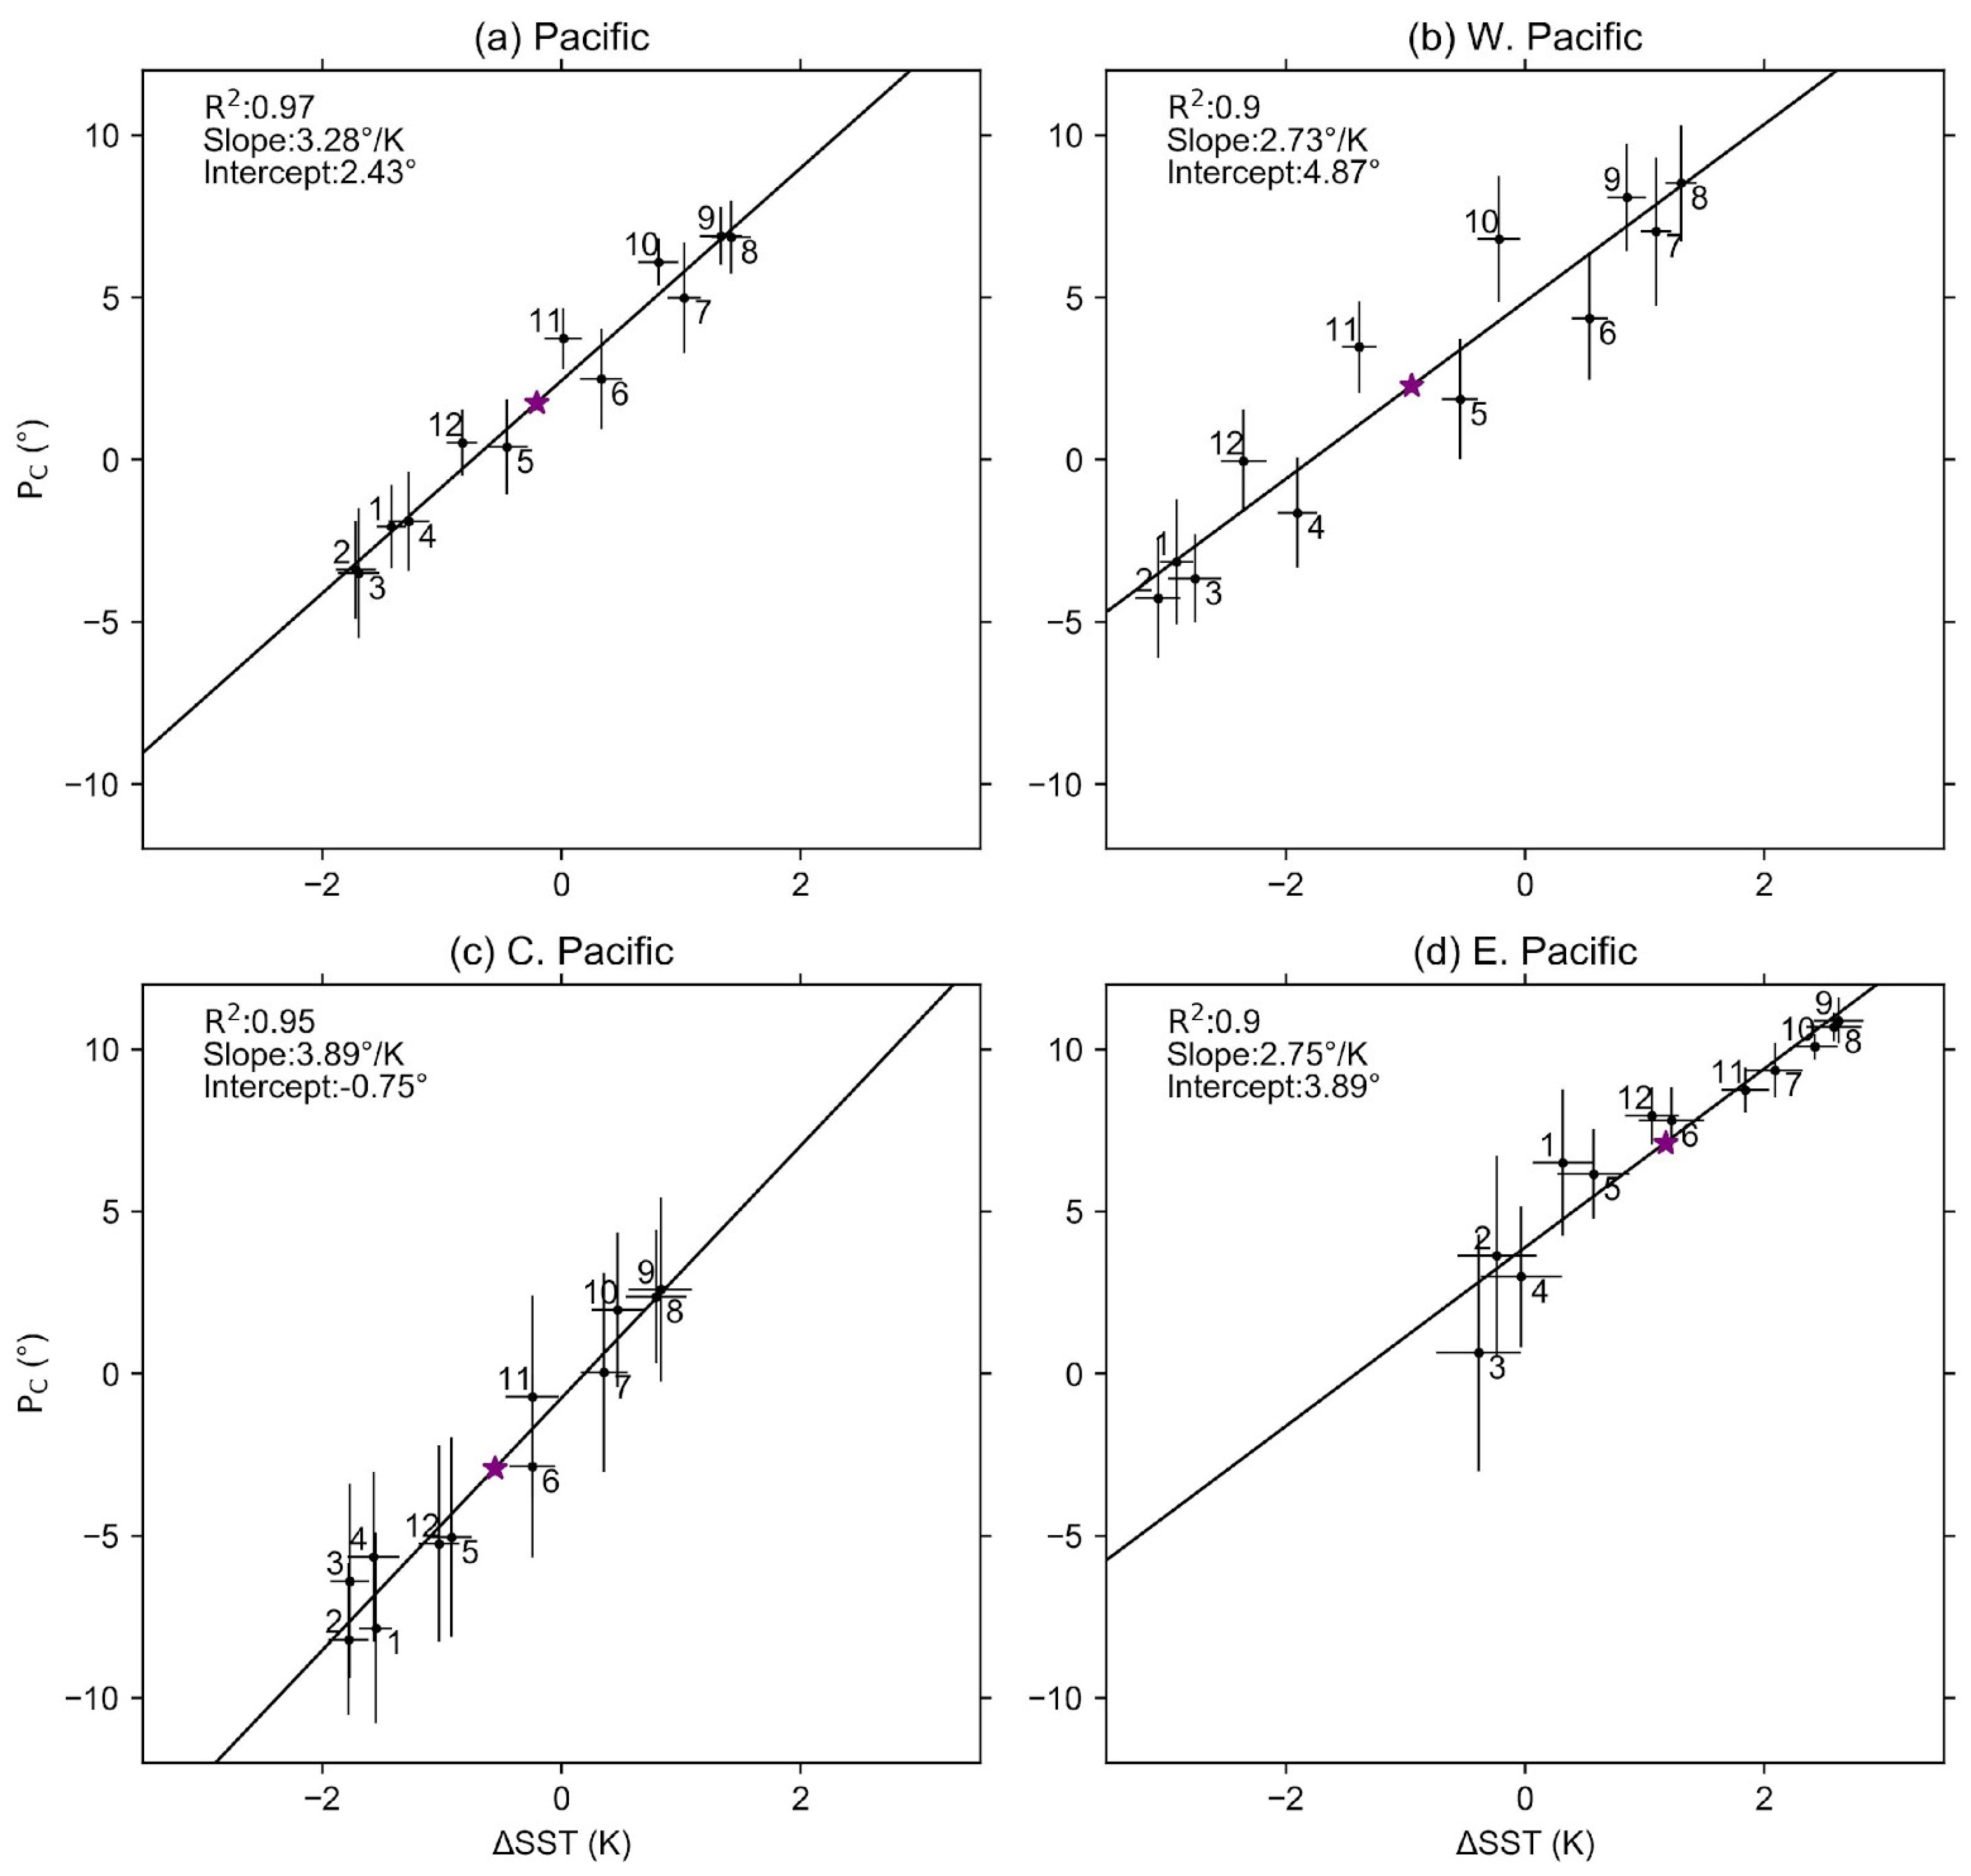
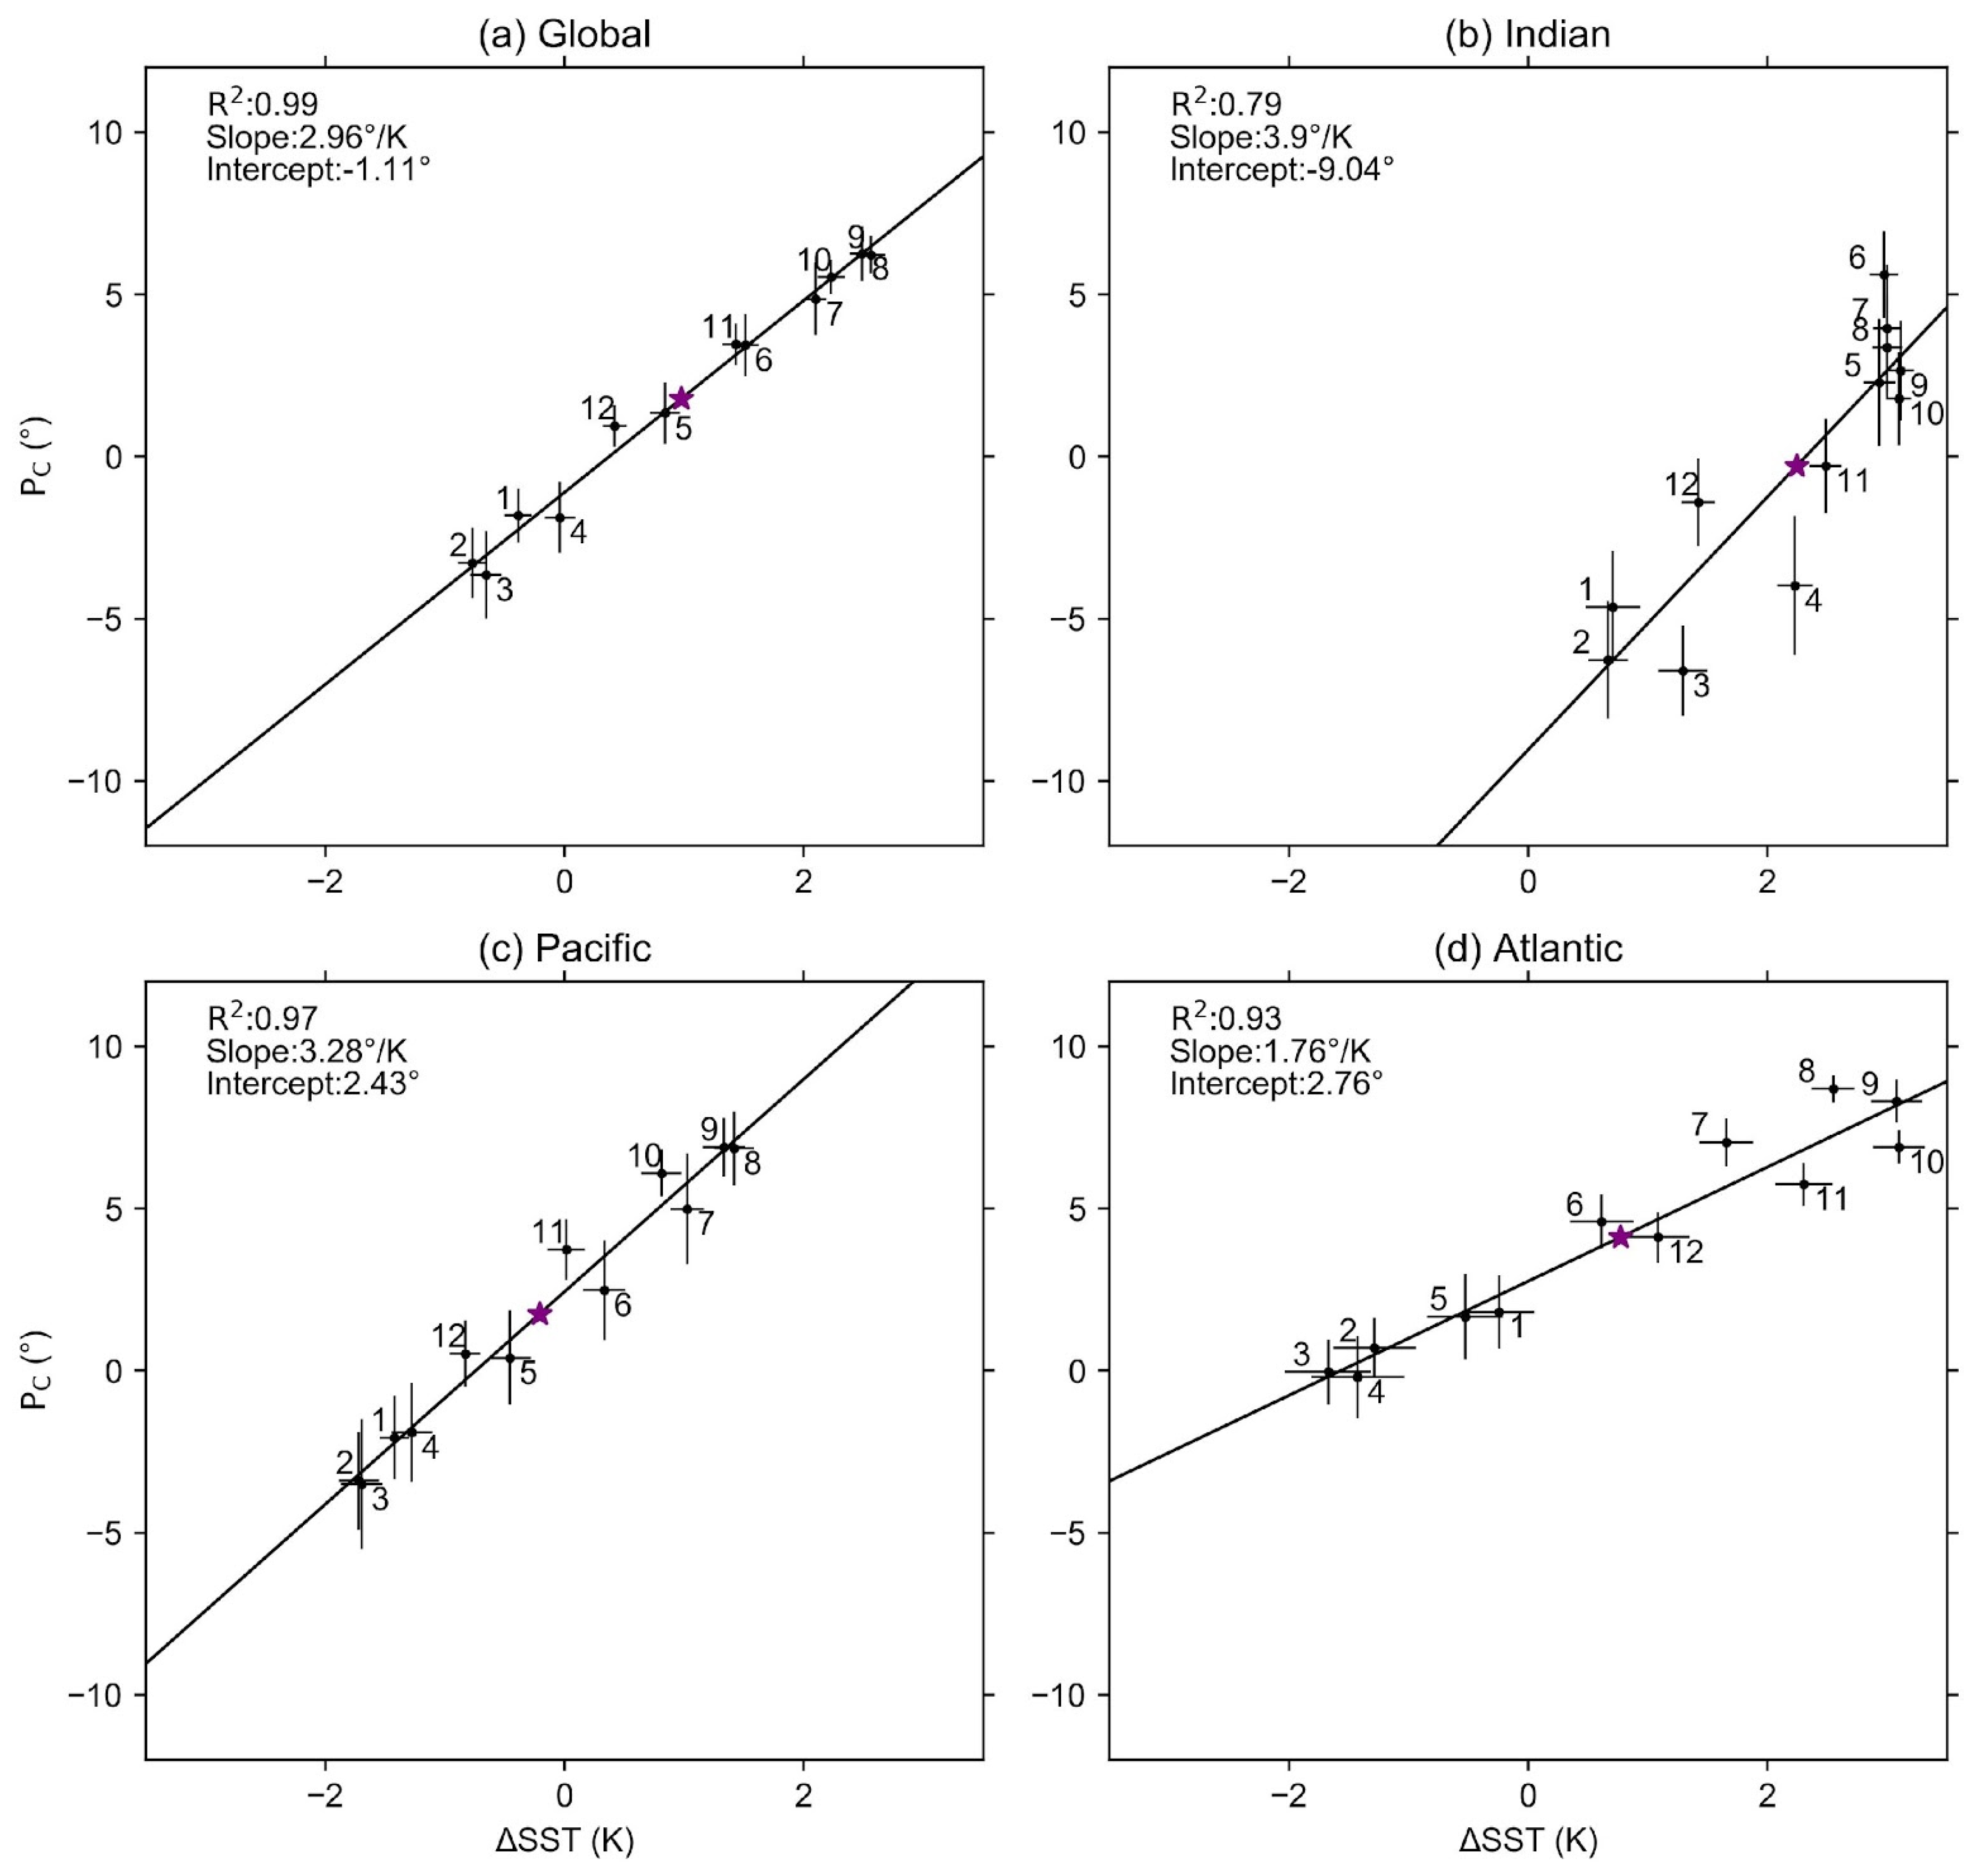
3.1. Basin-Wide Variations

We show a strong correlation between ITCZ position (PC) and regional interhemispheric SST contrast (ΔSST) over the annual cycle in ocean basins (Figure 1) and sectors of the Pacific (Figure 2). In the global case (Figure 1a), we find a strong correlation coefficient (R2 = 0.99) and slope of the linear regression (2.96°/K), which agree with previous work [31]. The correlation coefficient is found to be higher than that of Donohoe et al. [31], likely because we included only those portions of the ITCZ that migrate over the ocean. Next, we apply this analysis to individual ocean basins and sectors of the Pacific. We find that a strong linear relationship is present in all regions, and that each basin and sector is characterized by a unique regression slope (Figure 1b–d and Figure 2), which has not previously been shown.
We refer to the regression slope of the precipitation centroid and SST contrast as the ‘sensitivity’ of the ITCZ position to the local meridional SST contrast. We observe substantial differences in the sensitivity of the ITCZ position to the SST contrast between regions. The lowest sensitivity is found in the Atlantic (Figure 1d; 1.76°/K). In boreal summer and fall, upwelling leads to a strong SST gradient in the Atlantic (the Atlantic cold tongue); yet in boreal winter and spring, when the SST gradient is reduced, the ITCZ remains mostly in the northern hemisphere. The Eastern Pacific (Figure 2d) is also characterized by a strong SST gradient, but the sensitivity of the ITCZ is markedly higher (2.75°/K). It is notable that a single month, March, appears to exert a strong influence on the correlation and slope; with March excluded, the correlation coefficient is raised from 0.90 to 0.93, and the sensitivity is lowered to 2.43°/K. This is likely the imprint of the double ITCZ which often forms in March in the Eastern Pacific (for discussion of the effect of El Niño on the double ITCZ in boreal spring, see [41]). The highest sensitivity is observed in the Indian (Figure 1b; 3.9°/K), where the monsoon circulation draws the ITCZ abruptly northward in June. In this case, the land-ocean heating contrast is likely more important than the SST gradient in boreal summer, which would account for the relatively weak correlation (R2 = 0.79). The Central Pacific (Figure 2c) displays a high sensitivity (3.89°/K) and strong correlation (R2 = 0.95). As the Central Pacific contains a double ITCZ [1], the high sensitivity likely results from the seasonal waxing and waning of its two rainbands, which could cause the precipitation centroid to move across hemispheres with a small change in the SST contrast [42]. We discuss the implications of these regional differences in sensitivity in Section 4.
A noticeable feature of the Western Pacific (Figure 2b) is the elliptical shape of the relationship between the ITCZ position and SST contrast [31,43]. Though more subtle, this feature is also observed to a certain extent in the Central Pacific, Indian, and Atlantic. In the Western Pacific, as the ITCZ migrates from the southern hemisphere to the northern hemisphere (February to August), the SST contrast changes before the ITCZ. Likewise, as the ITCZ returns from the northern hemisphere to the southern hemisphere (August to February), the ITCZ lags the change in the SST contrast. This is also the case in the Central Pacific (from May to November) and Indian (from December to April). On the contrary, the elliptical shape in the Atlantic (June to December) implies that the shift of the ITCZ precedes the change in the SST contrast. Based on this result, we conjecture that the seasonal migration of the ITCZ in the Western Pacific, Central Pacific, and Indian is facilitated by the SST contrast, but a different mechanism is involved in the Atlantic, possibly related to processes over land, where the seasonal temperature response to solar forcing is faster than that of the ocean.
Lastly, we depict the 21-year interannual variability in Figure 1 and Figure 2 by the length of each cross, which represents 1 standard deviation from the mean of each month. In all of the 21 years, the seasonal correlation between the ITCZ position and SST contrast is significant in each basin and sector (see Supplementary Materials Table S1). However, the sensitivity of the ITCZ position to the SST contrast can vary between years. In the Atlantic, the variability is minimal (the standard deviation is 0.18°/K, or ~10%), while in the Central Pacific, the variability is more substantial (1.1°/K, or ~28%; Table S1). In addition, we find a significant correlation between the annual-mean ITCZ position and SST contrast over the 21-year period in all regions except the Indian region (Table S2), for which we presume the monsoon circulation dominates the interannual variability instead of the SST contrast. The correlation of the annual-mean ITCZ position and SST contrast is weaker than that of the seasonal relationship but is comparable to the interannual correlation of the zonal-mean ITCZ position and atmospheric heat transport found in a prior study [32]. We also find that the sensitivity of the annual-mean ITCZ position to the SST contrast is offset from that of the seasonal relationship (Table S2), but the basins with a higher seasonal slope tend to have a higher interannual slope. It should be noted that the interannual spread of the annual-mean ITCZ position and SST contrast is small compared to the seasonal amplitude, and we conclude that the correlation is stronger when the SST contrast is sufficiently large; or equivalently, when the points are clustered, the linear relationship is less apparent.

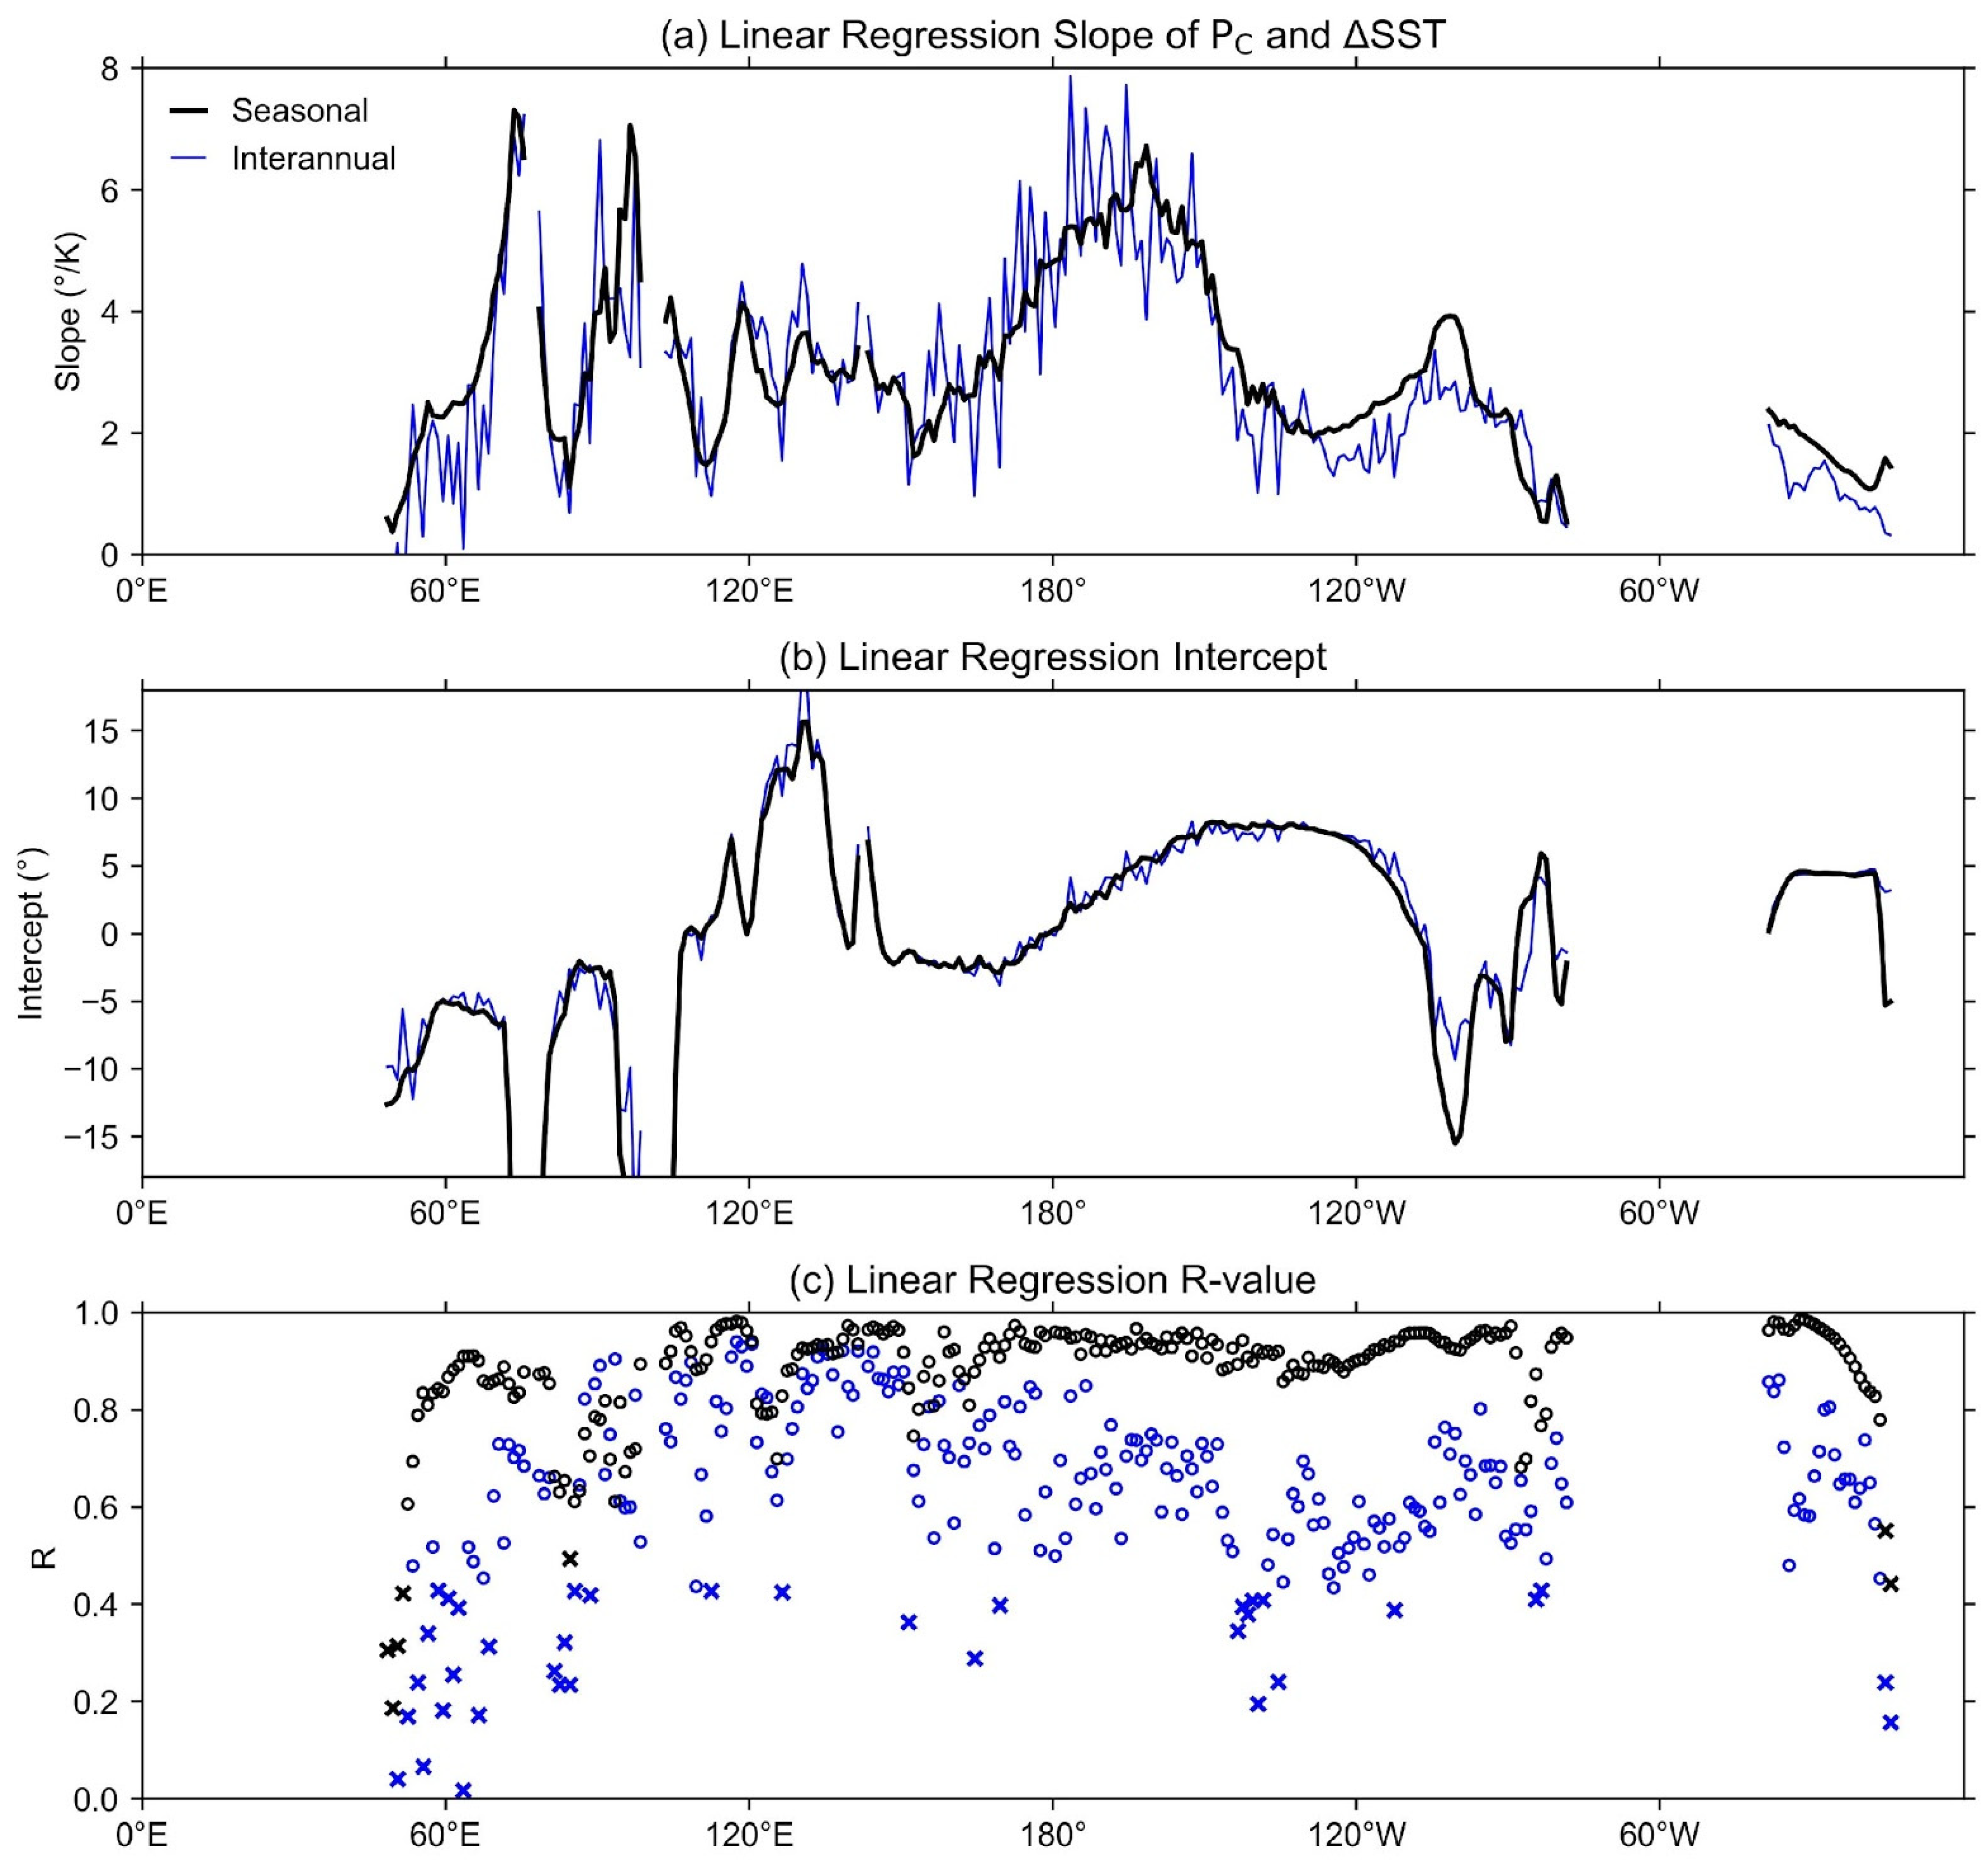
3.2. Longitudinal Variations

We show for each ocean basin and sector of the Pacific a linear relationship between the ITCZ position and local interhemispheric SST contrast, which is characterized by a unique regression slope. Here, we examine the longitudinal variations of this correspondence. Figure 3 shows the seasonal and interannual relationships of the local ITCZ position and underlying SST contrast at each longitude. The seasonal relationship is the linear regression at each longitude of the 21-year mean precipitation centroid and SST contrast for each month of the year, and the interannual relationship is the linear regression at each longitude of the annual-mean precipitation centroid and SST contrast over 21 years. The regression slope is shown in Figure 3a, the intercept in Figure 3b, and correlation coefficient in Figure 3c. Unlike the analysis in Section 3, we impose the condition |PC − PM| < 3° (see Section 2). If the precipitation centroid differs from the precipitation maximum by more than 3°, we consider the rainband too diffuse and without a single discernable ITCZ position; otherwise, we use the precipitation centroid as our index for ITCZ position, as in Section 3.1. We find this condition reduces some of the noise in the interannual variability. Lastly, the discontinuities in Figure 3 represent the land surface, since these regions are masked in our analysis (Section 2).
The seasonal ITCZ position and local SST contrast are correlated (R > 0.8) at nearly every longitude (Figure 3c). For the annual-mean ITCZ position and SST contrast (interannual variations), the correlations are weaker but nonetheless mainly significant. We note that we excluded the centroid outside the maximum precipitation neighborhood to avoid an ambiguous ITCZ position. The interannual variability of the annual-mean SST contrast is smaller than the seasonal amplitude, so we expect a weaker correlation. We observe substantial zonal variations of the sensitivity of the ITCZ position to the local SST contrast (Figure 3a). In the Indian basin (60° E–100° E), we find steep changes in sensitivity associated with the Indian subcontinent (~80° E) and western Maritime Continent (~100° E). The sensitivity in the Western Pacific (110° E–150° E) is low, but rises in the Central Pacific (160° E–160° W), reaching a maximum of ~7°/K. This maximum occurs near the boundary of the Central and Eastern Pacific (~160° W), where the South Pacific Convergence Zone (SPCZ) is largely present in boreal winter and spring, but largely absent in boreal summer and fall. We conclude that a small change in the SST contrast coincides with the large-scale transition between an SPCZ-dominant and ITCZ-dominant regime. The Eastern Pacific (100° W–140° W) generally restores to a lower sensitivity, except near 100° W, where the higher sensitivity likely reflects the monsoon circulation in Central America. Lastly, the sensitivity in the Atlantic (10° W–40° W) declines from west to east. In the eastern sector of the basin, the Atlantic cold tongue may restrict the migration of the ITCZ to the northern hemisphere, reducing its seasonal range and sensitivity. We note that the interannual regression slope appears to be reasonably coherent with the seasonal regression slope, though there is a high degree of noise in the interannual signal. In the plot of the regression intercept (Figure 3b), these signals appear quite coherent. We conclude that the local ITCZ position is closely connected to the local SST contrast over seasonal and interannual timescales, and this connection is characterized by a local sensitivity, which varies from ~1°/K to ~7°/K depending on location. Yet, a physical explanation for the zonal variations of the sensitivity is not entirely clear and may involve nonlocal processes. We discuss this further in Section 4.

4. Discussion

There is a significant seasonal and interannual correlation between the ITCZ position and local interhemispheric SST contrast in ocean basins, sectors of the Pacific, and individual longitudes. This relationship is characterized by a linear sensitivity of the ITCZ position to the SST contrast, and the slope of the linear regression between the precipitation centroid and SST contrast varies from ~1°/K to ~7°/K by location. We find the seasonal and interannual sensitivities are coherent, which indicates that a common mechanism underlies both relationships. On average, the Atlantic has the lowest sensitivity, the Indian and Central Pacific, the highest. In the Pacific, there is a local maximum of the sensitivity (~7°/K) at the eastern boundary of the Central Pacific (~160° W). We attribute this maximum to the transition between an SPCZ-dominant and ITCZ-dominant regime. A core of cold equatorial waters extends from the Eastern Pacific to the Central Pacific, suppressing convection and forcing the rainband to oscillate between these modes. Since the transition occurs alongside a small change in the SST contrast (the slope is high), we speculate that warming in the southeastern Pacific could cause a pronounced southward shift of the rainband. In the Eastern Pacific and Atlantic, the ITCZ is confined to the northern hemisphere, and the Western Pacific lacks the cold equatorial core of the Central Pacific, both of which narrow the seasonal range of the ITCZ and reduce its sensitivity and slope. The relationship between the ITCZ and SST contrast in the Indian is obscured by the effect of the monsoon circulation.
To find how large-scale teleconnections such as the El Niño Southern Oscillation (ENSO), Atlantic Multidecadal Oscillation (AMO), Indian Ocean Dipole (IOD), or Pacific Decadal Oscillation (PDO) play a role in this relationship, we calculated the correlation between climate indices and precipitation centroid (Tables S3–S6). The relationship is significant over the Central Pacific for Niño3, IOD, and PDO indices because those indices are most sensitive to the SST of the Central Pacific. The relationship between the AMO index and precipitation is significant over the Atlantic Ocean (R = 0.44, p < 0.05), and surprisingly over the Western Pacific with a negative slope (R = −0.70, p << 0.05). This suggests that the convection over the Western Pacific is highly linked to the Atlantic Meridional Overturning Circulation (AMOC). The link between AMOC and global precipitation was discussed extensively in a paleoclimate context, e.g., [27], and several studies, e.g., [44,45], showed the link between AMO and Pacific climate, suggesting that recent cooling in the Eastern Pacific may have been caused by abnormal warming in the North Atlantic. Our results differ from previous research because they suggest that the Western Pacific ITCZ moves southward during the warm phase of AMO. The importance of teleconnections in ocean basins is discussed in several recent studies [46,47,48,49].
The high sensitivity of the Indian ITCZ suggests that future warming of the tropical Indian Ocean [50] might have a significant effect on its position. A slowdown of the Atlantic Meridional Overturning Circulation [46] could lead to a significant change in the location of tropical convection.
While we have shown the zonal variations of the relationship between the ITCZ position and local SST contrast, it remains an outstanding challenge to relate these observations to the global energetic framework. The energetic framework theorizes a relationship between the zonal-mean ITCZ position and cross-equatorial atmospheric energy transport [16,31]. However, energy fluxes are not zonally uniform; there are substantial variations of gross moist stability [51], as well as cross-equatorial mass and moist static energy fluxes [52]. We hypothesize that the spatial distribution of SST plays a role in partitioning the cross-equatorial atmospheric energy transport by longitude. Moreover, the coupling of the ocean and atmosphere through wind-driven, oceanic cross-equatorial cells has been examined in recent studies of the damped ITCZ migrations in coupled models [53,54,55] and may help explain the observed relationship between the ITCZ position and local SST contrast found in the present study. In general, theories of the ITCZ position have been framed in the literature as constituting either an ‘SST perspective’ [33,56,57] or an ‘energetic perspective’ [14,15,58]; yet there is considerable overlap between them [16,43,59]. We suggest that the ITCZ may be locally coupled with the SST but still fit into the larger energetic framework.
Since the interhemispheric SST contrast is a useful indicator of ITCZ position, at least in modern observations, we note a possible application to the paleoclimate. Using the sensitivity of the ITCZ position to the SST contrast in an ocean basin or sector, one could verify or controvert an inferred, past regional ITCZ shift with SST proxies. For example, if the sensitivity of the Atlantic is similar to its present-day value (1.76°/K), then for a ~5° shift of the ITCZ in a past climate, one would expect to see a ~3 K change in the SST contrast. This method is analogous to that of McGee et al. [27] but applied to the regional (instead of global) ITCZ position. Ultimately, this method may be useful for addressing the seeming inconsistency of models and proxies in their representations of past ITCZ shifts. However, determining the past sensitivities of the ITCZ position to the local SST contrast is not entirely straightforward, since models do not always simulate realistic precipitation and SST in the equatorial Eastern Pacific and Atlantic (the double-ITCZ bias) [30,60]. Nevertheless, the connection between the ITCZ position and local SST contrast may prove useful for constraining the regional movements of the ITCZ in past and future climates.

Supplementary Materials

The following supporting information can be downloaded at: https://www.mdpi.com/article/10.3390/cli10030030/s1, Table S1: Seasonal Regression Outputs, Tables S2–S6: Interannual Regression Outputs.

Author Contributions

Conceptualization, E.M. and J.-E.L.; methodology, E.M. and J.-E.L.; software, E.M. and J.-E.L.; validation, E.M. and J.-E.L.; formal analysis, E.M. and J.-E.L.; investigation, E.M. and J.-E.L.; resources, E.M. and J.-E.L.; data curation, E.M. and J.-E.L.; writing—original draft preparation, E.M. and J.-E.L.; writing—review and editing, E.M. and J.-E.L.; visualization, E.M. and J.-E.L.; supervision, E.M. and J.-E.L.; project administration, E.M. and J.-E.L.; funding acquisition, E.M. and J.-E.L. All authors have read and agreed to the published version of the manuscript.

Funding

This research was funded by Brown University through the Karen T. Romer Undergraduate Teaching and Research Award and NSF AGS-1944545.

Institutional Review Board Statement

Not applicable.

Informed Consent Statement

Not applicable.

Data Availability Statement

The TRMM and GPM precipitation data is provided by the NASA Goddard Earth Services Data and Information Services Center (https://gpm.nasa.gov/data/directory, accessed on 10 February 2022) the HadISST data by the Met Office Hadley Centre (https://www.metoffice.gov.uk/hadobs/hadisst/, accessed on 10 February 2022) and climate indices by NOAA Physical Science Laboratory website (https://psl.noaa.gov/gcos_wgsp/Timeseries/, accessed on 10 February 2022).

Acknowledgments

We thank Jacobel, A., Wu, M., Xu, R. and Kowalczyk, J. who lent their support in many ways.

Conflicts of Interest

The authors declare no conflict of interest.

References

  1. Waliser, D.E.; Gautier, C. A Satellite-Derived Climatology of the ITCZ. J. Clim. 1993, 6, 2162–2174. [Google Scholar] [CrossRef]
  2. Schneider, T.; Bischoff, T.; Haug, G.H. Migrations and Dynamics of the Intertropical Convergence Zone. Nature 2014, 513, 45–53. [Google Scholar] [CrossRef] [PubMed]
  3. Frierson, D.M.W.; Hwang, Y.-T.; Fučkar, N.S.; Seager, R.; Kang, S.M.; Donohoe, A.; Maroon, E.A.; Liu, X.; Battisti, D.S. Contribution of Ocean Overturning Circulation to Tropical Rainfall Peak in the Northern Hemisphere. Nat. Geosci. 2013, 6, 940–944. [Google Scholar] [CrossRef] [Green Version]
  4. Haug, G.H.; Hughen, K.A.; Sigman, D.M.; Peterson, L.C.; Röhl, U. Southward Migration of the Intertropical Convergence Zone Through the Holocene. Science 2001, 293, 1304–1308. [Google Scholar] [CrossRef]
  5. Koutavas, A.; Lynch-Stieglitz, J. Variability of the Marine ITCZ over the Eastern Pacific during the Past 30,000 Years. In The Hadley Circulation: Present, Past and Future; Diaz, H.F., Bradley, R.S., Eds.; Advances in Global Change Research; Springer: Berlin, Germany, 2004; pp. 347–369. ISBN 978-1-4020-2944-8. [Google Scholar]
  6. He, J.; Johnson, N.C.; Vecchi, G.A.; Kirtman, B.; Wittenberg, A.T.; Sturm, S. Precipitation Sensitivity to Local Variations in Tropical Sea Surface Temperature. J. Clim. 2018, 31, 9225–9238. [Google Scholar] [CrossRef] [Green Version]
  7. Neelin, J.D.; Held, I.M. Modeling Tropical Convergence Based on the Moist Static Energy Budget. Mon. Weather. Rev. 1987, 115, 3–12. [Google Scholar] [CrossRef]
  8. Held, I.M. The Partitioning of the Poleward Energy Transport between the Tropical Ocean and Atmosphere. J. Atmos. Sci. 2001, 58, 943–948. [Google Scholar] [CrossRef] [Green Version]
  9. Hill, S.A.; Ming, Y.; Held, I.M. Mechanisms of Forced Tropical Meridional Energy Flux Change. J. Clim. 2015, 28, 1725–1742. [Google Scholar] [CrossRef] [Green Version]
  10. Lindzen, R.S.; Nigam, S. On the Role of Sea Surface Temperature Gradients in Forcing Low-Level Winds and Convergence in the Tropics. J. Atmos. Sci. 1987, 44, 2418–2436. [Google Scholar] [CrossRef] [Green Version]
  11. Back, L.E.; Bretherton, C.S. On the Relationship between SST Gradients, Boundary Layer Winds, and Convergence over the Tropical Oceans. J. Clim. 2009, 22, 4182–4196. [Google Scholar] [CrossRef]
  12. Waliser, D.E.; Somerville, R.C.J. Preferred Latitudes of the Intertropical Convergence Zone. J. Atmos. Sci. 1994, 51, 1619–1639. [Google Scholar] [CrossRef] [Green Version]
  13. Chiang, J.C.H.; Bitz, C.M. Influence of High Latitude Ice Cover on the Marine Intertropical Convergence Zone. Clim. Dyn. 2005, 25, 477–496. [Google Scholar] [CrossRef]
  14. Kang, S.M.; Held, I.M.; Frierson, D.M.W.; Zhao, M. The Response of the ITCZ to Extratropical Thermal Forcing: Idealized Slab-Ocean Experiments with a GCM. J. Clim. 2008, 21, 3521–3532. [Google Scholar] [CrossRef] [Green Version]
  15. Kang, S.M.; Frierson, D.M.W.; Held, I.M. The Tropical Response to Extratropical Thermal Forcing in an Idealized GCM: The Importance of Radiative Feedbacks and Convective Parameterization. J. Atmos. Sci. 2009, 66, 2812–2827. [Google Scholar] [CrossRef] [Green Version]
  16. Bischoff, T.; Schneider, T. Energetic Constraints on the Position of the Intertropical Convergence Zone. J. Clim. 2014, 27, 4937–4951. [Google Scholar] [CrossRef] [Green Version]
  17. Bischoff, T.; Schneider, T. The Equatorial Energy Balance, ITCZ Position, and Double-ITCZ Bifurcations. J. Clim. 2016, 29, 2997–3013. [Google Scholar] [CrossRef]
  18. Adam, O.; Bischoff, T.; Schneider, T. Seasonal and Interannual Variations of the Energy Flux Equator and ITCZ. Part I: Zonally Averaged ITCZ Position. J. Clim. 2016, 29, 3219–3230. [Google Scholar] [CrossRef]
  19. Kang, S.M.; Shin, Y.; Xie, S.-P. Extratropical Forcing and Tropical Rainfall Distribution: Energetics Framework and Ocean Ekman Advection. NPJ Clim. Atmos. Sci. 2018, 1, 20172. [Google Scholar] [CrossRef] [Green Version]
  20. Byrne, M.P.; Pendergrass, A.G.; Rapp, A.D.; Wodzicki, K.R. Response of the Intertropical Convergence Zone to Climate Change: Location, Width, and Strength. Curr. Clim. Chang. Rep. 2018, 4, 355–370. [Google Scholar] [CrossRef] [Green Version]
  21. Marshall, J.; Donohoe, A.; Ferreira, D.; McGee, D. The Ocean’s Role in Setting the Mean Position of the Inter-Tropical Convergence Zone. Clim. Dyn. 2014, 42, 1967–1979. [Google Scholar] [CrossRef] [Green Version]
  22. Adam, O.; Bischoff, T.; Schneider, T. Seasonal and Interannual Variations of the Energy Flux Equator and ITCZ. Part II: Zonally Varying Shifts of the ITCZ. J. Clim. 2016, 29, 7281–7293. [Google Scholar] [CrossRef]
  23. Keshtgar, B.; Alizadeh-Choobari, O.; Irannejad, P. Seasonal and Interannual Variations of the Intertropical Convergence Zone over the Indian Ocean Based on an Energetic Perspective. Clim. Dyn. 2020, 54, 3627–3639. [Google Scholar] [CrossRef]
  24. Boos, W.R.; Korty, R.L. Regional Energy Budget Control of the Intertropical Convergence Zone and Application to Mid-Holocene Rainfall. Nat. Geosci. 2016, 9, 892–897. [Google Scholar] [CrossRef] [Green Version]
  25. Biasutti, M.; Voigt, A.; Boos, W.R.; Braconnot, P.; Hargreaves, J.C.; Harrison, S.P.; Kang, S.M.; Mapes, B.E.; Scheff, J.; Schumacher, C.; et al. Global Energetics and Local Physics as Drivers of Past, Present and Future Monsoons. Nat. Geosci. 2018, 11, 392–400. [Google Scholar] [CrossRef]
  26. Roberts, W.H.G.; Valdes, P.J.; Singarayer, J.S. Can Energy Fluxes Be Used to Interpret Glacial/Interglacial Precipitation Changes in the Tropics? Geophys. Res. Lett. 2017, 44, 6373–6382. [Google Scholar] [CrossRef] [Green Version]
  27. McGee, D.; Donohoe, A.; Marshall, J.; Ferreira, D. Changes in ITCZ Location and Cross-Equatorial Heat Transport at the Last Glacial Maximum, Heinrich Stadial 1, and the Mid-Holocene. Earth Planet. Sci. Lett. 2014, 390, 69–79. [Google Scholar] [CrossRef]
  28. Sachs, J.P.; Sachse, D.; Smittenberg, R.H.; Zhang, Z.; Battisti, D.S.; Golubic, S. Southward Movement of the Pacific Intertropical Convergence Zone AD 1400–1850. Nat. Geosci. 2009, 2, 519–525. [Google Scholar] [CrossRef]
  29. Arbuszewski, J.A.; de Menocal, P.B.; Cléroux, C.; Bradtmiller, L.; Mix, A. Meridional Shifts of the Atlantic Intertropical Convergence Zone since the Last Glacial Maximum. Nat. Geosci. 2013, 6, 959–962. [Google Scholar] [CrossRef]
  30. Atwood, A.R.; Donohoe, A.; Battisti, D.S.; Liu, X.; Pausata, F.S.R. Robust Longitudinally Variable Responses of the ITCZ to a Myriad of Climate Forcings. Geophys. Res. Lett. 2020, 47, e2020GL088833. [Google Scholar] [CrossRef]
  31. Donohoe, A.; Marshall, J.; Ferreira, D.; Mcgee, D. The Relationship between ITCZ Location and Cross-Equatorial Atmospheric Heat Transport: From the Seasonal Cycle to the Last Glacial Maximum. J. Clim. 2012, 26, 3597–3618. [Google Scholar] [CrossRef]
  32. Donohoe, A.; Marshall, J.; Ferreira, D.; Armour, K.; McGee, D. The Interannual Variability of Tropical Precipitation and Interhemispheric Energy Transport. J. Clim. 2014, 27, 3377–3392. [Google Scholar] [CrossRef]
  33. Chiang, J.C.H.; Kushnir, Y.; Giannini, A. Deconstructing Atlantic Intertropical Convergence Zone Variability: Influence of the Local Cross-Equatorial Sea Surface Temperature Gradient and Remote Forcing from the Eastern Equatorial Pacific. J. Geophys. Res. Atmos. 2002, 107, ACL-3. [Google Scholar] [CrossRef]
  34. Xie, S.-P.; Carton, J.A. Tropical Atlantic Variability: Patterns, Mechanisms, and Impacts. In Earth’s Climate; American Geophysical Union (AGU): Washington, DC, USA, 2004; pp. 121–142. ISBN 978-1-118-66594-7. [Google Scholar]
  35. Weller, E.; Cai, W.; Min, S.-K.; Wu, L.; Ashok, K.; Yamagata, T. More-Frequent Extreme Northward Shifts of Eastern Indian Ocean Tropical Convergence under Greenhouse Warming. Sci. Rep. 2014, 4, 6087. [Google Scholar] [CrossRef] [Green Version]
  36. Biasutti, M.; Voigt, A. Seasonal and CO2-Induced Shifts of the ITCZ: Testing Energetic Controls in Idealized Simulations with Comprehensive Models. J. Clim. 2020, 33, 2853–2870. [Google Scholar] [CrossRef]
  37. Hou, A.Y.; Kakar, R.K.; Neeck, S.; Azarbarzin, A.A.; Kummerow, C.D.; Kojima, M.; Oki, R.; Nakamura, K.; Iguchi, T. The Global Precipitation Measurement Mission. Bull. Am. Meteorol. Soc. 2014, 95, 701–722. [Google Scholar] [CrossRef]
  38. Rayner, N.A.; Parker, D.E.; Horton, E.B.; Folland, C.K.; Alexander, L.V.; Rowell, D.P.; Kent, E.C.; Kaplan, A. Global Analyses of Sea Surface Temperature, Sea Ice, and Night Marine Air Temperature since the Late Nineteenth Century. J. Geophys. Res. Atmos. 2003, 108. [Google Scholar] [CrossRef]
  39. Frierson, D.M.W.; Hwang, Y.-T. Extratropical Influence on ITCZ Shifts in Slab Ocean Simulations of Global Warming. J. Clim. 2011, 25, 720–733. [Google Scholar] [CrossRef] [Green Version]
  40. Yoshimori, M.; Broccoli, A.J. Equilibrium Response of an Atmosphere–Mixed Layer Ocean Model to Different Radiative Forcing Agents: Global and Zonal Mean Response. J. Clim. 2008, 21, 4399–4423. [Google Scholar] [CrossRef]
  41. Xie, S.-P.; Peng, Q.; Kamae, Y.; Zheng, X.-T.; Tokinaga, H.; Wang, D. Eastern Pacific ITCZ Dipole and ENSO Diversity. J. Clim. 2018, 31, 4449–4462. [Google Scholar] [CrossRef]
  42. Zhao, B.; Fedorov, A. The Seesaw Response of the Intertropical and South Pacific Convergence Zones to Hemispherically Asymmetric Thermal Forcing. Clim. Dyn. 2020, 54, 1639–1653. [Google Scholar] [CrossRef]
  43. Wei, H.-H.; Bordoni, S. Energetic Constraints on the ITCZ Position in Idealized Simulations with a Seasonal Cycle. J. Adv. Model. Earth Syst. 2018, 10, 1708–1725. [Google Scholar] [CrossRef]
  44. Wu, C.R.; Lin, Y.F.; Wang, Y.L.; Keenlyside, N.; Yu, J.Y. An Atlantic-driven rapid circulation change in the North Pacific Ocean during the late 1990s. Sci. Rep. 2019, 9, 14411. [Google Scholar] [CrossRef] [PubMed]
  45. Ruprich-Robert, Y.; Moreno-Chamarro, E.; Levine, X.; Bellucci, A.; Cassou, C.; Castruccio, F.; Davini, P.; Eade, R.; Gastineau, G.; Hermanson, L.; et al. Impacts of Atlantic multidecadal variability on the tropical Pacific: A multi-model study. NPJ Clim. Atmos. Sci. 2021, 4, 33. [Google Scholar] [CrossRef]
  46. Hu, S.; Fedorov, A.V. Indian Ocean Warming Can Strengthen the Atlantic Meridional Overturning Circulation. Nat. Clim. Chang. 2019, 9, 747–751. [Google Scholar] [CrossRef]
  47. Ferster, B.S.; Fedorov, A.V.; Mignot, J.; Guilyardi, E. Sensitivity of the Atlantic meridional overturning circulation and climate to tropical Indian Ocean warming. Clim. Dyn. 2021, 57, 2433–2451. [Google Scholar] [CrossRef]
  48. Wang, C. Three-ocean interactions and climate variability: A review and perspective. Clim. Dyn. 2019, 53, 5119–5136. [Google Scholar] [CrossRef] [Green Version]
  49. Kang, S.M.; Hawcroft, M.; Xiang, B.; Hwang, Y.-T.; Cazes, G.; Codron, F.; Crueger, T.; Deser, C.; Hodnebrog, Ø.; Kim, H.; et al. Extratropical-Tropical Interaction Model Intercomparison Project—Protocol and Initial Results. Bull. Am. Meteorol. Soc. 2019, 100, 2589–2606. [Google Scholar]
  50. Roxy, M.K.; Ritika, K.; Terray, P.; Masson, S. The Curious Case of Indian Ocean Warming. J. Clim. 2014, 27, 8501–8509. [Google Scholar] [CrossRef] [Green Version]
  51. Back, L.E.; Bretherton, C.S. Geographic Variability in the Export of Moist Static Energy and Vertical Motion Profiles in the Tropical Pacific. Geophys. Res. Lett. 2006, 33. [Google Scholar] [CrossRef] [Green Version]
  52. Heaviside, C.; Czaja, A. Deconstructing the Hadley Cell Heat Transport. Q. J. R. Meteorol. Soc. 2013, 139, 2181–2189. [Google Scholar] [CrossRef]
  53. Green, B.; Marshall, J.; Campin, J.-M. The ‘Sticky’ ITCZ: Ocean-Moderated ITCZ Shifts. Clim. Dyn. 2019, 53, 1–19. [Google Scholar] [CrossRef]
  54. Green, B.; Marshall, J. Coupling of Trade Winds with Ocean Circulation Damps ITCZ Shifts. J. Clim. 2017, 30, 4395–4411. [Google Scholar] [CrossRef] [Green Version]
  55. Schneider, T. Feedback of Atmosphere-Ocean Coupling on Shifts of the Intertropical Convergence Zone. Geophys. Res. Lett. 2017, 44, 11–644. [Google Scholar] [CrossRef] [Green Version]
  56. Xie, S.-P.; Philander, S.G.H. A Coupled Ocean-Atmosphere Model of Relevance to the ITCZ in the Eastern Pacific. Tellus A Dyn. Meteorol. Oceanogr. 1994, 46, 340–350. [Google Scholar] [CrossRef] [Green Version]
  57. Philander, S.G.H.; Gu, D.; Lambert, G.; Li, T.; Halpern, D.; Lau, N.-C.; Pacanowski, R.C. Why the ITCZ Is Mostly North of the Equator. J. Clim. 1996, 9, 2958–2972. [Google Scholar] [CrossRef] [Green Version]
  58. Kang, S.M.; Held, I.M. Tropical Precipitation, SSTs and the Surface Energy Budget: A Zonally Symmetric Perspective. Clim. Dyn. 2012, 38, 1917–1924. [Google Scholar] [CrossRef]
  59. Cvijanovic, I.; Chiang, J.C.H. Global Energy Budget Changes to High Latitude North Atlantic Cooling and the Tropical ITCZ Response. Clim. Dyn. 2013, 40, 1435–1452. [Google Scholar] [CrossRef]
  60. Adam, O.; Schneider, T.; Brient, F. Regional and Seasonal Variations of the Double-ITCZ Bias in CMIP5 Models. Clim. Dyn. 2018, 51, 101–117. [Google Scholar] [CrossRef]
Figure 1. Observed seasonal cycle of the ITCZ position and interhemispheric SST contrast within each ocean basin. The 12 crosses represent the 21-year mean precipitation centroid and SST contrast for each month of the year. The length of each cross equals 1 standard deviation from the mean. The star is the annual average. Note the strong correlation in each basin, as well as the differences in the sensitivity of the ITCZ position to the local SST contrast.
Climate 10 00030 g001
Figure 2. Observed seasonal cycle of the ITCZ position and interhemispheric SST contrast within each sector of the Pacific. The 12 crosses represent the 21-year mean precipitation centroid and SST contrast for each month of the year, the length of each cross equals 1 standard deviation from the mean, and the star is the annual average, as in Figure 1. Again, note the strong correlation and difference in sensitivity in each sector. Figure 1c is identical to (a) but is reproduced for ease of comparison.
Climate 10 00030 g002
Figure 3. Observed relationship between the local ITCZ position and interhemispheric SST contrast at each longitude, over seasonal (black) and interannual (blue) timescales. The slope (a) and intercept (b) of the best-fit line, and the R-value (c) of the linear regression, are shown. In (c) open circles are statistically significant; crosses are not. The interannual correlation of the ITCZ position and SST contrast is generally weaker than the seasonal correlation but is still overwhelmingly significant. Note the zonal variations of the slope and intercept. In (a) the seasonal and interannual signals are visually coherent, though there is a high degree of noise in the interannual signal. In (b) the seasonal and interannual intercepts appear highly coherent. Discontinuities indicate the presence of continent.
Climate 10 00030 g003
Publisher’s Note: MDPI stays neutral with regard to jurisdictional claims in published maps and institutional affiliations.

