Abstract
Projections of future climate change trends in four urban centers of southwest Ethiopia were examined under a high Representative Concentration Pathways (RCP8.5) scenario for near- (2030), mid- (2050), and long-term (2080) periods based on high-resolution (0.220) Coordinated Regional Climate Downscaling Experiment (CORDEX) for Africa data. The multi-model ensemble projects annual maximum and minimum temperatures increasing by 0.047 °C per year (R2 > 0.3) and 0.038 °C per year (R2 > 0.7), respectively, with the rates increased by a factor of 10 for decadal projections between the 2030s and 2080s. The monthly maximum temperature increase is projected to be 1.41 °C and 2.82 °C by 2050 and 2080, respectively. In contrast, the monthly minimum temperature increase is projected to reach +3.2 °C in 2080. The overall seasonal multi-model ensemble average shows an increment in maximum temperature by +1.1 °C and +1.9 °C in 2050 and 2080, with the highest change in the winter, followed by spring, summer, and autumn. Similarly, the future minimum temperature is projected to increase across all seasons by 2080, with increases ranging from 0.4 °C (2030s) to 3.2 °C (2080s). All models consistently project increasing trends in maximum and minimum temperatures, while the majority of the models projected declining future precipitation compared to the base period of 1971–2005. A two-tailed T-test (alpha = 0.05) shows a significant change in future temperature patterns, but no significant changes in precipitation were identified. Changes in daily temperature extremes were found in spring, summer, and autumn, with the largest increases in extreme heat in winter. Therefore, our results support proactive urban planning that considers suitable adaptation and mitigation strategies against increasing air temperatures in urban centers in southwest Ethiopia. Future work will examine the likely changes in temperature and precipitation extremes.
1. Introduction
Current projections of global surface warming between 1906 and 2005 fall between a range of +0.6 to +4.0 °C, while projected sea level rises are within the range of 0.18 to 0.59 m by the end of the twenty-first century, as documented by the Intergovernmental Panel on Climate Change [1]. According to [2], by the 2050s, human activities are estimated to cause approximately 1.0 °C of global warming above pre-industrial levels, with a likely range of +0.8 °C to +1.2 °C, if greenhouse gases (GHG) emissions continuously increase at the current rate. Risks from heavy precipitation, droughts, and precipitation deficits are projected to be higher at 2 °C compared to 1.5 °C of global warming in some regions and globally [2,3]. By 2050, roughly two-thirds (68 percent) of the world’s population are expected to be living in urban areas, and the global urban population is projected to add 2.5 billion urban dwellers between 2018 and 2050, with nearly 90 percent of the increase concentrated in Asia and Africa, which will be expected to grow continuously [4].
Recent global analyses of urban heat exposure in 13,115 urban settlements, using fine-resolution (0.05°) temperature data, showed that between 1983 and 2016, the total urban heat exposure increased by 52% when compared to urban population growth alone [5]. This underscores the need to implement adaptation actions and early warning systems to reduce harm from urban extreme heat exposure. Beyond 2040, depending on the level of global warming, climate change will lead to numerous risks to natural and human systems, with the level of risk increase linked to the magnitude and rate of climate change; indeed, the projected adverse impacts and related losses and damages will escalate with every increment in global warming, with very high confidence [6].
Assessing climate change-related risks at urban scales is challenging, especially in areas such as southwestern Ethiopia, a region with an extremely complex terrain and local weather variations. Over the span of 50 km, the Ethiopian climate can vary radically, transitioning from hot, arid lowlands to cool, moist highland areas. In the densely populated southern highlands of Ethiopia, most people live in middle-elevation areas. Unfortunately, global climate change models, including both the Phase 5 and the Phase 6 Coupled Model Intercomparison Project ensembles (CMIP5 and CMIP6), face several serious limitations in terms of modeling local Ethiopian climate change due to (1) their coarse scale, meaning they miss many small-scale processes in tilted orography; (2) their failure to capture many important teleconnections [7]; and (3) CMIP5 and CMIP6 suffer from systematic Indian Ocean sea surface temperature biases, which, in turn, impact their ability to correctly model the seasonal progression of East African rains [8,9]. CMIP6 also poorly represent important land–atmosphere feedbacks and the seasonal progression of rains [10]. These deficiencies in the global models mean that, for now, the high-resolution (0.22°) Coordinated Regional Climate Downscaling Experiment (CORDEX) [11,12] remains one of the best resources for evaluating future changes in local urban weather patterns in southwestern Ethiopia. Detailed evaluation of the CORDEX simulations [13] shows that they effectively capture the seasonal cycle of rains and teleconnections to drivers such as the El Niño–Southern Oscillation and Indian Ocean Dipole. Here, we examine CORDEX simulations in four cities in southwestern Ethiopia. The CORDEX simulations are forced by the Representative Concentration Pathways (RCP), hence we describe the RCP/CMIP5 projections below.
Under the IPCC high emissions RCP 8.5 scenario, temperature increases could reach between +3 °C and +6 °C by the end of the twenty-first century. It is likely that land temperatures over Africa will rise faster than the global land average, with higher rates of minimum temperature increases compared to maximum temperature [1]. Projected rainfall changes over sub-Saharan Africa in the mid and late 21st-century are uncertain and in regions of high or complex topography, such as the Ethiopian Highlands, downscaled projections indicate likely increases in rainfall amounts and extreme rainfall by the end of the 21st century [1].
RCP scenarios based on radiative forcing emission scenarios were used in the IPCC Fifth Assessment Report rather than emissions-based modeling [1]. Each scenario is tied to one value: the change in radiative forcing at the tropopause by 2100 relative to pre-industrial levels. The four RCPs are numbered according to the change of radiative forcing by 2100: +2.6, +4.5, +6.0, and +8.5 watts per square meter (W/m2) ([12,14], Table S1). All of the three lower RCP scenarios (2.6, 4.5, and 6.0) are climate-policy scenarios [15]. At the higher end of the range, the RCP8.5 scenario corresponds to a future where carbon dioxide (CO2) and methane emissions continue to rise as a result of fossil fuel use, but with significant declines in emission growth rates over the second half of the century [11]. Atmospheric carbon dioxide levels for RCP8.5 are similar to those of the Special Report on Emission Scenario (SRES) with intensive use of fossil fuel (SRES A1FI) scenario. They suggest a rise from current-day levels of 400 parts per million (ppm) up to 936 ppm by the end of the twenty-first century [15]. CO2-equivalent levels, and other climate-impacting emissions, may be more than 1200 ppm by 2100, and global temperature is projected to increase by 3.0–5.5 °C by 2100 relative to the 1986–2005 average [15].
The recent IPCC [16] report suggests global surface temperature is likely to increase from 1.0 °C to 1.8 °C between 2081 and 2100 under the very low GHG emissions scenario (SSP1/RCP1.9). Temperatures may increase by 2.1 °C to 3.5 °C in the intermediate scenario (SSP2/RCP4.5) and by 3.3 °C to 5.7 °C under the very high GHG emissions scenario (SSP5/RCP8.5) compared to 1850–1900. Whereas, the average annual global land precipitation is projected to increase by 0–5% under the very low GHG emissions scenario (SSP1/RCP1.9), 1.5–8% for the intermediate GHG emissions scenario (SSP2/RCP4.5), and likely ranges from 1–13% under the very high GHG emissions scenario (SSP5/RCP8.5). Decreases over parts of the subtropics and limited areas in the tropics in SSP2-4.5, SSP3-7.0, and SSP5-8.5 are very likely relative to 1995–2014 [16].
Among the relevant urban studies conducted in other countries: In a study in Baghdad City, Iraq, the future land-use cover change (FLUCC) modeling results from 2030 to 2050 show that there is a massive decreasing trend in agricultural land, whereas urban construction land increases at the fastest rate between 2020 and 2030 due to rapid urbanization along with unplanned urban growth and rising population migration from rural to urban [17]. Land cover and land surface temperature relationship analyses using regression models revealed a significant positive correlation with the built-up area while it is negatively correlated with vegetation, waterbodies, and bare soil [18]. Similarly, in the northwest coast of Peninsula Malaysia, Penang undergoes high-rise infrastructural development, with a significant increase in built-up areas predicted by 2035, while other LULC decreases [19]. Another study made by [20] over the southwest Urban Centers of Ethiopia also found that there was an observed increase of built-up in the past 60 years at the expense of agricultural land, vegetation, and wetlands, varying across urban centers. This result might indicate a likelihood projection for further increment in the future.
A study of the impacts of rapid urbanization on land surface temperature and urban heat island patterns in Sylhet City, Bangladesh, revealed that the future urban expansion simulation for 2025 and 2030 shows a 9% increase, leading to a significant increase of moderate to high surface urban heat island intensity [21] Similarly, another study showed that the built-up area of Wuhan City, China, has expanded, while the area of vegetation, waterbodies, and bare land will decrease to varying degrees in 2030 and 2040, which is in line with the expansion of the land surface temperature range and the built-up area [22]. Another study conducted in the Rajshahi district of Bangladesh indicated that the net increase in the built-up area will be inconsistent with an increase in land surface temperature in 2030 and 2050 from 2020 onwards, in the summer and winter seasons [23]. The model projection for urban thermal field variance index (UTFVI) versus LULC demonstrated that the highest urban thermal field variance index concentration in urban areas and reduction in vegetation cover significantly increase the urban heat island effect in Cumilla City, Bangladesh [24], with a similar finding in the built-up area of Kuwait [25] and Sylhet City, Bangladesh [26].
Africa is highly vulnerable to the projected changes in the frequency and intensity of climate change and its extremes due to its weak adaptive capacity [27]. In Ethiopia, a significant warming trend is projected, with a high level of confidence [18]. Comparatively, rainfall projections remain difficult, but most models lean towards more rainfall, with rain expected to be heavier, while interspersed with droughts and dry stretches across the country [28]. In particular, Ethiopia has faced frequent natural disasters (droughts and floods) as a consequence of climate change [29,30]. A previous study has projected long-term future changes in rainfall patterns in Ethiopia that could prevail until the end of the twenty-first century [31]. Their multiple model’s ensembles were broadly consistent in indicating increases in total precipitation and increases in the magnitude of one-day maxima and five-day rainfall maxima [31]. In Kenya, Ethiopia, and Somalia, climate-related extremes have been identified as the dominant trigger of natural disasters [32].
Ethiopia is the second-most populous country in Africa, hosting more than 109 million people, and has a total area of 1.1 million km2, situated in the northeastern part of the Horn of Africa [33]. Ethiopia’s urban population is projected to grow on average by 3.98% annually, and by 2050, about 42.1% of the total population is projected to dwell in urban centers [34,35]. Urban growth in Ethiopia, and in many African cities, is generally characterized by a lack of adequate planning or a lack of the implementation of plans, resulting in cities that often have a shortage of the necessary infrastructure and services [36,37,38]. This has contributed to fragmented urban landscape patterns along major roadways to its rural fringes, especially in regional cities. In the past couple of decades, regional cities in Ethiopia have grown faster than the capital city, Addis Ababa [39].
Urban areas are the major sources of GHG emissions, comprising between 40 and 70 percent [40]. In Ethiopia, the current emission contribution of cities is only 15% of the total emission, while the rate is expected to rise to 35% in 2030 [28]. This is mainly due to the fast-growing urban population, at a rate of 4.2% [4], which will increase the demand for transportation and energy supply. Ethiopia has been experiencing a significant rise in temperature in recent decades, in contrast to a decline in total annual rainfall amounts, as well as facing recurrent extreme weather events [27].
Projected temperature and precipitation in the future have been investigated by several climate change studies focused on different parts of the world. In East Africa, the majority of studies have suggested that climate change could result in a decrease in the number of consecutive wet days but an increase in the maximum consecutive number of dry days [41,42,43,44,45,46,47,48,49,50,51]. The majority of existing climate studies in Ethiopia are based on simulations from climate modeling centers or sometimes scarce ground-based meteorological station observations [45,52,53]. The multi-model ensemble average of high-resolution regional climate models (RCMs), driving global climate models (GCMs) within the framework of the Coordinated Regional Climate Downscaling Experiment of Africa (CORDEX-Africa), as documented in the Coupled Model Intercomparison Project phase 5, provide future projections of climate suitable for analysis [54].
For this study, RCP8.5 was selected, as it is a highly prioritized emission scenario for climate change impact studies under the CORDEX Africa framework [11,12]. The objective of this analysis is to examine the prospect of future climate change projections for temperature (minimum and maximum) and precipitation under RCP8.5, using high-resolution (0.22°) CORDEX Africa data in urban centers of southwest Ethiopia for the near-term (2030), mid-term (2050), and long-term (2080) periods. This research is expected to answer how mean precipitation and temperature could change in the future in the urban centers of southwest Ethiopia. The results generated from this study provide additional scientific evidence to understand the influence of future temperature and precipitation change over the urban centers in southwest Ethiopia, specifically over Jimma, Bedelle, Bonga, and Sokorru. The findings of this study will assist city officials, urban planners, environmental engineers, and policymakers to prepare a sustainable future urban development plan for urban centers, enabling them to minimize the negative consequences of unplanned urbanization and heat-stress-related issues, thereby contributing to creating climate-smart, liveable urban centers or cities of tomorrow. The results of this study can inform sustainable urban development policies and strategies through the implementation of climate change adaptation and mitigation interventions in urban areas to combat future challenges. Future work will look more closely at changes in extreme precipitation and air temperatures in urban centers.
2. Data and Methods
2.1. Description of the Study Area
This study was conducted in southwest Ethiopia’s urban settlements, including Jimma, Bedelle, Bonga, and Sokorru, which lie between 7°22′ N to 8°45′ N and 36°23′ E to 37°40′ E, representing a grid box of 1° × 1°, as depicted in Figure 1. Within this region, the altitude ranges from over 2000 m in the high plateaus to 600 m in the flat low-lying plains. Climatically, southwestern Ethiopia has a temperate-type climate with annual temperature and rainfall ranging between 14 and 20 °C and 1700 and 2000 mm, respectively [55]. The study area is characterized by a mono-modal rainy season, which extends from March through mid-November, and also includes the location of one of the country’s rainfall maxima [55,56]. The current city administration of the urban centers is structured from the town level to kebeles, with decentralized functions of a municipality at the Kebele level (the lowest administrative body in Ethiopia). The total population of Jimma City was 120,600 in 2007, which is projected to be over 265,000 by 2024 with diverse ethnic compositions in the city; the total population of Bonga Town was 20,858 in 2007, projected to be 44,046 by 2024; the total population of Bedelle Town was 19,517 in 2007, projected to reach 40,500 in the year 2024; and Sokorru Town’s total population was 6233 in 2007, projected to be 25,617 by 2024 [56,57]. Each of the four towns included in this study has its own historical establishment, land-use types, structural plan, or master plan to guide development, while none of them was established in the planned way at the beginning.
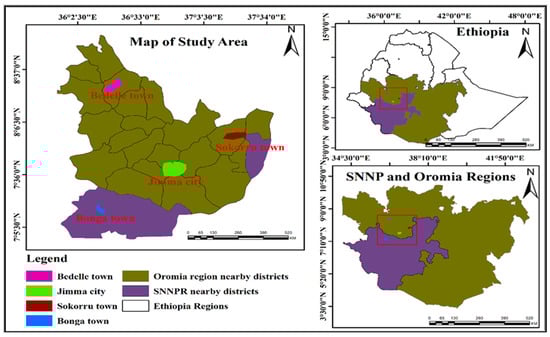
Figure 1.
Map of the study area.
According to its 2019 revised master plan, Jimma City, the core urban region of this study, has a total area of 100.2 km2 (10,200 hectares). In contrast, the current total areas of Bonga, Bedelle, and Sokorru are 8846, 2878, and 300 hectares, respectively. Substantial portions of these urban areas are green, with trees planted and conserved along roadsides, residences, and institutions such as schools, churches, mosques, health centers, and universities.
2.2. Data Used and Method of Analysis
The climate modeling approach used here focuses on the uses of RCMs driven by CMIP5 GCM simulations. These CORDEX projections provide information about temperature (minimum and maximum) and precipitation in the study urban areas, in order to provide insight into the near- (2030), mid- (2050), and long-term (2080) periods. Modeled daily minimum temperature, maximum temperature, and precipitation series for the 1950–2100 periods were obtained based on the RCMs participating in CORDEX-Africa, for both historical and projected time periods, as listed in Table 1. RCP8.5 scenarios were selected from 1950 to 2100 for four climate station locations and downscaled to the same climate stations, which were used for climatological simulations (Table 1). The required observed long-term daily maximum temperature, minimum, and precipitation data of four stations (Jimma, Bedelle, Bonga, and Sokorru) were collected from National Meteorological Agency (NMA) from 1952 to 2018 (Figure 1), as documented in [20].
In this research, two RCMs were used to downscale each of the three GCMs from the CORDEX-Africa experiments, resulting in 12 total runs (see Table 1). This provides a horizontal high resolution of 0.22° × 0.22° grid spacing (~22 km), as compared to the 0.44° resolution in other studies [58,59,60]. Our analysis used two RCMs to downscale individual GCMs in order to avoid single GCM–RCM combinations, thereby reducing model uncertainty [13]. The performance of the selected RCM–GCM combinations was evaluated based on their ability to characterize the observed precipitation [61]. The selected RCMs and GCMs also have been used by [43]. Moreover, a model that had complete outputs for the first run of the ensemble at historical and two projections scenarios was retrieved from the Earth Systems Grid Federation (ESGF) via https://esgf-node.llnl.gov/projects/esgf-llnl/website; accessed on 12 February 2020. The historical simulation runs, forced by observed changes in natural and anthropogenic atmospheric composition, covered the period 1951–2005 for CLMcom and 1970–2005 for GERICS models, while the projected simulations of all models covered the period 2006–2100 under the RCP8.5 scenario [62,63]. The minimum and maximum temperatures, and precipitation, were downscaled using GCM-driven RCM CORDEX Africa, with a high resolution of 25 km for Jimma, Bedelle, Bonga, and Sokorru towns (Table 1).
The RCPs were adopted in climate change scenario generation for the preparation of IPCC AR5 based on four radiative-forcing scenarios [1]. In this study, RCP8.5 was used to generate future climate change projections. This RCP is often used, as it maximizes the projected climate change signal; indeed, [13,63,64] identified RCP8.5 as the most aggressive scenario in assumed fossil fuel use for global climate models, which will continue to serve as a useful tool for quantifying physical climate risk for near to midterm time horizons relevant for policy making (Table S1). The observed time series over the reference period (1971–2005) was used as the base period, as documented in recent climate projection studies over Africa [43] and Europe [65].
Regional Climate Model (RCM) simulation results for the Africa CORDEX domain were obtained from the German node of the Earth system grid federation ESGF [66]. The two RCMs for this study are the Consortium for Small-scale Modelling—Regional Climate Model (COSMO-CLMcom) and REMO2015 (GERICS) simulation results. A detailed description of the dynamic downscaling scheme they employ are provided by [67,68]. The two RCM simulations were driven by, and utilized, the lateral boundary conditions from the Global Climate Models (GCMs) extracted from three different CMIP5 projections, including HadGEM2-ES (MOHC), MPI-ESM-LR (MPI), and NorESM1(NCC). The GCMs were, in turn, forced by the RCPs [62,63]. Both RCM models are three dimensional in nature, with the COSMO-CLMcom model relying on limited-area non-hydrostatic atmospheric modeling and thermodynamic equations to describe atmospheric compressible airflow at a 0.44- and 0.22-degree resolution (50 km and 25 km) [69,70]. For REMO 2015, the Physical parameterization is based on ECHAM 4.5 [61] and land surface models that explicitly define glaciers, surface runoff, and vegetation characteristics at a resolution of 0.22 degrees (25 km) [71,72,73]. The use of a climate-projection modelling approach, using the downscaled CORDEX Africa Simulations, can also be employed for small-, medium-, and large-sized cities.

Table 1.
List of climate model simulations used in the analysis of the minimum and maximum temperature and precipitation in the study area. Each experiment comprises one historical and one projected scenario (RCP8.5) run, spanning the historical period 1950–2005 and the projected period 2006–2100. The horizontal resolution of all simulations is 0.22° in both latitude and longitude.
| No. | Driving GCM | RCM | Institution/ Country | Simulation Period Experiment | References | |
|---|---|---|---|---|---|---|
| Historical | Under RCP8.5 | |||||
| 1 | MOCH | COSMO-CLMcom | Met Office Hadley Center (MOCH), United Kingdom Climate Limited Area modeling Community (CLMcom), Germany | 1950–2005 | 2006–2099 | [73] |
| 2 | MOCH | REMO 2015 | Germany Climate Service Center (GERICS) | 1970–2005 | 2006–2099 | [74,75] |
| 3 | MPI | COSMO-CLMcom | Max Planck Institute for Meteorology (MPI), Germany | 1950–2005 | 2006–2100 | [76] |
| 4 | MPI | REMO 2015 | 1970–2005 | 2006–2100 | [77] | |
| 5 | NCC | COSMO-CLMcom | Norwegian Climate Center (NCC), Norway | 1950–2005 | 2006–2100 | [73] |
| 6 | NCC | REMO 2015 | 1970–2005 | 2006–2100 | [78,79] | |
2.3. Methods of Data Analysis and Presentation
2.3.1. Climate Modeling Scenarios and Projected Changes in the Twenty-First Century
We mapped the absolute changes in minimum and maximum temperature and relative (percent) changes in precipitation in each of the three future time periods, seasonally and annually, using monthly data simulated from the model dataset for historical and RCP8.5 scenarios. These types of analyses were employed in order to compare differences between the contemporary historical reference period (1971–2005) and projected changes in areal averaged parameters in the near-term (2030), mid-term (2050), and long-term (2080). Climate data were analyzed using dynamical and statistical downscaling tools to downscale the station data, and Arc GIS version 10.5 to generate study area maps, interpolate data, and analyze the data for each urban center. Additionally, Microsoft Excel statistical tools were used for further data analysis and presentation.
In this study, the projected temperature (minimum and maximum) and precipitation changes from CORDEX-Africa using RCM and GCM calculations for the near-term 2030 (2021–2040), mid-term 2050 (2041–2070), and long-term 2080 (2071–2100) were generated using the reference period 1971–2005. The findings were presented for each month, season, model, and time period as the aggregated areal average for each station by graphical and tabular forms. The high-emission scenario, covering the entire range of radiative forcing resulting from the plausible and best match in RCP8.5, was applied to model the ensembles for RCP-based studies ([64], Table S1 [1,11,61,62]). The output changes of three-time horizons were calculated for urban centers of southwest Ethiopia. The results are shown using tables and figures, including the statistical outputs. The Delta method was employed on the simulated climate data to compute the difference (absolute difference for temperature and relative change (%) for precipitation) between the future period and the baseline period, which is determined and then superimposed on the historical daily temperature and precipitation series [80,81]. For this analysis, a relative change (%) in precipitation is obtained by Equation (1):
The same formula was used for the 2050 and 2080 projected precipitation.
Whereas, for the absolute value calculation (temperature in this case), the formula below was used.
The values at 2050 and 2080 were also obtained by the same formula explained in Equation (2). Vbase is the average of all ensembles (or a specific ensemble if selected) for each statistic for the baseline period. Likewise, V2030s is the mean of all ensembles (or a specific ensemble) for each statistic for the 2030s, 2050s, and 2080s periods [82].
2.3.2. Spatial Interpolation Methods
Interpolation using Inverse Distance Weighting (IWD) was conducted to examine nearby area changes using the climate data for the four urban centers as a reference. This interpolation aids in understanding the future climate of the study area and its surroundings. The study by [83] concluded that there is no simple solution to choosing an appropriate interpolation technique because a given method is only “best” in specific situations. A simple way to interpolate temperature and precipitation data is to assign to every un-sampled point the value at its nearest control point using Euclidian distance. This technique was first introduced by [84], who was interested in how to use rain-gauge records to estimate total rainfall across nearby study regions, which is called the nearest neighbor (NN) technique. The more sophisticated IDW interpolation is based on the assumption that the value at an unsampled point can be approximated by a weighted average of observed values in a search throughout a given range of closest points near stations [85]. The weights used for averaging are a decreasing function of the distance between the sampled and unsampled points. As documented by [86], a modified version of the IDW accounted for the altitudinal effect on temperature of an adiabatic thermal gradient, and can be considered based on an additional factor affecting interpolated temperatures by an orographic gradient (lapse rate), as given in Equation (3):
where is the temperature at the target grid point at the time step ; is the inverse distance weighting interpolator based on the available neighbors; is the temperature at each gauging station located in the neighborhood of the target point; and is the orographic gradient in to be estimated between 0 and 1.5. A similar scheme was proposed for precipitation, but accounted for the altitudinal effect as an orographic gradient within an exponential function (exp), shown by Equation (4):
where is precipitation at the target grid point at the time step is precipitation at each gauging station located in the neighborhood of the target point; is the elevation of the target point and the elevation of the neighboring gauge stations; α is a real positive number, called the power parameter; and is the orographic gradient factor, estimated to be between 0 and 1.5, within the exponential function , with precipitation at an elevation of 1000 m, where a zero value means no increase at all.
2.3.3. Bias Correction
Bias corrections are necessary because climate models often exhibit systematic error (biases), which occur as a result of limited spatial resolution, simplified physics and thermodynamic processes, numerical schemes, or incomplete knowledge of climate system processes. Therefore, bias correction is applied to avoid overestimation or underestimation of the downscaled variables. In this study, model bias, model confidence, and model performance are used as model performance indicators. Model bias is given by Equation (5):
where is the model bias; and Qoi are the simulated and observed temperature or precipitation at time period i (in °C or mm); and N is the number of time steps over the simulation period. Model bias measures the systematic under or over prediction of a model for a set of predictions [87]. Model simulation values can be accepted if MB is between −0.25 and 0.25 for climate and hydrological studies [88]. Secondly, model confidence is expressed with the coefficient of determination in the assessment of continuous model simulations of climate data [89]; it is calculated using Equation (6):
where is the model determination coefficient; is projected/simulated data; and is the mean observed value. values greater than 0.5 are considered as acceptable [89], which depends on the variable of interest. Thirdly, to understand the magnitudes of error in the RCP data and ensemble mean of the models, we used the Root Means Square Error (RMSE), the Mean Absolute Error (MAE), and the Relative Error (RE), as provided in Equations (7)–(9).
where is the observed value at time step i; is the simulated value at time step i; is the mean of observed values; and is the number of observations. The bias correction statistical test and Student’s t-test statistics were performed to check the significance, using SPSS version 20. Please note that our goal in this study is to support urban planning and local adaptation by producing downscaled climate change projections for urban centers. An accurate assessment of the skill of the CORDEX simulations would require interpolation of station observations to a 0.22-degree grid, which is not our objective here. Rather, we are focused on developing local projections to support local decision-making.
3. Results
3.1. Bias Correction
The bias correction method was applied to examine bias or error in the simulated climate variables for four stations observed versus the projected RCP8.5, validated using monthly observed data from 2006 to 2018. Standard model performance statistics tests were carried out by computing the RMSE, MAE, and RE based on the observed and multi-model ensemble means of the four stations under the RCP8.5 scenario. The computed statistics of the maximum and minimum temperatures as well as precipitation RCP data tests are summarized in Table 2.
Table 2.
Computed performance statistics results based on the bias correction method and T-tests. Asterisks (**) indicate that both the maximum and minimum temperature changes are statistically significant at both the α = 0.01 and 0.05 significant levels.
The analysis of monthly based bias corrected statistical results showed that a significant improvement is achieved by applying the bias correction method on RCPs, which are therefore closer to the observed values over four station points due to the use of high-resolution data. The analyzed values of R2 for precipitation, maximum, and minimum temperature are >0.9, showing a strong association between the observations and simulations (Table 2). The model MB values were lower, which indicates a good simulation of observed values (Table 2). Model simulation values can be accepted if MB is between −0.25 and 0.25, as reported by [88], and the analyzed performance statistics tests show agreement within this range.
3.2. Projections of Temperature and Precipitation
The model performance trends were analyzed using multi-model ensemble means over four stations for maximum temperature, minimum temperature, and precipitation during the entire period of 1950–2100, with historical (1950–2005) and the projected RCP8.5 (2006–2100) periods. The annual trends in maximum and minimum temperatures show increases of 0.047 °C and 0.038 °C per year, respectively, while precipitation decreased by 0.032 mm during 1950–2100 (Figure 2a–c). The decadal changes for maximum temperature, minimum temperatures, and precipitation show increases of 0.47 °C and 0.38 °C and a decrease of 0.32 mm, respectively (Figure 2a–c). For minimum and maximum temperatures, the 1950–2100 linear trend explained 70% and 30% of the variance, respectively. Precipitation changes did not exhibit any significant changes (R2 = 0), as depicted in Figure 2a–c.
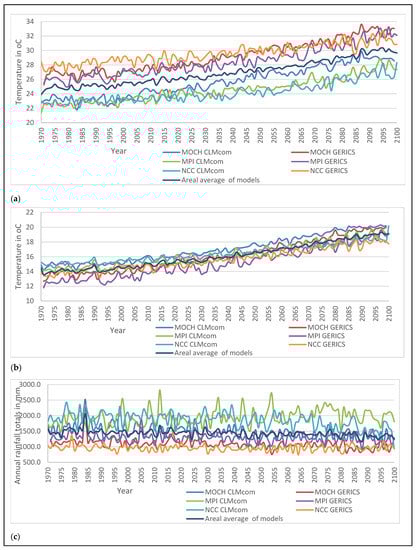
Figure 2.
Time series showing the model simulations and projections of climate data for the historical (1970–2005) and projected (2006–2100) periods over the southwest urban centers of Ethiopia: (a) maximum temperature; (b) minimum temperature; (c) annual precipitation totals.
The computed performance of multi-model ensemble means for maximum temperature showed that the MOCH GERICS and NCC GERICS are above the average whereas MPI CLMcom and NCC CLMcom are below the average. The best models with the best fit within the average model ensemble range are MOCH CLMcom and MPI GERICS (Figure 2a). Likewise, for minimum temperature, the mean values for the models MOCH GERICS and NCC CLMcom are above the average whereas the MPI GERICS and NCC GERICS ensemble means are below the average. The best models with the best fit within the average model ensemble range are MOCH CLMcom and MPI CLMcom (Figure 2b). Regarding precipitation, models such as MPI CLMcom, MPI GERICS, NCC CLMcom, and NCC GERICS were simulated to be above the average values. Alternatively, MOCH CLMcom and MOCH GERICS are among the best model fits, with values within the average (Figure 2c). Overall, the multi-model ensemble means’ trend analysis showed that temperature (minimum and maximum) increased, but the minimum temperature has increased more than the maximum temperature. However, the precipitation trend is inconclusive: even though most models indicate a decreasing trend, a few models project an increasing trend in precipitation.
3.3. Temperature and Precipitation Projection Change Using Models in the Study Area
Areal average values of each parameter computed for the study area were generated for the historical, 2030, 2050, and 2080 time periods under the RCP8.5 scenario. Individual model values differ both for temperature and precipitation projection. The projected maximum temperature is likely to increase consistently throughout the near-, mid-, and long-term periods, with the highest warming level of 30 °C reached in the 2080s based on MOCH, MPI, and NCC GERICS models. The results reveal there is a higher likelihood of heat waves in urban centers of southwest Ethiopia at the end of the twenty-first century (Table 3). In the 2030s the six models’ projections of future maximum temperature indicate an incremental range, from the lowest at 0.6 °C to the highest at 1.6 °C by NCC CLMcom and MOCH CLMcom, respectively, whereas, in the 2050s, the maximum temperature is projected to increase from the lowest at 1.5 °C to the highest at 3.6 °C by the NCC CLMcom and MOCH CLMcom models, respectively, with reference to 1971–2005. In the long-term, for the 2080s, the future projected maximum temperature ranges from 3 °C to 5.4 °C, with the lowest increases generated by NCC GERICS, while the highest increases are by MOCH CLMcom and MOCH GERICS.
Table 3.
Computed results of the multi-model ensemble projections for minimum temperature (°C), maximum temperature (°C), and precipitation (mm) in the future time periods, comparing historical (1971–2005), near-term 2030 (2021–2040), mid-term 2050 (2041–2070), and long-term 2080 (2071–2100) data under the RCP8.5 scenario over the urban centers of southwest Ethiopia. The values in bold only indicate the smallest, and bold with * indicate the largest value within the time period.
The model performance for minimum temperature throughout the three projected future periods shows a consistent increase throughout the twenty-first century (Table 3). The minimum temperature changes in the 2030s for the six model ranges from 0.8 to 1.6 °C by NCC CLMcom and MOCH GERICS, respectively, whereas in the 2050s, the minimum temperature increase is projected from 1.7 to 3.3 °C by NCC CLMcom and MOCH GERICS, respectively, with reference to 1971–2005. In the 2080s, the long-term projections indicate a range from 2.9 °C, by NCC CLMcom, to the highest at 5.5 °C, projected by MOCH GERICS (Table 3).
Regarding projected precipitation among the six models, four models (MOCH CLMcom, MOCH GERICS, MPI GERICS, and NCC GERICS) showed a decreasing trend in future time periods. However, two models (MPI CLMcom and NCC CLMcom) projected an increasing precipitation trend, both in magnitude and intensity, relative to the historical period. This decrease ranges from 3.9% (MOCH GERICS) to 40% (NCC GERICS), 6.24% (MOCH CLMcom) to 41.2% (NCC GERICS), and 4.5% (MOCH CLMcom) to 39% (NCC GERICS) in the 2030s, 2050s, and 2080s, respectively. The increase ranges from 3.8 to 98%, 7 to 84.9%, and 10.7 to 60.2% in the 2030s, 2050s, and 2080s, respectively, with the least increase by MPI CLMcom and the highest by NCC CLMcom (Table 3).
3.4. Future Temperature and Precipitation Change Scenarios
3.4.1. Future Temperature Projection Change Scenarios
The analysis of monthly maximum temperature result showed that, for all months, there are increases throughout the three time periods with reference to the base period of 1971–2005. Comparing inter monthly projected future values under the RCP8.5 scenario of the multi-model monthly ensembles average, the highest projected future seasonal maximum temperature is from January to May, during the base period; the highest quarterly is from February to April; and the lowest is in July. In the 2030s, the highest future maximum temperature is projected from February to April and the lowest in August. In the 2050s, the highest future maximum temperature is projected from January to April and the lowest in August, and in the 2080s the highest future maximum temperature is projected from January to May, with the lowest in August. The season from February to April is projected to have a high likelihood of heat waves, with the average monthly maximum temperature ranging from 30 °C in the 2030s reaching nearly 34 °C in the 2080s, when the highest warming occurs (Table S3). The analysis of monthly minimum temperature results for all months increases throughout the three time periods of 2030, 2050, and 2080s. Comparing the inter-monthly projected future values, the highest future minimum temperature is observed in March during the base period (Table S3). In the 2030s, the highest future minimum temperature is projected between February and May, with the highest individual month being in April and the lowest in December. In the 2050s, the highest future minimum temperature is projected between February and June, with the highest of all in March and April and the lowest in December. In turn, by the 2080s, the highest minimum temperature is projected, with the highest value to most likely occur in March and April and the lowest in November and December. The average monthly minimum temperature projection for the 2080s indicate an increasing trend till 2100, which is likely to induce negative impacts on residents in urban centers of southwest Ethiopia (Table S3).
The projected monthly maximum temperature using the multi-model ensemble means under RCP 8.5 shows a slight decrease by 0.2 °C in 2030, although increasing by 1.1 °C and 2.9 °C in the 2050s and 2080s, respectively (Table S5). With regard to monthly minimum temperature, future projections, as generated from the multi-model ensemble means, show increments of 0.1, 1.4, and 3.2 °C in the 2030s, 2050s, and 2080s with reference to 1971–2005 (Table S5).
The inter-seasonal projection of future maximum temperature, minimum temperature, and precipitation were analyzed using multi-model ensemble under RCP8.5 scenarios with reference to 1971–2005. The projected seasonal result showed the future maximum and minimum temperature increased in the 2030s, 2050s, and 2080s periods. The highest future maximum temperature is projected consistently to increase during the winter season for the 2030s, 2050s, and 2080s, whereas the lowest maximum temperature will occur in the summer season. Furthermore, the projected result shows the high likelihood of inducing warmer extreme event occurrences, such as heat waves (≥30 °C to 34 °C), in urban centers of the study towns (Jimma, Bedelle, Bonga, and Sokorru) during the winter and spring seasons in the 2050s and 2080s (refer to Table 4 and Table S5 and Figure 3a). In all seasons, the minimum temperature is projected to increase in the three time periods, with the highest increase occurring in the 2080s in winter, spring, and summer seasons, with autumn increases being relatively low (Table 4 and Table S5 and Figure 3b).
Table 4.
Computed seasonal multi-model results of the areal average of maximum, minimum temperature (°C), and precipitation (mm) in the future time periods, comparing to the historical base period (1971–2005), near-term 2030s (2021–2040), mid-term 2050s (2041–2070), and long-term 2080s (2071–2100) data under the RCP8.5 scenario over the urban centers of southwest Ethiopia. Values in bold only indicate the smallest, and bold with * indicate the largest value within the time period. Please note that the average temperature ≥ 30 °C range implies the occurrence of seasonal extreme temperature events across time periods.
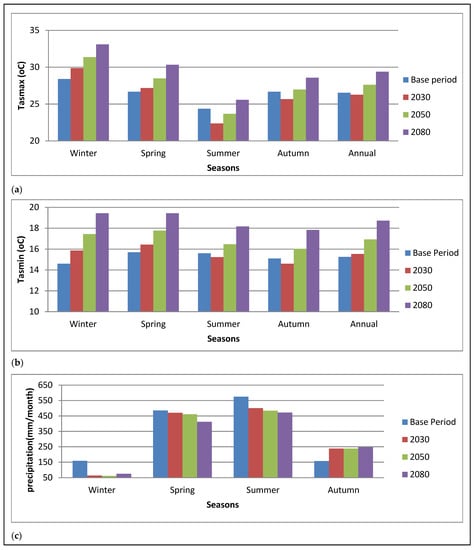
Figure 3.
Projected (a) seasonal maximum temperature, (b) seasonal minimum temperature, and (c) seasonal precipitation under RCP8.5, as computed for the near-term (2030), mid-term (2050), and long-term (2080) with reference to the historical base period (1971–2005).
There is spatial and temporal inter-seasonal variability for both maximum and minimum temperature in urban centers of southwest Ethiopia under the RCP8.5 future projections. The seasonal maximum temperature increases during winter, with future changes of 1.5 °C in the 2030s, reaching up to 4.7 °C in the 2080s. This is followed by spring, with future changes of 0.5 °C expected in the 2030s and 3.7 °C in the 2080s. During the summer season, the maximum temperature is projected to decrease from 2 °C in the 2030s to 0.7 °C in the 2050s, but increase in the 2080s by 1.2 °C, whereas in autumn, the projected value shows a declining trend during the 2030s, by 1 °C, after which it increases by 0.3 °C and 1.9 °C in the 2050s and 2080s, respectively. The overall seasonal multi-model ensemble means showed that the maximum temperature is projected to decrease by 0.2 °C in 2030s and then increase by 1.1 °C and 1.9 °C in the 2050s and 2080s, respectively (Table S5). The analyzed results of future minimum temperature projected results revealed that there is a consistent increase in all seasons, from the lowest at 0.4 °C in 2030s to 3.2 °C in the 2080s, with spatial and temporal changes. The winter and spring future projected minimum temperature results show a similar trend of 0.4 °C, 1.4 °C, and 3 °C in the 2030s, 2050s, and 2080s, respectively. The projected summer minimum temperature increases by 0.8 °C, 1.3 °C, and 3.0 °C in the 2030s, 2050s, and 2080s, respectively, with the three seasons of winter, spring, and summer showing similar increases of 3 °C in the 2080s. The seasonal minimum temperature changes were more pronounced than the maximum temperature in all future periods.
3.4.2. Future Precipitation Projection Change Scenarios
Regarding monthly precipitation in the three future time periods, the highest precipitation occurs between May and September and the lowest precipitations between November and February under RCP8.5. The projected precipitation amount in the twenty-first century shows a consistent decrease along with high inter-month variability. In both the near-term (2030s) and mid-term (2050s), the highest extreme precipitation is likely to occur in May, whereas in the 2080s, the highest precipitation is likely to occur in the month of September and the lowest is likely occur in January, as projected under RCP8.5 using multi-model ensembles (Tables S3 and S5).
The projected analysis of future seasonal precipitation results showed that precipitation amount decreased in all seasons except in autumn, which shows an increment in all future periods. Under RCP8.5, future seasonal precipitation indicates a declining trend during summer, winter, and spring, except in autumn, when the precipitation is likely to increase (Table 4 and Table S5; Figure 3c). The highest increase that is likely to occur is in autumn, which is projected to increase as high as 52%, 52%, and 57% in the 2030s, 2050s, and 2080s, respectively (Table 4 and Table S5; Figure 3c).
3.5. Spatio-Temporal Interpolation of Temperature and Precipitation Projection Change
3.5.1. Interpolation of Maximum and Minimum Temperatures Projection Change in Urban Centers
Interpolation of the temperatures for the urban centers of Jimma, Bedelle, Bonga, and Sokorru and their surroundings was conducted. The projected future maximum temperature for the four urban centers, showed a consistent increasing trend during the three future periods with reference to 1971–2005. The highest maximum temperature is projected over Sokoru, followed by Bedelle, and the lowest over Jimma when comparing the outputs of the model projection for the near-, mid-, and long-term future periods, reaching ≥30 °C, which implies the likelihood of increased heatwaves in urban centers towards the end of the twenty-first century under RCP8.5 with reference to 1971–2005 (Table S4 and Figure 4—Panel 1). The projected results for future minimum temperature in the four urban centers showed a progressive incremental change throughout the three future periods. During the historical period, the highest minimum temperature was observed in Bedelle while the lowest occurred in Jimma and Sokorru. In the near- (2030), mid- (2050), and long-term (2080), the highest temperature change is projected in Bedelle, with the lowest in Jimma and Sokorru, as depicted in Table S4 and Figure 4—Panel 2.
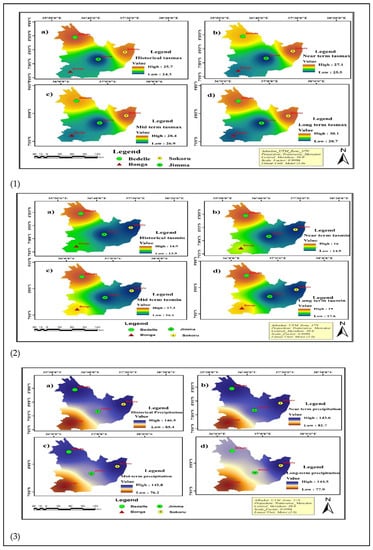
Figure 4.
(Panel 1): (a) historical, (b) near-term (2030), (c) mid-term (2050), and (d) long-term (2080) maximum temperatures (°C); (Panel 2): (a) historical, (b) near-term (2030), (c) mid-term (2050), and (d) long-term (2080) minimum temperatures (°C); and (Panel 3): (a) historical, (b) near-term (2030), (c) mid-term (2050), and (d) long-term (2080) monthly mean precipitation (mm/month) for the four stations, as interpolated using Inverse Distance Weighing (IDW) using ArcGIS.
Both maximum and minimum temperature projections consistently showed increasing trends with warming, which are more likely to occur in the near-, mid-, and long-term periods (Table S4 and Figure 4—Panels 1 and 2). The highest future maximum and minimum temperature are projected to occur in Sokorru and Bedelle, whereas the lowest values are projected in Jimma and Sokorru, respectively, with reference to 1971–2005.
3.5.2. Interpolation of Future Precipitation Projection Changes in Urban Centers
Analysis of interpolated precipitation over the Jimma, Sokorru, Bedelle, and Bonga surface stations were considered, both to simulate historical data and to generate future projections for the southwest urban centers and their surroundings. Thus, the projected precipitation trends over these urban centers showed a consistent declining tendency throughout the twenty-first century, with substantial dominance of spatial and temporal variability. During the historical period, the highest precipitation was observed in Sokorru, followed by Bedelle, with the lowest precipitation occurring over Bonga in the near-term (2030). However, in Jimma, there is a slight increase in precipitation with respect to historical values, which is followed by a declining trend in the mid- and long-term periods. Similarly, in the mid-term (2050) and long-term (2080), the highest precipitation is projected in Sokorru, with the lowest in Bonga as compared to their respective historical ensemble means under RCP8.5, as depicted in Figure 4—Panel 3 and Table S4.
4. Discussion
This study examined changes in future trends and climate projection of maximum and minimum temperature and precipitation in the urban centers of southwest Ethiopia using CORDEX Africa data under RCP8.5—the highest radiative forcing. Model-based projections were generated for the near- (2030), mid- (2050), and long-term (2080) time periods in the twenty-first century and compared with the 1971–2005 reference period, using data from point stations Jimma, Sokorru, Bedelle, and Bonga. Performances of the models were evaluated by employing the bias correction method in order to check the degree of agreement between the projected and observed data (Table 2 and Table S2). The use of bias correction is deployed in most climatological projections, as documented by [90], which used RCPs data in the Hare Watershed, Southern Rift Valley, of Ethiopia. Moreover, ref. [91] applied this method to generate precipitation projections from regional climate models in West Africa, while [92] applied it in hydrological studies over the Tekeze basin, Ethiopia.
Unplanned urban growth and urbanization in urban centers of southwest Ethiopia has been observed, resulting in massive LULC change; it is also projected to increase in the future, as documented in previous study [20]. Similar findings have been observed in urban studies in developing countries, with projected massive LULC changes between 2020 to 2050 [17,18,19]. This will trigger a change in the microclimate of these urban centers or cities.
All models used in this research varied in their projected performance for both temperature and precipitation. The results generated for maximum and minimum temperature using six climate models showed a consistent increase from the current to late twenty-first century over the urban centers of southwest Ethiopia. However, model-based future projection of precipitation revealed that four models’ (MOCH CLMcom, MOCH GERICS, MPI GERICS, and NCC GERICS) results showed a decreasing trend, whereas results from two models indicated an increasing trend, with a small increment projected by MPI CLMcom and the highest by NCC CLMcom, respectively, under near-, mid-, and long-term periods (Table 3).
The multi-model ensemble mean is better than using individual models for the study, as determined by [13], who evaluated the ability of ten regional climate models (RCMs) from CORDEX in simulating the characteristics of rainfall patterns over eastern Africa. In their study, ref. [13] demonstrated that the multi-model ensemble means adequately simulate eastern Africa rainfall for the assessment of future climate projections. The result of the precipitation projection by models used in this study is comparable with recent studies by [93] over Africa, while the results are still associated with very large uncertainties in precipitation response to external radiative forcing. The results further showed a decrease in precipitation over the Ethiopian Highlands and the Horn of Africa. The mechanisms derived after the 1980 precipitation trends in this region are still poorly understood, potentially involving complex connections with ENSO and IOD in the predictability of Ethiopian main season precipitation, as documented by [94]; shown for the Indian Ocean, by [95]; shown for the Atlantic Ocean, by [96]; and shown for the Pacific Ocean, by [84]. These findings could scientifically be justifiable because the poor performance of individual CORDEX RCMs in East Africa was well articulated by a number of studies, notably [13,47,50,97]. We also documented results generated from similar studies in Supplementary Table S2.
The results indicate that both maximum and minimum temperatures are projected to increase in the urban centers of southwest Ethiopia, with a consistently increasing trend throughout the three future periods of the twenty-first century. Future monthly maximum temperature projection using absolute changes in the multi-model ensemble means under RCP8.5 are projected to increase in 2050, reaching about 2.9 °C in the 2080s. Whereas, the monthly minimum temperature multi-model ensemble means consistently increased throughout projections of the twenty-first century, reaching 3.2 °C in the 2080s with reference to 1971–2005 (Tables S2 and S5). Thus, the monthly, seasonal, and annual minimum temperature changes are more pronounced and intense than the maximum temperature during three periods of the twenty-first century in urban centers of southwest Ethiopia. Our current findings are comparable to the report of increasing warming that could occur by mid-century across much of Africa, reaching between 3 °C and 6 °C by the end of the century, as documented by the [1] under RCP8.5. This is consistent with the recent IPCC report [16] that projected global surface temperature rising by 3.3 °C to 5.7 °C under the very-high GHG emissions scenario SSP5/RCP8.5. The findings are also aligned with other studies made in Ethiopia, as documented in [27] and provided in Supplementary Table S2. The findings are also comparable with most previous studies using other coarse-resolution models for the City of Addis Ababa, including the studies made by [98,99], which showed that there is an increasing trend for both maximum and minimum temperature, with minimum temperature projected to increase more than the maximum in the near-, mid-, and long-term time periods. In addition, another study conducted in Shashamanne town in Ethiopia under the RCP8.5 scenario using multiple models projected increasing warming of 3 °C and 2.5 °C by 2060 for minimum and maximum temperature, respectively ([100], Table S2). A significant T-test result set at a 95% confidence interval showed a significant increase in minimum and maximum temperatures, with two-tailed significance (α = 0.05, p = 0.000), as indicated in Table 2.
For future monthly precipitation projection, the results of the multi-model ensemble projected declines of 7.5%, 2%, and 2.9% in the near-term (2030), mid-term (2050), and long-term (2080) with reference to 1971–2005. Regarding the future seasonal precipitation, the projected multi-model ensembles under RCP8.5 relative changes indicate a decreasing trend in summer, winter, and spring seasons. In contrast, precipitation is projected to increase in autumn (OND), with projected increments of 52%, 52%, and 57% in the 2030s, 2050s, and 2080s, respectively (Tables S2 and S5). However, a significant T-test result set at the 95% confidence interval showed precipitation decline as an insignificant change, with two-tailed significance (α = 0.05, p = 0.159), as indicated in Table 2.
Our current findings showing declining precipitation are different from a study made using other coarse-resolution models in the City of Addis Ababa, as documented by [99]. However, a similar study conducted for Shashamanne under the higher radiative forcing of RCP8.5 indicated that precipitation is projected to decrease in the wettest months by up to 10%, but in the dry months, the median estimated increment is 10–20% by 2060, likely either increasing or decreasing using KNMI climate explore, as documented by [100]. Our findings, however, disagreed with previous global and regional climate projections [101,102,103]. Previous studies found that in the twenty-first century, mean precipitation is projected to increase over the Horn of Africa from September to May but decrease over the Ethiopian Highlands in March, April, and May (MAM). A decline in precipitation for MAM over Ethiopia is highly agreeable with our findings. It is argued that the model’s uncertainty of regional climate projections was due to the fact that the Ethiopian climate is highly diverse and the regional climate is influenced by the diverse topographic characteristics as well as the monsoon and Great Rift Valley systems, as highlighted by [45] and also summarized in Table S2 [81,99]
The projected land-use changes have been found to have a strong effect on future minimum temperature in Sydney, Australia, adding to the warming caused by GHGs during winter and spring, which doubly increased due to global warming alone by 2050, showing urbanization will impact minimum temperature, which can thus be seen as a local climate change signal [104]. The projected urban climate for the 2070s in August revealed that using the simulations of the Weather Research and Forecast (WRF) model with a 3-km grid increment coupled to an urban canopy model (UCM), the ensemble average results estimated the heat stress for future residents of Tokyo, Osaka, and Nagoya [105]. The projected monthly average August temperatures in the 2070s are about 2.3 °C higher than in the 2000s at the three urban areas and comparable to those in the record-breaking hot summer of 2010, with uncomfortable sleeping nights in the 2070s worsening in Tokyo with urban heat island intensity, which also happened in Osaka and Nagoya [105]. The finding is in agreement with the minimum temperature increase, which will be more pronounced towards the end of the century, having health impacts in urban centers, even if the level of urban growth differs.
The high-resolution regional climate model of the urban canopy model of the Tokyo metropolitan area showed that future projections for the 2070s increases between 2 °C and 4 °C in daytime mean Wet Bulb Global Temperature (WBGT) relative to the current climate, and the urban scenario impacts range from −0.4 °C to +0.4 °C [90]. These findings indicate that urban land surface changes may improve or worsen the local moist thermal environment and that metropolitan-scale urban planning is inefficient in mitigating heat-related health risks for mature cities such as Tokyo [106], cities in Bangladesh, and other countries [21,22,23,24,25,26]. In addition, one study, assessing the future heat stress under six future global warming (ΔTGW) scenarios of RCP8.5 in an Asian megacity (Osaka), estimated using a regional climate model with an urban canopy, showed that an urban “heat-stress island” is projected in all six scenarios: ΔTGW = +0.5 °C to +3.0 °C in 0.5 °C steps. Under ΔTGW = +3.0 °C conditions, people outdoors experience “extreme” heat stress, which could result in dangerously high increases in a human body’s core temperature [107]. The warming in the urban core due to buildings and reduced green vegetation is similar to urban heat increase, although findings among highly developed mega city with different spatial and urban growth statuses may differ.
A study using medium-range resolution (20-km grid spacing) ensemble-based simulations on the urban expansion of climate effects in California in 2100, depicted that summer time (June–August (JJA)) warming due to urban expansion of 18–28 °C is greater relative to any other season [108]. The additional high-resolution (2-km grid spacing) experiments conducted by a coarser scale result also showed that urban-induced warming (local maximum warming exceeds 48 °C) is simulated, which can be completely offset by a range of adaptation strategies: green roofs (highly transpiring), cool roofs (highly reflective), and hybrid roofs (with combined biophysical properties of green and cool roofs) [92]. The findings are similar than temperature increase projections but will differ among population densities and adaptation climate actions due to the adaptive capacity of cities.
The future urban climates study conducted for greater Ho Chi Minh (HCM) city, a fast-growing megacity in Southeast Asia, used the WRF model with current and future (master plan-based) land-use data with a horizontal resolution of 1 km. These results show the rural areas spatially averaged monthly mean air temperature in April are projected to increase by 1.2 °C and 1.7 °C by the 2050s under the RCP4.5 and RCP8.5 scenarios, respectively. The newly urbanized areas account for an additional warming of 0.5 °C under both scenarios, up to 20–30% regarding global warming, but an additional warming by urbanization can exceed 0.8 °C at night. The impact of future urbanization (0.5 °C) is comparable to the difference in the temperature increases achieved under the different RCP scenarios, which also supplement studies of the future urban climates of fast-growing cities in developing countries [93]. The models used differ with the degree of resolution employed by the studies.
A new parameterization of urban areas using Community Climate System Model version 4 (CCSM4) allow for simulation of temperature in cities. The results showed that both the daytime and nocturnal UHIs decrease in RCP8.5, but the decrease in the daytime UHI is larger and more uniform across regions and seasons than in the nocturnal UHI. This was caused by changes in evaporation that warm the rural surface more than the urban one, with significant spatial and seasonal variability in the response of the nocturnal UHI, caused mainly by changes in the rural surface [109]. Climate change increases the number of warm nights in urban areas substantially more than in rural areas, which provides evidence that urban and rural areas respond differently to climate change while the unique aspects of the urban environment should be considered when making climate change projections, particularly since the global population is becoming increasingly urbanized [110]. The warming of future projected night findings is similar to the findings in urban and rural outskirts.
Future projections from present climate data are very challenging. In the discussion by [43], the authors argued that a wet (dry) bias in the present climate does not necessarily imply a tendency towards wetter (drier) future precipitation characteristics, making an attempt to select the “best-performing” RCM difficult. The result does not agree with the finding of the projected changes conducted in Ethiopia at the national level. The precipitation amount above the 95th percentile shows a significant increase over most parts of Ethiopia, with longer dry and shorter rainy periods projected over northern Ethiopia, as well as higher values in the southern region. Extreme and heavy precipitation events are likely to be more intense, especially in the summer season (June to September) throughout the twenty-first century [109]. The differences among the model projections, which were also documented in previous studies, did not address the local differences and degree of model resolution used. Unlike previous studies, our study employed higher-resolution modeling. All urban centers of southwest Ethiopia are not affected equally across spatial and temporal time horizons due to topographic differences, the adaptive capacity of each town, the rate of urbanization, and population dynamism. The high population increment in urban centers of southwest Ethiopia, as projected by [57], and the high buildings in the central business districts (CBDs) of the study towns, compounded by urban expansion in the periphery, would induce urban heat islands. This could exacerbate climate-related impacts, creating warmer surface temperatures further in the future. The findings are in good agreement with other studies conducted in Addis Ababa [101,111,112] and other developing countries’ urban centers [21,22,23,24,25,26]. Considering future climate changes, the inclusion of future sustainable urban development is crucial and mandatory to make livable urban centers or cities cope with inevitable climate change through increasing adaptive capacity.
5. Conclusions
Climate change trends and future projection of temperatures and precipitation scenarios were examined for three future periods—near- (2030), mid- (2050), and long-term (2080)—using CORDEX Africa, with a high resolution of 0.22° under RCP8.5 for southwest urban areas in Ethiopia. The statistical test applied for bias correction in this study found a good correlation between the projected and observed results. Our findings for annual and decadal linear trend changes in maximum and minimum temperatures showed an increasing trend as compared to a declining but statistically insignificant trend in precipitation. The multimodal ensemble mean outperforms the results that were generated from individual models.
Future absolute change in projected monthly maximum temperature multi-model ensemble means under RCP8.5 is slightly decreased in the near-term (2030), followed by an increase in the mid-term (2050), and reaching 2.9 °C in the long-term (2080). In contrast, absolute change in projected monthly minimum temperature is likely to increase throughout the twenty-first century, reaching 3.2 °C by the 2080s. The overall seasonal multi-model ensemble mean absolute change results showed that the maximum temperature is projected to increase during the second half of the twenty-first century, with the highest warming occurring in winter, followed by spring, summer, and autumn, respectively. Future minimum temperature projection results revealed that there is a consistent increase in minimum temperature for all seasons. Winter, spring, and summer showed similar projections of a 3 °C rise in the 2080s with reference to 1971–2005.
Future relative change in monthly projected precipitation, as generated from the multi-model ensemble, showed that it is projected to decrease in the twenty-first century with reference to 1971–2005. Regarding the future seasonal precipitation, the analyzed multi-model ensembles under RCP8.5 relative changes indicate a decreasing trend during the three seasons of winter, spring, and summer, whereas there will be an increase in precipitation in autumn (October to December season), which is likely to enhance the occurrence of extreme precipitation events.
Generally, all models agree consistently on monthly, seasonal, and annual bases with maximum and minimum temperature increase under RCP8.5, with slight variation spatially and temporally. Projected increases in minimum temperatures are more pronounced and intense than the maximum temperature over urban centers of southwest Ethiopia, imposing high impacts on urban residents. From our findings, we conclude that a high warming tendency is expected towards the end of twenty-first century. Projected monthly precipitation amounts also showed a decreasing trend, with a small percentage change during summer, winter, and spring seasons, whereas the precipitation increases during autumn. With regard to precipitation trend, even if it is difficult to conclude the future direction of change since the majority of the models agree to project a decreasing trend, few models suggest an increasing trend with daily extreme events, which are likely to occur in the urban centers of southwest Ethiopia. Therefore, the urban planner and city-planning authority should monitor the rate and dimension of urban expansion to ensure sustainable development. Moreover, policymakers could consider urban growth factors under different land-cover scenarios in order to alleviate the negative consequence caused by unplanned and haphazard urban development. In fact, this needs further study to monitor the impacts of urban expansion on urban climate, as well as to take effective mitigation measures.
Unplanned urbanization in the study urban centers exacerbate the already massive land-use/land-cover change to built-up area. Whereas, other agricultural land, vegetation, and wetlands decrease, with variation in the spatio-temporal range of change. This leads to a likelihood of an increase in land surface temperature and urban heat island effect in the urban core, where dense, congested high-rise buildings exist. These changes could escalate future changing of the micro climate of the study urban centers. Our study results enhance availability of baseline information for the use of CORDEX Africa experiment data simulation for future climate projection studies at local, national, and regional scales. Moreover, our quantitative analyses and the synthesized outputs, as generated from CORDEX, can be used for low, medium, and large cities’ climate projection studies, as well as to alert the need for controlling urban growth patterns. The results also provide urban planners, urban actors, and decision makers with knowledge to ensure sustainable urban development that would enable to curb the future inevitable climate change by proper implementation of adaptation and mitigation climate actions ahead of time in urban centers of southwest Ethiopia.
Our findings also showed an increasing trend in projected temperature in contrast to ambiguity in the precipitation projection in the remaining decades of the twenty-first century. Based on our present findings, we recommend that it is time to implement climate-resilient urban planning that promotes adaptation and mitigation interventions in urban centers of southwest Ethiopia. From a practical view point, proper use of downscaled climatic data for environmental and climate action planning is generally constrained because of the lack of high-resolution observational and model-based simulated data of climate modelling centers and computational facilities; thus, such data need to be established in Ethiopia. Further advanced studies are recommended to generate more reliable and accessible future climate change projections over the study area.
Supplementary Materials
The following supporting information can be downloaded at: https://www.mdpi.com/article/10.3390/cli10100158/s1, Table S1: Representative Concentration Pathways (RCPs) and equivalent emission scenarios in Special report on emission scenarios (SRES) and Shared Socio-Economic Pathways (SSP); Table S2: Comparison of previous studies conducted in different parts of Ethiopia; Table S3. Areal average of models monthly maximum temperature (tasmax), minimum temperature (tasmin) and precipitation (pr) with the reference period (1981–2010), 2030 near, 2050 middle and 2080 long term period of the twenty-first century; Table S4. Analysis of spatial interpolation of multi models averages of four study stations/urban centers during the historical period (1971–2005), near 2030 (2011–2040), middle 2050 (2041–2070), and long term 2080 (2071–2100) under RCP8.5.; Table S5. Computed Areal average of models monthly, seasonal and annual changes for maximum temperature (tasmax), minimum temperature (tasmin) and precipitation (pr) with the reference period (1981–2010), 2030 near, 2050 middle and 2080 long term periods.
Author Contributions
T.D.G., D.K.D. and C.F. devised the project, the main conceptual ideas and proof outline; T.D.G. designed the research study, worked out almost all of the technical details, executed and conducted experiments, performed analysis of the numerical calculations of the manuscript, and wrote the manuscript under the close supervision of D.K.D. and C.F.; D.K.D. closely worked out the supervision, involved almost in all technical details, and verified the numerical results of all sections with help from T.D.G.; C.F. and D.E. downscaled and downloaded CORDEX Africa data in a usable form as well as checked and cleaned the statistical data, and performed editing.; D.K.D., W.G. and A.W. supervised, contributed to framing the manuscript, and made valuable inputs and comment during the write up. All authors have read and agreed to the published version of the manuscript.
Funding
This research did not receive any specific grant from funding agencies in the public, commercial, or any non-profit-sectors. However, this research article publication charge (APC) was supported by University of California Santa Barbara, Climate Hazards Center, USA, by co-author Dr. Chris Funk.
Data Availability Statement
The raw data supporting the conclusions of this article will be made available by the authors, without undue reservation up on reasonable request.
Acknowledgments
The authors greatly acknowledge the following institutions: the World Climate Research Programme’s Working Groups on Regional Climate coordinating bodies of CORDEX and CMIP. We thank the climate modelling groups that produced and made available their model output. CORDEX data are made available via the Earth System Grid Federation infrastructure, an international effort led by the U.S. Department of Energy’s Program for Climate Model Diagnosis and Intercomparison, the European Network for Earth System Modelling, and the climate modeling groups listed in Table 1, producing their model output in CORDEX Africa climate modelling groups who contribute to access regional data to increase the accuracy and availability of local climate data to researchers in the field. Also, West Oromia Meteorological Services Center is acknowledged in availing observed meteorological data. We are also grateful to the Jimma University College of Agriculture and Veterinary Medicine for hosting a PhD student to undertake this research. The Authors also thank those friends who extended their technical support during the research work. Finally, we thank Juliet Way-Henthorne of University of California Santa Barbara, who reviewed the language coherency and consistency of this manuscript to the best standard.
Conflicts of Interest
The authors declare that they have no conflict of interest.
References
- IPCC. Climate Change 2014. In Impacts, Adaptation, and Vulnerability; Part A: Global and Sectoral Aspects. Contribution of Working Group II to the Fifth Assessment Report of the Intergovernmental Panel on Climate Change; Cambridge University Press: Cambridge, UK, 2014; Available online: http://www.ipcc.ch/report/ar5/wg2/ (accessed on 20 July 2022).
- IPCC. Summary for Policymakers. In Global Warming of 1.5 °C. An IPCC Special Report on the Impacts of Global Warming of 1.5 °C above Pre-Industrial Levels and Related Global Greenhouse Gas Emission Pathways, in the Context of Strengthening the Global Response to the Threat of Climate Change, Sustainable Development, and Efforts to Eradicate Poverty; WMO: Geneva, Switzerland, 2018. [Google Scholar]
- Gudoshava, M.; Misiani, H.O.; Segele, Z.T.; Jain, S.; Ouma, J.O.; Otieno, G.; Anyah, R.; Indasi, V.S.; Endris, H.S.; Osima, S.; et al. Projected effects of 1.5 °C and 2 °C global warming levels on the intra-seasonal rainfall characteristics over the Greater Horn of Africa. Environ. Res. Lett. 2020, 15, 034037. [Google Scholar] [CrossRef]
- United Nations. Department of Economic and Social Affairs, Population Division. In World Urbanization Prospects: The 2018 Revision (ST/ESA/SER.A/420); United Nations: New York, NY, USA, 2019. [Google Scholar]
- Tuholske, C.; Caylora, K.; Funk, C.; Verdine, A.; Sweeneya, S.; Gracee, K.; Peterson, P.; Evans, T. Global Urban Population Exposure to Extreme Heat. Proc. Natl. Acad. Sci. USA 2021, 118, e2024792118. [Google Scholar] [CrossRef]
- IPCC. Climate Change 2022: Impacts, Adaptation, and Vulnerability. In Contribution of Working Group II to the Sixth Assessment Report of the Intergovernmental Panel on Climate Change; Pörtner, H.-O., Roberts, D.C., Tignor, M., Poloczanska, E.S., Mintenbeck, K., Alegría, A., Craig, M., Langsdorf, S., Löschke, S., Möller, V., et al., Eds.; Cambridge University Press: Cambridge, UK, 2022; in press. [Google Scholar]
- Endris, H.S.; Lennard, C.; Hewitson, B.; Dosio, A.; Nikulin, G.; Panitz, H.-J. Teleconnection responses in multi-GCM driven CORDEX RCMs over Eastern Africa. Clim. Dyn. 2016, 46, 2821–2846. [Google Scholar] [CrossRef]
- Lyon, B. Biases in CMIP5 Sea Surface Temperature and the Annual Cycle of East African Rainfall. J. Clim. 2020, 33, 8209–8223. [Google Scholar] [CrossRef]
- Lyon, B. Biases in sea surface temperature and the annual cycle of Greater Horn of Africa rainfall in CMIP6. Int. J. Clim. 2021, 42, 4179–4186. [Google Scholar] [CrossRef]
- Schwarzwald, K.; Goddard, L.; Seager, R.; Ting, M.; Marvel, K. Understanding CMIP6 Biases in the Representation of the Greater Horn of Africa Long and Short Rains. Clim. Dyn. 2022, 1, 1366281. [Google Scholar] [CrossRef]
- Riahi, K.; Rao, S.; Krey, V.; Cho, C.; Chirkov, V.; Fischer, G.; Kindermann, G.; Nakicenovic, N.; Rafaj, P. RCP 8.5-A scenario of comparatively high greenhouse gas emissions. Clim. Chang. 2011, 109, 33. [Google Scholar]
- Thomson, A.M.; Calvin, K.V.; Smith, S.J.; Kyle, G.P.; Volke, A.; Patel, P.; Delgado-Arias, S.; Bond-Lamberty, B.; Wise, M.A.; Clarke, L.E.; et al. RCP4.5: A pathway for stabilization of radiative forcing by 2100. Clim. Chang. 2011, 109, 77–94. [Google Scholar] [CrossRef]
- Endris, H.S.; Omondi, P.; Jain, S.; Lennard, C.; Hewitson, B.; Chang’a, L.; Awange, J.L.; Dosio, A.; Ketiem, P.; Nikulin, G.; et al. Assessment of the performance of CORDEX regional climate models in simulating East Africa rainfall. J. Clim. 2013, 26, 8453–8475. [Google Scholar] [CrossRef]
- Masui, T.; Matsumoto, K.; Hijioka, Y.; Kinoshita, T.; Nozawa, T.; Ishiwatari, S.; Kato, E.; Shukla, P.R.; Ya-magata, Y.; Kainuma, M. An emission path-way for stabilization at 6 Wm−2 radiative forcing. Clim. Chang. 2011, 109, 59–76. [Google Scholar] [CrossRef]
- Hayhoe, K.; Edmonds, J.; Kopp, R.E.; Le Grande, A.N.; Sanderson, B.M.; Wehner, M.F.; Wuebbles, D.J. Climate models, scenarios, and projections. In Climate Science Special Report: Fourth National Climate Assessment, Volume I U.S; Global Change Research Program: Washington, DC, USA, 2017; pp. 133–160. [Google Scholar]
- IPCC. Summary for Policymakers. In Climate Change 2021: The Physical Science Basis. Contribution of Working Group I to the Sixth Assessment Report of the Intergovernmental Panel on Climate Change; Masson-Delmotte, V., Zhai, P., Pirani, A., Connors, S.L., Péan, C., Berger, S., Caud, N., Chen, Y., Goldfarb, L., Gomis, M.I., et al., Eds.; Cambridge University Press: Cambridge, UK, 2021; In Press. [Google Scholar]
- Al-Hameedi, W.M.M.; Chen, J.; Faichia, C.; Al-Shaibah, B.; Nath, B.; Kafy, A.-A.; Hu, G.; Al-Aizari, A. Remote Sensing-Based Urban Sprawl Modeling Using Multilayer Perceptron Neural Network Markov Chain in Baghdad, Iraq. Remote Sens. 2021, 13, 4034. [Google Scholar] [CrossRef]
- Naim, N.H.; Al Kafy, A. Assessment of urban thermal field variance index and defining the relationship between land cover and surface temperature in Chattogram city: A remote sensing and statistical approach. Environ. Chall. 2021, 4, 100107. [Google Scholar] [CrossRef]
- Rahaman, Z.A.; Al Kafy, A.; Faisal, A.-A.; Al Rakib, A.; Jahir, D.M.A.; Fattah, A.; Kalaivani, S.; Rathi, R.; Mallik, S.; Rahman, M.T. Predicting Microscale Land Use/Land Cover Changes Using Cellular Automata Algorithm on the Northwest Coast of Peninsular Malaysia. Earth Syst. Environ. 2022. [Google Scholar] [CrossRef]
- Dessu, T.; Korecha, D.; Hunde, D.; Worku, A. Long-Term Land Use Land Cover Change in Urban Centers of Southwest Ethiopia from a Climate Change Perspective. Front. Clim. 2020, 2, 577169. [Google Scholar] [CrossRef]
- Saha, M.; Kafy, A.A.; Bakshi, A.; Almulhim, A.I.; Rahaman, Z.A.; Al Rakib, A.; Rathi, R. Modelling microscale impacts assessment of urban expansion on seasonal surface urban heat island intensity using neural network algorithms. Energy Build. 2022, 275, 112452. [Google Scholar] [CrossRef]
- Zhang, M.; Zhang, C.; Kafy, A.-A.; Tan, S. Simulating the Relationship between Land Use/Cover Change and Urban Thermal Environment Using Machine Learning Algorithms in Wuhan City, China. Land 2021, 11, 14. [Google Scholar] [CrossRef]
- Al Kafy, A.; Al Faisal, A.; Al Rakib, A.; Akter, K.S.; Rahaman, Z.A.; Jahir, D.M.A.; Subramanyam, G.; Michel, O.O.; Bhatt, A. The operational role of remote sensing in assessing and predicting land use/land cover and seasonal land surface temperature using machine learning algorithms in Rajshahi, Bangladesh. Appl. Geomat. 2021, 13, 793–816. [Google Scholar] [CrossRef]
- Al Kafy, A.; Faisal, A.A.; Rahman, S.; Islam, M.; Al Rakib, A.; Islam, A.; Khan, H.H.; Sikdar, S.; Sarker, H.S.; Mawa, J.; et al. Prediction of seasonal urban thermal field variance index using machine learning algorithms in Cumilla, Bangladesh. Sustain. Cities Soc. 2021, 64, 102542. [Google Scholar] [CrossRef]
- AlDousari, A.E.; Kafy, A.A.; Saha, M.; Fattah, A.; Almulhim, A.I.; Faisal, A.-A.; Al Rakib, A.; Jahir, D.M.A.; Rahaman, Z.A.; Bakshi, A.; et al. Modelling the impacts of land use/land cover changing pattern on urban thermal characteristics in Kuwait. Sustain. Cities Soc. 2022, 86, 104107. [Google Scholar] [CrossRef]
- Kafy, A.A.; Saha, M.; Rahaman, Z.A.; Rahman, M.T.; Liu, D.; Fattah, M.A.; Al Rakib, A.; AlDousari, A.E.; Rahaman, S.N.; Hasan, M.Z.; et al. Predicting the impacts of land use/land cover changes on seasonal urban thermal characteristics using machine learning algorithms. Build. Environ. 2022, 217, 109066. [Google Scholar] [CrossRef]
- Setegn, S.G.; Rayner, D.; Melesse, A.M.; Dargahi, B.; Srinivasan, R. Impact of climate change on the hydroclimatology of Lake Tana Basin, Ethiopia. Water Resour. Res. 2010, 47. [Google Scholar] [CrossRef]
- Cities Alliance. About CDS (Online). 2017. Available online: http://www.citiesalliance.org/about-cds (accessed on 26 July 2021).
- Omondi, P.; Awange, J.; Ogallo, L.; Okoola, R.; Forootan, E. Decadal rainfall variability modes in observed rainfall records over East Africa and their relations to historical sea surface temperature changes. J. Hydrol. 2012, 464, 140–156. [Google Scholar] [CrossRef]
- Viste, E.; Korecha, D.; Sorteberg, A. Recent drought and precipitation tendencies in Ethiopia. Theor. Appl. Climatol. 2013, 112, 535–551. [Google Scholar] [CrossRef]
- McSweeney, C.; New, M.; Lizcano, G. UNDP Climate Change Country Profiles: Ethiopia; United Nations Development Programme: New York, NY, USA, 2010. [Google Scholar]
- Wilby, R.L.; Dawson, C.W. The statistical downscaling model (SDSM): Insights from one decade of application. Int. J. Clim. 2013, 33, 1707–1719. [Google Scholar] [CrossRef]
- World Bank Group. Unlocking Ethiopia’s Urban Land and Housing Markets: Urban Land Supply and Affordable Housing Study; World Bank: Washington, DC, USA, 2019; (No. 138371). [Google Scholar] [CrossRef]
- Tessema, M.W. Impact of urban expansion on surrounding peasant land the case of Boloso Sore Woreda, Areka Town, SNNPR, Ethiopia. Glob. J. Hum. Soc. Sci. Res. 2017, 17, 53–65. [Google Scholar]
- United Nations Human Settlements Programme (UN-Habitat). State of the World’s Cities 2010/2011: Bridging the Urban Divide; Earthscan: Nairobi, Kenya, 2010. [Google Scholar]
- Haregeweyn, N.; Fikadu, G.; Tsunekawa, A.; Tsubo, M.; Meshesha, D.T. The dynamics of urban expansion and its impacts on land use/land cover change and small-scale farmers living near the urban fringe: A case study of Bahir Dar, Ethiopia. Landsc. Urban Plan. 2012, 106, 149–157. [Google Scholar] [CrossRef]
- MUDHC (Ministry of Urban Development Housing and Construction). National Report on Housing on Housing and Sustainable Urban Development; MUDC: Addis Ababa, Ethiopia, 2014. [Google Scholar]
- Zewdie, M.; Worku, H.; Bantider, A. Temporal dynamics of the driving factors of urban landscape change of Addis Ababa during the past three decades. Environ. Manag. 2018, 61, 132–146. [Google Scholar] [CrossRef]
- UN-Habitat. The State of Addis Ababa 2017: The Addis Ababa We Want; UN-Habitat: Nairobi, Kenya, 2017. [Google Scholar]
- UN-Habitat. Cities and Climate Change Global Report on Human Settlements 2011; UN-Habitat: Nairobi, Kenya, 2011. [Google Scholar]
- Sylla, M.B.; Giorgi, F.; Pal, J.S.; Gibba, P.; Kebe, I.; Nikiema, M. Projected changes in the annual cycle of high-intensity precipitation events over West Africa for the late twenty-first century. J. Clim. 2015, 28, 6475–6488. [Google Scholar] [CrossRef]
- Shiferaw, A.; Tadesse, T.; Rowe, C.; Oglesby, R. Precipitation Extremes in Dynamically Downscaled Climate Scenarios over the Greater Horn of Africa. Atmosphere 2018, 9, 112. [Google Scholar] [CrossRef]
- Dosio, A.; Jones, R.G.; Jack, C.; Lennard, C.; Nikulin, G.; Hewitson, B. What can we know about future precipitation in Africa? Robustness, significance and added value of projections from a large ensemble of regional climate models. Clim. Dyn. 2019, 53, 5833–5858. [Google Scholar] [CrossRef]
- Fotso-Nguemo, T.C.; Diallo, I.; Diakhaté, M.; Vondou, D.A.; Mbaye, M.L.; Haensler, A.; Gaye, A.T.; Tchawoua, C.J.C.C. Projected changes in the seasonal cycle of extreme rainfall events from CORDEX simulations over Central Africa. Clim. Chang. 2019, 155, 339–357. [Google Scholar] [CrossRef]
- Gebrechorkos, S.H.; Hülsmann, S.; Bernhofer, C. Changes in temperature and precipitation extremes in Ethiopia, Kenya, and Tanzania. Int. J. Clim. 2018, 39, 18–30. [Google Scholar] [CrossRef]
- Onyutha, C.; Rutkowska, A.; Nyeko-Ogiramoi, P.; Willems, P. How well do climate models reproduce variability in observed rainfall? A case study of the Lake Victoria basin considering CMIP3, CMIP5 and CORDEX simulations. Stoch. Hydrol. Hydraul. 2019, 33, 687–707. [Google Scholar] [CrossRef]
- Ayugi, B.; Tan, G.; Gnitou, G.T.; Ojara, M.A.; Ongoma, V. Historical evaluations and simulations of precipitation over East Africa from Rossby centre regional climate model. Atmos. Res. 2020, 232, 104705. [Google Scholar] [CrossRef]
- Berhane, A.; Hadgu, G.; Worku, W.; Abrha, B. Trends in extreme temperature and rainfall indices in the semi-arid areas of Western Tigray, Ethiopia. Environ. Syst. Res. 2020, 9, 3. [Google Scholar] [CrossRef]
- Ogega, O.M.; Koske, J.; Kung’U, J.B.; Scoccimarro, E.; Endris, H.S.; Mistry, M.N. Heavy precipitation events over East Africa in a changing climate: Results from CORDEX RCMs. Clim. Dyn. 2020, 55, 993–1009. [Google Scholar] [CrossRef]
- Onyutha, C. Analyses of rainfall extremes in East Africa based on observations from rain gauges and climate change simulations by CORDEX RCMs. Clim. Dyn. 2020, 54, 4841–4864. [Google Scholar] [CrossRef]
- Tegegne, G.; Melesse, A.M. Multimodel Ensemble Projection of Hydro-climatic Extremes for Climate Change Impact Assessment on Water Resources. Water Resour. Manag. 2020, 34, 3019–3035. [Google Scholar] [CrossRef]
- Mekasha, A.; Tesfaye, K.; Duncan, A.J. Trends in daily observed temperature and precipitation extremes over three Ethiopian eco-environments. Int. J. Clim. 2014, 34, 1990–1999. [Google Scholar] [CrossRef]
- Omondi, P.A.; Awange, J.L.; Forootan, E.; Ogallo, L.A.; Barakiza, R.; Girmaw, G.B.; Fesseha, I.; Kululetera, V.; Kilembe, C.; Mbati, M.M.; et al. Changes in temperature and precipitation extremes over the Greater Horn of Africa region from 1961 to 2010. Int. J. Clim. 2014, 34, 1262–1277. [Google Scholar] [CrossRef]
- Taylor, K.E.; Stouffer, R.J.; Meehl, G.A. An Overview of CMIP5 and the Experiment Design. Bull. Am. Meteorol. Soc. 2012, 93, 485–498. [Google Scholar] [CrossRef]
- Getenet, K.; Bewket, W. Variations in rainfall and extreme event indices in the wettest part of Ethiopia. SINET Ethiop. J. Sci. 2009, 32, 129–140. [Google Scholar]
- Central Statistical Authority (CSA). Population Statistical Abstract. In Addis Ababa: Federal Democratic Republic of Ethiopia, Population Census Commission. Democratic Republic of Ethiopia; Population Census Commission: Addis Ababa, Ethiopia, 2007. [Google Scholar]
- CSA. Population Projections for Ethiopia 2007–2037; Addis Ababa, Ethiopia, 2017. [Google Scholar]
- Buontempo, C.; Mathison, C.; Jones, R.; Williams, K.; Wang, C.; McSweeney, C. An ensemble climate projection for Africa. Clim. Dyn. 2014, 44, 2097–2118. [Google Scholar] [CrossRef]
- Giorgi, F.; Coppola, E.; Raffaele, F. A consistent picture of the hydroclimatic response to global warming from multiple indices: Models and observations. J. Geophys. Res. Atmos. 2014, 119, 11695–11708. [Google Scholar] [CrossRef]
- Dosio, A.; Turner, A.G.; Tamoffo, A.T.; Sylla, M.B.; Lennard, C.; Jones, R.G.; Terray, L.; Nikulin, G.; Hewitson, B. A tale of two futures: Contrasting scenarios of future precipitation for West Africa from an ensemble of regional climate models. Environ. Res. Lett. 2020, 15, 064007. [Google Scholar] [CrossRef]
- Moss, R.H.; Edmonds, J.A.; Hibbard, K.A.; Manning, M.R.; Rose, S.K.; Van Vuuren, D.P.; Carter, T.R.; Emori, S.; Kainuma, M.; Kram, T. The next generation of scenarios for climate change research and assessment. Nature 2010, 463, 747–756. [Google Scholar] [CrossRef]
- Van Vuuren, D.P.; Edmonds, J.; Kainuma, M.; Riahi, K.; Thomson, A.; Hibbard, K.; Hurtt, G.C.; Kram, T.; Krey, V.; Lamarque, J.F.; et al. The representative concentration pathways: An overview Clim. Change 2011, 109, 5–31. [Google Scholar] [CrossRef]
- Schwalma, C.; Spencer, G.; Philip, D. RCP8.5 tracks cumulative CO2 emissions. Proc. Natl. Acad. Sci. USA 2020, 117, 19656–19657. [Google Scholar] [CrossRef]
- Dosio, A.; Fischer, E.M. Will Half a Degree Make a Difference? Robust Projections of Indices of Mean and Extreme Climate in Europe Under 1.5°C, 2°C, and 3°C Global Warming. Geophys. Res. Lett. 2018, 45, 935–944. [Google Scholar] [CrossRef]
- DKRZ. Earth System Grid Federation (ESGF) Node at Deutsches Klimarechenzentrum (DKRZ). 2022. Available online: https://esgf-data.dkrz.de/projects/esgf-dkrz/ (accessed on 10 June 2021).
- Panitz, H.-J.; Dosio, A.; Büchner, M.; Lüthi, D.; Keuler, K. COSMO-CLM (CCLM) climate simulations over CORDEX-Africa domain: Analysis of the ERA-Interim driven simulations at 0.44° and 0.22° resolution. Clim. Dyn. 2014, 42, 3015–3038. [Google Scholar] [CrossRef]
- Remedio, A.R.; Teichmann, C.; Buntemeyer, L.; Sieck, K.; Weber, T.; Rechid, D.; Hoffmann, P.; Nam, C.; Kotova, L.; Jacob, D. Evaluation of New CORDEX Simulations Using an Updated Köppen–Trewartha Climate Classification. Atmosphere 2019, 10, 726. [Google Scholar] [CrossRef]
- Olusegun, C.F.; Awe, O.; Ijila, I.; Ajanaku, O.; Ogunjo, S. Evaluation of dry and wet spell events over West Africa using CORDEX-CORE regional climate models. Model. Earth Syst. Environ. 2022. [Google Scholar] [CrossRef]
- Sørland, S.L.; Brogli, R.; Pothapakula, P.K.; Russo, E.; Van de Walle, J.; Ahrens, B.; Anders, I.; Bucchignani, E.; Davin, E.L.; Demory, M.-E.; et al. COSMO-CLM regional climate simulations in the Coordinated Regional Climate Downscaling Experiment (CORDEX) framework: A review. Geosci. Model Dev. 2021, 14, 5125–5154. [Google Scholar] [CrossRef]
- Roeckner, E.; Arpe, K.; Bengtsson, L.; Christoph, M.; Claussen, M.; Duemenil, L.; Esch, M.; Giorgetta, M.; Schlese, U.; Schulzweida, U. The Atmospheric General Circulation Model ECHAM-4: Model Description and Simulation of Present-Day Climate. 1996. Available online: https://www.osti.gov/etdeweb/biblio/472992 (accessed on 20 July 2021).
- Collins, W.J.; Bellouin, N.; Doutriaux-Boucher, M.; Gedney, N.; Halloran, P.; Hinton, T.; Hughes, J.; Jones, C.D.; Joshi, M.; Liddicoat, S.; et al. Development and evaluation of an Earth-System model—HadGEM2. Geosci. Model Dev. 2011, 4, 1051–1075. [Google Scholar] [CrossRef]
- Doms, G.; Coauthors. A description of the nonhydrostatic regional COSMO model. Part II: Physical parameterization. COSMO Rep. LM_F90, 2011, 4.20, 154. Available online: http://www.cosmo-model.org/content/model/documentation/core/cosmoPhysParamtr.pdf (accessed on 18 August 2022).
- Baldauf, M.; Seifert, A.; Fo¨rstner, J.; Majewski, D.; Raschendorfer, M.; Reinhardt, T. Operational convective-scale numerical weather prediction with the COSMO model: Description and sensitivities. Mon. Wea. Rev. 2011, 139, 3887–3905. [Google Scholar] [CrossRef]
- Jacob, D. An inter-comparison of regional climate models for Europe: Design of the experiments and model performance. Clim. Chang. 2007, 81, 31–52. [Google Scholar] [CrossRef]
- Roeckner, E.; Brokopf, R.; Esch, M.; Giorgetta, M.A.; Hagemann, S.; Kornblueh, L.; Schulzweida, U. Sensitivity of simulated cli-mate to horizontal and vertical resolution in the ECHAM5 atmosphere model. J. Clim. 2006, 19, 3771–3791. [Google Scholar] [CrossRef]
- Giorgetta, M.A.; Jungclaus, J.; Reick, C.H.; Legutke, S.; Bader, J.; Böttinger, M.; Brovkin, V.; Crueger, T.; Esch, M.; Fieg, K.; et al. Climate and carbon cycle changes from 1850 to 2100 in MPI-ESM simulations for the Coupled Model Intercomparison Project phase 5. J. Adv. Model. Earth Syst. 2013, 5, 572–597. [Google Scholar] [CrossRef]
- Doms, G.; Förstner, J.; Heise, E.; Herzog, H.; Mironov, D.; Raschendorfer, M.; Reinhardt, T.; Ritter, B.; Schrodin, R.; Schulz, J.; et al. A description of the nonhydrostatic regional cosmo-model-part ii: Physical parameterizations; Deutscher Wetterdienst: Ofenbach, Germany, 2013; p. 15. [Google Scholar]
- Jacob, D.; Elizalde, A.; Haensler, A.; Hagemann, S.; Kumar, P.; Podzun, R.; Rechid, D.; Remedio, A.R.; Saeed, F.; Sieck, K.; et al. Assessing the Transferability of the Regional Climate Model REMO to Different Coordinated Regional Climate Downscaling Experiment (CORDEX) Regions. Atmosphere 2012, 3, 181–199. [Google Scholar] [CrossRef]
- Pang, G.; Wang, X.; Chen, D.; Yang, M.; Liu, L. Evaluation of a climate simulation over the Yellow River Basin based on a regional climate model (REMO) within the CORDEX. Atmospheric Res. 2021, 254, 105522. [Google Scholar] [CrossRef]
- Choi, G.; Collins, D.; Ren, G.; Trewin, B.; Baldi, M.; Fukuda, Y.; Afzaal, M.; Pianmana, T.; Gomboluudev, P.; Huong, P.T.T.; et al. Changes in means and extreme events of temperature and precipitation in the Asia-Pacific Network region, 1955–2007. Int. J. Clim. 2009, 29, 1906–1925. [Google Scholar] [CrossRef]
- Feyissa, G.; Zeleke, G.; Bewket, W.; Gebremariam, E. Downscaling of Future Temperature and Precipitation Extremes in Addis Ababa under Climate Change. Climate 2018, 6, 58. [Google Scholar] [CrossRef]
- Wily, R.L.; Dawson, C.W. SDSM4.2—A Decision Support Tool for the Assessment of Regional Climate Change Impacts. User Manual. 2007. Available online: https://sdsm.org.uk/software.html (accessed on 15 December 2021).
- Li, J.; Heap, A.D. Spatial interpolation methods applied in the environmental sciences: A review. Environ. Model. Softw. 2014, 53, 173–189. [Google Scholar] [CrossRef]
- Thiessen, A.H. Precipitation averages for large areas. Mon. Weather Rev. 1911, 39, 1082–1084. [Google Scholar] [CrossRef]
- Philip, S.; Kew, S.F.; van Oldenborgh, G.J.; Otto, F.; O’Keefe, S.; Haustein, K.; King, A.; Zegeye, A.; Eshetu, Z.; Hailemariam, K.; et al. Attribution Analysis of the Ethiopian Drought of 2015. J. Clim. 2018, 31, 2465–2486. [Google Scholar] [CrossRef]
- Valéry, A.; Andréassian, V.; Perrin, C. Regionalization of precipitation and air temperature over high-altitude catchments-learning from outliers. Hydrol. Sci. J. 2010, 55, 928–940. [Google Scholar] [CrossRef]
- Stockdale, T.N.; Anderson, D.L.T.; Balmaseda, M.A.; Doblas-Reyes, F.; Ferranti, L.; Mogensen, K.; Palmer, T.N.; Molteni, F.; Vitart, F. ECMWF seasonal forecast system 3 and its prediction of sea surface temperature. Clim. Dyn. 2011, 37, 455–471. [Google Scholar] [CrossRef]
- Moriasi, D.N.; Arnold, J.G.; van Liew, M.W.; Bingner, R.L.; Harmel, R.D.; Veith, T.L. Model evaluation guidelines for systematic quantification of accuracy in watershed simulations. Trans. ASABE 2007, 50, 885–900. [Google Scholar] [CrossRef]
- Santhi, C.; Arnold, J.G.; Williams, J.R.; Dugas, W.A.; Srinivasan, R.; Hauck, L.M. Validation of the SWAT model on a large river basin with point and nonpoint sources. J. Am. Water Resour. Assoc. 2001, 37, 1169–1188. [Google Scholar] [CrossRef]
- Menna, B.Y. Simulation of Hydro Climatological Impacts Caused by Climate Change: The Case of Hare Watershed, Southern Rift Valley of Ethiopia. J. Waste Water Treat. Anal. 2017, 8, 276. [Google Scholar] [CrossRef]
- Yekambessoun, N.M.; Agnide, E.L.; Ganiyu, T.O.; Benjamin, K.Y.; Abel, A.A. Comparison of Daily Precipitation Bias Correction Methods Based on Four Regional Climate Model Outputs in Oueme Basin, Benin. Hydrology. 2016, 4, 58–71. [Google Scholar]
- Kahsay, D.K.; Santosh, M.P.; Samuel, D.H. Impact of climate change on groundwater recharge and base flow in the sub catchment of Tekeze basin. Ethiop. Groundw. Sustain. Dev. 2018, 6, 121–133. [Google Scholar] [CrossRef]
- Bichet, A.; Diedhiou, A.; Hingray, B.; Evin, G.; Touré, N.; Browne, K.N.A.; Kouadio, K. Assessing uncertainties in the regional projections of precipitation in CORDEX-AFRICA. Clim. Chang. 2020, 162, 583–601. [Google Scholar] [CrossRef]
- Korecha, D.; Barnston, A.G. Predictability of June–September Rainfall in Ethiopia. Mon. Weather Rev. 2007, 135, 628–650. [Google Scholar] [CrossRef]
- Williams, A.P.; Funk, C.; Michaelsen, J.; Rauscher, S.A.; Robertson, I.; Wils, T.H.G.; Koprowski, M.; Eshetu, Z.; Loader, N.J. Recent summer precipitation trends in the greater horn of Africa and the emerging role of Indian Ocean Sea surface temperature. Clim Dyn. 2012, 39, 2307–2328. [Google Scholar] [CrossRef]
- Seleshi, Y.; Zanke, U. Recent changes in rainfall and rainy days in Ethiopia. Int. J. Clim. 2004, 24, 973–983. [Google Scholar] [CrossRef]
- Kisembe, J.; Favre, A.; Dosio, A.; Lennard, C.; Sabiiti, G.; Nimusiima, A. Evaluation of rainfall simulations over Uganda in CORDEX regional climate models. Arch. Meteorol. Geophys. Bioclimatol. Ser. B 2018, 137, 1117–1134. [Google Scholar] [CrossRef]
- Feyisa, G.L.; Dons, K.; Meilby, H. Efficiency of parks in mitigating urban heat island effect: An example from Addis Ababa. Landsc. Urban Plan. 2014, 123, 87–95. [Google Scholar] [CrossRef]
- Bambrick, H.; Moncada, S.; Briguglio, M. Climate change and health vulnerability in informal urban settlements in the Ethiopian Rift Valley. Environ. Res. Lett. 2015, 10, 054014. [Google Scholar] [CrossRef]
- Niang, I.; Ruppel, O.C.; Abdrabo, M.A.; Essel, A.; Lennard, C.; Padgham, J.; Urquhart, P. Climate Change 2014: Impacts, Adaptation, and Vulnerability. In Part B: Regional Aspects. Contribution of Working Group II to the Fifth Assessment Report of the Intergovernmental Panel on Climate Change; Barros, V.R., Field, C.B., Dokken, D.J., Mastrandrea, M.D., Mach, K.J., Bilir, T.E., Chatterjee, M., Ebi, K.L., Estrada, Y.O., Genova, R.C., et al., Eds.; Cambridge University Press: Cambridge, UK, 2014; pp. 1199–1265. [Google Scholar]
- Sylla, M.B.; Nikiema, P.M.; Gibba, P.; Kebe, I.; Klutse, N.A.B. Climate change over West Africa: Recent trends and future projections. In Adaptation to Climate Change and Variability in Rural West Africa; Yaro, J.A., Hesselberg, J., Eds.; Springer International Publishing: Basel, Switzerland, 2016; pp. 25–40. [Google Scholar]
- Todzo, S.; Bichet, A.; Diedhiou, A. Intensification of the hydrological cycle expected in West Africa over the 21st century. Earth Syst. Dyn. 2020, 11, 319–328. [Google Scholar] [CrossRef]
- Argüeso, D.; Evans, J.; Fita, L.; Bormann, K.J. Temperature response to future urbanization and climate change. Clim. Dyn. 2013, 42, 2183–2199. [Google Scholar] [CrossRef]
- Kusaka, H.; Hara, M.; Takane, Y. Urban Climate Projection by the WRF Model at 3-km Horizontal Grid Increment: Dynamical Downscaling and Predicting Heat Stress in the 2070′s August for Tokyo, Osaka, and Nagoya Metropolises. J. Meteorol. Soc. Jpn. Ser. II 2012, 90B, 47–63. [Google Scholar] [CrossRef]
- Suzuki-Parker, A.; Kusaka, H.; Takayabu, I.; Dairaku, K.; Ishizaki, N.; Ham, S. Contributions of GCM/RCM Uncertainty in Ensemble Dynamical Downscaling for Precipitation in East Asian Summer Monsoon Season. SOLA 2018, 14, 97–104. [Google Scholar] [CrossRef]
- Takane, Y.; Ohashi, Y.; Grimmond, C.S.B.; Hara, M.; Kikegawa, Y. Asian megacity heat stress under future climate scenarios: Impact of air-conditioning feedback. Environ. Res. Commun. 2020, 2, 015004. [Google Scholar] [CrossRef]
- Georgescu, M. Challenges Associated with Adaptation to Future Urban Expansion. J. Clim. 2015, 28, 2544–2563. [Google Scholar] [CrossRef]
- Doan, V.Q.; Kusaka, H. Projections of urban climate in the 2050s in a fast-growing city in Southeast Asia: The greater Ho Chi Minh City metropolitan area, Vietnam. Int. J. Clim. 2018, 38, 4155–4171. [Google Scholar] [CrossRef]
- Oleson, K. Contrasts between Urban and Rural Climate in CCSM4 CMIP5 Climate Change Scenarios. J. Clim. 2012, 25, 1390–1412. [Google Scholar] [CrossRef]
- Tegegne, G.; Melesse, A.M.; Alamirew, T. Projected changes in extreme precipitation indices from CORDEX simulations over Ethiopia, East Africa. Atmospheric Res. 2020, 247, 105156. [Google Scholar] [CrossRef]
- Teferi, E.; Abraha, H. Urban heat island effect of Addis Ababa City: Implications of urban green spaces for climate change adaptation. In Climate Change Adaptation in Africa, Climate Change Management; Filho, W.L., Belay, S., Kalangu, J., Menas, W., Munishi, P., Musiyiwa, K., Eds.; Springer: New York, NY, USA, 2017. [Google Scholar]
- Abebe, M.; Megento, T. The city of Addis Ababa from ‘Forest City’ to ‘Urban Heat Island’. Assessment of urban green space dynamic. J. Urban Environ. Eng. 2016, 10, 254–262. [Google Scholar] [CrossRef]
Publisher’s Note: MDPI stays neutral with regard to jurisdictional claims in published maps and institutional affiliations. |
© 2022 by the authors. Licensee MDPI, Basel, Switzerland. This article is an open access article distributed under the terms and conditions of the Creative Commons Attribution (CC BY) license (https://creativecommons.org/licenses/by/4.0/).