Abstract
We propose a simple and reproducible methodology to create a single equation forecasting model (SEFM) for low-frequency macroeconomic variables. Our methodology is illustrated by forecasting annual real GDP growth rates for 52 African countries, where the data are obtained from the World Bank and start in 1960. The models include lagged growth rates of other countries, as well as a cointegration relationship to capture potential common stochastic trends. With a few selection steps, our methodology quickly arrives at a reasonably small forecasting model per country. Compared with benchmark models, the single equation forecasting models seem to perform quite well.
1. Introduction
This paper deals with forecasting low-frequency macroeconomic variables, when data are available for a reasonably large number of countries or states. As many macroeconomic variables have a stochastic trend, the forecasting methodology also addresses potentially common stochastic trends. In this paper the particular focus is on forecasting annual real GDP (Gross Domestic Product) growth rates in Africa.
The data that we analyze in this paper concern annual real GDP figures, for 52 countries in Africa, where these are all indexed at 100 in 1960, and where the sample ends in 2016. These data will be transformed to growth rates, and the levels will be included in cointegration relations. Figure 1 gives a first impression of the levels of the data at hand1. We will create models for 1960–2010, and we will use 2011 up to and including 2016 to evaluate the accuracy of recursively created one-year-ahead forecasts for the growth rates.
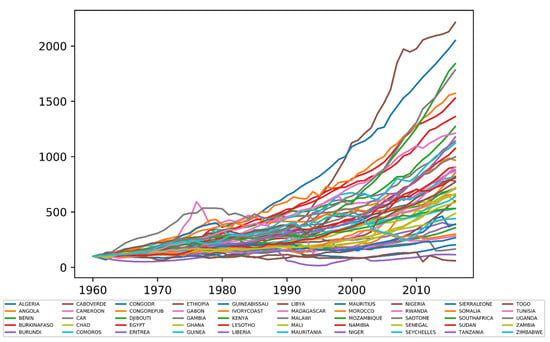
Figure 1.
Levels of real GDP in 50 countries in Africa 1960–2016 (where Equatorial Guinea and Botswana are excluded due to very high growth rates), indexed at 1960 = 100. The data are obtained from Franses and Vasilev (2019). These authors used imputation techniques to create a complete data set.
The question that we address is whether it helps to include information from other countries to predict real GDP growth for a focus country. Such information can concern the past growth rates of each of these countries and a cointegration relationship. This last feature puts a challenge on the methodology as it shall not be feasible to consider a 52-variable vector autoregression due to the large number of parameters to be estimated, even already for a first-order vector autoregression.
One way to move forward could be to allocate countries into clusters, prior to any cointegration analysis, but it is unclear how such clusters should be created. Even neighboring countries in Africa can have very different economies, governments, infrastructures, resources, cultures, and colonial history, to mention just a few. At the same time, countries that are located at very different locations on the continent can still have similar properties and may, for example, similarly respond to local or worldwide economic shocks. In sum, it seems hazardous to put zeroes in heavily parameterized models from the onset. So, we consider all countries on the African continent, as it may be that groups of countries (in different constellations) may be expected to respond similarly to worldwide economic shocks, to changes in production, to weather conditions, and to political conditions.
In this paper we propose a simple and reproducible econometric methodology that allows the creation of forecasting models for real GDP growth for each of the 52 countries, while taking aboard potential cointegration relations between countries, and while including lagged growth rates of other countries. The methodology is based on a series of partial analyses2, and this immediately suggests the weaker part of the proposed methodology. Yet, at the same time, as decisions in our analyses are all driven by verifiable criteria, and can be set by the researcher to see if different results could emerge when different choices are made, we believe that our methodology allows for sensible flexibility, while it remains easy to use and it relies only on standard econometric methods. Section 2 below will provide all the details of the methodology. The result for each country is what can be called a single equation forecasting model (SEFM), which can include a cointegration relationship with other countries, and which includes one-year-lagged growth rates of a selected set of other countries. A byproduct of our models, in contrast with many machine learning methods, is that we can construct one-step-ahead prediction intervals.
The paper continues as follows. Section 2 deals with the way to arrive at a single equation forecasting model. We show that just a few criteria need to be set, and we only use formal statistical tests to reduce the number of parameters in the final stage. Before that stage, all steps can be automated. Section 3 starts with a detailed illustration for one country, in this case the real GDP growth rates of Botswana, and after that, all other countries on the African continent will be considered. We first analyze forecast accuracy before we present estimation results. For illustration, we use a moving average model of order 1 for the growth rates as a benchmark model, as this extends the usually considered random walk by allowing past forecast errors to have a correcting impact on forecasts3. As an example, we find that, roughly speaking, our single equation forecasting models substantially improve on the MA(1) model in close to about half of the cases. Alternative forecasting benchmarks give qualitatively similar results. Next, we present tables with results on cointegration and short-run effects, and as such, we learn that there could be some clusters of countries with similar behavior, while there are also countries with evident idiosyncratic economic growth (such as Nigeria and South Africa). Section 4 deals with simulations to see if our empirical findings are significant in general4. Our paper then concludes with a discussion of the limitations and some avenues for further research.
2. Methodology
This section deals with the methodology that we will follow to create forecasts. The basic premise is that we have data for T years and I countries (or states in other applications), where both T and I are about equally large like 50 or 100 but not much more. A similar setting is considered in Kim and Swanson (2018)5, who use modern methods such as parsimonious factor models, machine learning, variable selection, and shrinkage methods. At the same time, they do not consider common stochastic trends, and that is what we will also do below.
We make a few assumptions. In the single equation forecasting models, we allow for one-period lags of the growth rates of all other countries, and we use a simple and partial preselection method to see which variables to include in the models. At the same time, we allow in each equation a single cointegration variable. There seems to be no reason to include more than one cointegration variable as we, each time, are looking at a single variable to be predicted. Moreover, a system of 52 equations for growth rates can have 51 cointegration relations at the maximum, and hence allowing for more than one per country can cause inference problems.
The initial data concern:
where “log” is the natural logarithm, for countries (where we shall consider 52 countries in our study) and years (where we have data for the years 1960 up to and including 2016). We are interested in forecasting the growth rates, that is,
Our model will include the lags of growth rates of the focus country and of other countries, as well as a cointegration relation amongst the levels .
A single equation forecasting model (SEFM) for country i will look like:
where is a standard white noise process with mean 0 and variance . We assume that the error terms are uncorrelated across equations6.
The term:
reflects the contribution of the one-period lagged growth rates of all countries (also including the lag of the focal country’s growth rate). The term:
reflects the error correction variable (cointegration relation) with its adjustment parameter . Note that this variable can be different for each country. When it is assumed that the error correction variable is stationary indeed, its statistical significance can be checked by a standard t-test on the parameter ; see Boswijk (1994).
Per equation, there are potentially parameters. Given the sample size, straightforward OLS (Ordinary Least Squares) or NLS (Nonlinear Least Squares) per country, while including all regressors, is not possible. Therefore, we introduce a few selection steps that should reduce the number of variables.
- Step 1:
Run OLS regressions of the type
for . Compute for the estimated residuals the CRDW (Cointegration Regression Durbin Watson) test statistic as:
where is the estimated first-order autocorrelation of . When , we keep the regressor for the next round. Thus, the first selection parameter in our methodology is . We can set it at 0.4 or 0.5 at our own choice. Formal critical values appear in Sargan and Bhargava (1983), and depending on the size of the regression model, these range from 0.4 to 0.7.
- Step 2:
For all retained variables from step 1, also including , we run the Johansen (1991) cointegration estimation method for the levels of the log GDP data, and retain the first estimated cointegration relationship for the single equation forecasting model. There is no need to check its statistical significance at this stage. If the estimated potential cointegration variable is not stationary, the final t-test on in (1) will not reject the associated null hypothesis.
- Step 3:
Compute all pairwise correlations between and for .
Rank the countries with the positive correlations from high to low, and with the negative correlations from (absolute) high to low.
- Step 4:
To further reduce the number of parameters, impose two sets of restrictions, one for the positive correlated variables in step 3 (hence the growth rates) and one for the negatively correlated variables (again for the growth rates), as follows:
which mimics a geometric decay pattern. We can have a for the positive correlations and a for the negative correlations, and there is an associated and an . The threshold can be and for positive and negative correlations, respectively. These are two more selection parameters.
In sum, our methodology involves three selection parameters, that is, , and , and these need to be set by the researcher. Finally, the parameters in the single equation forecasting model (1) can be estimated using NLS (Nonlinear Least Squares). Using t-tests on and and , one can further reduce the number of parameters7. In case is not significant, and hence no significant cointegration is found, the parameters in the restricted version of (1) will be estimated using OLS. If no variables are retained from step 1, we set in (1). In a few cases where NLS does not converge, the cointegration relation found in step 2 will be fixed, and the parameters will be estimated using OLS. A technical appendix which illustrates the methodology can be found in the online appendix.
3. Forecasting GDP Growth in Africa
In this section we first illustrate our methodology in detail for Botswana, and after that we consider all countries at the same time. The estimation sample runs from 1960 to 2010 for all countries, and the forecast evaluation sample is 2011 to 2016.
3.1. Botswana
We choose to use in our analysis that for the CRDW. For Botswana, this means that the countries that are to be retained are Algeria and Central African Republic (CAR)8. The Johansen estimation method gives as the first cointegrating variable (for 1960–2010):
log(Botswana) − 1.253 log(Algeria) − 2.177 log(CAR).
A graph of this variable is presented in Figure 2.
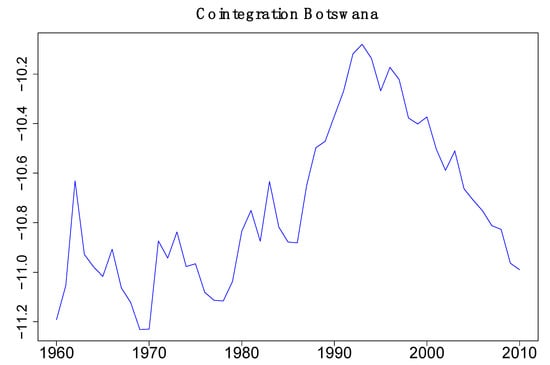
Figure 2.
Cointegration relationship between log(GDP) of Botswana, Algeria, and CAR (1960–2010).
Furthermore, when we adopt that (which we will do throughout this paper9), the top three positive correlations between (Botswana) and are Zimbabwe (0.493), Kenya (0.382), and Mauritius (0.337), and the top three negative correlations concern Benin ), Burkina Faso ), and Ethiopia ).
Application of NLS to the initial version of the single equation forecasting model for Botswana gives the following estimation results (with estimated standard errors in parentheses):
Setting the insignificant parameter equal to zero results in
The significance of the error correction variable is based on the significance of , and hence, the model is not reduced any further. The adjusted of this model with 7 parameters for 49 effective observations (estimation sample ends in 2010) is 0.698.
When this model is recursively estimated for samples 1960–2010 to 1960–2015, we can create six one-year-ahead forecasts for the years 2011 to 2016. The ME (mean error) of these forecasts is and the MAE (mean absolute error) is 6.1.
When we estimate an MA(1) model for GDP growth in Botswana for 1960–2010, that is:
where is the error term and the intercept, the is estimated as 0.540 with standard error 0.104, and an adjusted of 0.276. Again, six recursively created one-year-ahead forecasts can be created. The mean error of these forecasts for this case of Botswana is while the mean absolute error is 3.92. Hence, in terms of both the mean error and the mean absolute error, the MA(1) model gives more accurate forecasts than the single equation forecasting model. Formal testing is not reliable here, due to the small number of forecasts.
3.2. 52 Countries in Africa
An overview of how the single equation forecasting model performs is provided in Table 1, where we present the results after applying our methodology outlined in Section 2 to the growth rates of 52 African countries, where we choose , and . Table 1 presents for 52 countries how the parameters in each model were estimated (NLS or OLS), and the ME, MAE and RMSE (Root Mean Squared Errors of the forecasts) of the final single equation forecasting models and those of the MA(1). A boldface number marks the cases where the ME of the single equation forecasting model is closer to 0 (in an absolute sense) and where the MAE and RMSE are closer to 0 for that model10. We see that in 29 of the 52 cases the ME of the single equation forecasting model is closer to 0 than that of the benchmark. For the MAE and RMSE this holds for 16 of the 52 cases. So, even though the MA(1) model is often found hard to beat, we see that it can be beaten in a substantial number of cases, also with larger numerical differences between the accuracy measures.

Table 1.
Forecast performance comparison of single equation forecasting models (SEFM) with MA(1) models. A boldface number means that for the SEFM the MA (or MAE or RMSE) is closer to 0 than for the MA(1) model. In the column “Estimation”, “NLS” means that classical NLS estimation was applied. “OLS” means that OLS estimation without the nonlinear terms was applied, which is applicable in cases where the NLS estimation did not converge. “NLS w/o” means that NLS estimation was applied, but without the variables pertaining to cointegration relationships, which is applicable if no cointegration relationships were found. For each model we created six one-step-ahead forecasts, using the periods (1960–2010) to (1960–2015) to forecast the years 2011 to 2016, respectively.
We also compare our forecasts with those of an AR(1) model, a no-change forecast, and forecasts from a Principal Component Regression including only the lagged growth rates, where we include the first 10 estimated principal components. In terms of RMSE, our models give more accurate forecasts than an AR(1) in 13 of the 52 cases, while the no-change forecast is beaten for all 52 cases. In 26 of the 52 cases our forecasts improve on those of a Principal Component Regression.
Figure 3 presents a histogram of the adjusted values of the models with estimation sample 1960 to 2015, and we find that the mean is 0.353, that the maximum is 0.710 (Rwanda), and the minimum is 0.039 (Somalia). Figure 4 presents a histogram of the mean errors (each time, the mean of the six one-year-ahead forecast errors), and there we find that the average mean error is , where for some countries the mean error is very large (−8.39 for Equatorial Guinea, and 7.36 for Ivory Coast). Figure 5 illustrates a histogram of the mean absolute errors. Note that this histogram was created without Libya, as for this country the one-step-ahead forecasts are very poor (MAE of 43.63). The average of the mean absolute errors (excluding Libya) amounts to 3.62, which is relatively larger than what is typically found for OECD countries (usually within the range of 1 to 2). For the RMSE the results are qualitatively similar.
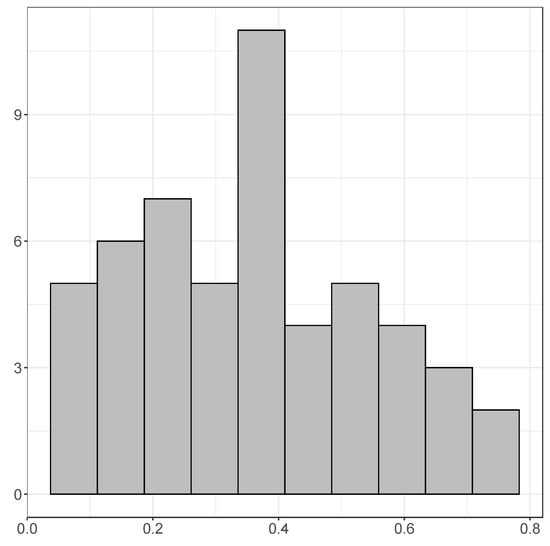
Figure 3.
The adjusted values of the single equation forecasting models with estimation sample 1960 to 2015.
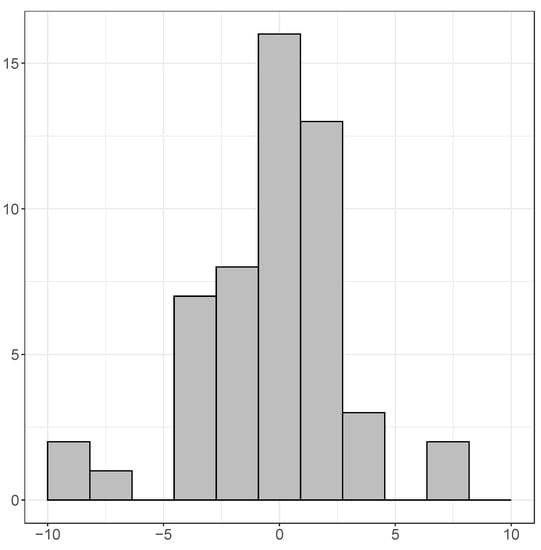
Figure 4.
The mean forecast errors of the single equation forecasting models.
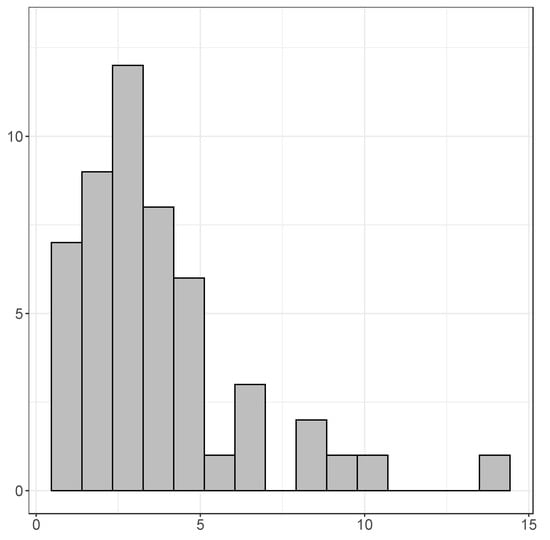
Figure 5.
The mean absolute forecast errors of the single equation forecasting models (Libya not included).
A last conclusion from Table 1 is that for the single equation forecasting models it occurred four times that all six forecasts were too high, whereas there are three cases for which all forecasts were too low. These numbers become seven and six for the MA(1) model, and hence in that respect also the single equation forecasting models seem to do quite well.
Table 2 presents the obtained cointegration relations. The left-hand column is the focal country, and to the right we report all other countries which appear in the cointegration relation:

Table 2.
Cointegration relationships of each “Home” country. An NA denotes the situation where the home country does not have cointegration relationships with other countries. The following abbreviations are used: CAR = Central African Republic, CONGODR = Democratic Republic of the Congo, CONGOREPUB = Republic of the Congo, EQGUINEA = Equatorial Guinea.
Figure 6 presents a histogram of how often a country appears in such long-term relations. The maximum is obtained for the Central African Republic, which appears 38 times in a cointegrating relation. The minimum value of 0 is obtained for Democratic Republic of the Congo, Ethiopia, Liberia, Libya, Sao Tome and Principe, and Zimbabwe. These six countries apparently do not share a stochastic trend with any of the countries on the African continent.
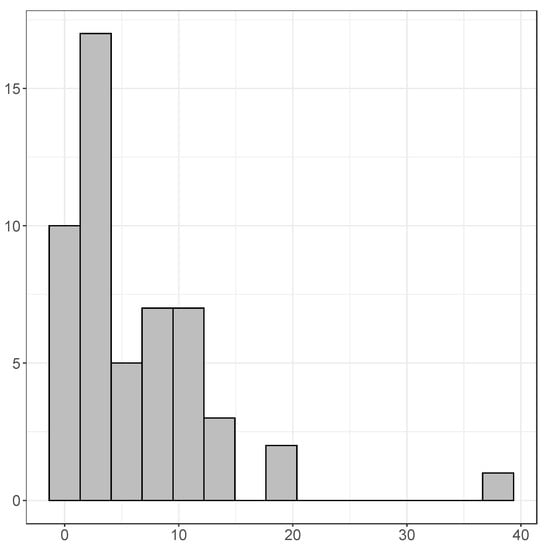
Figure 6.
How often does a country appear in a cointegration relation? (51 is the maximum).
Furthermore, there are six countries in Table 2 which do not have a cointegration relation with other countries that can be meaningfully exploited for out-of-sample forecasting: these are CAR, Democratic Republic of the Congo, Equatorial Guinea, Ethiopia, Liberia, and Zimbabwe. For various reasons one might believe that these countries, at least many of them, behave in an idiosyncratic manner. For example, Zimbabwe entered standalone recessions, like CAR, while Equatorial Guinea witnessed huge growth. The same holds for Table 3, which reports the short-run effects of lagged growth rates, for which there are also three countries which do not appear as explanatory variables.

Table 3.
Strongest three autocorrelations of each “Home” country, as computed in step 3 of Section 2. These are the short-run relations that indicate which one-year-lagged growth rates have predictive value for the growth rates of the home country. The following abbreviations are used: CAR = Central African Republic, CONGODR = Democratic Republic of the Congo, CONGOREPUB = Republic of the Congo, EQGUINEA = Equatorial Guinea.
Finally, Figure 7 presents how often a one-year-lagged country’s growth rate appears as a useful predictor for other countries. That is, how often was the country among the three strongest positive or negative autocorrelations with other countries, as computed in step 3 of Section 2. With 15 such appearances, Botswana is the frontrunner. There is no country that never appears as a predictor, but there are three countries that only appear once, and these are Libya, Namibia, and Nigeria. The Central African Republic appears only twice. Since the Central African Republic was most often in a cointegration relationship, this indicates that this country’s predictive power is contained in the cointegration relationships rather than in the autocorrelations.
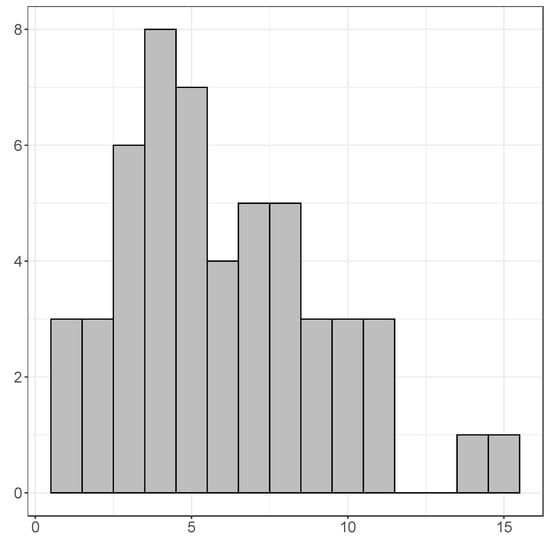
Figure 7.
How often does a country’s growth rate appear as a useful predictor? That is, how often was a country among the three strongest positive or negative autocorrelations with other countries?
Yet, from an alternative perspective, the results in Figure 6 and Figure 7 show that the countries in Africa do have various ties, which can be meaningfully exploited in forecasting models. These ties can be explained by closeness of the countries, similar economies, similar populations, similar links with non-African countries, and perhaps many other reasons.
4. A Simulation Study
To examine if our empirical results have any meaningful significance, we run some simulation experiments. We create 50 different time series of length 100 as:
with , , with , and where is a draw from a continuous uniform distribution with the range 1 to 2. Hence, the DGP (Data Generating Process) amounts to independent random walks. We split the sample into and with .
For each series i we run 49 OLS regressions for . We compute the residuals and create the CRDW (Cointegration Regression Durbin Watson) test statistic as , where is the estimated first-order autocorrelation of . When , the regressor is kept for the next round. We choose and . Next, for all retained variables, also including , we run the Johansen (1991) cointegration estimation method and retain the first estimated cointegration relationship for the single equation forecasting model. We compute all pairwise correlations between and for . We rank the series with the positive correlations from high to low, and with the negative correlations from (absolute) high to low. To further reduce the number of parameters, we impose two sets of restrictions as in step 4 before. We choose and equal to 3. Finally, we estimate:
using NLS. We also estimate the MA(1) model . We create for these models, recursively, one-step-ahead forecasts for each , and compute the RMSE (Root Mean Squared Error) of the forecasts. This is repeated 25 times.
The key results are presented in Table 4. From this table we can see that in case the SEFM methodology results in spuriously relevant models, these models give about equally accurate forecasts as the MA(1) model. Moreover, the average RMSPE is about equal. This provides further substantiation to our results in Table 1, where the differences between the two models can be large and relevant.

Table 4.
Results from simulation experiments. The number of replications is 25.
5. Conclusions
We have proposed a simple and reproducible methodology to create single equation forecasting models for low-frequency macroeconomic variables. Our methodology was illustrated for forecasting annual real GDP growth rates for 52 African countries. The models (potentially) included lagged growth rates of all countries, as well as a single cointegration relationship to capture potential common stochastic trends. With a few selection steps, our methodology quickly arrived at a reasonably small forecasting model. Compared with simple benchmark models, the single equation forecasting models seem to perform quite well.
A limitation of our methodology is of course that we must make decisions each time based on a partial analysis, that is, one variable with another. The partial analysis does not involve any statistical testing, so there is no multiple testing problem. A partial analysis could lead to incorrect inclusion of variables or an incorrect neglect of variables. The final model is analyzed using the familiar t-tests. One way or the other, one would have to decide which countries are associated more with each other than other countries, and that does not seem to be a simple task. Perhaps machine learning methods or shrinkage methods can become useful here; see Koo et al. (2020). More experience with our methodology should tell how useful it is.
Another limitation is that we assumed a diagonal covariance matrix for the errors. For our illustration this seemed reasonable, but for other applications one may wish to include cross-equation error dependence. A modification of our methodology to include such dependencies will be considered as interesting further work.
Finally, we believe that an exercise in searching for those values of , and which minimize a certain criterion can be interesting. One could create a hold-out sample, for example, 2000–2010, fit the models for data up to 1999, and select the , and which minimize, for example, the mean absolute error. It is however not guaranteed that the resulting “optimal” , and also provide the most accurate forecasts for the true out-of-sample data. Of course, other choices of , and can lead to other forecast outcomes, but this was not the main intention of our paper. We wanted to introduce a simple and reproducible modeling strategy, which contrasts with many currently used machine learning methods which need tuning of hyperparameters and involve all kinds of other choices, which, in our experience, make empirical results difficult to replicate. In our future research we will work more on this issue and will think of optimization strategies for finding appropriate values of , and .
Author Contributions
Conceptualization, P.H.F. and M.W.; methodology, P.H.F.; software, M.W.; validation, P.H.F. and M.W.; formal analysis, P.H.F. and M.W.; investigation, P.H.F. and M.W.; resources, P.H.F.; data curation, P.H.F.; writing—original draft preparation, P.H.F. and M.W.; writing—review and editing, P.H.F.; visualization, P.H.F. and M.W.; supervision, P.H.F.; project administration, P.H.F. and M.W. All authors have read and agreed to the published version of the manuscript.
Funding
This research received no external funding.
Institutional Review Board Statement
Not applicable.
Informed Consent Statement
Not applicable.
Data Availability Statement
Not applicable.
Acknowledgments
We thank Peter Boswijk for helpful conversations, Eva van Rooijen for her help with the simulations, and two anonymous reviewers for their helpful suggestions.
Conflicts of Interest
The authors declare no conflict of interest.
Notes
| 1 | We are aware of the literature on the potential problems with macroeconomic data for Africa; see for example Jerven (2013). However, the data that we use are publicly available through the World Bank and for most countries start in 1960. For some series we have imputed missing values using regression models, including a range of available explanatory variables. |
| 2 | In a sense, our approach bears similarities with a recent pairwise-based approach to model a macroeconomic variable that is the weighted average of many components, see Carlomagno and Espasa (2021). |
| 3 | The IMA(1,1) model for the levels of the data is recommended as a benchmark in Franses (2020). It is of course not certain that this univariate model fits the data best, and hence also alternative univariate benchmark models are considered. Given the data at hand, it is difficult to propose a multivariate benchmark model, although we do consider a Principal Components Regression for the growth rates. |
| 4 | In an online appendix, all results and the complete code that was used to write this paper are publicly available on https://github.com/mwelz/sefm-africa. |
| 5 | Their methods build on those proposed in Bai and Ng (2002) and Stock and Watson (2002), using modern tools like Lasso and Elastic Net to reduce the number of parameters. |
| 6 | In further research, one could think of allowing non-zero correlations where perhaps cluster techniques can be used on the estimated residuals to put zeroes in the large covariance matrix. For the particular illustration in the present paper, we estimated 52 × 51 divided by 2 is 1326 cross-equation correlations and these are almost all in between −0.2 and 0.2. Given the large diversity across the African countries, this comes as no surprise. Our model bears similarities with the autoregressive distributed lag model in Pesaran et al. (2001). |
| 7 | Note that the and parameters are not identified under the null hypothesis that . |
| 8 | If we would have used , there would not have been a cointegration relation, and if we would have chosen , more variables would have been included in the cointegration relation. |
| 9 | As mentioned, various other decisions can be made, and these may have an impact on forecast quality. It is not our intention in this paper to look for configurations that yield the highest forecast accuracy, although there may be search routines that can do that. |
| 10 | For 17 countries we have imputed data. The average MAE for these countries is 5.391, while the average MAE of all countries is 4.388. Hence, the differences are not substantial. A regression of MAE on a constant and a dummy for missingness of data give an estimate of 1.534 with a standard error of 1.784. Hence, we conclude that there are no significant differences in MAE. |
References
- Bai, Jushan, and Serena Ng. 2002. Determining the number of factors in approximate factor models. Econometrica 70: 191–221. [Google Scholar] [CrossRef] [Green Version]
- Boswijk, H. Peter. 1994. Testing for an unstable root in conditional and structural error correction models. Journal of Econometrics 63: 37–60. [Google Scholar] [CrossRef]
- Carlomagno, Guillerma, and Antonio Espasa. 2021. Discovering specific common trends in a large set of disaggregates: Statistical procedures, their properties and an empirical application. Oxford Bulletin of Economics & Statistics. in print. Available online: https://onlinelibrary.wiley.com/doi/epdf/10.1111/obes.12412 (accessed on 20 August 2021).
- Franses, Philip Hans. 2020. IMA(1,1) as a new benchmark for forecast evaluation. Applied Economics Letters 27: 1419–23. [Google Scholar] [CrossRef] [Green Version]
- Franses, Philip Hans, and Simeon Vasilev. 2019. Real GDP Growth in Africa, 1963–2016. Econometric Institute Report EI2019-23. Rotterdam: Erasmus School of Economics. [Google Scholar]
- Jerven, Morten. 2013. Poor Numbers: How We are Misled by African Development Statistics and What to Do about It. Ithaca: Cornell University Press. [Google Scholar]
- Johansen, Soren. 1991. Estimation and hypothesis testing of cointegration vectors in Gaussian vector autoregressive models. Econometrica 59: 1551–80. [Google Scholar] [CrossRef]
- Kim, Hyun Hak, and Norman R. Swanson. 2018. Mining big data using parsimonious factor, machine learning, variable selection and shrinkage methods. International Journal of Forecasting 34: 339–54. [Google Scholar] [CrossRef]
- Koo, Bonsoo, Heather Anderson, Myung Hwan Seo, and Wenying Yao. 2020. High-dimensional predictive regression in the presence of cointegration. Journal of Econometrics 219: 456–77. [Google Scholar] [CrossRef]
- Pesaran, M. Hashem, Yongcheol Shin, and Richard J. Smith. 2001. Bounds testing approaches to the analysis of level relationships. Journal of Applied Econometrics 16: 289–326. [Google Scholar] [CrossRef]
- Sargan, J. Dennis, and Alok Bhargava. 1983. Testing residuals from least squares regression for being generated by the Gaussian random walk. Econometrica 51: 153–74. [Google Scholar] [CrossRef]
- Stock, James H., and Mark W. Watson. 2002. Forecasting using principal components from a large number of predictors. Journal of the American Statistical Association 97: 1167–79. [Google Scholar] [CrossRef] [Green Version]
Publisher’s Note: MDPI stays neutral with regard to jurisdictional claims in published maps and institutional affiliations. |
© 2022 by the authors. Licensee MDPI, Basel, Switzerland. This article is an open access article distributed under the terms and conditions of the Creative Commons Attribution (CC BY) license (https://creativecommons.org/licenses/by/4.0/).