Article

Population Genetics of Odontarrhena (Brassicaceae) from Albania: The Effects of Anthropic Habitat Disturbance, Soil, and Altitude on a Ni-Hyperaccumulator Plant Group from a Major Serpentine Hotspot

1
Department of Biology, University of Firenze, 50121 Firenze, Italy
2
Centre for Mined Land Rehabilitation, Sustainable Minerals Institute, The University of Queensland, Brisbane QLD 4072, Australia
3
Laboratoire Sols et Environnement, Université de Lorraine/INRA, F-54000 Vandoeuvre-lès-Nancy, France
4
Department of Biomedical Experimental and Clinical Sciences, University of Firenze, 50121 Firenze, Italy
5
Department of Agriculture, Food, Environment and Forestry, Laboratories of Botany, 50121 Firenze, Italy
*
Authors to whom correspondence should be addressed.
Plants 2020, 9(12), 1686; https://doi.org/10.3390/plants9121686
Submission received: 1 November 2020 / Revised: 25 November 2020 / Accepted: 27 November 2020 / Published: 1 December 2020
(This article belongs to the Special Issue Metallophytes)

Abstract

:
Albanian taxa and populations of the genus Odontarrhena are most promising candidates for research on metal tolerance and Ni-agromining, but their genetic structure remains unknown. We investigated phylogenetic relationships and genetic differentiation in relation to distribution and ploidy of the taxa, anthropic site disturbance, elevation, soil type, and trace metals at each population site. After performing DNA sequencing of selected accessions, we applied DNA-fingerprinting to analyze the genetic structure of 32 populations from ultramafic and non-ultramafic outcrops across Albania. Low sequence divergence resulted in poorly resolved phylograms, but supported affinity between the two diploid serpentine endemics O. moravensis and O. rigida. Analysis of molecular variance (AMOVA) revealed significant population differentiation, but no isolation by distance. Among-population variation was higher in polyploids than in diploids, in which genetic distances were lower. Genetic admixing at population and individual level occurred especially in the polyploids O. chalcidica, O. decipiens, and O. smolikana. Admixing increased with site disturbance. Outlier loci were higher in serpentine populations but decreased along altitude with lower drought and heat stress. Genetic variability gained by gene flow and hybridization at contact zones with “resident” species of primary ultramafic habitats promoted expansion of the tetraploid O. chalcidica across anthropogenic sites.

1. Introduction

Nickel-accumulating plants are currently attracting considerable interest for both biotechnological applications and fundamental research on the genetic bases and molecular mechanisms of metal homeostasis, evolution, and adaptation to extreme environments [1,2,3]. Due to the phylogenetic constraints involved in metal accumulation ability [4], research in this field requires the use of appropriate model systems formed by closely related accumulating and non-accumulating taxa and/or species with populations from sites with high and low levels of Ni in the soil [5,6]. In Europe, broad opportunities for research and phytoextraction technologies are offered by the most diverse groups of Ni-accumulators in the continent, i.e., the Brassicaceae genera Bornmuellera and Odontarrhena (syn. Alyssum sect. Odontarrhena; [7,8,9,10,11]. The latter genus consists of nearly 90 species ranging from the Iberian peninsula to Iran and adjacent regions [12], of which about 60 are able to accumulate Ni well above 1000 μg g−1 dw ([13]; Global Hyperaccumulator Database; http://hyperaccumulators.smi.uq.edu.au/collection/; [2]). Such plants are often obligate endemics of Ni-rich ultramafic outcrops (mostly “serpentine” soils) in given regions, while others grow either on or outside these outcrops and include both accumulator and non-accumulator populations [7,14]. Previous studies showed that accumulator and non-accumulator species do not form separate clades [15,16,17], and that no genetic differentiation occurs between serpentine and non-serpentine accessions of facultative species [18]. This suggested pre-adaptive capacity to accumulate Ni when growing on ultramafics, and repeated colonization events on distinct outcrops in different regions and species complexes. However, most molecular studies on Ni-accumulating plants of this genus have focused on single obligate serpentine endemics, such as O. bertolonii [19] or O. lesbiaca [20], whilst none have examined the population genetic structure of entire species complexes including obligate and facultative serpentine taxa from ultramafic and non-ultramafic soils patchily distributed in geologically variable regions. Notwithstanding, such complexes provide a unique opportunity to examine population differentiation within and among species, and to shed light on the evolutionary dynamics of edaphic specialization, ecotypic variation, and speciation.
The present investigation focuses on this topic using the whole Odontarrhena group from Albania as a study system. Ultramafic areas cover 11% of this rugged country and extend from 100 to 2400 m a.s.l. [21], which makes it a major center of diversity of metal-accumulating plants (and serpentine flora in general) and a most promising land for Ni-agromining [11]. In a recent study [22] we could elucidate its complicated systematics and ascertain the presence of six taxa that were already recognized by previous students of the genus and of the Albanian flora [23,24]. Most of these taxa are allopatric and restricted to undisturbed serpentine or limestone sites in separate mountain massifs, river basins or altitudinal belts, which might involve high inter-population genetic differentiation and isolation by distance. Previous studies on single Ni-accumulator Odontarrhena endemics from non-insular areas [18,19] and other serpentine species [25,26,27] pointed to strong genetic differentiation between populations in relation to the patchy distribution of the ultramafic outcrops. In Albania, however, such a pattern may be blurred by O. chalcidica and O. decipiens, since these polyploid species are largely sympatric and overlapping with the others over a wide altitudinal range, on both serpentine and non-serpentine soils [22]. Their wide distribution and clear preference for anthropogenic habitats suggest that historical land-use activities (i.e., agriculture, sheep farming, mining, industrialization, urbanization) may have promoted hybridization and range expansion, in line with the disturbance hypothesis of Anderson and Stebbins [28]. Moreover, recent evidence shows that species range expansion into novel habitats, including anthropic ones, is often fostered by enhanced genetic variation gained through hybridization and introgression with resident species [29]. Thus, Albanian taxa of Odontarrhena provide a good opportunity to examine this topic, and to investigate the levels and drivers of genetic divergence between taxa and populations from a vast ultramafic ‘archipelago’ along altitudinal and site disturbance gradients.
Using molecular markers from the nuclear and plastid genomes, we first estimated the level of DNA sequence divergence and phylogenetic relationships of all Albanian taxa, within a wide group of mainly Balkan representatives. Then, we used the more variable dominant nuclear markers Amplified Fragment Length Polymorphisms (AFLPs) to: (1) compare the levels of genetic diversity and divergence within and between species and populations, (2) assess the possible effects of site conditions such as elevation, soil type and metal concentration (Ni, Cr, Co, Ca, Mg), and (3) test the hypothesis that human disturbance could have contributed to the shaping of genetic structure in the group by promoting hybridization. AFLPs were used also to identify deviant loci potentially involved in adaptation to serpentine soil, trace metal concentration, and elevation.
Elucidating the genetic structure in this group also pointed to the potential risk of using it for agromining applications on ultramafic outcrops outside its native range and inhabited by native Odontarrhena species.

2. Results

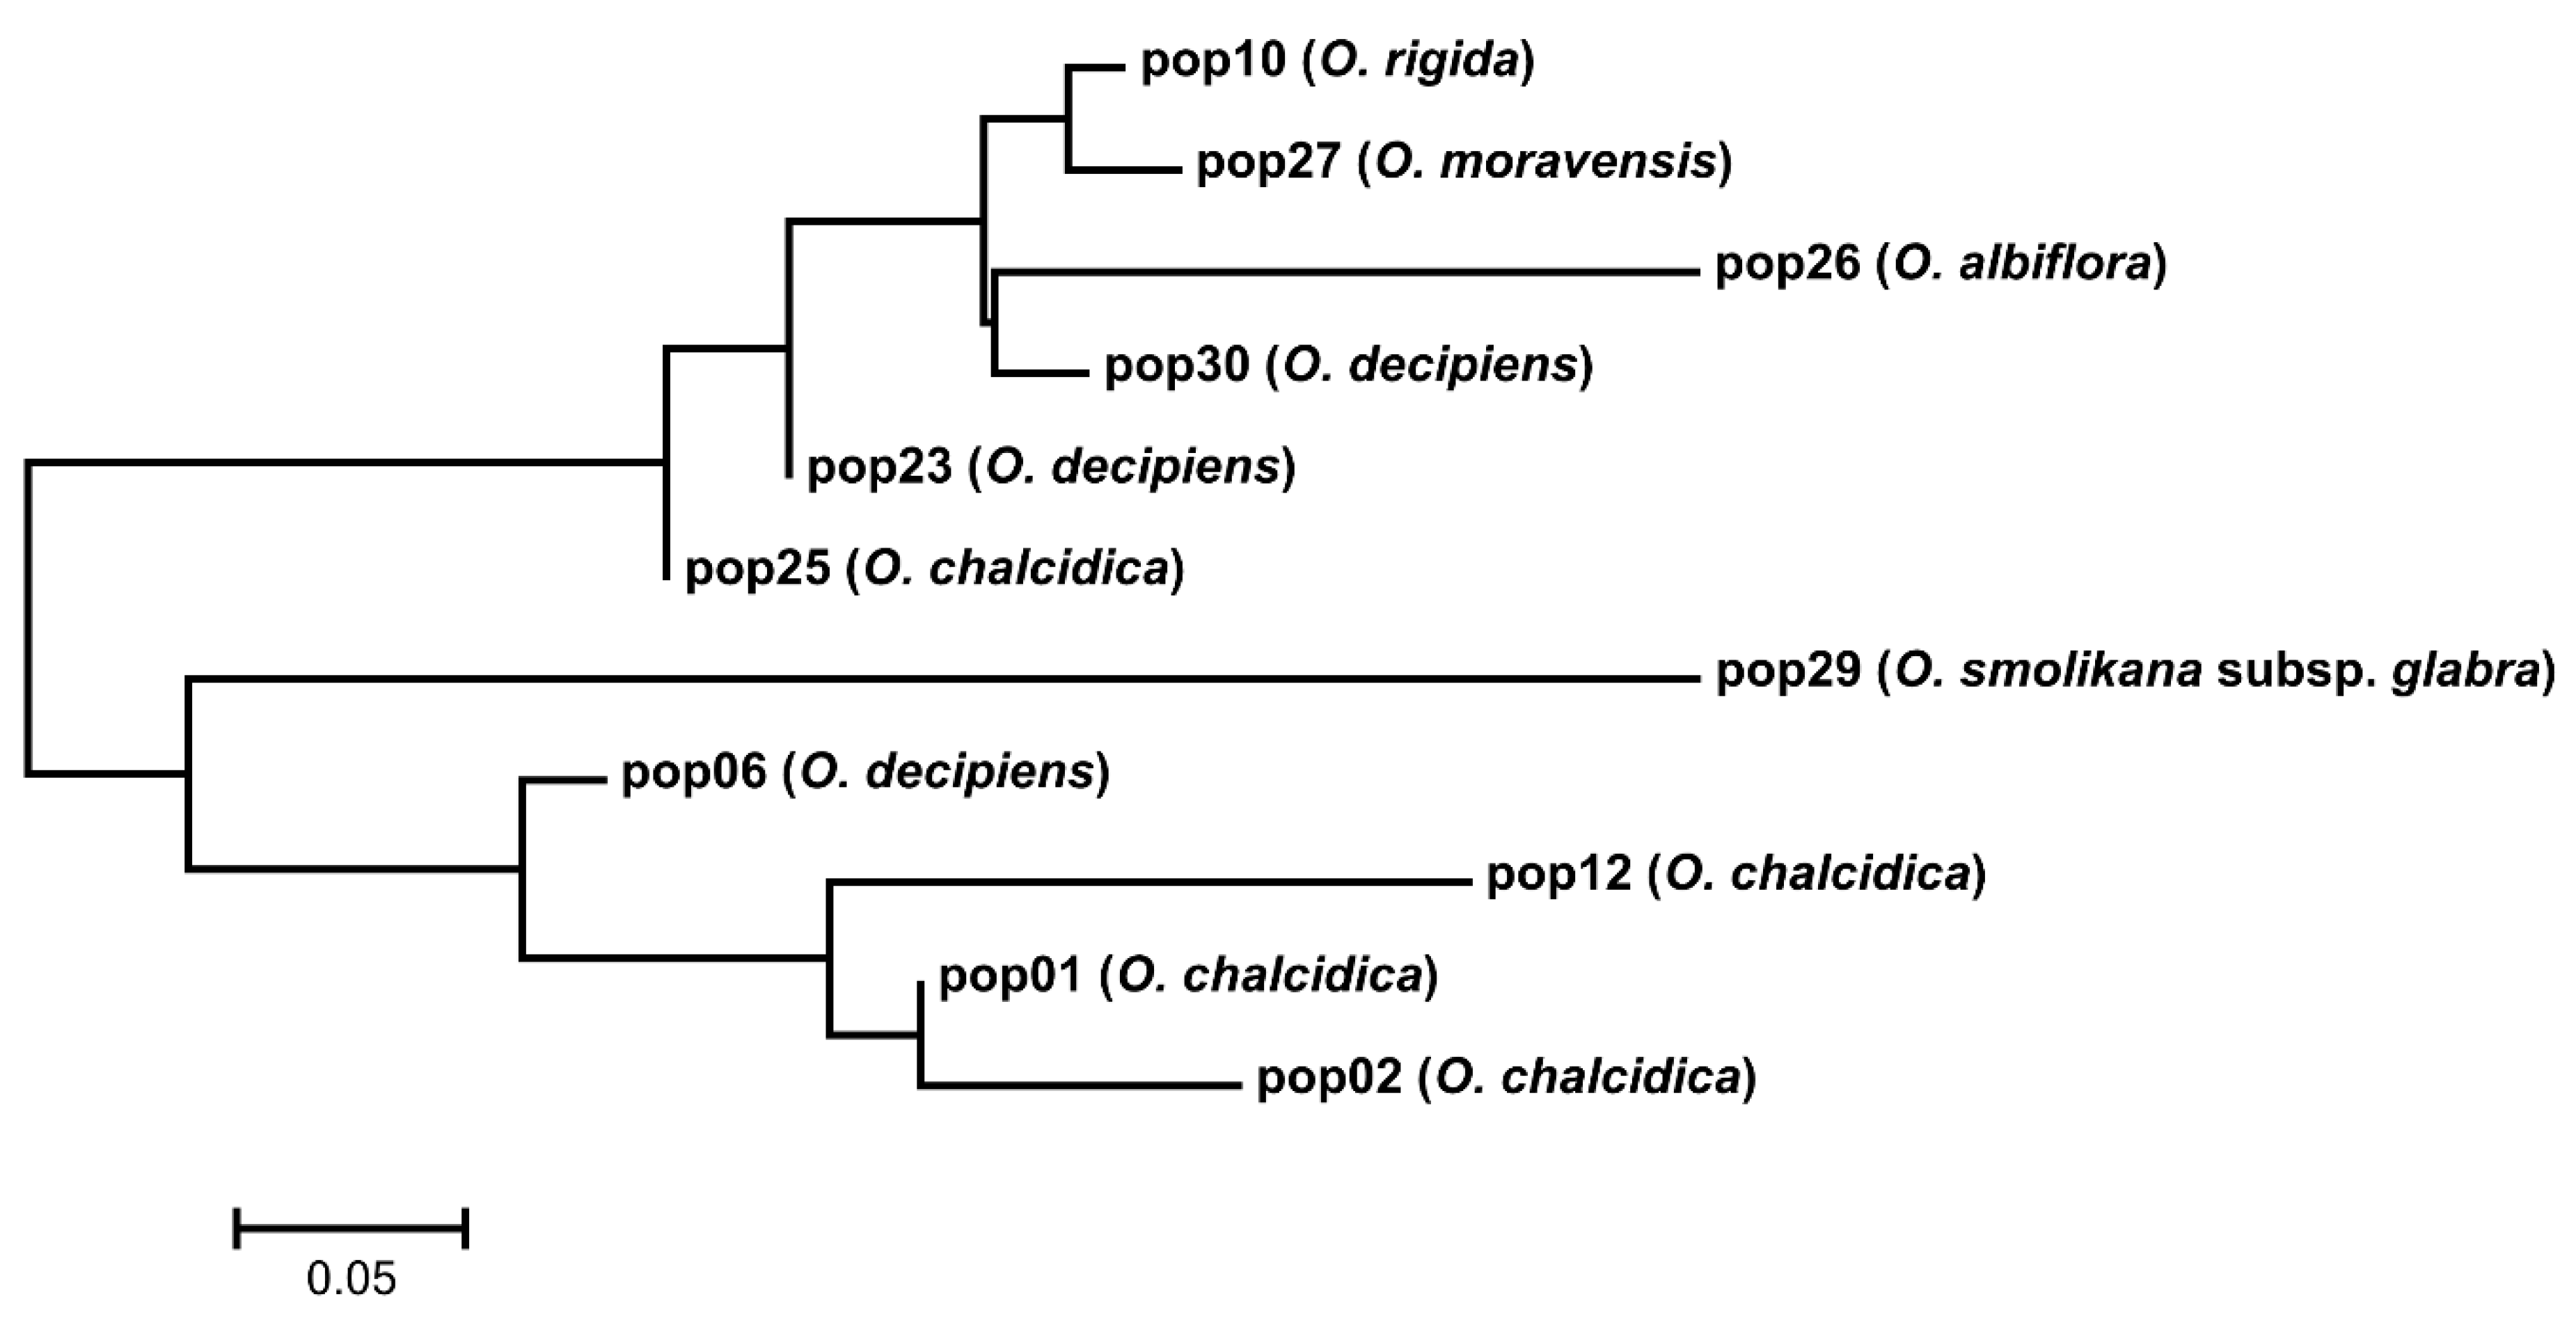
2.1. DNA Sequence Divergence and Phylogeny

The nuclear ribosomal DNA (rDNA) internal transcribed spacer region (ITS) alignment consisted of 629 bp (including 22 coded gaps 608-629), of which 479 conserved, 145 variable but phylogenetically non-informative and 99 (15.7%) informative; considering only the ingroup (i.e., only Odontarrhena accessions), only 50 positions (7.9%) were phylogenetically informative. The mean genetic distance among ingroup accessions was 0.015. The Bayesian consensus phylogram (Figure 1) retrieved O. fallacina from Crete as the sister to the rest of the ingroup that remained substantially unresolved.
All Albanian taxa and accessions were included in a large unresolved group. However, the two diploids O. moravensis and O. rigida formed a well-supported clade (1.00), as well as the three accessions of typical O. muralis from outside Albania. Small terminal clades with PP > 0.90 were formed by other Balkan species but these did not include Albanian accessions.
The chloroplast DNA trnL-trnF IGS (trnL-F) alignment was 733 bp long, (gaps in pos. 712–733). By excluding the Alyssum representatives (outgroup) 565 sites were conserved, 16 were variable but non-informative, and only five were (0.68%) phylogenetically informative. Mean genetic distance in the ingroup was 0.003. The IGS sequences therefore provided even less phylogenetic signal than did ITS. The resulting Bayesian tree was completely unresolved and is, therefore, not shown.

2.2. Genetic Structure

AFLP-fingerprinting was successfully performed on 374 individual samples and produced a total of 137 loci. The fragment length range was 41-511 bp. AMOVA showed significant differentiation between populations (FST = 0.273; p < 0.001) and a genetic structure dominated by within-population variation (72.44%; Table 1).
Grouping populations by species identity yielded non-significant results, whereas differences between populations within species accounted for a significant fraction of variation in the sample (26.50%; overall among-population + among-species variation = 27.56%). Among-population variation was considerably higher in tetraploid than in diploid accessions (27.0% vs. 11.2%, respectively; Table 1), and population differentiation was, therefore, stronger (FST = 0.270 vs. 0.112 in diploids).
STRUCTURE Harvester detected six genetic groups (K = 6; Supplementary Figure S1 and Table S4) and the presence of significant admixing zones (Figure 2A).
Groups were differently represented across the 32 populations (Figure 2B) and correspondence with species identity was weak. Principal component analysis (Figure 3A) explained 88.2% of the total variation and showed that O. rigida and O. albiflora are dominated by K1 and K4, while the tetraploids O. chalcidica, O. decipiens, and O. smolikana include variable proportions of four to six groups.
This was the case of also O. moravensis, in which, however, only one of three populations (no. 20) was deviating in having four genetic groups instead of two as in pops. 19 and 27 (Figure 2B, Table 2).
Genetically admixed populations (with at least two groups both of which with ≥10% posterior probability of belonging into that genetic group) were the large majority (29 = 91%); only three populations consisted of only one group (Figure 2B, Table 2). However, diploid populations (excluding pop. 20 of O. moravensis mentioned above) showed a significantly lower admixing than tetraploid populations (p = 0.00443).
At the individual level, 75 samples (20%) included more than one genetic group (Figure 2C, Table 2); O. albiflora and O. rigida included no admixed individuals, whereas the great majority of the O. chalcidica accessions (14 out of 17) and all those of its hybrid O. decipiens included a variable proportion of admixed individuals. The two O. moravensis accessions no. 19 and no. 27 were formed by non-admixed individuals, while population no. 20 included five admixed individuals. When excluding the latter, the diploid profiles showed a significantly lower admixing than the tetraploids (p = 0.00338).
Based on multifactorial analysis (Figure 3B) the number of both genetic groups and admixed individuals were positively related to site disturbance severity. Populations from severely disturbed sites were also more admixed and consisted of more numerous genetic groups, regardless of species identity (Kruskal–Wallis test p = 0.0147).
Neighbor-Net analysis (Supplementary Figure S2) confirmed no clustering of individuals by species identity or population geographic origin, except for population 26 of O. albiflora and population 14 of O. rigida. Most individuals of O. chalcidica and O. decipiens were mixed with those of other species.

2.3. Genetic Diversity

All loci resulted as polymorphic, showing that the primer combination was effective in distinguishing all individuals of the six taxa as unique genotypes. The lowest polymorphism (32.8%) was in the population of O. moravensis from the type locality (no. 27), whilst the highest (87.6%) was in those of O. decipiens and O. chalcidica (Table 2). The latter taxon showed the broadest inter-population variation, due to low polymorphism in accessions 8 and 9. At the species level, polymorphism was highest in O. smolikana (73.5%) and lowest in O. albiflora (35.8%), though no significant differences existed between taxa. Diploid and tetraploid populations/taxa also did not differ significantly, but diploids had on average a lower polymorphism than tetraploids (57.9% vs. 66.8%). Similarly, polymorphism was higher in serpentine vs. non-serpentine populations (66.2% vs. 52.8%), though differences were not significant because of large variability in O. chalcidica. Heterozygosity was lowest in O. albiflora and highest in O. smolikana, O. decipiens and O. chalcidica (Table 2). The latter taxon again showed the largest range of infraspecific variation, due to genetically-depleted populations 8 and 9. Multifactorial analysis suggested a decrease in loci polymorphism and heterozygosity with elevation (Figure 3B), while these variables were not affected by soil type or site disturbance.
Outlier loci were 11.7% of the total (Figure 4A), their mean number per population ranging from 0.82 to 6.92 in two O. chalcidica accessions (Table 2).
At the species level, diploid O. rigida had significantly less outliers than tetraploids O. chalcidica, O. decipiens and O. smolikana (Figure 5A). However, there were no outliers exclusive to any given species, being all of them shared by at least two taxa.
Outliers were found to decrease in populations from higher elevations (p = 0.0096; Figure 4B), regardless of species identity, and were more represented in populations from serpentine soil (3.9 vs. 1.95 in those from other soil types; p = 0.0092; Figure 5B). Finally, the mean number of outliers per population tended to increase with Ni and Cr in soil (Figure 3B), though not significantly after Bonferroni correction. No relation was found with Co, Ca, Mg, ploidy level or site disturbance.

2.4. Genetic Distances and Gene Flow

Slatkin’s genetic distances between populations (FST values) ranged from 0.002 to 0.956 and were not related to geographic distances (Mantel test p > 0.05). The NJ tree of the populations from the type localities (Figure 6) showed to main groups.
In the first one, there were both diploids (O. rigida and O. moravensis clustering together) and tetraploids (O. albiflora, two O. decipiens accessions, and one of O. chalcidica); the second group was formed only by tetraploids, with O. smolikana subsp. glabra distantly connected to one accession of O. decipiens and three of O. chalcidica.
Within single species, mean inter-population distance was highest in subalpine accessions of O. smolikana subsp. glabra (0.302) from distant massifs, whereas it was lowest in O. decipiens (0.224; Table 2). The estimated levels of interspecific gene flow (Nm) between tetraploids (Figure 7) showed substantial isolation of O. albiflora and strong exchange between especially O. chalcidica and O. decipiens (Nm = 8.9). Odontarrhena smolikana was more strongly connected to O. chalcidica (Nm = 4.2) than to their hybrid O. decipiens (Nm = 2.3). Gene flow between diploids was not significant (Nm = 1.98).

3. Discussion

3.1. Phylogeny

Relationships between Albanian and other taxa of Odontarrhena could not be satisfactorily resolved due to the low rates of variation in both ITS and trnL-F regions, in line with previous studies that suggested rapid and recent diversification as a possible cause [16,30,31]. Phylogeny provided only two relevant results. The first is that the three accessions of typical O. muralis from outside Albania, including one from the type locality in Romania, are clustered in a separate clade, unlike all others from this country. Most of the previous records of this important model taxon for studies on Ni-accumulation physiology and agromining applications, as well as the numerous Ni-accumulation reports from the Balkan ultramafics (i.e., [32]), should be referred to other taxa in the O. muralis s.l. group, mostly O. chalcidica or O. decipiens. Consequently, Ni-accumulation in O. muralis s. s. still requires confirmation. The second point concerns the close relationship between the two vicariant endemics O. rigida and O. moravensis, in line with their morphological synapomorphies (i.e., poorly branched cymes, glabrous silicles, unwinged seeds) and diploid chromosome complement. When looking at population genetic data, the two species showed a lower mean population heterozygosity (He) and were characterized by a lower number of genetic groups (KPop) compared with tetraploids. Remarkably, population 10 of O. rigida and 27 of O. moravensis showed an identical composition of genetic groups, accounting for their close relationship in neighbor-joining analysis and supporting their phylogenetic relationship.

3.2. Population Genetic Structure and Role of Anthropic Habitat Disturbance

AFLP-markers were more successful in detecting significant overall differentiation between the 32 populations analyzed, as expected from their mostly different species identity, edaphism, ploidy level, and geographic origin. Similar levels of differentiation were found in other Mediterranean endemics of Odontarrhena, such as Italian O. bertolonii [19], Aegean O. lesbiaca [20], and Iberian O. serpyllifolia [33]. As in these taxa, genetic structure of Albanian Odontarrhena was dominated by within-population variation, likely due to the prevalent outbreeding in the species of this genus [17]. Consistent with significant overall population differentiation, the proportion of among-population variation was not negligible (27.56%). However, this appeared lower than expected for populations that belong to six mostly allopatric taxa from the vast and geologically patchy mountainous territory of inner Albania. Moreover, geographic distance was not associated with differentiation, suggesting genetic continuity between populations along both altitudinal and latitudinal gradients, despite their different species identity and location on different soil types. Geographic distance was instead found to be positively related to population differentiation in single taxa from primary habitats, such as the obligate O. bertolonii and the facultative O. serpyllifolia mentioned above. In the latter species, distance was even more important than soil type in explaining differentiation [33], and serpentine accessions were not genetically divergent from those located on non-serpentine soils [18]. In the diploid taxa, however, genetic structure was dominated by within-population variation and overall population differentiation was lower than in the group of polyploids, in line with evidence from other plant groups [34].
A second relevant finding was that grouping of populations by species identity could not explain overall genetic variation in our sample, and that most populations consisted of two or more of these groups in variable proportions. In addition, a significant percentage of individual genetic profiles were also admixed, especially in the morphologically intermediate tetraploid hybrid O. decipiens. As in other plant groups [35,36] admixing of genetic groups is indicative of hybridization and introgression [37]. In our system, these mechanisms are likely responsible for the relatively high heterozygosity, polymorphism, and variability in the proportion of outlier loci in the tetraploid complex of O. decipiens, O. smolikana, and O. chalcidica. Introgressive hybridization especially between the former two taxa is supported by the high level of estimated gene flow between them (Nm = 8.9) and is related to their wide, mostly sympatric distribution in Northern and Central Albania, their phenotypic plasticity [22] and, possibly, the broad variation in their shoot Ni levels [38]. The role of hybridization and introgression as mechanisms driving range expansion in plants is well documented [35,39,40], and recent evidence shows that genetic variation gained through hybridization with ‘resident’ species promotes colonization of novel habitats, even in taxa that maintain their distinctness [41]. In our model system, the ‘resident’ species are the endemics from primary habitats, such as O. smolikana, O. moravensis, O. rigida, and O. albiflora, and the ‘novel’ habitat is that created by all those human land-use activities that have shaped, and still shape, large patches of the Albanian territory. Multifactorial analysis showed significantly higher levels of genetic admixing in populations and individuals of O. chalcidica and O. decipiens from anthropogenic sites, whereas narrow-ranged endemics from primary habitats such as O. albiflora, O. rigida, and O. moravensis (when excluding population no. 20) were much less variable in terms of genetic group composition, in line with their low phenotypic variability. As predicted by the ‘disturbance hypothesis’ [28,42], O. chalcidica has likely acquired adaptive genetic variability by crossing with locally sympatric ‘resident’ taxa along contact zones, widened its niche in a more generalist sense (no longer restricted to serpentine), and spread in the many non-natural sites across the country to reach an almost continuous distribution and large population size. Reduction of geographic isolation has further promoted introgressive backcrossing and the genetic swamping of the group, a process that leads to the rarefaction or extinction of pure parental genotypes though not of their alleles [43]. Anthropogenic environmental disturbance is a major driver for these processes [42], since it often involves the breakdown of ecological, geographical and behavioral barriers that isolate populations or species [43,44,45].
Further investigation should address possible hybridization events between tetraploid O. chalcidica and diploid O. moravensis, suggested by the significant admixing detected in a population (no. 20) of the latter species. This population lies at the foot of Mt. Moravë in Eastern Albania, at the contact zone between the species core range on ultramafic rocks and a plain agricultural area where O. chalcidica is abundant. Moreover, Cecchi et al. [22] suggested that the taxon O. elatior (F.K. Mey.) Španiel et al., described from this area [24], could be a hybrid between the two species, consistently with an intermediate genetic distance of pop. 25 (type locality of this taxon) between O. moravensis and the three other O. chalcidica accessions shown in the NJ tree (Figure 6). Formation of triploid bridges between polyploids and diploids have been documented in different plant groups [46,47], including Arabidopsis lyrata (Brassicaceae), where introgression with interploidal flow of adaptive genes can take place from diploid to tetraploid populations [48].
In revealing the complex genetic structure of Odontarrhena in Albania and the likely mechanisms behind it, our findings apparently provided poor molecular support to the taxa delimited based on correlation between morphology, karyology, phenology, distribution, and ecology of natural populations [22]. With the exception of O. albiflora, in fact, there was only partial correspondence between these taxa and the detected genetic groups, though their discrete status was already described by specialized students of this plant group and of the Albanian flora [23,24]. This result could be partly due to our more intensive sampling of polymorphic tetraploid populations from anthropogenic sites (O. chalcidica and O. decipiens) compared with less variable and geographically more restricted diploids from primary serpentine habitats (O. rigida and O. moravensis). However, the partial genetic-taxonomic discrepancy can be explained by the process of diversifying selection which allows maintenance of species (morphological) boundaries despite ongoing gene flow between them. This mechanism was recently documented in other Mediterranean species complexes with strong attitude to introgressive hybridization, such as those in the genus Senecio L., and is probably an underestimated speciation pathway across angiosperms [49]. This points to the need of more studies on gene flow between Odontarrhena populations and on the role of diversifying selection along the elevational gradient and/or levels of metal concentration in the soil or site disturbance. The persistence of morphologically distinct taxa along these gradients, as in the case of O. chalcidica and O. smolikana from low altitude to mountain slopes, could in fact be possible because this mechanism acts on only a few loci that drive adaptive speciation in spite of very low levels of genome-wide differentiation [50].

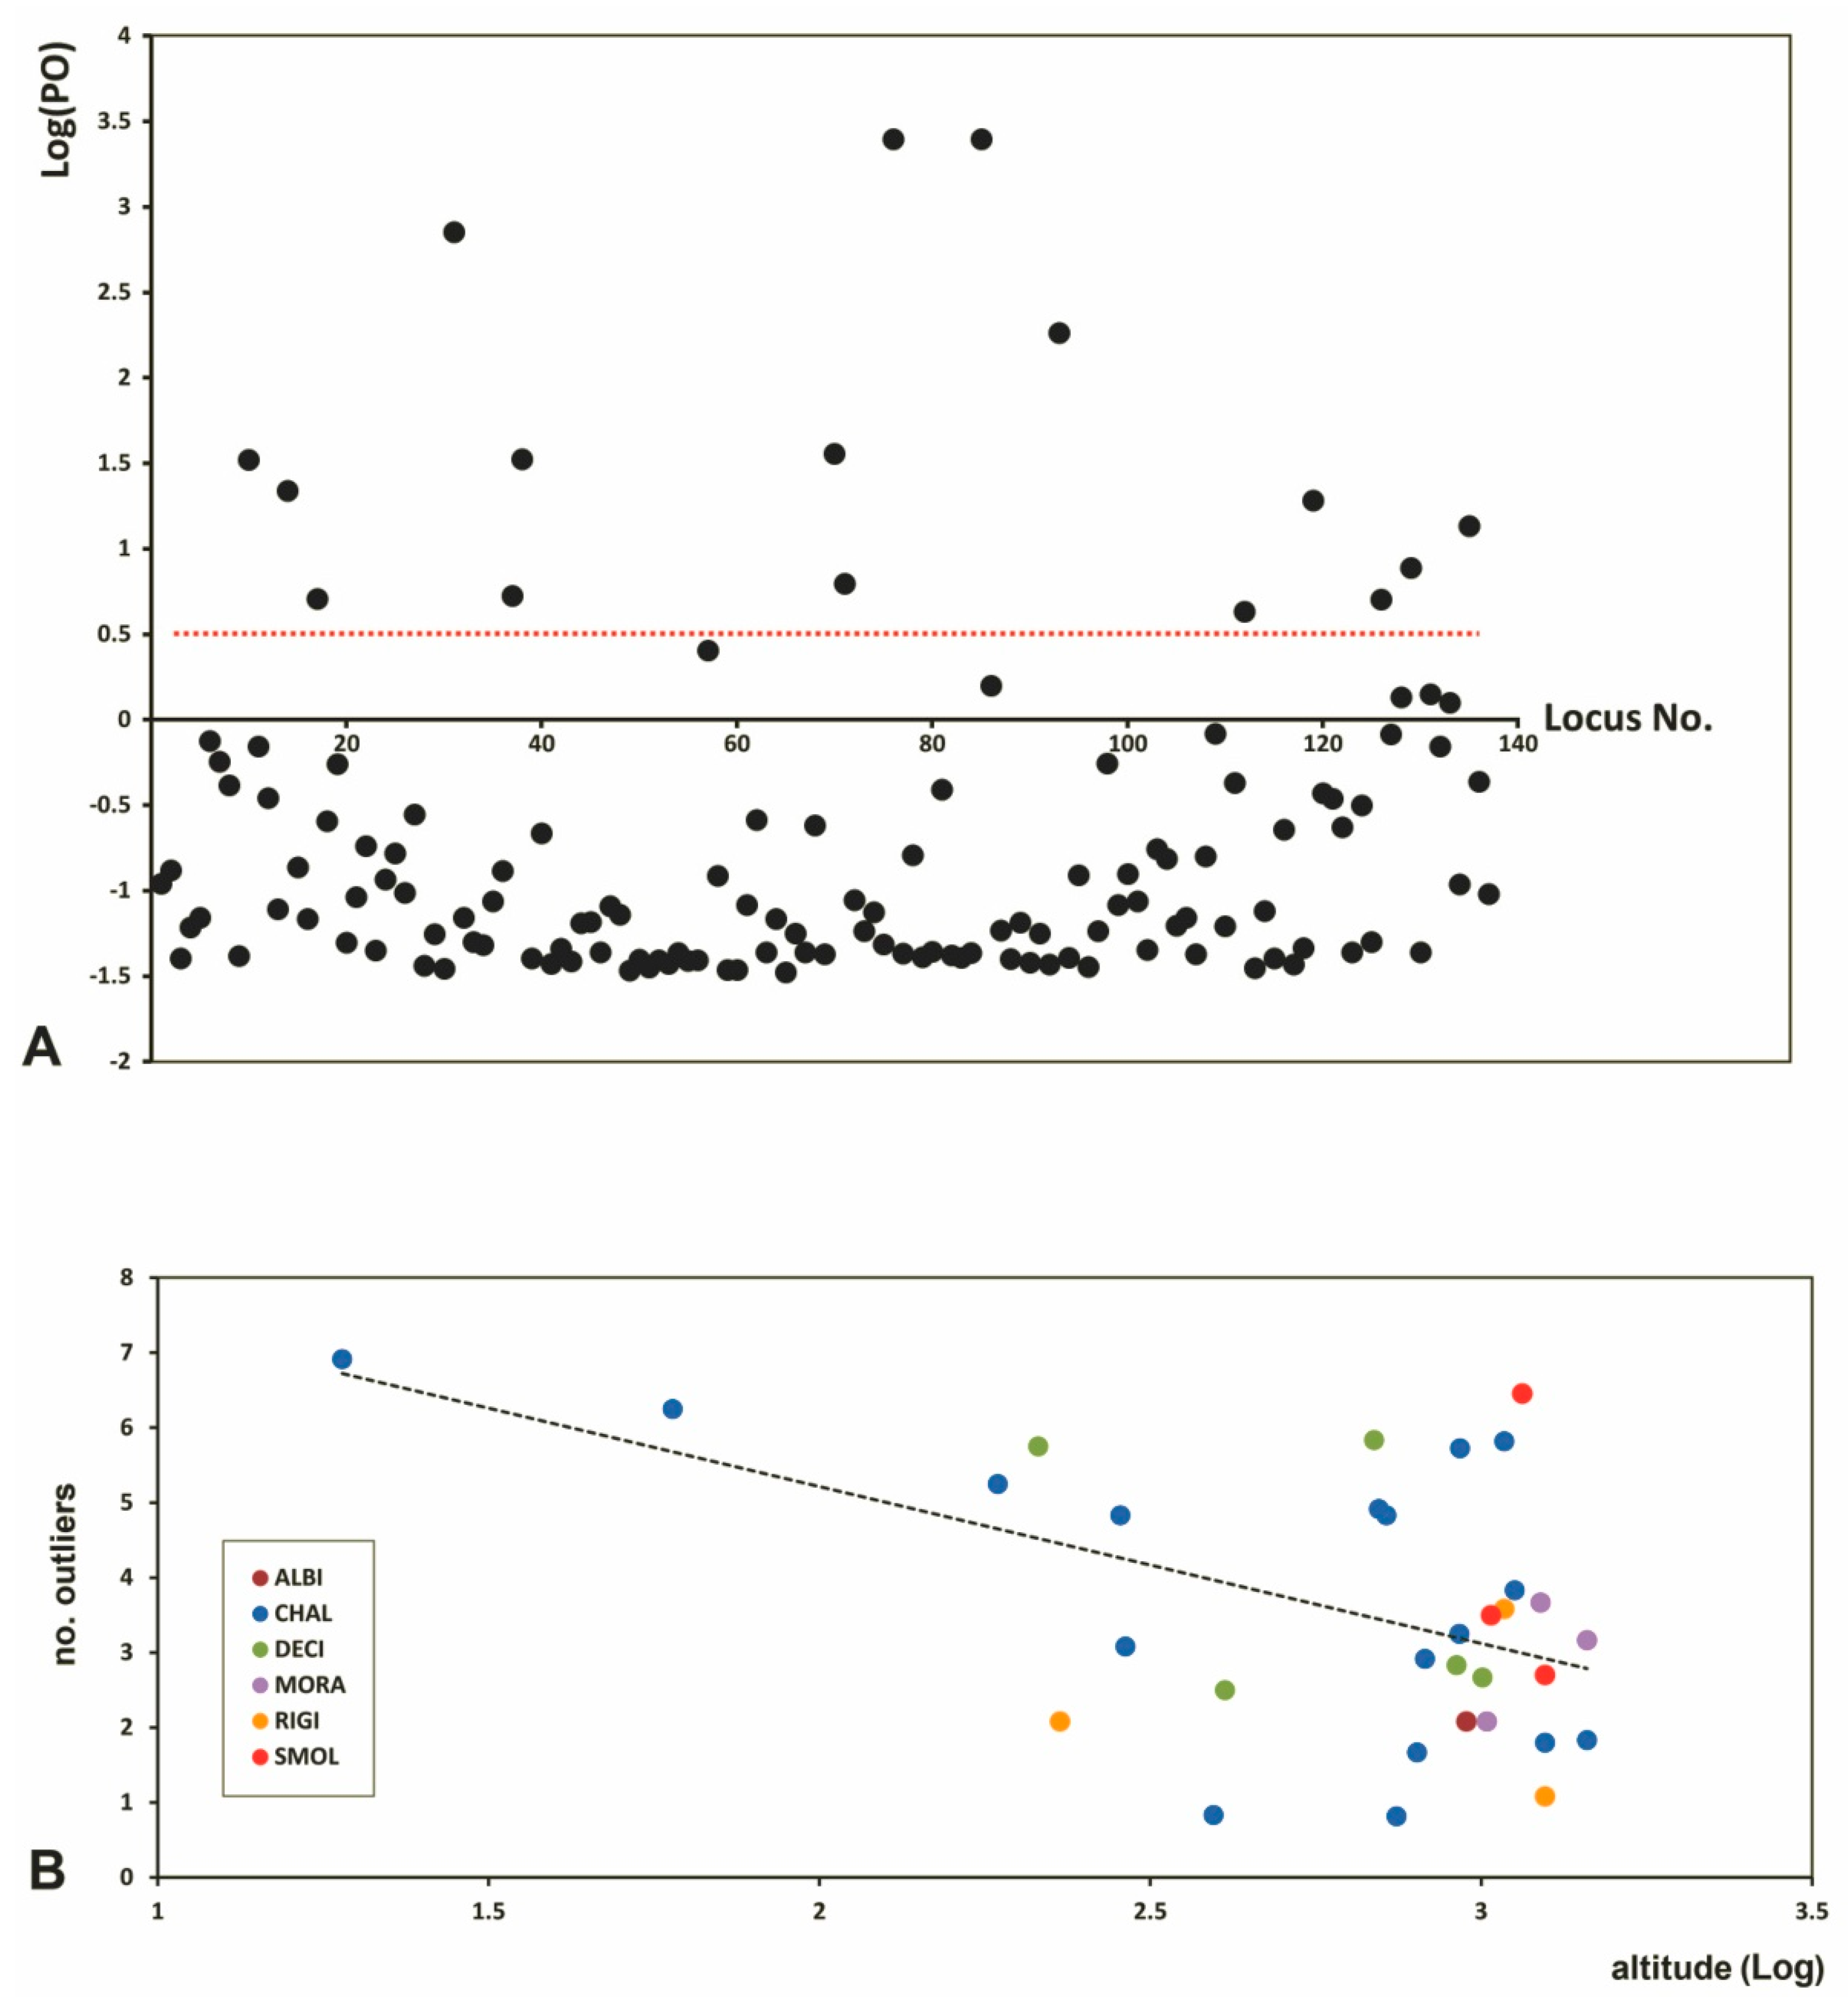
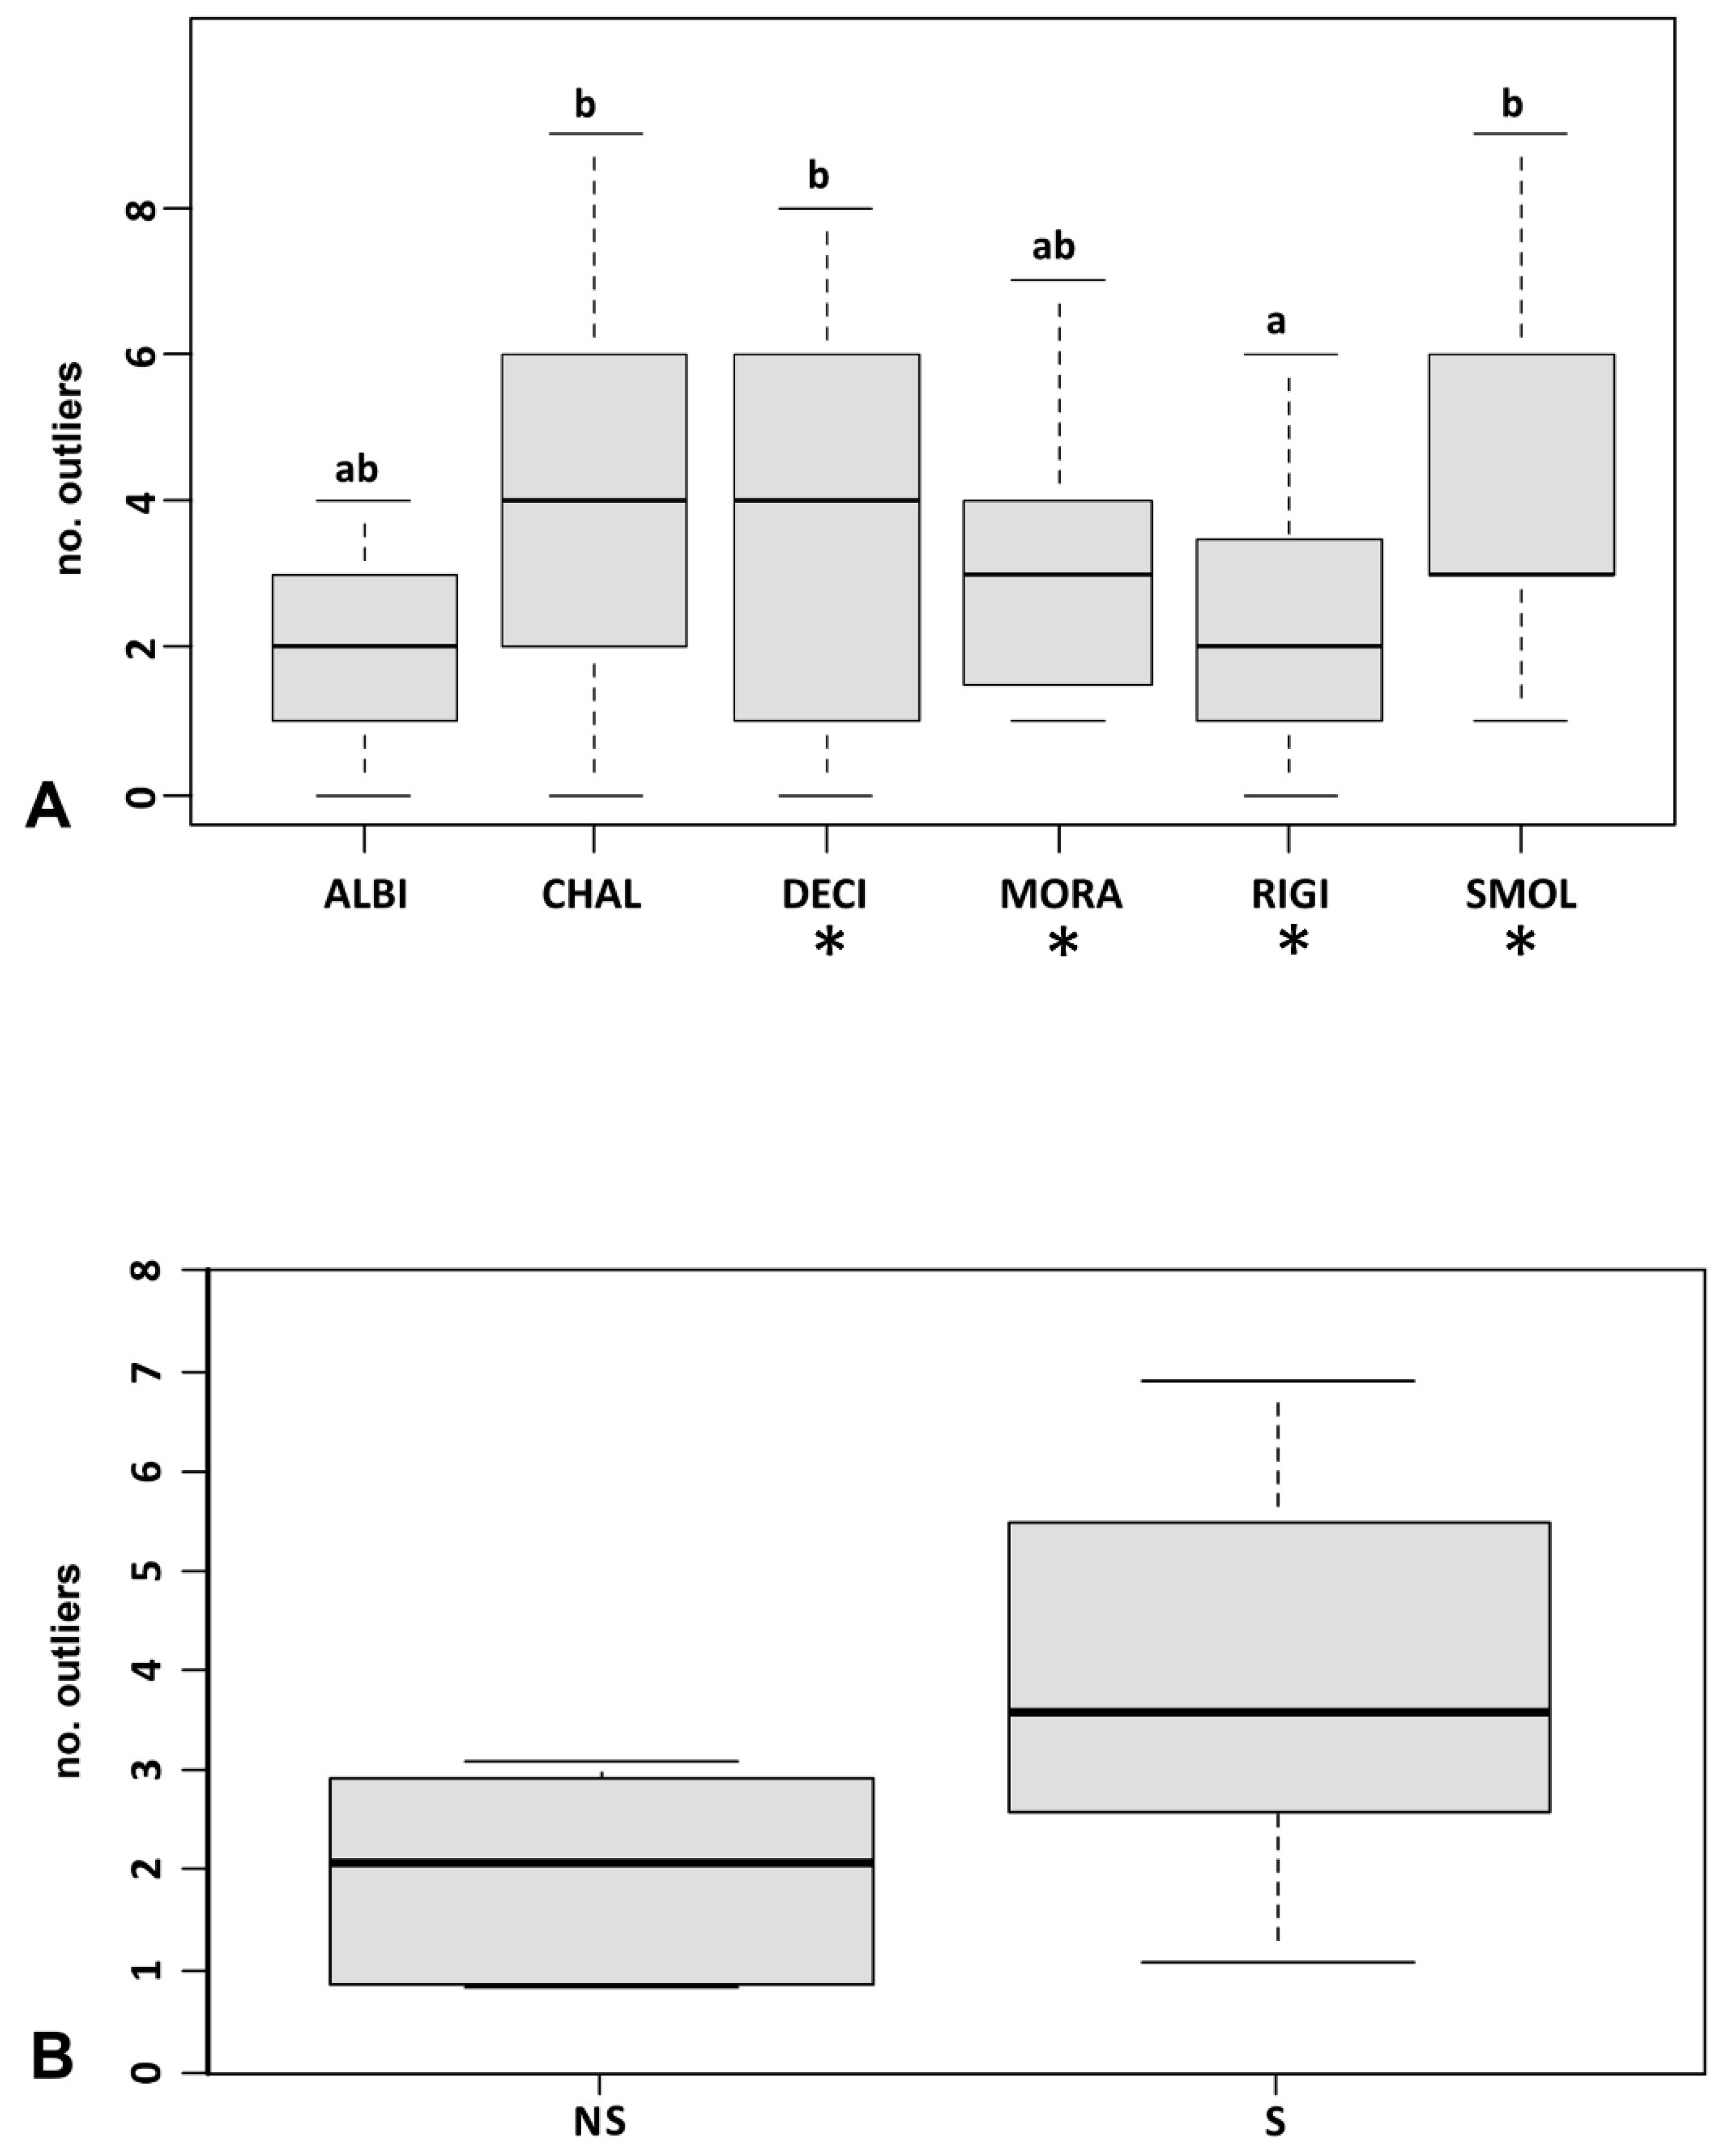
3.3. Genetic Diversity and Outlier Loci in Relation to Site Conditions

Although heterozygosity and polymorphism were slightly higher in serpentine populations, there were no significant deviations in the levels of genetic variability and differentiation between the accessions and taxa of Odontarrhena examined here. Likewise, no evidence for ecotypic differentiation was found within O. chalcidica, the only facultative serpentine species in our group. Reduced heterozygosity observed in some accessions of this species from severely disturbed sites (i.e., pops. 8,9) is likely due to recent founder effect events, which are known to result in the genetic impoverishment of recently established populations [51]. Other studies have pointed to a similar lack of divergence between edaphic races of facultative serpentine species in North America and Europe [26,52,53,54], suggesting that pre-adaptation to live on ultramafics is a constitutive plesiomorphic trait allowing multiple colonization events.
In our study, additional insights came from the analysis of outlier loci, which represented a considerable proportion (11.7%). Although the statistical procedure adopted here cannot be excluded to have caused false positives, we are confident that the proven robustness to this problem of AFLP data treated with Bayesian methods [55,56,57] has allowed to reduce their number to a minimum, if not to zero. While no specific outliers were associated with a given taxon in our sample, these loci were overall more numerous in populations of obligate serpentine endemics than in those from other soil types, suggesting adaptive divergence on ultramafics. Outlier proportion and expression are, in fact, directly related to adaptation in different species to environmental pressures driving divergent selection, and can indicate ecotype-level differentiation even when no divergence at neutral loci occurs [58,59,60]. The several chemical and physical anomalies of serpentine soils are known to exert a strong selection pressure on plant life [61,62,63], and recent studies have shown the genetic signatures of serpentine adaptation on different species [64,65]. Changes in outlier proportion and/or expression could, therefore, be interpreted as one of such signatures, but a recent study on O. serpyllifolia showed no differences between accessions from ultramafic and non-ultramafic sites across the Iberian Peninsula [33]. Moreover, our results suggest that the effects of serpentine soil on outlier frequency and expression should account for also altitude, as these loci appeared to decrease with increasing elevation of the populations investigated here. Although this finding certainly requires support from the analysis of more numerous sampling units, it is in line with evidence that elevation can affect the genetic structure of plant populations via regulation of climatic conditions [66]. Adaptive traits to tolerate drought and heat stress are typical in plants of bare serpentine outcrops of Mediterranean climatic regions [62,67,68,69], and these are particularly necessary at low altitudes because of higher temperatures and lower precipitation. In a study on genetic variation in taxa of Senecio on Mt. Etna, Chapman et al. [50] found an increased expression of an outlier encoding a DNAJ heat shock protein involved in response to heat stress, reflecting adaptation of low-altitude S. chrysanthemifolius to hotter, more arid conditions at the base of the volcano. Remarkably, Etna’s basaltic lava and serpentine soils share a very dark color, which greatly enhances heat and drought stress during spring and summer. Reduced severity of these limiting factors may therefore provide a working hypothesis to explain the decreased incidence of outliers in Albanian populations of Odontarrhena from higher elevations.

3.4. Implications for Conservation

Our findings have relevant implications for the conservation of native taxa, ecotypes, and genotypes of Odontarrhena across its distribution range. The conservation of metallophyte biodiversity and the identification of threats are indeed major issues that require increasing attention and ad hoc research [70]. At present, O. muralis s.l. populations are used in several nickel agromining experiments on ultramafic outcrops across Central and Southern Europe [11] and this may bring a new, previously unrealized threat to the genetic integrity of any local native population. When introduced in non-natural habitats, O. muralis s.l. is likely to be capable of crossing with adjacent congeneric populations of distinct taxa, if existing, and cause the formation of hybrids with enhanced expansion ability. We, therefore, advocate caution before introducing these populations in ultramafic areas hosting endemic Odontarrhena species.

4. Materials and Methods

4.1. Plant Material and Sampling Design

Species of Odontarrhena are small chamaephytes or long-lived caespitose herbs with branched inflorescences of numerous bright yellow flowers that are visited by a variety of pollinating insects including bees, hover flies, flies, wasps and small beetles. Allogamy is the prevailing breeding system [17], though selfing may occur, as in species of Alyssum [71].
Detailed information on the morphology, distribution, ecology and chromosome features in the six Albanian taxa of Odontarrhena are given in Cecchi et al. [22] and summarized in Table 3.
Data on Ni levels in soil and plants are also available from Bettarini et al. [38]. In summary, O. albiflora is a tetraploid endemic known from a single site in Eastern Albania, on calcareous cliffs at 900–1300 m a.s.l.; O. smolikana subsp. glabra is a tetraploid obligate serpentine endemic, occurring in rocky subalpine slopes at 1200–2200 m a.s.l.; O. rigida is a diploid serpentine endemic of Central Albania at 250–1200 m a.s.l., in mostly undisturbed sites; O. moravensis is also diploid and restricted to undisturbed serpentine sites of the E Albanian mountains, at 800–1500 m a.s.l.; O. chalcidica is a tetraploid species widely distributed especially in the northern, central, and eastern parts, on serpentine and other soil types (schist, flysch), at 50–1300 m a.s.l., usually in anthropogenic habitats; O. decipiens is a putative allotetraploid hybrid between O. smolikana and O. chalcidica, already recognized by Nyárády [23] and found at 220–1900 m a.s.l. mostly in disturbed sites of Northern and Central Albania (and Northern Greece).
During ad hoc field trips (2016, 2017, 2018) we sampled a total of 32 populations of the six taxa throughout Albania, in all major outcrops of ultramafic rocks (also indicated as “ophiolites”, especially serpentinite and harzburgite; [72]) and in sites with different soil types (Figure 8).
The number of sampling sites for each of the six taxa was unavoidably uneven due to their different frequency and range extent, from 1 (steno-endemic O. albiflora) to 17 (widespread O. chalcidica). Sampling was more intensive for O. chalcidica and O. decipiens also because these are the two taxa of the O. muralis group more widely used in research on metal uptake and Ni-agromining [10,11,73,74,75,76,77].
At some sites, we sampled populations of different taxa that were close to each other; hence, the distance range between populations was 0.1–230 km. For each population, leaf samples were collected randomly from 12 individuals growing at least 10 m apart on a surface of 0.5 ha, and dried in silica gel; a complete specimen was finally collected as voucher (Supplementary Table S1). Concentration of trace metals (Ni, Cr, Co, Ca, and Mg) was determined with atomic absorption spectroscopy (AAS) in soil samples from eight localities that were not previously investigated in Bettarini et al. ([38]; Supplementary Table S1; Table 4).
At each site we also recorded the severity of anthropic disturbance of the soil-vegetation system (ASD) according to an empirical ordinal scale with three levels [78]: 1 = no disturbance: natural site with primary soil; 2 = average disturbance: no signs of recent mechanical disruption of the soil but with vegetation influenced by goat or sheep grazing, or other traditional forms of anthropic use of the vegetation; 3 = heavy disturbance: non-natural site with soil texture disrupted by mostly mechanized works, such as those caused by mining, quarries, road and building construction, urbanization, intensive agriculture, and similar. Determination of ploidy level could not be performed on all sampled individuals, though karyological data were in large part available from Cecchi et al. [22] and unpublished data (Selvi, pers. obs.).

4.2. DNA Isolation, Amplification, Sequencing, and Phylogenetic Analysis

Genomic DNA of all 12 individual samples from the 32 populations was extracted using a modified 2xCTAB protocol [79] and quantified by a Bio-Photometer (Eppendorf; Hamburg, Germany).
For phylogenetic analysis we used the nrITS and cp trnL-F regions, both successfully applied in previous analyses of Alysseae [30,31]. Sequencing was performed on one individual sample from each of the 10 (for ITS) and nine (for trnL-F) populations representing the six Albanian taxa, including accessions from type localities (Table 3); in addition, we sequenced O. muralis from type locality in Romania (ITS and trnL-F) and 14 accessions of related but non-Albanian taxa for trnL-F. Additional sequences were retrieved from GenBank, bringing the total number of ingroup accessions to 50 (for ITS) and 23 (trnL-F), plus, respectively, three and two Alyssum outgroups (Supplementary Table S2).
ITS amplification was performed using the primers ITSp5 and ITSu4 of Cheng et al. [80], whereas the trnL-F region was amplified with the primers ‘c’ and ‘f’ of Taberlet et al. [81]. Polymerase chain reactions were performed in a total volume of 25 µL containing 2.5 µL of reaction buffer (Dynazyme II; Finnzyme, Keilaranta, Finland), 1.5 mM MgCl2, 10 pmol of each primer, 200 µM of each dNTP, 1U of Taq DNA polymerase (Dynazyme II; Finnzyme, Keilaranta, Finland) and 10 ng of template DNA. Reactions were performed in an Miniamp Thermal Cycler (Applied Biosystems, Thermo Fisher Scientific, Marsiling Industrial, Singapore). For ITS, 40 amplification cycles were run with an annealing temperature of 50 °C, annealing time of 30 s and a final extension for 45 s at 72 °C. For trnL-F, the PCR cycling conditions followed Rosati et al. [82]. Automated DNA sequencing was performed directly from the purified PCR products using BigDye Terminator v.2 chemistry and an ABI310 sequencer (PE-Applied Biosystems, Norwalk, CT, USA). The original sequences were checked for ambiguous positions based on visual inspection of the output chromatofiles and edited with BioEdit vs. 7.0 [83].
Next, the ITS and trnL-F data matrices were expanded with sequences of selected taxa retrieved from NCBI (accessions details in Supplementary Table S1). The final ITS dataset included 28 taxa and 52 accessions of which 27 were from Albania (12 original, deposited in GenBank +15 retrieved from [16]). Three Alyssum species were included as outgroups because of the external position of this genus in recent analyses [30,31]. The trnL-F matrix included 23 taxa/accessions of Odontarrhena representing all Albanian taxa, five of which were from the O. muralis s.l. complex; all sequences were original.
Multiple alignments were performed with MAFFT v. 7.0 (on-line version; [84]) using the Q-INS-1 strategy, which is a slow, accurate, iterative refinement method recommended for small-scale alignments [85]. Gaps were coded as separate characters according to Simmons and Ochoterena [86] using FastGap v.1.2 [87] and appended at the end of the datasets. Alignments are available from the authors upon request.
Trees were first obtained using Bayesian inference of phylogeny as implemented in MrBayes 3.1.2 [88]. Selection of the substitution models was based on the Akaike Information Criterion, using FindModel (available at: http://www.hiv.lanl.gov/content/sequence/findmodel/findmodel.html). These were GTR + Γ for ITS, with gamma-distributed rate variation across sites, and GTR + I + Γ for trnL-F.
The analyses were performed using four incrementally heated Markov chains (one cold, three heated) simultaneously started from random trees, and run for one million cycles sampling a tree every ten generations. The stationary phase was reached when the average standard deviation of split frequencies reached 0.01. Trees that preceded the stabilization of the likelihood value (the burn-in) were discarded, and the remaining trees were used to calculate a majority-rule consensus phylogram.
The trees were viewed and edited with TreeView [89], with indication of Bayesian Posterior Probabilities (PP) values for the internal tree nodes.
For both markers (ITS and trnL-F), estimates of genetic distances between the in-group accessions were calculated using the maximum complete likelihood model [90] as implemented in MEGA v.6.06 [91].

4.3. Population Genetic Analyses

We used amplified fragment length polymorphism (AFLPs), a still widely used tool for inferring genetic structure in plant populations because of reproducibility, robustness, and high resolving power of polymorphism [92]. This DNA-fingerprinting technique has been successfully applied to the study of plant adaptation to metal tolerance in Arabidopsis halleri [93], serpentine adaptation in O. serpyllifolia [33], and genetic structure in rare serpentine endemics of the Balkans [27]. Moreover, it proved its effectiveness also in the detection of recent introgression events in morphologically divergent taxa and in polyploid groups [94,95,96].
AFLP-fingerprinting was applied to 384 individual samples following the standard procedure with minor modifications [27].
The quality of AFLP profiles was preliminarily tested on 20 samples randomly selected from the 32 populations (ca. 5% of the total of the dataset). The preliminary AFLP protocol for quality control was performed using six primers pair combinations (Supplementary Table S3). The final primer combinations hex_EcoRI-ACG/MseI-TTA and fam_EcoRI-CTA/MseI-TTA were selected because these yielded comparable results for all of the samples, in terms of positive-PCR products and of the number and size of the peaks obtained. To limit subjectivity in the scoring of AFLP profiles [97], the AFLP profiles obtained by capillary electrophoresis for both the preliminary and final analyses were automatically scored with GeneMarker v. 1.5 (SoftGenetics LLC, PA, USA), using a cut-off value of 5% of the maximum fluorescence peak. The reproducibility of the data was assessed by replicating 20 samples that were marked as duplicated and compared with the rest of the dataset in GeneMarker during the panel editor preparation.
Following the program manual, we adopted a low peak detection threshold setting and a “stutters peak” filter to remove stutter peaks within 2.5 bp of each detected allele peak. After running the data with the size standard and the specific panel, the trace comparison report was analyzed with the duplicated samples, also checking the allele report file, and no mismatches were detected. During this step, the presence, absence, and questionable presence of alleles is shown, and in the case of complete mismatch of the peaks, the sample is automatically removed by the program to eliminate errors.
Analysis of molecular variance (AMOVA; [98]) was then performed in Arlequin v. 2.000 [99], to determine partitioning of the overall genetic variation at three levels: within-populations, among populations within species, and among (putative) taxa (i.e., all populations of putatively the same taxon grouped together). AMOVA was also performed separately for diploid and tetraploid populations.
Next, we used STRUCTURE v.2.3.3 [37] to determine the number and distribution of genetic groups and to identify admixed populations and individuals. According to Stift et al. [100], STRUCTURE is the most robust method for the analysis of genetic structure in mixed-ploidy populations analyzed with dominant markers such as AFLPs, even in groups with low population differentiation. The optimal K value (most likely number of genetic groups) was estimated using Structure Harvester [101]. The analysis was performed adopting the admixture model and 10,000 burn-ins followed by 500,000 Markov Chain Monte Carlo runs (Structure Manual). In each population, the number of genetic groups and the proportion of individual AFLP-profiles consisting of two or more genetic groups showed the level of genetic admixing as likely result of hybridization. Admixed individuals/populations were those including at least two groups, both of which with ≥10% posterior probability of belonging to that genetic group.
Principal component analysis was used to summarize and display the variation in the average proportion of each genetic group across the six groups of conspecific populations (taxa).
In addition, a Neighbor-Net analysis was performed on the matrix of uncorrected P-distances using SPLITSTREE v. 4.15.1 [102].
Genetic variation was assessed as the proportion of polymorphic loci in the dataset, and as within-population heterozygosity (He) based on Nei’s metric [103] as implemented in Arlequin v. 2.000; mean He values were averaged for conspecific populations to estimate genetic variation within species (Hs). Statistical comparisons between taxa and diploid vs. polyploid populations were made for all variables. Next, outlier loci in each individual AFLP-profile were assessed to identify genomic sites under potential selection pressure, based on differences in their frequencies between populations [104,105]. The assumption of this metric is that the locus frequencies within a population follow a multivariate β-distribution as a function of the multi-locus Fixation Index value, and the average of locus frequencies of each locus between populations [57,106,107]. Analysis in BayeScan v.2.1 [108] was carried out keeping the number of pilot runs at 20 [109], with 10,000 iterations each one [60]. Outliers are loci that fall over a threshold value set on the logarithm of posterior odds values (LogPO), determined as in Foll [108].
The mean number of outlier loci was determined for each population and the six groups of conspecific populations. After testing normality with the Shapiro–Wilk test, the six taxa were compared using ANOVA followed by a post hoc Tukey test.
Genetic distances among populations were estimated as Slatkin’s linearized pairwise FST values [110]. MEGA X [111] was then used to build a neighbor-joining tree [112] showing the distance between the typical populations from the locus classicus of the taxa described from Albania (i.e., the endemics O. smolikana subsp. glabra, O. rigida, O. moravensis, O. albiflora, and the “type” populations of also taxa recently included in O. chalcidica and O. decipiens as synonyms; Cecchi et al., [22]; Supplementary Table S1). Next, the genetic and geographic distances of the whole set of populations were then compared using a Mantel test as implemented in the R-package Vegan v. 2.5-6 [113]. The number of migrants per generation (Nm) was estimated separately for diploid tetraploid populations, using the Whitlock formula [114]: FST ≠ 1/(4Nm + 1).

4.4. Relationships between Genetic Variables and Site Conditions

The relationships between population genetic variables (polymorphic loci, He, outliers, number of genetic groups per population, and number of admixed individuals per population), site variables (altitude, soil type, metal concentration in the soil), and site disturbance were first explored using multiple factor analysis (MFA; [115]) as implemented in the package FactoMineR [116,117]. Next, we used multiple regression analysis with Bonferroni correction to test the relationships between each genetic variable above with altitude and trace metal content. Populations from low, medium, and high disturbance sites were compared for number of genetic groups using the non-parametric Kruskal–Wallis test.

Supplementary Materials

The following are available online at https://www.mdpi.com/2223-7747/9/12/1686/s1, Figure S1: Delta K graph showing optimal number of genetic groups, from STRUCTURE HARVESTER, Figure S2: Neighbor-Net graph of the 374 individual AFLP-profiles from SPLITSTREE, Table S1: List of accessions and taxa of Odontarrhena from Albania used for AFLP analysis, Table S2: List of taxa (in alphabetical order) and accessions included in the phylogenetic analysis, Table S3: Fluorescent labelling, primer name and primer sequence with selective extension, Table S4: Evanno table output and raw Structure output.

Author Contributions

Conceptualization: A.C. and F.S.; methodology: A.C. and I.C.; formal analysis: A.C., I.C. and F.S.; investigation: A.C., I.B. and I.C.; resources: A.C., I.B., C.G. and F.S.; data curation: A.C.; writing—original draft preparation: A.C. and F.S.; writing—review and editing: A.J.M.B., G.E., L.P., C.G., I.C., A.C. and F.S.; visualization: A.C. and F.S.; supervision: C.G. and F.S.; project administration: C.G.; funding acquisition: C.G. All authors have read and agreed to the published version of the manuscript.

Funding

This study was supported by funding from ‘Agronickel’ ID71, an ERA-NET Cofund-supported FACCE SURPLUS project.

Acknowledgments

The authors wish to thank Lorenzo Cecchi for his active support and discussion during fieldwork and Aida Bani for useful information and support. Laura Vivona helped with the preparation of the color figures.

Conflicts of Interest

The authors declare that the research was conducted in the absence of any commercial or financial relationships that could be construed as a potential conflict of interest.

References

  1. Wójcik, M.; Gonnelli, C.; Selvi, F.; Dresler, S.; Rostański, A.; Vangronsveld, J. Metallophytes of serpentine and calamine soils–Their unique ecophysiology and potential for phytoremediation. In Phytoremediation. Advances in Botanical Research; Cuypers, A., Vangronsveld, J., Eds.; Academic Press: Cambridge, MA, USA; Elsevier: Amsterdam, The Netherlands, 2017; pp. 1–42. [Google Scholar]
  2. Reeves, R.D.; Baker, A.J.M.; Jaffré, T.; Erskine, P.D.; Echevarria, G.; van der Ent, A. A global database for plants that hyperaccumulate metal and metalloid trace elements. New Phytol. 2018, 218, 407–411. [Google Scholar] [CrossRef] [PubMed] [Green Version]
  3. Van der Ent, A.; Echevarria, G.; Baker, A.J.M.; Morel, J.L. (Eds.) Agromining: Farming for Metals. Extracting Unconventional Resources Using Plants; Mineral Resource Reviews Series; Springer International Publishing: Cham, Switzerland, 2017. [Google Scholar]
  4. Broadley, M.R.; Willey, N.J.; Wilkins, J.C.; Baker, A.J.M.; Mead, A.; White, P.J. Phylogenetic variation in heavy metal accumulation in angiosperms. New Phytol. 2001, 152, 9–27. [Google Scholar] [CrossRef]
  5. Reeves, R.D.; Baker, A.J.M. Studies on metal uptake by plants from serpentine and non-serpentine populations of Thlaspi goesingense Hálácsy (Cruciferae). New Phytol. 1984, 98, 191–204. [Google Scholar]
  6. Krämer, U. Metal hyperaccumulation in plants. Annu. Rev. Plant Biol. 2010, 6, 517–534. [Google Scholar]
  7. Reeves, R.D.; Brooks, R.R.; Dudley, T.R. Uptake of Nickel by species of Alyssum, Bornmuellera, and other genera of old world tribus Alysseae. Taxon 1983, 32, 184–192. [Google Scholar] [CrossRef]
  8. Reeves, R.D. Nickel and zinc accumulation by species of Thlaspi L., Cochlearia L., and other genera of the Brassicaceae. Taxon 1988, 37, 309–318. [Google Scholar] [CrossRef]
  9. Peer, W.A.; Mahmoudian, M.; Freeman, J.L.; Lahner, B.; Richards, E.L.; Reeves, R.D.; Murphy, A.S.; Salt, D.E. Assessment of plants from the Brassicaceae family as genetic models for the study of nickel and zinc hyperaccumulation. New Phytol. 2006, 172, 248–260. [Google Scholar] [CrossRef]
  10. Nkrumah, P.N.; Baker, A.J.M.; Chaney, R.L.; Erskine, P.D.; Echevarria, G.; Morel, J.L.; van der Ent, A. Current status and challenges in developing nickel phytomining: An agronomic perspective. Plant Soil 2016, 406, 55–69. [Google Scholar] [CrossRef] [Green Version]
  11. Echevarria, G.; Bani, A.; Benizri, E.; Gonnelli, C.; Hazotte, C.; Kisser, J.; Konstantinou, M.; Kuppens, T.; Kyrkas, D.; Laubie, B.; et al. Developing sustainable agromining systems in agricultural ultramafic soils for nickel recovery. Front. Environ. Sci. 2018, 6. [Google Scholar] [CrossRef]
  12. Španiel, S.; Kempa, M.; Salmerón-Sánchez, E.; Fuertes-Aguilar, J.; Mota, J.F.; Al-Shehbaz, I.A.; German, D.A.; Olšavská, K.; Šingliarová, B.; Zozomová-Lihová, J.; et al. AlyBase: Database of names, chromosome numbers, and ploidy levels of Alysseae (Brassicaceae), with a new generic concept of the tribe. Plant Syst. Evol. 2015, 301, 2463–2491. [Google Scholar] [CrossRef]
  13. Brooks, R.R.; Morrison, R.S.; Reeves, R.D.; Dudley, T.R.; Akman, Y. Hyperaccumulation of nickel by Alyssum Linnaeus (Cruciferae). Proc. R. Soc. Lond. Ser. B Boil. Sci. 1979, 203, 387–403. [Google Scholar] [CrossRef]
  14. Brooks, R.R.; Shaw, S.; Marfil, A.A. Some observations on the ecology, metal uptake and nickel tolerance of Alyssum serpyllifolium subspecies from the Iberian peninsula. Vegetatio 1981, 45, 183–188. [Google Scholar] [CrossRef]
  15. Mengoni, A.; Gonnelli, C.; Brocchini, E.; Galardi, F.; Pucci, S.; Gabbrielli, R.; Bazzicalupo, M. Chloroplast genetic diversity and biogeography in the serpentine endemic Ni-hyperaccumulator Alyssum bertolonii. New Phytol. 2003, 157, 349–356. [Google Scholar] [CrossRef]
  16. Cecchi, L.; Gabbrielli, R.; Arnetoli, M.; Gonnelli, C.; Hasko, A.; Selvi, F. Evolutionary lineages of nickel hyperaccumulation and systematics in European Alysseae (Brassicaceae): Evidence from nrDNA sequence data. Ann. Bot. 2010, 106, 751–767. [Google Scholar] [CrossRef] [Green Version]
  17. Cecchi, L.; Colzi, I.; Coppi, A.; Gonnelli, C.; Selvi, F. Diversity and biogeography of Ni-hyperaccumulators of Alyssum section Odontarrhena (Brassicaceae) in the central western Mediterranean: Evidence from karyology, morphology and DNA sequence data. Bot. J. Linn. Soc. 2013, 173, 269–289. [Google Scholar] [CrossRef] [Green Version]
  18. Sobczyk, M.K.; Smith, J.A.C.; Pollard, A.J.; Filatov, D.A. Evolution of nickel hyperaccumulation and serpentine adaptation in the Alyssum serpyllifolium species complex. Heredity 2016, 118, 31–41. [Google Scholar] [CrossRef] [Green Version]
  19. Mengoni, A.; Chianni, E.; Galardi, F.; Gonnelli, C.; Baker, A.J.M.; Bazzicalupo, M.; Reeves, R.D.; Adiguzel, N.; Gabbrielli, R. Evolutionary dynamics of nickel hyperaccumulation in Alyssum revealed by its nrDNA analysis. New Phytol. 2003, 159, 691–699. [Google Scholar] [CrossRef]
  20. Adamidis, G.C.; Dimitrakopoulos, P.G.; Manolis, A.; Papageorgiou, A.C. Genetic diversity and population structure of the serpentine endemic Ni hyperaccumulator Alyssum lesbiacum. Plant Syst. Evol. 2014, 300, 2051–2060. [Google Scholar] [CrossRef]
  21. Estrade, N.; Cloquet, C.; Echevarria, G.; Sterckeman, T.; Deng, T.; Tang, Y.; Morel, J.-L. Weathering and vegetation controls on nickel isotope fractionation in surface ultramafic environments (Albania). Earth Planet. Sci. Lett. 2015, 423, 24–35. [Google Scholar] [CrossRef]
  22. Cecchi, L.; Bettarini, I.; Colzi, I.; Coppi, A.; Echevarria, G.; Pazzagli, L.; Bani, A.; Gonnelli, C.; Selvi, F. The genus Odontarrhena (Brassicaceae) in Albania: taxonomy and nickel accumulation in a critical group of metallophytes from a major serpentine hot-spot. Phytotaxa 2018, 351, 1–28. [Google Scholar] [CrossRef] [Green Version]
  23. Nyárády, E.J. Synopsis specierum, variationum et formatum sectionis Odontarrhenae generis Alyssum. Analele Academiei Republicii Populare Române, Secţia de Ştiinţe Geologice, Geografice şi Biologice, Seria A 1949, 1, 67–194. [Google Scholar]
  24. Meyer, F.K. Beiträge zur Flora von Albanien. Haussknechtia Beiheft 2011, 15, 1–220. [Google Scholar]
  25. Wolf, A.T.; Howe, R.W.; Hamrick, J.L. Genetic diversity and population structure of the serpentine endemic Calystegia collina (Convolvulaceae) in northern California. Am. J. Bot. 2000, 87, 1138–1146. [Google Scholar] [CrossRef] [PubMed]
  26. Mengoni, A.; Selvi, F.; Cusimano, N.; Galardi, F.; Gonnelli, C. Genetic diversity inferred from AFLP fingerprinting in populations of Onosma echioides (Boraginaceae) from serpentine and nrDNA sequence data. Plant Biosyst. 2006, 140, 211–219. [Google Scholar] [CrossRef]
  27. Coppi, A.; Cecchi, L.; Mengoni, A.; Pustahija, F.; Tomović, G.; Selvi, F. Low genetic diversity and contrasting patterns of differentiation in the two monotypic genera Halacsya and Paramoltkia (Boraginaceae) endemic to the Balkan serpentines. Flora -Morphol. Distrib. Funct. Ecol. Plants 2014, 209, 5–14. [Google Scholar] [CrossRef]
  28. Anderson, E.; Stebbins, G.L., Jr. Hybridization as an evolutionary stimulus. Evolution 1954, 8, 378–388. [Google Scholar] [CrossRef]
  29. Pierce, A.A.; Gutierrez, R.; Rice, A.M.; Pfennig, K.S. Genetic variation during range expansion: Effects of habitat novelty and hybridization. Proc. R. Soc. B Boil. Sci. 2017, 284, 20170007. [Google Scholar] [CrossRef] [PubMed]
  30. Rešetnik, I.; Šatović, Z.; Schneeweiss, G.M.; Liber, Z. Phylogenetic relationships in Brassicaceae tribe Alysseae inferred from nuclear ribosomal and chloroplast DNA sequence data. Mol. Phylogenet. Evol. 2013, 69, 772–786. [Google Scholar] [CrossRef]
  31. Li, Y.; Feng, Y.; Lv, G.; Liu, B.; Qi, A. The phylogeny of Alyssum (Brassicaceae) inferred from molecular data. Nord. J. Bot. 2015, 33, 715–721. [Google Scholar] [CrossRef]
  32. Bani, A.; Pavlova, D.; Echevarria, G.; Mullaj, A.; Reeves, R.D.; Morel, J.L.; Sulçe, S. Nickel hyperaccumulation by species of Alyssum and Thlaspi (Brassicaceae) from ultramafic soils of the Balkans. Bot. Serb. 2010, 34, 3–14. [Google Scholar]
  33. Quintela-Sabarís, C.; Marchand, L.; Smith, J.A.C.; Kidd, P. Using AFLP genome scanning to explore serpentine adaptation and nickel hyperaccumulation in Alyssum serpyllifolium. Plant Soil 2017, 416, 391–408. [Google Scholar] [CrossRef]
  34. Kim, C.; Shin, H.; Choi, H. Genetic diversity and population structure of diploid and polyploid species of Isoëtes in East Asia based on Amplified Fragment Length Polymorphism Markers. Int. J. Plant Sci. 2009, 170, 496–504. [Google Scholar] [CrossRef]
  35. Zalapa, J.E.; Brunet, J.; Guries, R.P. The extent of hybridization and its impact on the genetic diversity and population structure of an invasive tree, Ulmus pumila (Ulmaceae). Evol. Appl. 2010, 3, 157–168. [Google Scholar] [CrossRef] [PubMed]
  36. Hamlin, J.A.P.; Arnold, M.L. Determining population structure and hybridization for two iris species. Ecol. Evol. 2014, 4, 743–755. [Google Scholar] [CrossRef]
  37. Pritchard, J.K.; Stephens, M.; Donnelly, P. Inference of population structure using multilocus genotype data. Genetics 2000, 155, 945–959. [Google Scholar]
  38. Bettarini, I.; Colzi, I.; Coppi, A.; Falsini, S.; Echevarria, G.; Pazzagli, L.; Selvi, F.; Gonnelli, C. Unravelling soil and plant metal relationships in Albanian nickel hyperaccumulators in the genus Odontarrhena (syn. Alyssum sect. Odontarrhena, Brassicaceae). Plant Soil 2019, 440, 135–149. [Google Scholar] [CrossRef]
  39. Choler, P.; Erschbamer, B.; Tribsch, A.; Gielly, L.; Taberlet, P. Genetic introgression as a potential to widen a species’ niche: Insights from alpine Carex curvula. Proc. Natl. Acad. Sci. USA 2003, 101, 171–176. [Google Scholar] [CrossRef] [Green Version]
  40. Rieseberg, L.H.; Kim, S.-C.; Randell, R.A.; Whitney, K.D.; Gross, B.L.; Lexer, C.; Clay, K. Hybridization and the colonization of novel habitats by annual sunflowers. Genetica 2007, 129, 149–165. [Google Scholar] [CrossRef]
  41. Pfennig, K.S.; Kelly, A.L.; Pierce, A.A. Hybridization as a facilitator of species range expansion. Proc. R. Soc. B Boil. Sci. 2016, 283, 20161329. [Google Scholar] [CrossRef] [Green Version]
  42. Guo, Q. Plant hybridization: The role of human disturbance and biological invasion. Divers. Distrib. 2014, 20, 1345–1354. [Google Scholar] [CrossRef]
  43. Todesco, M.; Pascual, M.A.; Owens, G.L.; Ostevik, K.L.; Moyers, B.T.; Hübner, S.; Heredia, S.M.; Hahn, M.A.; Caseys, C.; Bock, D.G.; et al. Hybridization and extinction. Evol. Appl. 2016, 9, 892–908. [Google Scholar] [CrossRef] [PubMed]
  44. Lamont, B.B.; He, T.; Enright, N.J.; Krauss, S.L.; Miller, B.P. Anthropogenic disturbance promotes hybridization between Banksia species by altering their biology. J. Evol. Biol. 2003, 16, 551–557. [Google Scholar] [CrossRef]
  45. Stankowski, S. Practical Conservation Biology; CSIRO Publishing: Collingwood, Australia, 2005. [Google Scholar]
  46. Soltis, D.E.; Soltis, P.; Tate, J.A. Advances in the study of polyploidy since plant speciation. New Phytol. 2003, 161, 173–191. [Google Scholar] [CrossRef]
  47. Chapman, M.; Abbott, R.J. Introgression of fitness genes across a ploidy barrier. New Phytol. 2009, 186, 63–71. [Google Scholar] [CrossRef] [PubMed]
  48. Jørgensen, M.H.; Ehrich, D.; Schmickl, R.E.; Koch, M.A.; Brysting, A.K. Interspecific and interploidal gene flow in Central European Arabidopsis (Brassicaceae). BMC Evol. Biol. 2011, 11, 346. [Google Scholar] [CrossRef] [Green Version]
  49. Osborne, O.G.; Chapman, M.; Nevado, B.; Filatov, D.A. Maintenance of species boundaries despite ongoing gene flow in ragworts. Genome Biol. Evol. 2016, 8, 1038–1047. [Google Scholar] [CrossRef] [Green Version]
  50. Chapman, M.A.; Hiscock, S.J.; Filatov, D. Genomic divergence during speciation driven by adaptation to altitude. Mol. Biol. Evol. 2013, 30, 2553–2567. [Google Scholar] [CrossRef] [Green Version]
  51. Matute, D.R. The role of founder effects on the evolution of reproductive isolation. J. Evol. Biol. 2013, 26, 2299–2311. [Google Scholar] [CrossRef]
  52. Gustafson, D.J.; Romano, G.; Latham, R.E.; Morton, J.K. Amplified Fragment Length Polymorphism analysis of genetic relationships among the serpentine barrens endemic Cerastium velutinum Rafinesque var. villosissimum Pennell (Caryophyllaceae) and closely related Cerastium Species. J. Torrey Bot. Soc. 2003, 130, 218. [Google Scholar] [CrossRef]
  53. Rajakaruna, N.; Baldwin, B.G.; Chan, R.; DesRochers, A.M.; Bohm, B.A.; Whitton, J. Edaphic races and phylogenetic taxa in the Lasthenia californica complex (Asteraceae: Heliantheae): An hypothesis of parallel evolution. Mol. Ecol. 2003, 12, 1675–1679. [Google Scholar] [CrossRef]
  54. Berglund, A.-B.N.; Dahlgren, S.; Westerbergh, A. Evidence for parallel evolution and site-specific selection of serpentine tolerance in Cerastium alpinum during the colonization of Scandinavia. New Phytol. 2003, 161, 199–209. [Google Scholar] [CrossRef]
  55. Grdiša, M.; Radosavljević, I.; Liber, Z.; Stefkov, G.; Ralli, P.; Chatzopoulou, P.S.; Carović-Stanko, K.; Šatović, Z. Divergent selection and genetic structure of Sideritis scardica populations from southern Balkan Peninsula as revealed by AFLP fingerprinting. Sci. Rep. 2019, 9, 1–14. [Google Scholar] [CrossRef] [Green Version]
  56. Feng, X.-J.; Jiang, G.-F.; Fan, Z. Identification of outliers in a genomic scan for selection along environmental gradients in the bamboo locust, Ceracris kiangsu. Sci. Rep. 2015, 5, 13758. [Google Scholar] [CrossRef] [Green Version]
  57. Rannala, B. The sampling theory of neutral alleles in an island population of fluctuating size. Theor. Popul. Biol. 1996, 50, 91–104. [Google Scholar] [CrossRef] [Green Version]
  58. Russello, M.A.; Kirk, S.L.; Frazer, K.K.; Askey, P.J. Detection of outlier loci and their utility for fisheries management. Evol. Appl. 2011, 5, 39–52. [Google Scholar] [CrossRef]
  59. Wang, T.; Chen, G.; Zan, Q.; Wang, C.; Su, Y.-j. AFLP genome scan to detect genetic structure and candidate loci under selection for local adaptation of the invasive weed Mikania micrantha. PLoS ONE 2012, 7, e41310. [Google Scholar] [CrossRef] [Green Version]
  60. Coppi, A.; Lastrucci, L.; Cappelletti, D.; Cerri, M.; Ferranti, F.; Ferri, V.; Foggi, B.; Gigante, D.; Venanzoni, R.; Viciani, D.; et al. AFLP Approach Reveals Variability in Phragmites australis: Implications for Its Die-Back and Evidence for Genotoxic Effects. Front. Plant Sci. 2018, 9, 386. [Google Scholar] [CrossRef]
  61. Kruckeberg, A.R. The Influences of Lithology on Plant Life. In Geology and Plant Life: The Effects of Landforms and Rock Type on Plants; University Wash Press: Seattle, WA, USA; London, UK, 2002; pp. 160–181. [Google Scholar]
  62. Brady, K.U.; Kruckeberg, A.R.; Bradshaw, H.D., Jr. Evolutionary ecology of plant adaptation to serpentine soils. Annu. Rev. Ecol. Evol. Syst. 2005, 36, 243–266. [Google Scholar] [CrossRef]
  63. Kazakou, E.; Dimitrakopoulos, P.G.; Baker, A.J.M.; Reeves, R.D.; Troumbis, A.Y. Hypotheses, mechanisms and trade-offs of tolerance and adaptation to serpentine soils: From species to ecosystem level. Biol. Rev. 2008, 83, 495–508. [Google Scholar] [CrossRef]
  64. Arnold, B.J.; Lahner, B.; Dacosta, J.M.; Weisman, C.M.; Hollister, J.D.; Salt, D.E.; Bomblies, K.; Yant, L. Borrowed alleles and convergence in serpentine adaptation. Proc. Natl. Acad. Sci. USA 2016, 113, 8320–8325. [Google Scholar] [CrossRef] [Green Version]
  65. Selby, J.P.; Willis, J.H. Major QTL controls adaptation to serpentine soils in Mimulus guttatus. Mol. Ecol. 2018, 27, 5073–5087. [Google Scholar] [CrossRef]
  66. Ohsawa, T.; Ide, Y. Global patterns of genetic variation in plant species along vertical and horizontal gradients on mountains. Glob. Ecol. Biogeogr. 2008, 17, 152–163. [Google Scholar] [CrossRef]
  67. Brooks, R.R. Serpentine and Its Vegetation: A Multidisciplinary Approach; Dioscorides Press: Portland, OR, USA, 1987. [Google Scholar]
  68. Selvi, F. Diversity, geographic variation and conservation of the serpentine flora of Tuscany (Italy). Biodivers. Conserv. 2007, 16, 1423–1439. [Google Scholar] [CrossRef]
  69. Cacho, N.I.; Strauss, S.Y. Occupation of bare habitats, an evolutionary precursor to soil specialization in plants. Proc. Natl. Acad. Sci. USA 2014, 111, 15132–15137. [Google Scholar] [CrossRef] [Green Version]
  70. Whiting, S.N.; Reeves, R.D.; Richards, D.; Johnson, M.S.; Cooke, J.A.; Malaisse, F.; Paton, A.; Smith, J.A.C.; Angle, J.S.; Chaney, R.L.; et al. Research priorities for conservation of metallophyte biodiversity and their potential for restoration and site remediation. Restor. Ecol. 2004, 12, 106–116. [Google Scholar] [CrossRef] [Green Version]
  71. Rusterholz, H.-P.; Aydin, D.; Baur, B. Population structure and genetic diversity of relict populations of Alyssum montanum on limestone cliffs in the Northern Swiss Jura mountains. Alp. Bot. 2012, 122, 109–117. [Google Scholar] [CrossRef] [Green Version]
  72. Dilek, Y.; Furnes, H. Structure and geochemistry of Tethyan ophiolites and their petrogenesis in subduction rollback systems. Lithos 2009, 113, 1–20. [Google Scholar] [CrossRef]
  73. Li, Y.-M.; Chaney, R.L.; Brewer, E.P.; Angle, A.J.S.; Nelkin, J. Phytoextraction of nickel and cobalt by hyperaccumulator Alyssum Species grown on nickel-contaminated soils. Environ. Sci. Technol. 2003, 37, 1463–1468. [Google Scholar] [CrossRef]
  74. Tappero, R.; Peltier, E.; Gräfe, M.; Heidel, K.; Ginder-Vogel, M.; Livi, K.J.T.; Rivers, M.L.; Marcus, M.A.; Chaney, R.L.; Sparks, D.L. Hyperaccumulator Alyssum murale relies on a different metal storage mechanism for cobalt than for nickel. New Phytol. 2007, 175, 641–654. [Google Scholar] [CrossRef] [Green Version]
  75. Bani, A.; Echevarria, G.; Sulçe, S.; Morel, J.L.; Mullai, A. In-situ phytoextraction of Ni by a native population of Alyssum murale on an ultramafic site (Albania). Plant Soil 2007, 293, 79–89. [Google Scholar] [CrossRef]
  76. Bani, A.; Echevarria, G.; Sulçe, S.; Morel, J.L. Improving the agronomy of Alyssum murale for extensive phytomining: A five-year field study. Int. J. Phytoremediation 2014, 17, 117–127. [Google Scholar] [CrossRef] [PubMed]
  77. Bani, A.; Echevarria, G.; Zhang, X.; Benizri, E.; Laubie, B.; Morel, J.L.; Simonnot, M.-O. The effect of plant density in nickel-phytomining field experiments with Alyssum murale in Albania. Aust. J. Bot. 2015, 63, 72–77. [Google Scholar] [CrossRef]
  78. Calderon-Aguilera, L.E.; Rivera-Monroy, V.H.; Porter-Bolland, L.; Martínez-Yrízar, A.; Ladah, L.B.; Martínez-Ramos, M.; Alcocer, J.; Santiago-Pérez, A.L.; Hernandez-Arana, H.A.; Reyes-Gómez, V.M.; et al. An assessment of natural and human disturbance effects on Mexican Chaneya ecosystems: Current trends and research gaps. Biodivers. Conserv. 2012, 21, 589–617. [Google Scholar] [CrossRef]
  79. Doyle, J.J.; Doyle, J.L. Isolation of plant DNA from fresh tissue. Focus 1990, 12, 13–15. [Google Scholar]
  80. Cheng, T.; Xu, C.; Lei, L.; Li, C.; Zhang, Y.; Zhou, S. Barcoding the kingdom Plantae: New PCR primers for ITS regions of plants with improved universality and specificity. Mol. Ecol. Resour. 2016, 16, 138–149. [Google Scholar] [CrossRef] [PubMed]
  81. Taberlet, P.; Gielly, L.; Pautou, G.; Bouvet, J. Universal primers for amplification of three non-coding regions of chloroplast DNA. Plant Mol. Biol. 1991, 17, 1105–1109. [Google Scholar] [CrossRef]
  82. Rosati, L.; Coppi, A.; Farris, E.; Fascetti, S.; Becca, G.; Peregrym, M.; Tan, K.; Selvi, F. The genus Gymnospermium (Berberidaceae) in Italy: Identity and relationships of the populations at the western limit of the genus range. Plant Biosyst. Int. J. Deal. Asp. Plant Biol. 2018, 153, 796–808. [Google Scholar] [CrossRef]
  83. Hall, T.A. BioEdit: A user-friendly biological sequence alignment editor analysis program for Windows 95/98/NT. Nucleic Acids Symp. Ser. 1999, 41, 95–98. [Google Scholar]
  84. Katoh, K.; Standley, D.M. MAFFT multiple sequence alignment software version 7: Improvements in performance and usability. Mol. Biol. Evol. 2013, 30, 772–780. [Google Scholar] [CrossRef] [Green Version]
  85. Katoh, K. MAFFT version 5: Improvement in accuracy of multiple sequence alignment. Nucleic Acids Res. 2005, 33, 511–518. [Google Scholar] [CrossRef]
  86. Simmons, M.P.; Ochoterena, H. Gaps as characters in sequence-based phylogenetic analyses. Syst. Biol. 2000, 49, 369–381. [Google Scholar] [CrossRef] [Green Version]
  87. Borchsenius, F. FastGap 1.2. 2009. Available online: http://www.aubot.dk/FastGap_home.htm (accessed on 23 September 2014).
  88. Ronquist, F.; Huelsenbeck, J.P. MrBayes 3: Bayesian phylogenetic inference under mixed models. Bioinformatics 2003, 19, 1572–1574. [Google Scholar] [CrossRef] [Green Version]
  89. Page, R.D.M. TreeView: An application to display phylogenetic trees on personal computers. Bioinformatics 1996, 12, 357–358. [Google Scholar] [CrossRef] [Green Version]
  90. Tamura, K.; Nei, M.; Kumar, S. Prospects for inferring very large phylogenies by using the neighbor-joining method. Proc. Natl. Acad. Sci. USA 2004, 101, 11030–11035. [Google Scholar] [CrossRef] [Green Version]
  91. Tamura, K.; Filipski, A.; Kumar, S. MEGA6: Molecular Evolutionary Genetics Analysis Version 6.0. Mol. Biol. Evol. 2013, 30, 2725–2729. [Google Scholar] [CrossRef] [Green Version]
  92. Leipold, M.; Tausch, S.; Hirtreiter, M.; Poschlod, P.; Reisch, C. Sampling for conservation genetics: How many loci and individuals are needed to determine the genetic diversity of plant populations using AFLP? Conserv. Genet. Resour. 2018, 12, 99–108. [Google Scholar] [CrossRef]
  93. Meyer, C.-L.; Vitalis, R.; Saumitou-Laprade, P.; Castric, V. Genomic pattern of adaptive divergence in Arabidopsis halleri, a model species for tolerance to heavy metal. Mol. Ecol. 2009, 18, 2050–2062. [Google Scholar] [CrossRef]
  94. Meudt, H.M.; Clarke, A.C. Almost forgotten or latest practice? AFLP applications, analyses and advances. Trends Plant Sci. 2007, 12, 106–117. [Google Scholar] [CrossRef]
  95. Dufresne, F.; Stift, M.; Vergilino, R.; Mable, B.K. Recent progress and challenges in population genetics of polyploid organisms: An overview of current state-of-the-art molecular and statistical tools. Mol. Ecol. 2014, 23, 40–69. [Google Scholar] [CrossRef] [Green Version]
  96. Čertner, M.; Kolář, F.; Frajman, B.; Winkler, M.; Schönswetter, P. Massive introgression weakens boundaries between a regionally endemic allopolyploid and a widespread congener. Perspect. Plant Ecol. Evol. Syst. 2020, 42, 125502. [Google Scholar] [CrossRef]
  97. Bonin, A.; Ehrich, D.; Manel, S. Statistical analysis of amplified fragment length polymorphism data: A toolbox for molecular ecologists and evolutionists. Mol. Ecol. 2007, 16, 3737–3758. [Google Scholar] [CrossRef]
  98. Excoffier, L.; Smouse, P.E.; Quattro, J.M. Analysis of molecular variance inferred from metric distances among DNA haplotypes: Application to human mitochondrial DNA restriction data. Genetics 1992, 131, 479–491. [Google Scholar]
  99. Schneider, S.; Roessli, D.; Excoffier, L. Arlequin: A Software for Population Genetics Data Analysis; Genetics and Biometry Laboratory, University of Geneva: Geneva, Switzerland, 2000. [Google Scholar]
  100. Stift, M.; Kolář, F.; Meirmans, P.G. Structure is more robust than other clustering methods in simulated mixed-ploidy populations. Heredity 2019, 123, 429–441. [Google Scholar] [CrossRef]
  101. Earl, D.A.; von Holdt, B.M. Structure harvester: A website and program for visualizing Structure output and implementing the Evanno Mehtod. Conserv. Genet. Resour. 2012, 4, 359–361. [Google Scholar] [CrossRef]
  102. Huson, D.H.; Bryant, D. Application of phylogenetic networks in evolutionary studies. Mol. Biol. Evol. 2005, 23, 254–267. [Google Scholar] [CrossRef]
  103. Nei, M. Molecular Evolutionary Genetics; Columbia University Press: New York, NY, USA, 1987. [Google Scholar]
  104. Beaumont, M.A.; Nichols, R.A. Evaluating loci for use in the genetic analysis of population structure. Proc. R. Soc. B Boil. Sci. 1996, 263, 1619–1626. [Google Scholar] [CrossRef]
  105. Beaumont, M.A.; Balding, D.J. Identifying adaptive genetic divergence among populations from genome scans. Mol. Ecol. 2004, 13, 969–980. [Google Scholar] [CrossRef]
  106. Rannala, B.; Hartigan, J.A. Estimating gene flow in island populations. Genet. Res. 1996, 67, 147–158. [Google Scholar] [CrossRef]
  107. Burr, T.L. Quasi-Equilibrium theory for the distribution of rare alleles in a subdivided population: Justification and implications. Theor. Popul. Biol. 2000, 57, 297–306. [Google Scholar] [CrossRef]
  108. Foll, M. BayeScan v2.1 User Manual. 2012. Available online: http://cmpg.unibe.ch/software/BayeScan/ (accessed on 11 November 2016).
  109. Yang, A.; Dick, C.W.; Yao, X.; Huang, H. Impacts of biogeographic history and marginal population genetics on species range limits: A case study of Liriodendron chinense. Sci. Rep. 2016, 6, 25632. [Google Scholar] [CrossRef] [Green Version]
  110. Slatkin, M. A measure of population subdivision based on microsatellite allele frequencies. Genetics 1995, 139, 457–462. [Google Scholar] [PubMed]
  111. Kumar, S.; Stecher, G.; Li, M.; Knyaz, C.; Tamura, K. MEGA X: Molecular Evolutionary Genetics Analysis across computing platforms. Mol. Biol. Evol. 2018, 35, 1547–1549. [Google Scholar] [CrossRef] [PubMed]
  112. Saitou, N.; Nei, M. The neighbor-joining method: A new method for reconstructing phylogenetic trees. Mol. Biol. Evol. 1987, 4, 406–425. [Google Scholar] [CrossRef] [PubMed]
  113. Oksanen, J.; Guillaume Blanchet, F.; Friendly, M.; Kindt, R.; Legendre, P.; McGlinn, D.; Minchin, P.R.; O’Hara, R.B.; Simpson, G.L.; Solymos, P.; et al. Vegan: Community Ecology Package. R Package Version 2.5-4. 2019. Available online: http://vegan.r-forge.r-project.org (accessed on 1 April 2017).
  114. Whitlock, M.C.; McCauley, D.E. Indirect measures of gene flow and migration: FST≠1/(4Nm+1). Heredity 1999, 82, 117–125. [Google Scholar] [CrossRef]
  115. Pagès, J. Analyse factorielle multiple appliquée aux variables qualitatives et aux données mixtes. Rev. Stat. Appl. 2002, 4, 5–37. [Google Scholar]
  116. Lê, S.; Josse, J.; Husson, F. FactoMineR: An R Package for multivariate analysis. J. Stat. Softw. 2008, 25, 1–18. [Google Scholar] [CrossRef] [Green Version]
  117. R Core Team. R: A Language and Environment for Statistical Computing; R Foundation for Statistical Computing: Vienna, Austria, 2017; Available online: https://www.R-project.org (accessed on 1 April 2017).
Figure 1. Bayesian consensus phylogram from ITS-5.8S sequences showing relationships of taxa and accessions of Odontarrhena from Albania (in blue). Posterior probability values > 80% are shown at the corresponding nodes.
Plants 09 01686 g001
Figure 2. Bayesian clustering of AFLP-data from STRUCTURE, showing: (A) Relative proportion of each of the six genetic groups (1–6) across the 32 populations (width of the colored band); (B) proportion of the population membership to each of the six genetic groups; populations including more than one group (color) are admixed; diploid populations are indicated (red box); (C) proportion of the individual membership to the six genetic groups across the 32 populations (374 individuals); individuals including more than one group (color) are admixed.
Plants 09 01686 g002
Figure 3. (A) Principal component analysis biplot showing relationships between the six genetic groups (K; numbers as in Figure 2A and the six Albanian taxa of Odontarrhena (dots are diploid taxa, squares are tetraploids); (B) Scattergram from multifactorial analysis showing the direction of variation of the number of genetic groups per population (KPOP), genetically admixed individuals (MIND), number of outlier loci (OUTL) and heterozygosity HE in relation to anthropic site disturbance (ASD), altitude (ALTILOG), and Ni and Cr soil concentration. The cos2 values, represented in the color scale barplot, show the contribution of the variables on both dimensions (Dim 1 and Dim 2).
Plants 09 01686 g003
Figure 4. (A) Distribution of the 137 loci (black dots) detected by BayeScan analysis of 374 individual samples of Albanian Odontarrhena; dots that fall over the red threshold line [Log (posterior odds, PO) = 0.5]) are identified as outlier loci. (B) variation of the mean number of outliers per population with altitude (log); colours and species names abbreviations follow Figure 1 and Figure 6.
Plants 09 01686 g004
Figure 5. (A) Box-whisker plots of outlier variation across the six Albanian taxa (ALBI: O. albiflora; CHAL: O. chalcidica; DECI: O. decipiens; MORA: O. moravensis; RIGI: O. rigida; SMOL: O. smolikana subsp. glabra); asterisks indicate the serpentine obligate taxa, and letters indicate statistically different groups at p < 0.05; (B) variation in serpentine (S) vs. non-serpentine (NS) accessions.
Plants 09 01686 g005
Figure 6. Neighbor-joining tree based on genetic distances between populations from the type localities of the taxa endemic to Albania and of those described from the same country but currently included in either O. chalcidica (pops. 1, 2, 12, 25) or O. decipiens (pops. 6, 23, 30; see Supplementary Table S1).
Plants 09 01686 g006
Figure 7. Levels of gene flow estimated as number of migrants (Nm) between the four tetraploid and two diploid Albanian taxa of Odontarrhena; thickness of the lines connecting the species is proportional to the estimated level of gene flow; dotted and solid lines indicate Nm values <3 (non-significant) and >3 (significant), respectively; taxon name abbreviations are as in Figure 5A.
Plants 09 01686 g007
Figure 8. Location of the 32 sampled populations of Odontarrhena with species identity (colors) and distribution of the major ultramafic outcrops in Albania (dark grey spots).
Plants 09 01686 g008
Table 1. Partitioning of genetic variance. AMOVA was performed at three hierarchical levels to test the differentiation between 374 individual samples from 32 populations and six species. The table shows: degrees of freedom (df), sum of squared deviations, variance component estimates, percentages of total variance contributed by each component, and the probability of obtaining a more extreme component estimate by chance alone (p). p-Values were estimated with 1023 permutations.
Source of VariationdfSum of SquaresVariance
Components
Percentage
of Variation
p-Values
Among species5491.9620.239491.06n.s.
Among all populations within species262234.7175.9653326.50<0.0001
Within all populations3425576.42016.3053272.44<0.0001
Total3738302.59922.51014
Among diploids199.782.2695811.19<0.0001
Within diploids701260.25018.0035788.81<0.0001
Total diploids711359.95820.27315
Among tetraploids 252213.6336.1836226.99<0.0001
Within tetraploids 2764617.50316.7300873.01<0.0001
Total tetraploids3016831.13622.91371
Table 2. Main parameters of genetic diversity in Albanian populations and taxa of Odontarrhena: number of genetic groups (reaching a proportion of at least 10%) in each population (KPop) and number of genetically admixed individuals (Mind), number (no. poly) and percentage (%poly) of polymorphic loci; population heterozygosity (He), mean species heterozygosity (Hs), mean number of outlier loci per population (Out) and mean genetic distance between populations within taxa (FST).
Taxa/Pop.KPopMindNo. Poly%polyHeHsOutFST
O. albiflora 0.113
26204935.7660.113 2.08
O. chalcidica 0.247 0.267
14311382.480.3236.25
23411483.210.3386.92
3338159.120.2174.83
5227454.020.1963.25
74610173.720.2614.83
8214734.310.1260.83
9216144.530.1470.82
1141010173.720.2755.25
124712087.590.3355.82
15216849.640.1891.80
17108159.120.2011.67
18208662.770.2151.83
21549267.150.2512.92
243210375.180.2965.73
25217252.560.1913.83
313111382.480.3173.08
322011483.210.3224.92
O. decipiens 0.231 0.224
4438159.120.1852.50
6469670.070.2525.75
23427856.930.1992.67
284712087.590.3485.83
30326950.370.1712.83
O. moravensis 0.239 0.279
192010375.180.2733.17
204511080.290.3143.67
27204532.840.1302.08
O. rigida 0.185 0.230
10206950.360.1712.08
13108058.390.2323.58
14206950.360.1531.08
O. smolikana 0.293 0.302
16209569.340.2672.70
222411382.480.3526.45
29109468.610.2593.50
Table 3. Taxa of genus Odontarrhena from Albania analyzed in the present study, with ploidy level, distribution, elevation, and habitat; based on [22].
TaxonPloidy LevelDistributionElevation (m a.s.l.)Habitat
O. albiflora (F.K.Mey.) Španiel, Al-Shehbaz, D.A.German & Marhold4xEndemic E Albania900–1300Limestone cliffs
O. chalcidica (Janka) Španiel, Al-Shehbaz, D.A.German & Marhold4xBalkans; throughout Albania50–1300Fields, roadsides; on various soil types, more frequently on serpentine
O. decipiens (Nyár.) L.Cecchi & Selvi4xBalkans; C & N Albania220–1900Fields, roadsides; only on serpentine
O. moravensis (F.K.Mey.) L.Cecchi & Selvi2xEndemic E Albania800–1500Serpentine rocks and screes
O. rigida (Nyár.) L.Cecchi & Selvi2xEndemic C Albania200–1250Serpentine rocks and screes
O. smolikana (Nyár.) Španiel, Al-Shehbaz, D.A.German & Marhold subsp. glabra (Nyár.) L.Cecchi & Selvi4xEndemic C and N Albania1100–2000Serpentine rocks and screes
Table 4. Concentration of Ni (µg g−1 d.w.), Co (µg g−1 d.w.), Cr (µg g−1 d.w.), Ca (mg g−1 d.w.), and Mg (mg g−1 d.w.) in soils from the eight localities analyzed in this work. Values are the means ± standard deviation.
Element Concentration in Soils
Pop. Site Ni
(µg g−1)
Co
(µg g−1)
Cr
(µg g−1)
Ca
(mg g−1)
Mg
(mg g−1)
3 (O. chalcidica)4602 ± 252274 ± 522315 ± 1391.4 ± 0.394.4 ± 33.1
5 (O. chalcidica)3695 ± 299240 ± 641951 ± 1251.1 ± 0.472.2 ± 11.5
9 (O. chalcidica)728 ± 1363 ± 1546 ± 140.15 ± 0.0116.0 ± 0.6
20 (O. moravensis)2451 ± 256118 ± 4881 ± 307.0 ± 0.795.9 ± 4.3
24 (O. chalcidica)3860 ± 107146 ± 65550 ± 290.17 ± 0.03145.3 ± 2.6
26 (O. albiflora)144 ± 619 ± 1155 ± 6135.8 ± 26.94.9 ± 0.9
31 (O. chalcidica)1098 ± 1889 ± 17815 ± 13416.3 ± 2.0109.4 ± 1.8
32 (O. chalcidica)4289 ± 55566 ± 3678 ± 980.7 ± 0.1147.9 ± 3.3
Publisher’s Note: MDPI stays neutral with regard to jurisdictional claims in published maps and institutional affiliations.

