Article

Genome Survey Sequencing of In Vivo Mother Plant and In Vitro Plantlets of Mikania cordata

1
School of Life Sciences, Sun Yat-sen University, Guangzhou 510275, China
2
Research Institute of Sun Yat-Sen University in Shenzhen, Shenzhen 518057, China
3
College of Life Sciences, South China Agricultural University, Guangzhou 510642, China
*
Authors to whom correspondence should be addressed.
These authors are equally contributed.
Plants 2020, 9(12), 1665; https://doi.org/10.3390/plants9121665
Submission received: 22 October 2020 / Revised: 21 November 2020 / Accepted: 25 November 2020 / Published: 27 November 2020
(This article belongs to the Section Plant Genetics, Genomics and Biotechnology)

Abstract

:
Mikania cordata, the only native congener of the invasive weed Mikania micrantha in China, is an ideal species for comparative study to reveal the invasion mechanism. However, its genome resources are lagging far behind its congener, which limits the comparative genomic analysis. Our goal is to characterize the genome of M. cordata by next-generation sequencing and propose a scheme for long-read genome sequencing. Previous studies have shown that the genomic resources of the host plant would be affected by the endophytic microbial DNA. An aseptic sample of M. cordata will ensure the proper genome in downstream analysis. Because endophytes are ubiquitous in the greenhouse-grown M. cordata, the in vitro culture with cefotaxime or timentin treatment was undertaken to obtain the aseptic plantlets. The in vivo mother plant and in vitro plantlets were used to survey the genome. The microbial contamination in M. cordata was recognized by blast search and eliminated from the raw reads. The decontaminated sequencing reads were used to predict the genome size, heterozygosity, and repetitive rate. The in vivo plant was so contaminated that microbes occupied substantial sequencing resources and misled the scaffold assembly. Compared with cefotaxime, treatment with timentin performed better in cultivating robust in vitro plantlets. The survey result from the in vitro plantlets was more accurate due to low levels of contamination. The genome size was estimated to be 1.80 Gb with 0.50% heterozygosity and 78.35% repetitive rate. Additionally, 289,831 SSRs were identified in the genome. The genome is heavily contaminated and repetitive; therefore, the in vitro culture technique and long-read sequencing technology are recommended to generate a high-quality and highly contiguous genome.

Graphical Abstract

1. Introduction

Mikania cordata (Burm. f.) B.L. Robinson, the only congener of the notorious invasive weed Mikania micrantha H.B. Kunth in China, is an herbaceous stem-twiner native to tropical Asia [1]. Mikania cordata is distributed restrictively in Southeast Asia and South China including Hainan, Taiwan, and southeast Yunnan [1]. It is used as an ethnomedicinal plant in the treatment of cuts and wounds [2]. Mikania comprising ca. 450 species is the largest genus in the tribe Eupatorieae of the Asteraceae family [1]. There are only two species of the genus Mikania in China: a native species M. cordata and an introduced species M. micrantha [1]. Both are perennial vines with slender stems, heart-shaped leaves, and pappus-bearing achenes [1,3]. Their appearance so closely resembles each other that it is hard to distinguish M. cordata from M. micrantha [4,5].
Mikania micrantha, also known as “mile-a-minute” weed, is native to tropical America and has spread through Asia and the South Pacific [6]. The creeping and climbing habits enable M. micrantha to smother the host plants by penetrating crowns and blocking sunlight [7]. Mikania micrantha, as one of the top 100 worst invasive species, has caused severe damage to natural ecosystems and substantial economic losses [8]. On the contrary, M. cordata grows at a relatively slow rate without ecological harm [9]. Therefore, M. cordata and M. micrantha are a perfect couple for comparative study which can provide novel insights into the successful establishment of introduced species [10]. Previous comparative studies of M. cordata and M. micrantha mainly focus on physiological traits [9], chloroplast genome [11], and transcriptome [12], whereas the genomic level analysis lacks. The genome of M. micrantha reveals that high photosynthetic efficiency and capability contribute to the successful invasion [13]. Comparative genomics, rather than independent analysis, thus can determine the root causes of functional trait divergence [14,15]. However, the genomic resources of M. cordata are lagging far behind M. micrantha. The high-quality genome of M. cordata is urgently necessary for the forthcoming comparative genomics.
Plants live together with covert endophytes extensively, although many plant genomes have been sequenced and assembled [16]. Therefore, the host DNA may be contaminated with foreign DNA during extraction. The contaminant DNA, if not eliminated, will be sequenced and assembled along with the host DNA [17]. For example, in the genome of Saccharina japonica and the domesticated olive, up to 1.5% and 1.3% scaffolds were identified as contaminants, respectively, which were missed in the published genome [18,19]. The most common method to filter contaminants in sequencing is to trim the nontarget sequences in silico based on nucleotide similarity [20], which however risks eliminating sequences from the target organism because of extensive horizontal gene transfer between plant and microbes [21]. In this context, obtaining the aseptic sample represents a fundamental solution for contamination issues. There have been reports that the in vitro aseptic plantlets were used for whole-genome sequencing, such as algae Spirogloea muscicola, Mesotaenium endlicherianum [22], and poppy family Macleaya cordata [23]. For Mikania spp., several endophytes are documented, which probably poses the biggest challenge for the axenic culture. Recently, nine fungal endophytes have been isolated from the leaves, twigs, and roots of M. cordata [24]. The bacterial endophytes have been identified in M. micrantha as well [25]. Additionally, more than 90% of the plantlets contaminated by endophytic bacteria or fungi have been found in micropropagation of Mikania glomerate even after surface disinfection [26]. We have also encountered microbial growth during the in vitro culture of M. cordata. Further, antibiotics were incorporated into culture media to suppress bacterial growth. Specifically, the bacterial inhibitory effect of two types of β-lactam antibiotics, the widely used cefotaxime (CTX) and the novel timentin (TIM) [27], were assessed on the micropropagation of M. cordata in the present study. Since micropropagation enables to efficiently generate genetically faithful clones via tissue culture [28,29], it is reasonable to apply the method to obtain multiple identical plantlets for genome sequencing.
Plant genomes are typically repetitive, which are too complicated to de novo assemble by Illumina short-read sequencing [30]. In this respect, long-read sequencing may exceed the repetitive region in genomes and successfully assemble the contiguous genome [31]. Nevertheless, due to the costly nature of long-read sequencing, it is a convention to perform short-read sequencing in advance. Genome survey sequencing provides a cost-effective strategy to estimate genome size, heterozygosity, and repetitive rate based on short-read data [32]. More importantly, it can also be applied to evaluate the simple sequence repeat (SSR) markers at the genome level. In this work, a micropropagation protocol for producing visibly aseptic M. cordata has been developed, and the genome of M. cordata has been characterized for the first time. It will help comprehensively for scheming the subsequent long-read sequencing of M. cordata genome.

2. Results

2.1. Micropropagation of M. cordata

A total of 51 apical and axillary shoots of M. cordata was collected as explant donor of in vitro culture (Figure 1a). Of the antibiotic-free group served by 11 explants, 7 explants were colonized by bacteria while the others were killed by surface disinfection (Figure 1b, Table 1). Fungi colonized 3 of the 20 explants in the CTX-treated group. By contrast, bacteria and fungi colonized four and one of the 20 explants, respectively, in the TIM-treated group (Figure 1c). Initially, five explants were cultured on each Murashige and Skoog (MS) medium. The contaminated explants were discarded once bacteria or fungi appeared, and the remaining explants in the medium were transferred to a fresh medium. In all instances, the microbial colonization became visible within 2 weeks. After 4 weeks of cultivation, four (CTX-treated) and five (TIM-treated) explants were nonviable and also discarded.
Consequently, 11 (CTX-treated) and eight (TIM-treated) explants sprouted after 2 weeks of cultivation and reached up about 2–3 cm in height after 6 weeks in sprouting media (Figure 1d,e, Table 1). The sprouted plantlets were transferred to the rooting media with half of the initial antibiotic concentrations. During the rooting phase, fungi colonized on only one plantlet (TIM-treated) (Table 1). After 8 weeks of cultivation in rooting media, six (CTX-treated) and all the seven (TIM-treated) plantlets rooted (Table 1). The plantlets in the TIM-treated group tended to grow lush roots with large leaves (Figure 1g). In the CTX-treated group, however, the plantlets had sparse roots and small leaves (Figure 1f).
Treatment of 0.3 g·L−1 TIM generated well-rooted plantlets; hence, TIM was the only antibiotic used in the subsequent subculture. The axillary shoots of aseptic plantlets from two experimental groups were cut off and subcultured on 1/2 MS media supplemented with TIM. All the plantlets transferring from CTX-containing media to TIM enabled to root. After two rounds of large-scale propagation, more than 300 visibly aseptic plantlets were obtained (Table 1), which met the requirement of DNA extraction. Additionally, the leaves of a batch of aseptic plantlets were harvested for genome survey sequencing. Moreover, most of the ~100 plantlets in long-term maintenance (>300 days) were still visibly aseptic though latent or exogenous microbes grew in a few cultures. Although our goal was to generate aseptic plantlets instead of to establish ex vitro plants, the plantlets were able to establish ex vitro after acclimatization (Figure 1h).

2.2. Sequencing, Contigs Assembly, and Preliminary GC Depth Profiling

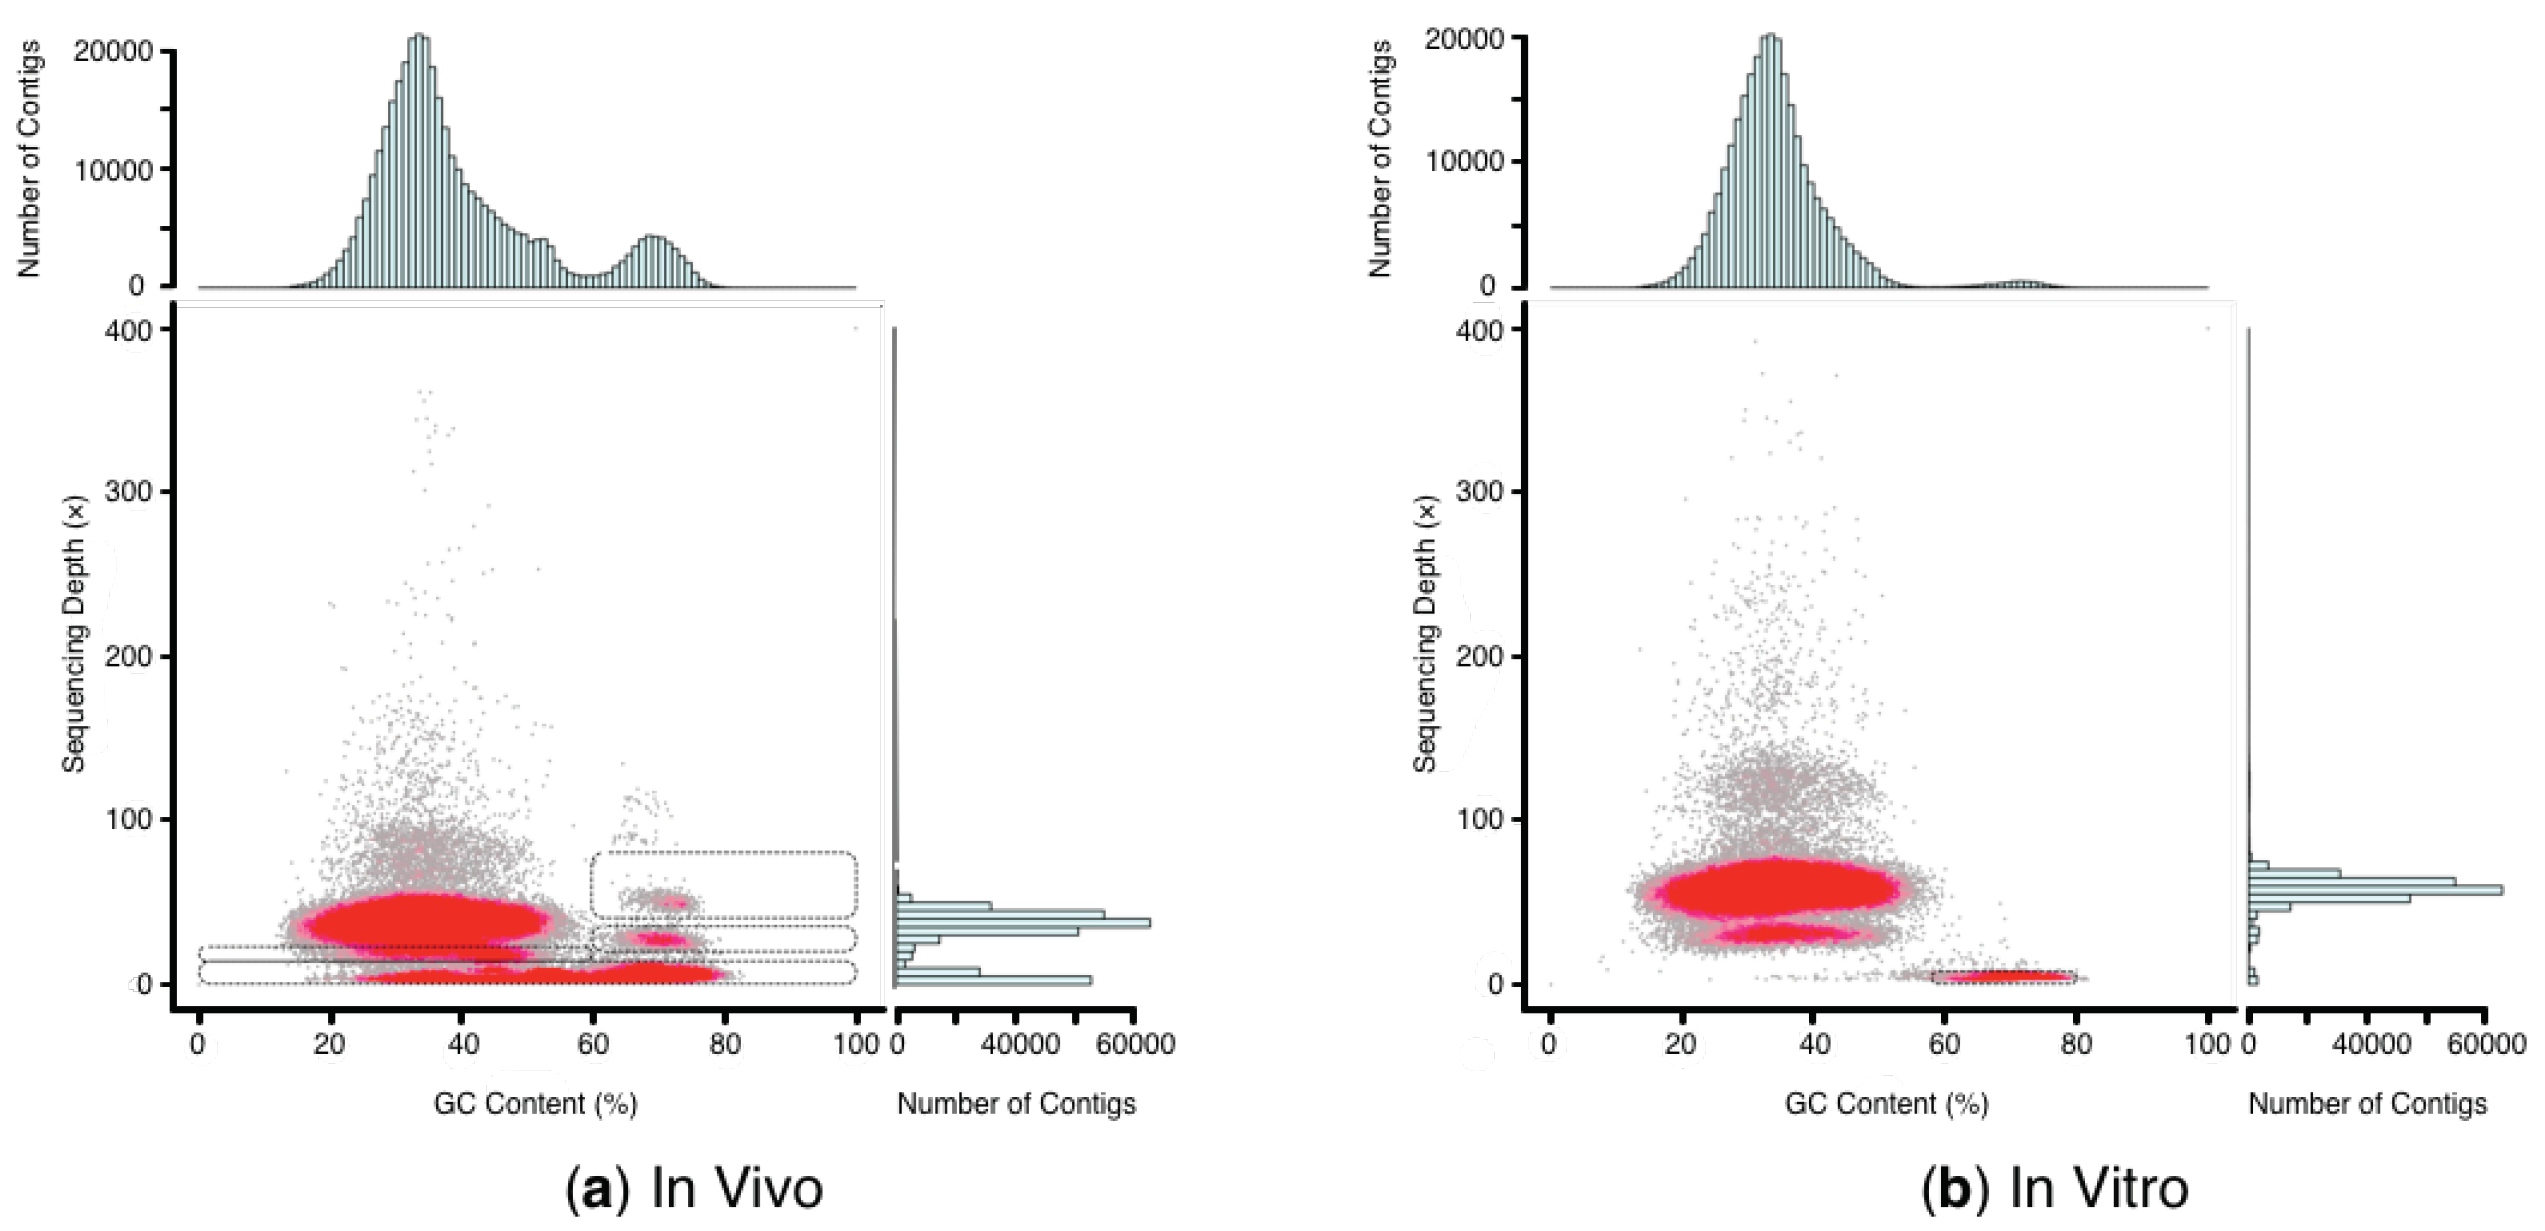
Through Illumina sequencing, a total of 135.4 Gb and 176.5 Gb raw reads were obtained from the in vivo and in vitro culture of M. cordata with 89.94% and 92.97% Q30 bases scores, respectively. After removing low-quality reads, 120.1 Gb (in vivo) and 154.3 Gb (in vitro) clean reads were generated. The GC content from the in vivo plant is 37.95%, which is higher than the 36.74% GC content from in vitro plantlets (Table 2). As shown in Figure 2, the GC content and sequencing depth distribution of the >500 bp contigs were plotted, and the red regions represented the high-density portions of the contigs. For in vivo plant, most contigs were concentrated in 20−50% GC content and approximately 25−50× depth region. There were also several high-density stray regions in 20−80% GC content under 15× depth and in 60−100% GC content between 20−80× depth, which may be contributed by the microbial contaminant. For in vitro plantlets, there were three distinct high-density regions. The highest density occurred in the region of 20−50% GC content and around 50−80× depth. Of the same GC content but around 40× depth was another high-density region. The dense stray regions between 57−80% under 10× depth may be caused by the microbial contaminant. The stray regions of in vitro plantlets were shrunk remarkably compared to those of in vivo M. cordata.

2.3. Identification and Filtration of Genomic Contaminants

Contigs in the stray regions were extracted to confirm their origin. The contigs in four regions from in vivo plant were extracted: 0−100% GC content at 0−14× depth, 0−60% GC content at 14−24× depth, 60−100% GC content at 20−35× depth, and 60−100% GC content at 40−80× depth. The contigs in 57−80% GC content at 0−10× depth from in vitro plantlets were extracted. The top five species distribution of contigs in stray regions was listed in Table 3. The contigs that hit microbes are far less from in vitro plantlets than those from in vivo plant. In the stray regions from in vivo plant, there were overwhelming contigs that hit Fusarium fujikuroi, an endophytic fungus capable of causing various types of plant diseases [33]. The most dominant contigs in the high GC content region of both samples hit Methylobacterium spp. which were known as the plant growth-promoting bacteria [34]. Of the stray region of 14−24× depth and 0−60% GC content from in vivo plant, contigs were aligned to plant sequences (the top five) followed by a few microbe ones (see Supplementary Table S1). This indicated that the stray region mainly consisted of the low-depth contigs of M. cordata.

2.4. Genome Assembly and GC Depth Profiling after In Silico Decontamination

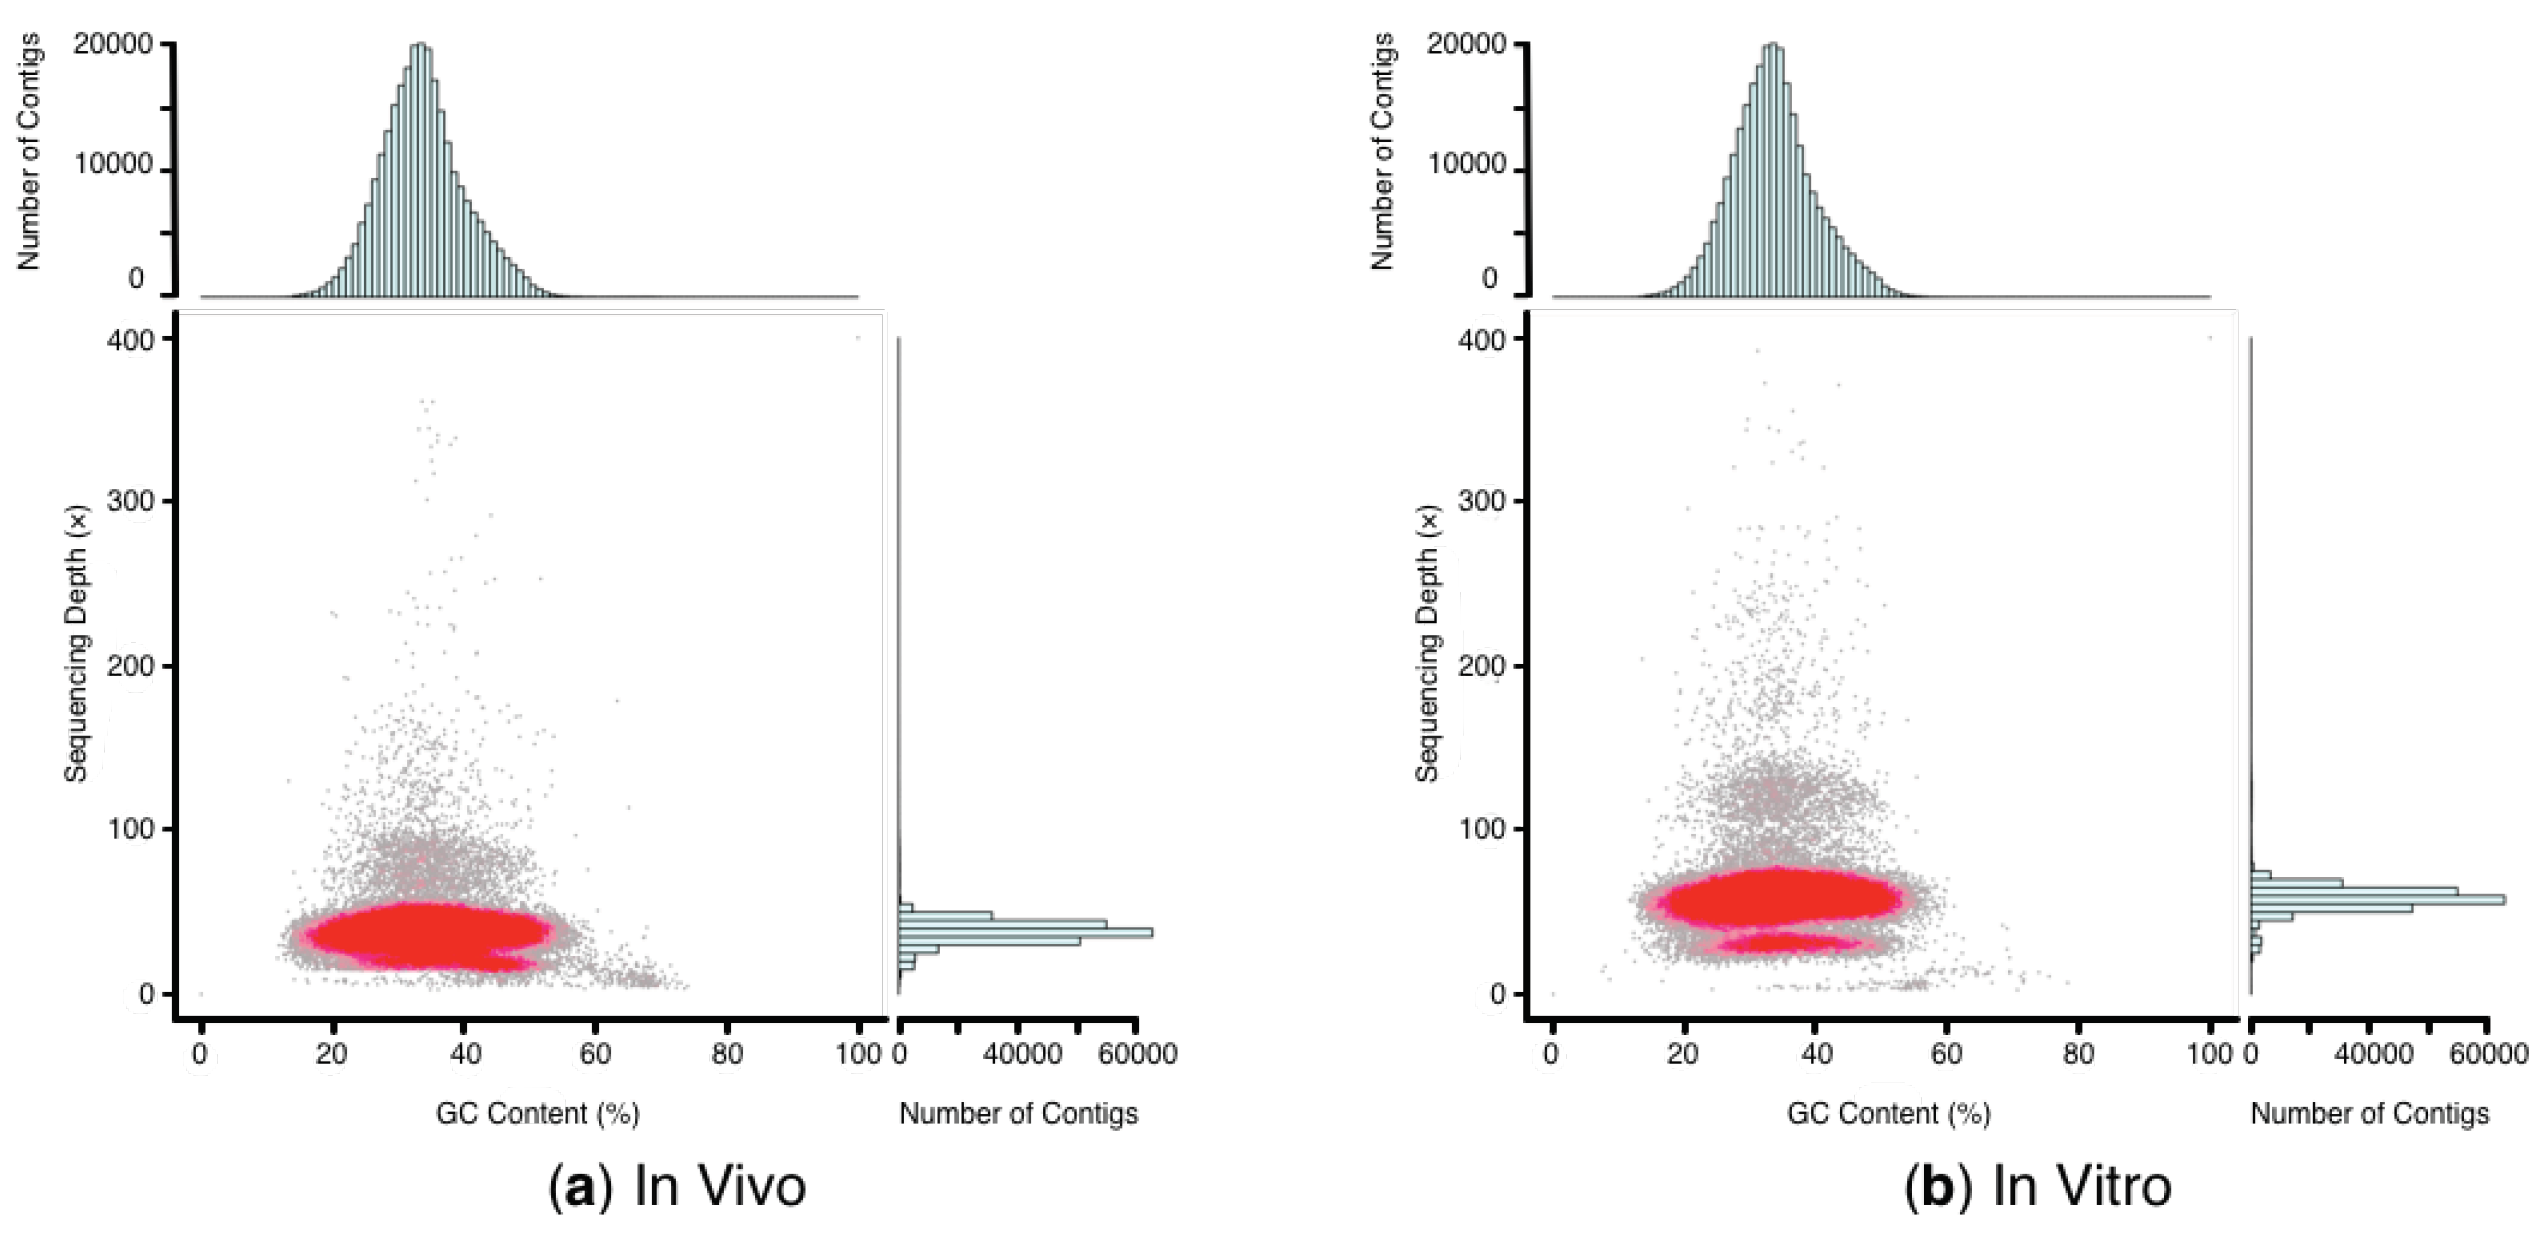
The clean reads and GC content from in vivo plant were greatly decreased by 10.5 Gb and 1.01% after decontamination, respectively. By contrast, only 0.1 Gb clean reads from in vitro plantlets were filtered out, and GC content was slightly decreased by 0.02% (Table 4). A total of 3,555,786 (in vivo) and 3,511,473 (in vitro) >100 bp contigs were assembled, with N50 of 352 bp and 312 bp, respectively (Table 4). After decontamination, the GC depth distribution results showed that the stray regions were dramatically shrunk in both cases (Figure 3). However, there remained a small stray region at low depth with high GC content for in vivo plant, probably caused by the unfiltered microbes with high GC content. Due to the relatively high sequencing depth of in vitro plantlets, there were two distinct high-density regions around 76× and 38×, which might be derived from the homologous and heterologous sequences in the genome.
The >100 bp contigs were further assembled into 1,443,212 (in vivo) and 1,526,309 (in vitro) scaffolds, with N50 of 3087 bp and 2570 bp, respectively (Table 4). The scaffold assembly consisted of 4.33% (in vivo) and 5.02% (in vitro) N bases. The longest contig and scaffold from in vivo plant unusually exceeded those from in vitro plantlets (Table 4). There were 42 and 20 scaffolds from the in vivo plant, which were longer than the longest scaffold from in vitro plantlets, aligned with fungi and bacteria, respectively (see Supplementary Figure S1). To measure the completeness of scaffold assembly, BUSCO analysis was performed showing that 76.08% of 255 core eukaryotic genes were completely identified in the scaffolds of in vitro plantlets, including 68.24% single-copy genes and 7.84% duplicated genes. Additionally, 15.29% and 8.63% were identified as fragmented and missing genes, respectively (see Supplementary Figure S2).

2.5. Estimation of Genome Size, Heterozygosity, and Repetitive Rate Based on 17-mer Analysis

The decontaminated clean reads were used for 17-mer frequency analysis for genome size estimation. The number of 17-mer was 97,798,286,149 (in vivo) and 137,835,582,212 (in vitro), respectively (Table 5). The main peak of 17-mer frequency distribution was at 53× (in vivo) and 76× (in vitro) (Figure 4), which represented the overall sequencing depth of the genome. The second and third-highest peaks were separately located at around the double and half depth of the main peak. The estimated genome size was 1,845.25 Mb (in vivo) and 1812.83 Mb (in vitro), respectively. By removing the 17-mer at 1× depth, each size was revised to 1,816.81 Mb (in vivo) and 1801.99 Mb (in vitro). The heterozygosity was calculated as 0.64% (in vivo) and 0.50% (in vitro). The repetitive rate was estimated at 74.72% (in vivo) and 78.35% (in vitro). Overall, results of the 17-mer distribution indicated that the genome of M. cordata is highly repetitive.

2.6. SSR Identification

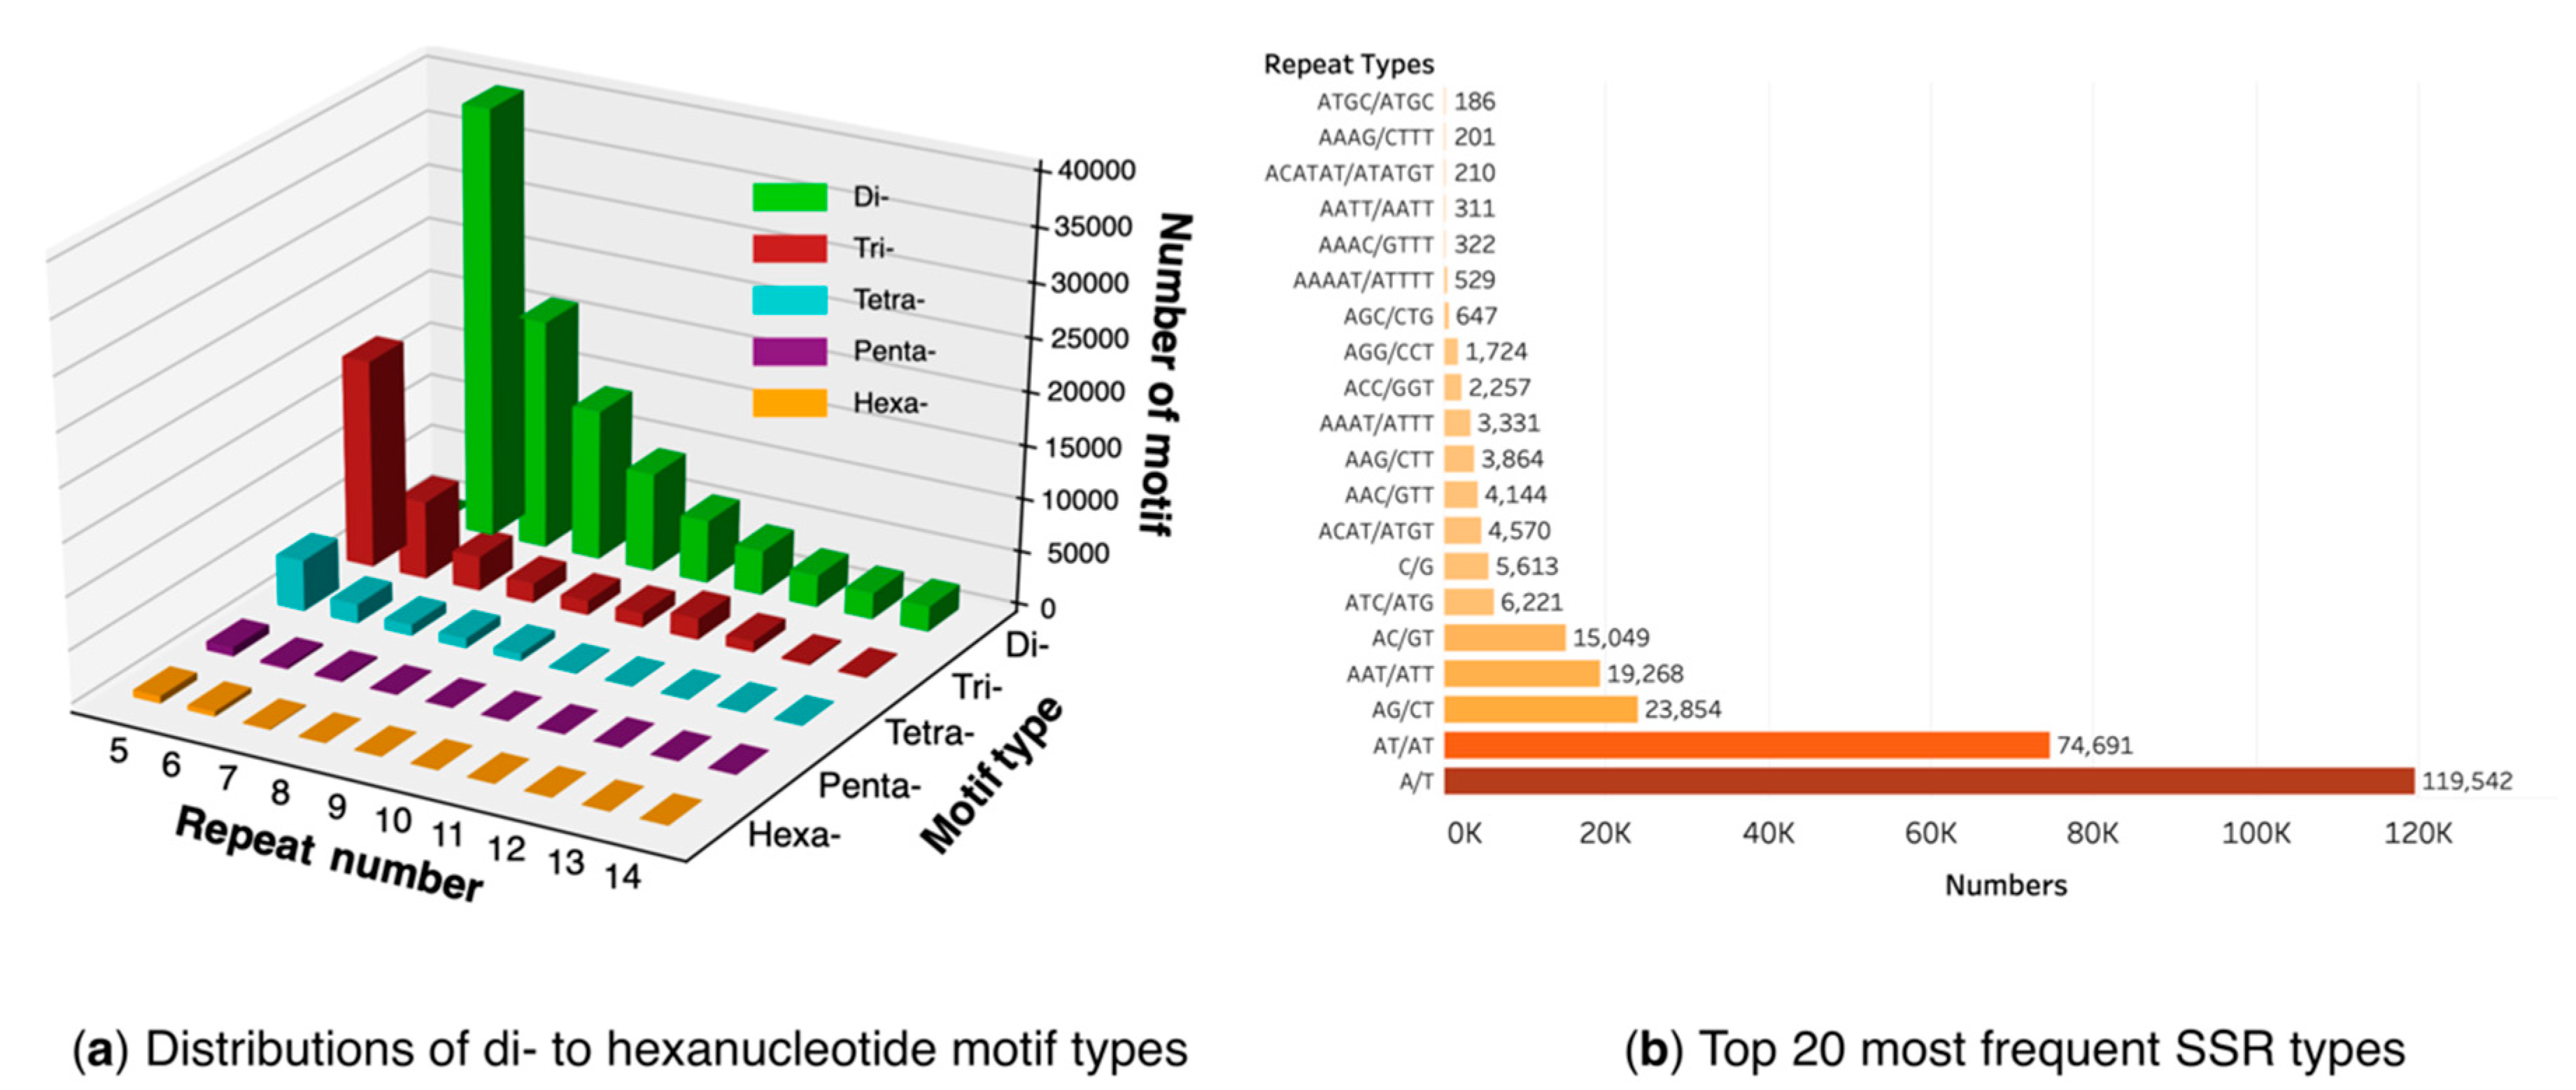
The scaffolds from in vitro plantlets with a low level of contaminants were utilized for SSR identification to ensure higher reliability. A total of 289,831 SSRs, including 125,155 (43.1%) mono-, 113,695 (39.2%) di-, 38,804 (13.3%) tri-, 9509 (3.3%) tetra-, 1390 (0.48%) penta-, and 1278 (0.44%) hexanucleotide repeats, were identified in 149,441 scaffolds. The mononucleotide repeat was the most abundant type. The di- to hexanucleotide SSRs were grouped according to the repeat times of motifs (from 5–4 repeat times, Figure 5a). Generally, the number of SSR decreased gradually as the motif repeats increasing. However, for trinucleotide SSR with 11 repeats, its number is larger than that of 10 repeats, which was attributed to a large proportion of AAT/ATT in the former. The 20 most frequent SSR types were present in Figure 5b. The A/T repeat type was the most dominant, accounting for 41.2% of all SSRs, followed by AT/AT (25.8%). Several trinucleotides and tetranucleotide repeat types, such as AAT/ATT, ATC/ATG, and ACAT/ATGT, also made up a remarkable proportion.

3. Discussion

The initial goal of this study was to characterize the genome of M. cordata but was impeded by the endophytic microbes. Endophytes that are ubiquitous in field plants confer benefits to their hosts, such as promoting plant growth and providing protection against biotic and abiotic stresses [35]. However, the endophytic DNA will be mixed into the host genome during extraction and bias the studies of the host plant. Various endophytes have been isolated in M. cordata [24], M. glomerate [26], and M. micrantha [25]. This suggests that endophytes removal becomes an obligatory step in related plant genomic research. To obtain aseptic plantlets, the explants of M. cordata were collected and disinfected using the common disinfectant. As observed in in vitro antibiotic-free culture of M. cordata, endophytic bacteria did grow on antibiotic-free media, indicating that surface disinfection was ineffective in obtaining the aseptic M. cordata as other Mikania spp. It has been noted that a >90% contamination rate is not extraordinary in initially established in vitro culture [36].
We performed the in vitro antibiotic-containing culture of M. cordata to decontaminate DNA sequences other than M. cordata. Micropropagation and tissue culture of Mikania species have been documented for M. glomerate [26] and M. micrantha [37]. Both exogenous and endogenous microbes have been noted as the greatest challenge in the micropropagation of M. glomerate [26]. The same case is with M. cordata. Eed et al. show that incorporating antibiotics into the in vitro culture may offer a solution to produce aseptic M. cordata plantlets [38]. Since fungicides are highly toxic for plants [39], this study only utilized antibiotics to inhibit bacterial growth in micropropagation. The survival rate of explants increased to 65% with 1 g·L−1 CTX treatment. Similarly, the survival rate was also increased to 50% under the treatment of 0.6 g·L−1 TIM. Among the viable plantlets, the germination rate was above 80% in both treatments. During the rooting phase, the rooting rate with the treatment of 0.5 g·L−1 CTX was sharply decreased to 55% in comparison to the 100% rooting rate under the treatment of 0.3 g·L−1 TIM. CTX was observed to have toxic effects on the root growth of M. cordata. Similar results have been reported for orange [27] and tobacco [40]. It is of note that the rooting ability was recovered after the nonrooting plantlets were transferred to TIM-containing media. Though the latent or exogenous microbes reappeared on a few cultures (~5%), most plantlets were microbial-free during large-scale propagation and maintenance. These results indicated that antibiotics were able to inhibit the growth of bacteria in the long term [41]. Overall, CTX showed more effectiveness at the initial cultivation of M. cordata to control endophytes than TIM, but it had an inhibitory effect on rooting. In contrast, TIM did not affect the rooting of M. cordata, which has also been demonstrated in tobacco [40] and tomato [42]. As for fungi, they may be eliminated by chance in culture in batches. Previous studies have shown that culturing multiple explants represents an effective way to produce fungal endophyte-free explants for Mikania plants [37]. In line with this, a batch of aseptic M. cordata was obtained for genome sequencing.
Before sequencing the in vitro plantlets of M. cordata, we sampled the greenhouse-grown M. cordata for genome survey sequencing and observed 8.7% (10.5 of 120.1 Gb) microbial sequences in clean reads. The contamination in DNA sequencing of M. cordata is much higher than that in RNA-Seq of M. cordata where only 0.076% unigenes were identified as fungi-origin sequences [12]. Blast results validate that the most dominant contaminant in M. cordata is Fusarium fujikuroi, a filamentous fungus. Similarly, F. oxysporum has also been found in M. micrantha rhizosphere but not very abundant [43]. The contaminant DNA will not only take up part of the sequencing resources but also mislead assembly; thus, the in vitro aseptic plantlets were used for genome survey sequencing again. There were only 0.06% (0.1 of 154.3 Gb) clean reads belonging to microbes and the stray region in GC depth distribution became dramatically shrunk, which supported that the micropropagation protocol was a success in reducing the endophytes of M. cordata. A few remaining contigs in the stray region were identified as Methylobacterium spp. which had also been isolated from the leaves of M. glomerate [44] and M. micrantha [43]. This study again suggested that the micropropagation media incorporating antibiotics can effectively eliminate the covert endophytes in M. cordata. Our protocol may promote the availability of aseptic M. cordata in future studies and be potentially applied to other plants whose genome sequencing is interfered with endophytes.
Although M. cordata represents a valuable species for comparative study with M. micrantha, its genome resources are lacking. The chromosome number of M. cordata is 2n = 36 [45], but the genomics information remains absent to date. As plant genomes are generally giant, genome survey by next-generation sequencing offers an affordable way to characterize the genome before conducting costly long-read genome sequencing [46]. Similar strategies have been applied to Betula platyphylla [47], Pistacia vera [48], and Rhododendron micranthum [49]. Genome survey sequencing has been shown that it enables to provide a preliminary understanding of such genomic characteristics as genome size, heterozygosity, and repetitive rate. In this study, we have conducted genome survey sequencing of the in vivo and in vitro culture of M. cordata, respectively. By surveying in vitro plantlets, the genomic characteristics may be assessed more accurately. The genome size of M. cordata was estimated at 1.80 Gb, which is typical in Asteraceae [50] and comparable with its congeneric M. micrantha of 1.86 Gb [13]. However, this size is much smaller than that of Helianthus annuus (3.6 Gb) [51]. Several studies have proposed that invasive species with more plasticity tend to have smaller genomes in comparison to their non-invasive relatives [52,53]. Nevertheless, our results highlight that the genome size of invasive species can be larger than that of the native species. We speculate that the large genome of M. micrantha may be associated with its CAM photosynthetic characteristics [13], since CAM plant tends to have low stomatal density [54], which is further negatively correlated with genome size [55]. Moreover, the estimated repetitive rate of M. cordata (78.35%) is found higher than that of most published genomes of Asteraceae plants, such as M. micrantha (73.12%) [13], Erigeron breviscapus (54.58%) [56], and Taraxacum kok-saghyz (68.56%) [57]. In this study, we observed that the contaminant DNA may mislead the estimate of genomic characterization. Compared with in vitro plantlets, the proportion of heterozygous 17-mer derived from in vivo plant shows an increase in M. cordata; but the proportion of repetitive 17-mer demonstrates a decrease. This may cause the heterozygosity overestimated and the repetitive rate underestimated. The contaminants may also lead to 14.82 Mb (0.82% of the whole genome) overestimation of the genome size. Our results are in contrast to the genome survey sequencing of B. platyphylla [47], which showed that contaminants brought no interference to genomic characterization.
Furthermore, 1.05 Gb scaffolds were generated from in vitro plantlets, which only covers 58.33% of the estimated genome. This relatively low genome coverage is not unexpected since the high repetitive rate of M. cordata may considerably inhibit the assembly of short reads. The longest scaffold generated from the in vivo plant is extremely long (4.29 Mb). Almost all the abnormal long scaffolds from in vivo plant were found aligned with microbial sequences. This finding is in line with the genome survey sequencing of Hypsibius dujardini and B. platyphylla, where the extremely long but low-abundance assemblies were identified as contaminant sequences [47,58]. In this study, the microbial scaffolds were eliminated from the scaffolds generated from in vitro plantlets. The existence of microbial scaffolds as well as their misleading effects on assembly stresses the necessity to produce in vitro aseptic plantlets of M. cordata for future long-read sequencing. It is of note that as much as 76.08% of core eukaryotic genes were found in our assemblies. The percentage is lower than that derived from the high-quality genome of M. micrantha (91%) [13] but higher than other assemblies based on short-read sequencing [47,59]. Of scaffold assemblies, the gene coverage was higher than the genome coverage. This might be linked to that hard-to-assemble repetitive regions are gene-poor.
It is conventional to perform simple sequence repeats (SSRs) analyses in genome survey. Due to the low contaminant level of in vitro plantlet, we used its scaffolds for SSRs identification. Additionally, to our knowledge, this study has reported the genomic SSRs of M. cordata for the first time. In total, 289,831 SSRs have been identified, which are much more abundant than the 3,602 EST-SSRs identified in M. micrantha [60]. The most common motifs of mono-, di, and trinucleotide in M. cordata are A/T, AT/AT, and AAT/ATT, respectively. The same pattern has been documented in other plants like jujube, grape, and mulberry [61]. The genomic SSRs developed here would be useful to assess the genetic diversity in M. cordata and examine the transferability in M. micrantha [62,63].

4. Materials and Methods

4.1. Plant Materials

A whole plant of wild M. cordata was collected from Green Island, Taiwan, China (22°39′40.0′′N, 121°28′59.2′′E) during December 2018 and transplanted in the greenhouse at Sun Yat-sen University, Guangdong, China. After 6 months of planting, the fresh leaves of M. cordata were cut and rinsed with distilled water. The leaves were frozen in liquid nitrogen immediately and stored at −80 °C freezer until DNA extraction.

4.2. Micropropagation of M. cordata

The apical and axillary shoots were collected from the same M. cordata individual cultivated in the greenhouse. After washing under water and trimming the leaves, the juvenile shoots as explant donors were disinfected with 70% ethanol for 2 min, followed by 0.2% sodium hypochlorite for 15 min. Once disinfected, the explants were rinsed 5 times in distilled water and dried using sterile filter paper. The explants were then trimmed into 1 cm segments and cultured on MS media [64] (pH = 5.8) with sucrose (3% w/v), agar (0.75% w/v), and 1 mg·L−1 benzyl adenine (BA) for sprouting. The antibiotic-containing MS media were either supplemented with 1.0 g·L−1 CTX or 0.6 g·L−1 TIM. The number of initial explants for culture establishment in each set was listed in Table 1. The cultures were incubated under 16 h light/8 h dark photoperiod at 26 °C for around 6 weeks, after which the sprouting plantlets were selected. The plantlets were subcultured on PGR-free 1/2 MS media containing a corresponding antibiotic reduced to half of the starting concentration for rooting. After 8 weeks of cultivation, the axillary shoots of rooted plantlets from CTX-treated and TIM-treated groups were cut off and subcultured on the 1/2 MS media with 0.3 g·L−1 TIM for 8 weeks of large-scale propagation. After that, the axillary shoots of strong plantlets were cut off again and subcultured in the same way for second-round propagation. Large-scale propagation of the aseptic plantlets would be continued until the number of aseptic leaves met the requirement of DNA extraction. Every time the plantlets were transferring to fresh media, the green leaves were harvested and immediately frozen in liquid nitrogen. The leaves were stored at −80 °C freezer until DNA extraction. Around 100 plantlets were successively subcultured for long-term maintenance after sampling. Through the whole period of in vitro culture, the plantlets were discarded once the culture was colonized by bacteria or fungi. A total of 6 of the robust plantlets were acclimatized to the incubation environment for 2 days, and then they were transferred in the soil and sand (1:1) mixture under the same incubation conditions.

4.3. DNA Extraction, Library Construction, and Genome Sequencing

The fresh leaves of in vivo mother plant and in vitro plantlets were used for genome survey sequencing, respectively. Briefly, genomic DNA was isolated using the CTAB (Cetyl Trimethyl Ammonium Bromide) method [65]. DNA purity and integrity were monitored on 1% agarose gel electrophoresis, and DNA concentration was measured using Qubit DNA Assay Kit in Qubit 2.0 Fluorometer (Thermo Scientific, Waltham, MA, USA). The genomic DNA of each sample was randomly sheared into short fragments of around 350 bp by M220 Covaris ultrasonicator (Covaris, Woburn, MA, USA). The fragments were subjected to library construction using the Truseq Nano DNA HT Sample Preparation Kit (Illumina, San Diego, CA, USA). The paired-end libraries were sequenced using the Illumina Novaseq 6000 platform (Illumina, San Diego, CA, USA) with read length of 2 × 150 bp by Novogene Co., Ltd. Two sets of raw sequencing reads are available in the Short Read Archive (SRA) database under the accession number of SRR12532532 (the in vitro grown plantlet) and SRR12532533 (the in vivo mother plant).

4.4. Contigs Assembly and Preliminary GC Depth Profiling

We utilized FastQC [66] for quality control. To obtain clean reads, for each case below, the entire raw reads were discarded through in-house Perl scripts: (1) the reads containing adapters; (2) the reads with an N ratio higher than 10%; (3) >20% of the entire paired-end reads composed by low-quality base (Phred quality score <5). The clean reads were used for contigs assembling by SOAPdenovo v2.2.7 [67]. Briefly, the clean reads were used to construct a de Bruijn graph with an optimal k-mer size of 41. The contigs were then obtained by breaking the connections at low-frequency k-mer, repeat boundaries, and unambiguous sequence fragments of the de Bruijn graph. The correlation between GC content and average per-base sequencing depth of the >500 bp contigs was plotted using a customized R script.

4.5. Identification and Filtration of Genomic Contaminants

Based on the GC depth distribution, the contigs in the distinct stray regions were extracted using a custom-made Perl script. The contigs from stray regions were blasted (Basic Local Alignment Search Tool) against the NCBI (National Center for Biotechnology Information) NT (Nucleotide collection) database with E-value = 1e − 5. The contigs that hit the sequences of microbes were regarded as the contaminating contigs and were subsequently used to build a local contaminant database. After that, the raw reads as queries were blasted against the contaminant database. The raw reads hit, regarded as contaminants, were filtered out. Consequently, the decontaminated raw reads were generated. After trimming the decontaminated raw reads with the same standard as above, the decontaminated clean reads were obtained.

4.6. Genome Assembly and GC Depth Profiling after In Silico Decontamination

The decontaminated clean reads were subjected to assemble contigs as above. The GC depth distribution of the >500 bp contigs was plotted again to confirm the contaminants were eliminated. Subsequently, the scaffolds were built by mapping decontaminated clean reads back to the >100 bp contigs using SOAPdenovo v2.2.7. The scaffolds from in vivo plant longer than the longest scaffold from in vitro plantlets were subject to DIAMOND BLASTX [68] against NCBI NR (nonredundant) proteins database with E-value = 1e − 3. The top-hit species distribution of those scaffolds was plotted. The completeness of scaffold assembly from in vitro plantlets was assessed based on 255 core eukaryotic genes by BUSCO (Benchmarking Universal Single-Copy Orthologs) v4 [69].

4.7. Estimation of Genome Size, Heterozygosity, and Repetitive Rate Based on 17-mer Analysis

The occurrences of 17-mer were counted for the decontaminated clean reads generated from in vivo plant and in vitro plantlets using Jellyfish 2.2.7 [70]. The distribution of 17-mer depth and frequency was plotted using Tableau. Genome size, heterozygosity, and repetitive rate were estimated using the Genomeye program developed by Novogene Co., Ltd. Genome size was estimated as follows:
Genome   size = No .   of   17 mers Main   peak   depth
Due to sequencing error, there were many low-frequency 17-mers. The proportion of 17-mers with depth = 1 was regarded as the error rate. The genome size was revised via the following formula:
Revised genome size = Genome size × (1 − Error rate)
A small-peak at half of the main peak depth represents the heterozygous peak. The estimated heterozygosity of genome can be calculated as follows:
Heterozygosity = a 1 / 2 × n s p e c i e s / ( 2 × 17 ) n s p e c i e s a 1 / 2 × n s p e c i e s / 2 = a 1 / 2 17 × ( 2 a 1 / 2 )
The nspecies stands for the total number of 17-mers species, and a1/2 stands for the ratio of heterozygous 17-mers species.
Another small peak at the multiple depth of the main peak represents the repetitive sequences. The 17-mers with the depth 1.8 times higher than the depth of the main peak were regarded as repetitive sequences. The proportion of those 17-mers were predicted to be the repetitive rate in the genome.

4.8. SSR Identification

The scaffolds from in vitro plantlets were used to detect SSR using MISA (MIcroSAtellite identification tool) [71]. The minimum number of repeats was set to 10, 6, 5, 5, 5, and 5 for mono-, di-, tri-, tetra-, penta-, and hexanucleotides, respectively. The statistics of SSR motifs were analyzed by Excel 2019 and plotted using the Python matplotlib package and Tableau.

5. Conclusions

This is the first report of the whole-genome sequencing of M. cordata. Based on 154.2 Gb (85× coverage) of clean reads from in vitro plantlets, the genome size of M. cordata is estimated to be 1.80 Gb with 0.50% heterozygosity and 78.35% repetitive rate. A total of 1.05 Gb scaffold was assembled, and 289,831 genomic SSRs were identified. The greenhouse-grown M. cordata severely involved microbial contamination, and therefore micropropagation was undertaken with the objectives of obtaining aseptic M. cordata. Both CTX and TIM enable to suppress the growth of endophytic bacteria for the in vitro culture of M. cordata. Overall, treatment with TIM has performed better in cultivating the robust in vitro plantlets. Our protocol to generate aseptic plantlets by micropropagation and perform genome survey sequencing can be applied to other plants that are heavily contaminated by endophytes. Since the genome of M. cordata is highly repetitive, we recommend using long-read sequencing for generating a contiguous genome. To avoid high levels of endophytes infection, the aseptic plantlets of M. cordata can be used in future sequencing, which will save considerable sequencing resources as well as achieve a high-quality assembly.

Supplementary Materials

The following are available online at https://www.mdpi.com/2223-7747/9/12/1665/s1, Figure S1: Top-hit species distribution of top 64 longest scaffolds (all >62 kb) from in vivo M. cordata, Figure S2: scaffold assembly evaluation, Table S1: top 100 species distribution of contigs in each stray region from NT blast results.

Author Contributions

Conceptualization, supervision, and funding acquisition, Y.S. and T.W.; methodology and resources, X.H. and C.L.; validation and investigation, Y.H. and X.R.; formal analysis, data curation, and visualization, Y.H. and Z.W.; writing—original draft preparation, Y.H.; writing—review and editing and project administration, Y.S. All authors have read and agreed to the published version of the manuscript.

Funding

This research was funded by the National Natural Science Foundation of China [31670200, 31770587, 31872670, and 32071781], the Natural Science Foundation of Guangdong Province, China [2016A030313320 and 2017A030313122], Science and Technology Planning Project of Guangdong Province, China [2017A030303007], Project of Department of Science and Technology of Shenzhen City, Guangdong, China [JCYJ20160425165447211, JCYJ20170413155402977, JCYJ20170818155249053, and JCYJ20190813172001780], and Science and Technology Planning Project of Guangzhou City, China [201804010389].

Acknowledgments

We thank Can Cui, a member of the Y. Su lab, for assistance with plant cultivation and sample collection.

Conflicts of Interest

The authors declare no conflict of interest.

Abbreviations

The following abbreviations are used in this manuscript:
BA6-Benzylaminopurine
BLASTBasic Local Alignment Search Tool
CAMCrassulacean Acid Metabolism
CTXCefotaxime
MSMurashige and Skoog
PGR Plant Growth Regulator
SSRSimple sequence repeat
TIMTimentin

References

  1. Zhu, S.; Chen, Y.L.; Chen, Y.S.; Lin, Y.R.; Liu, S.W.; Ge, X.J.; Gao, T.G.; Zhu, S.X.; Liu, Y.; Humphries, C.; et al. Asteraceae (Compositae). In Flora of China; Wu, Z.Y., Raven, P.H., Hong, D.Y., Eds.; Science Press: Beijing, China; Missouri Botanical Garden Press: St. Louis, MO, USA, 2011; Volume 20–21, pp. 879–891. [Google Scholar]
  2. Rahmatullah, M.; Mukti, I.J.; Haque, A.; Mollik, M.A.H.; Parvin, K.; Jahan, R.; Chowdhury, M.H.; Rahman, T. An ethnobotanical survey and pharmacological evaluation of medicinal plants used by the Garo tribal community living in Netrakona district, Bangladesh. Adv. Nat. Appl. Sci. 2009, 3, 402–418. [Google Scholar]
  3. Mercado, B. Notes on some growth characteristics of Mikania cordata (Burm. f.) B.L. Robinson. Biotropia-Southeast Asian J. Trop. Biol. 1994, 7, 30–40. [Google Scholar]
  4. Holm, L.G.; Plucknett, D.L.; Pancho, J.V.; Herberger, J.P. The World’s Worst Weeds. Distribution and Biology; University Press of Hawaii: Honolulu, HI, USA, 1977; pp. 320–327. [Google Scholar]
  5. Kong, G.; Wu, Q.G.; Hu, Q.M.; Ye, W.H. Further supplementary data on Mikania micrantha HBK (Asteraceae). J. Trop. Subtrop. Bot. 2000, 8, 128–130. [Google Scholar]
  6. Parker, C. The Mikania problem. Pans Pest Artic. News Summ. 1972, 18, 312–315. [Google Scholar] [CrossRef]
  7. Siwakoti, M. Mikania weed: A challenge for conservationists. Our Nat. 2007, 5, 70–74. [Google Scholar] [CrossRef] [Green Version]
  8. Lowe, S.; Browne, M.; Boudjelas, S.; De Poorter, M. 100 of the World’s Worst Invasive Alien Species: A Selection from the Global Invasive Species Database; Invasive Species Specialist Group: Auckland, New Zealand, 2000. [Google Scholar]
  9. Deng, X.; Ye, W.H.; Feng, H.L.; Yang, Q.H.; Cao, H.L.; Xu, K.Y.; Zhang, Y. Gas exchange characteristics of the invasive species Mikania micrantha and its indigenous congener M. cordata (Asteraceae) in South China. Bot. Bull. Acad. Sin. 2004, 45, 213–220. [Google Scholar]
  10. Vila, M.; Weiner, J. Are invasive plant species better competitors than native plant species?—Evidence from pair-wise experiments. Oikos 2004, 105, 229–238. [Google Scholar] [CrossRef]
  11. Su, Y.; Huang, L.; Wang, Z.; Wang, T. Comparative chloroplast genomics between the invasive weed Mikania micrantha and its indigenous congener Mikania cordata: Structure variation, identification of highly divergent regions, divergence time estimation, and phylogenetic analysis. Mol. Phylogenet. Evol. 2018, 126, 181–195. [Google Scholar] [CrossRef]
  12. Guo, W.; Liu, Y.; Ng, W.L.; Liao, P.C.; Huang, B.H.; Li, W.; Li, C.; Shi, X.; Huang, Y. Comparative transcriptome analysis of the invasive weed Mikania micrantha with its native congeners provides insights into genetic basis underlying successful invasion. BMC Genom. 2018, 19, 1–17. [Google Scholar] [CrossRef]
  13. Liu, B.; Yan, J.; Li, W.; Yin, L.; Li, P.; Yu, H.; Xing, L.; Cai, M.; Wang, H.; Zhao, M.; et al. Mikania micrantha genome provides insights into the molecular mechanism of rapid growth. Nat. Commun. 2020, 11, 1–13. [Google Scholar] [CrossRef] [Green Version]
  14. Wei, N.; Cronn, R.; Liston, A.; Ashman, T.L. Functional trait divergence and trait plasticity confer polyploid advantage in heterogeneous environments. New Phytol. 2019, 221, 2286–2297. [Google Scholar] [CrossRef] [PubMed] [Green Version]
  15. Stern, D.B.; Lee, C.E. Evolutionary origins of genomic adaptations in an invasive copepod. Nat. Ecol. Evol. 2020, 4, 1084–1094. [Google Scholar] [CrossRef] [PubMed]
  16. Maheshwari, D.K. Endophytes: Biology and Biotechnology; Springer: New York, NY, USA, 2017. [Google Scholar]
  17. Jeong, H.; Pan, J.G.; Park, S.H. Contamination as a major factor in poor Illumina assembly of microbial isolate genomes. bioRxiv 2016. [Google Scholar] [CrossRef]
  18. Dittami, S.M.; Corre, E. Detection of bacterial contaminants and hybrid sequences in the genome of the kelp Saccharina japonica using Taxoblast. PeerJ 2017, 5, e4073. [Google Scholar] [CrossRef] [PubMed] [Green Version]
  19. Reiter, T.; Brown, C.T. Microbial contamination in the genome of the domesticated olive. bioRxiv. 2018. [Google Scholar] [CrossRef]
  20. Simion, P.; Belkhir, K.; François, C.; Veyssier, J.; Rink, J.C.; Manuel, M.; Philippe, H.; Telford, M.J. A software tool ‘CroCo’ detects pervasive cross-species contamination in next generation sequencing data. BMC Biol. 2018, 16, 1–9. [Google Scholar] [CrossRef]
  21. Qiu, H.; Cai, G.; Luo, J.; Bhattacharya, D.; Zhang, N. Extensive horizontal gene transfers between plant pathogenic fungi. BMC Biol. 2016, 14, 1–11. [Google Scholar] [CrossRef] [Green Version]
  22. Cheng, S.; Xian, W.; Fu, Y.; Marin, B.; Keller, J.; Wu, T.; Sun, W.; Li, X.; Xu, Y.; Zhang, Y.; et al. Genomes of subaerial Zygnematophyceae provide insights into land plant evolution. Cell 2019, 179, 1057–1067. [Google Scholar] [CrossRef]
  23. Liu, X.; Liu, Y.; Huang, P.; Ma, Y.; Qing, Z.; Tang, Q.; Cao, H.; Cheng, P.; Zheng, Y.; Yuan, Z.; et al. The genome of medicinal plant Macleaya cordata provides new insights into benzylisoquinoline alkaloids metabolism. Mol. Plant 2017, 10, 975–989. [Google Scholar] [CrossRef] [Green Version]
  24. Jayatilake, P.L.; Munasinghe, H. Antimicrobial activity of cultivable endophytic and rhizosphere fungi associated with “mile-a-minute,” Mikania cordata (Asteraceae). Biomed Res. Int. 2020, 2020, 1–7. [Google Scholar] [CrossRef]
  25. Elavazhagan, T.; Jayakumar, S.; Balakrishnan, V.; Chitravadivu, C. Isolation of endophytic bacteria from the invasive alien weed, Mikania micrantha and their molecular characterization. Am. Eurasian J. Sci. Res. 2009, 4, 154–158. [Google Scholar]
  26. Pereira, A.M.S.; França, S.; Câmara, F.L.A. Vegetative propagation of Mikania glomerata: Micro-propagation and cuttings. Acta Hortic. 1999, 502, 347–352. [Google Scholar] [CrossRef]
  27. Da Silva Mendes, A.F.; Cidade, L.C.; de Oliveira, M.L.P.; Otoni, W.C.; Soares-Filho, W.D.S.; Costa, M.G.C. Evaluation of novel beta-lactam antibiotics in comparison to cefotaxime on plant regeneration of Citrus sinensis L. Osb. Plant CellTissue Organ Cult. 2009, 97, 331–336. [Google Scholar] [CrossRef]
  28. Goto, S.; Thakur, R.; Ishii, K. Determination of genetic stability in long-term micropropagated shoots of Pinus thunbergii Parl. using RAPD markers. Plant Cell Rep. 1998, 18, 193–197. [Google Scholar] [CrossRef] [PubMed]
  29. Senapati, S.; Aparajita, S.; Rout, G. An assessment of genetic fidelity of in vitro grown plantlets of rose (Rosa hybrida) through molecular markers. Afr. J. Biotechnol. 2012, 11, 16532–16538. [Google Scholar]
  30. Schatz, M.C.; Witkowski, J.; McCombie, W.R. Current challenges in de novo plant genome sequencing and assembly. Genome Biol. 2012, 13, 1–7. [Google Scholar] [CrossRef]
  31. Michael, T.P.; Jupe, F.; Bemm, F.; Motley, S.T.; Sandoval, J.P.; Lanz, C.; Loudet, O.; Weigel, D.; Ecker, J.R. High contiguity Arabidopsis thaliana genome assembly with a single nanopore flow cell. Nat. Commun. 2018, 9, 1–8. [Google Scholar] [CrossRef] [Green Version]
  32. Vurture, G.W.; Sedlazeck, F.J.; Nattestad, M.; Underwood, C.J.; Fang, H.; Gurtowski, J.; Schatz, M.C. GenomeScope: Fast reference-free genome profiling from short reads. Bioinformatics 2017, 33, 2202–2204. [Google Scholar] [CrossRef] [Green Version]
  33. Summerell, B.A.; Leslie, J.F. Fifty years of Fusarium: How could nine species have ever been enough? Fungal Divers 2011, 50, 135. [Google Scholar] [CrossRef]
  34. Madhaiyan, M.; Poonguzhali, S.; Senthilkumar, M.; Seshadri, S.; Chung, H.; Yang, J.; Sundaram, S.; Sa, T. Growth promotion and induction of systemic resistance in rice cultivar Co-47 (Oryza sativa L.) by Methylobacterium spp. Bot. Bull. Acad. Sin. 2004, 45, 315–324. [Google Scholar]
  35. Hallmann, J.; Quadt-Hallmann, A.; Mahaffee, W.; Kloepper, J. Bacterial endophytes in agricultural crops. Can. J. Microbiol. 1997, 43, 895–914. [Google Scholar] [CrossRef]
  36. Skirvin, R.; Motoike, S.; Norton, M.; Ozgur, M.; Al-Juboory, K.; McMeans, O. Establishment of contaminant-free perennial plants in vitro. Vitr. Cell. Dev. Biol. Plant 1999, 35, 278–280. [Google Scholar] [CrossRef]
  37. Hong, L.; Ye, W.H.; Shen, H.; Cao, H.L.; Liu, W. Tissue culture and somatic embryogenesis of Mikania micrantha HBK. J. Zhejiang Univ. 2005, 5, 572–578. [Google Scholar]
  38. Eed, A.M.; Reddy, S.A.; Reddy, K.M.; Silva, J.; Reddy, P.V.; Beghum, H.; Venkatsubbaiah, P.Y. Effect of antibiotics and fungicides on the in vitro production of Citrus limonia Osbeck nodal segment and shoot tip explants. Asian Australas J. Plant Sci. Biotechnol. 2010, 4, 66–70. [Google Scholar]
  39. Brauer, V.S.; Rezende, C.P.; Pessoni, A.M.; De Paula, R.G.; Rangappa, K.S.; Nayaka, S.C.; Gupta, V.K.; Almeida, F. Antifungal agents in agriculture: Friends and foes of public health. Biomolecules 2019, 9, 521. [Google Scholar] [CrossRef] [PubMed] [Green Version]
  40. Nauerby, B.; Billing, K.; Wyndaele, R. Influence of the antibiotic timentin on plant regeneration compared to carbenicillin and cefotaxime in concentrations suitable for elimination of Agrobacterium tumefaciens. Plant Sci. 1997, 123, 169–177. [Google Scholar] [CrossRef]
  41. Leifert, C.; Ritchie, J.; Waites, W. Contaminants of plant-tissue and cell cultures. World J. Microbiol. Biotechnol. 1991, 7, 452–469. [Google Scholar] [CrossRef]
  42. Costa, M.; Nogueira, F.; Figueira, M.; Otoni, W.; Brommonschenkel, S.; Cecon, P. Influence of the antibiotic timentin on plant regeneration of tomato (Lycopersicon esculentum Mill.) cultivars. Plant Cell Rep. 2000, 19, 327–332. [Google Scholar] [CrossRef]
  43. Yin, L.; Liu, B.; Wang, H.; Zhang, Y.; Wang, S.; Jiang, F.; Ren, Y.; Liu, H.; Liu, C.; Wan, F.; et al. The rhizosphere microbiome of Mikania micrantha provides insight into adaptation and invasion. Front. Microbiol. 2020, 11, 1462. [Google Scholar] [CrossRef]
  44. Mora Polanco, I.Y. Bactéria Endofítica Associada a Mikania Glomerata (Asteraceae): Investigação Microbiológica, Busca de Substâncias Bioativas e Avaliação do Seu Efeito In Vitro na Modulação de Metabólitos Secundários; University of Campinas: São Paulo, Brazil, 2018. [Google Scholar]
  45. Jiang, L.; Zhang, Y.; Guo, Q.; Liu, Y.; Li, C. Cytological study on Mikania cordata (Asteraceae), a native plant in China. Guihaia 2018, 38, 324–331. [Google Scholar]
  46. Kelly, L.J.; Leitch, I.J. Exploring giant plant genomes with next-generation sequencing technology. Chromosome Res. 2011, 19, 939–953. [Google Scholar] [CrossRef] [PubMed]
  47. Wang, S.; Chen, S.; Liu, C.; Liu, Y.; Zhao, X.; Yang, C.; Qu, G.Z. Genome survey sequencing of Betula platyphylla. Forests 2019, 10, 826. [Google Scholar] [CrossRef] [Green Version]
  48. Motalebipour, E.Z.; Kafkas, S.; Khodaeiaminjan, M.; Çoban, N.; Gözel, H. Genome survey of pistachio (Pistacia vera L.) by next generation sequencing: Development of novel SSR markers and genetic diversity in Pistacia species. BMC Genom. 2016, 17, 998. [Google Scholar] [CrossRef] [PubMed] [Green Version]
  49. Zhou, X.J.; Liu, M.X.; Lu, X.Y.; Sun, S.S.; Cheng, Y.W.; Ya, H.Y. Genome survey sequencing and identification of genomic SSR markers for Rhododendron micranthum. Biosci. Rep. 2020, 40, 1–8. [Google Scholar] [CrossRef] [PubMed]
  50. Vallès, J.; Canela, M.Á.; Garcia, S.; Hidalgo, O.; Pellicer, J.; Sánchez-Jiménez, I.; Siljak-Yakovlev, S.; Vitales, D.; Garnatje, T. Genome size variation and evolution in the family Asteraceae. Caryologia Int. J. Cytol. Cytosystematics Cytogenet. 2013, 66, 221–235. [Google Scholar] [CrossRef]
  51. Badouin, H.; Gouzy, J.; Grassa, C.J.; Murat, F.; Staton, S.E.; Cottret, L.; Lelandais-Brière, C.; Owens, G.L.; Carrère, S.; Mayjonade, B.; et al. The sunflower genome provides insights into oil metabolism, flowering and Asterid evolution. Nature 2017, 546, 148–152. [Google Scholar] [CrossRef] [PubMed]
  52. Knight, C.A.; Molinari, N.A.; Petrov, D.A. The large genome constraint hypothesis: Evolution, ecology and phenotype. Ann. Bot. 2005, 95, 177–190. [Google Scholar] [CrossRef] [Green Version]
  53. Kubešová, M.; Moravcova, L.; Suda, J.; Jarošík, V.; Pyšek, P. Naturalized plants have smaller genomes than their non-invading relatives: A flow cytometric analysis of the Czech alien flora. Preslia 2010, 82, 81–96. [Google Scholar]
  54. Males, J.; Griffiths, H. Stomatal biology of CAM plants. Plant Physiol. 2017, 174, 550–560. [Google Scholar] [CrossRef] [Green Version]
  55. Beaulieu, J.M.; Leitch, I.J.; Patel, S.; Pendharkar, A.; Knight, C.A. Genome size is a strong predictor of cell size and stomatal density in angiosperms. New Phytol. 2008, 179, 975–986. [Google Scholar] [CrossRef] [Green Version]
  56. Yang, J.; Zhang, G.; Zhang, J.; Liu, H.; Chen, W.; Wang, X.; Li, Y.; Dong, Y.; Yang, S. Hybrid de novo genome assembly of the Chinese herbal fleabane Erigeron breviscapus. Gigascience 2017, 6, gix028. [Google Scholar] [CrossRef]
  57. Lin, T.; Xu, X.; Ruan, J.; Liu, S.; Wu, S.; Shao, X.; Wang, X.; Gan, L.; Qin, B.; Yang, Y.; et al. Genome analysis of Taraxacum kok-saghyz Rodin provides new insights into rubber biosynthesis. Natl. Sci. Rev. 2018, 5, 78–87. [Google Scholar] [CrossRef] [Green Version]
  58. Delmont, T.O.; Eren, A.M. Identifying contamination with advanced visualization and analysis practices: Metagenomic approaches for eukaryotic genome assemblies. PeerJ 2016, 4, e1839. [Google Scholar] [CrossRef] [PubMed]
  59. Huang, Y.; Jiang, D.; Li, M.; Mustapha, U.F.; Tian, C.; Chen, H.; Huang, Y.; Deng, S.; Wu, T.; Zhu, C.; et al. Genome survey of male and female spotted scat (Scatophagus argus). Animals 2019, 9, 1117. [Google Scholar] [CrossRef] [PubMed] [Green Version]
  60. Yan, Y.; Huang, Y.; Fang, X.; Lu, L.; Zhou, R.; Ge, X.; Shi, S. Development and characterization of EST-SSR markers in the invasive weed Mikania micrantha (Asteraceae). Am. J. Bot. 2011, 98, e1–e3. [Google Scholar] [CrossRef] [PubMed]
  61. Xiao, J.; Zhao, J.; Liu, M.; Liu, P.; Dai, L.; Zhao, Z. Genome-wide characterization of simple sequence repeat (SSR) loci in Chinese jujube and jujube SSR primer transferability. PLoS ONE 2015, 10, e0127812. [Google Scholar] [CrossRef] [Green Version]
  62. Tuler, A.; Carrijo, T.; Nóia, L.; Ferreira, A.; Peixoto, A.; da Silva Ferreira, M. SSR markers: A tool for species identification in Psidium (Myrtaceae). Mol. Biol. Rep. 2015, 42, 1501–1513. [Google Scholar] [CrossRef]
  63. Hoshino, A.A.; Bravo, J.P.; Nobile, P.M.; Morelli, K.A. Microsatellites as tools for genetic diversity analysis. In Genetic Diversity in Microorganisms; Caliskan, M., Ed.; IntechOpen: Rijeka, Croatia, 2012; pp. 149–170. [Google Scholar]
  64. Murashige, T.; Skoog, F. A revised medium for rapid growth and bio assays with tobacco tissue cultures. Physiol. Plant 1962, 15, 473–497. [Google Scholar] [CrossRef]
  65. Porebski, S.; Bailey, L.G.; Baum, B.R. Modification of a CTAB DNA extraction protocol for plants containing high polysaccharide and polyphenol components. Plant Mol. Biol. Rep. 1997, 15, 8–15. [Google Scholar] [CrossRef]
  66. Andrews, S. FastQC: A quality control tool for high throughput sequence data. 2010. [Google Scholar]
  67. Luo, R.; Liu, B.; Xie, Y.; Li, Z.; Huang, W.; Yuan, J.; He, G.; Chen, Y.; Pan, Q.; Liu, Y.; et al. SOAPdenovo2: An empirically improved memory-efficient short-read de novo assembler. Gigascience 2012, 1, 2047–2217X. [Google Scholar] [CrossRef]
  68. Buchfink, B.; Xie, C.; Huson, D.H. Fast and sensitive protein alignment using DIAMOND. Nat. Methods 2015, 12, 59–60. [Google Scholar] [CrossRef] [PubMed]
  69. Waterhouse, R.M.; Seppey, M.; Simão, F.A.; Manni, M.; Ioannidis, P.; Klioutchnikov, G.; Kriventseva, E.V.; Zdobnov, E.M. BUSCO applications from quality assessments to gene prediction and phylogenomics. Mol. Biol. Evol. 2018, 35, 543–548. [Google Scholar] [CrossRef] [PubMed] [Green Version]
  70. Marçais, G.; Kingsford, C. A fast, lock-free approach for efficient parallel counting of occurrences of k-mers. Bioinformatics 2011, 27, 764–770. [Google Scholar] [CrossRef] [PubMed] [Green Version]
  71. Thiel, T.; Michalek, W.; Varshney, R.; Graner, A. Exploiting EST databases for the development and characterization of gene-derived SSR-markers in barley (Hordeum vulgare L.). Appl. Genet. 2003, 106, 411–422. [Google Scholar] [CrossRef]
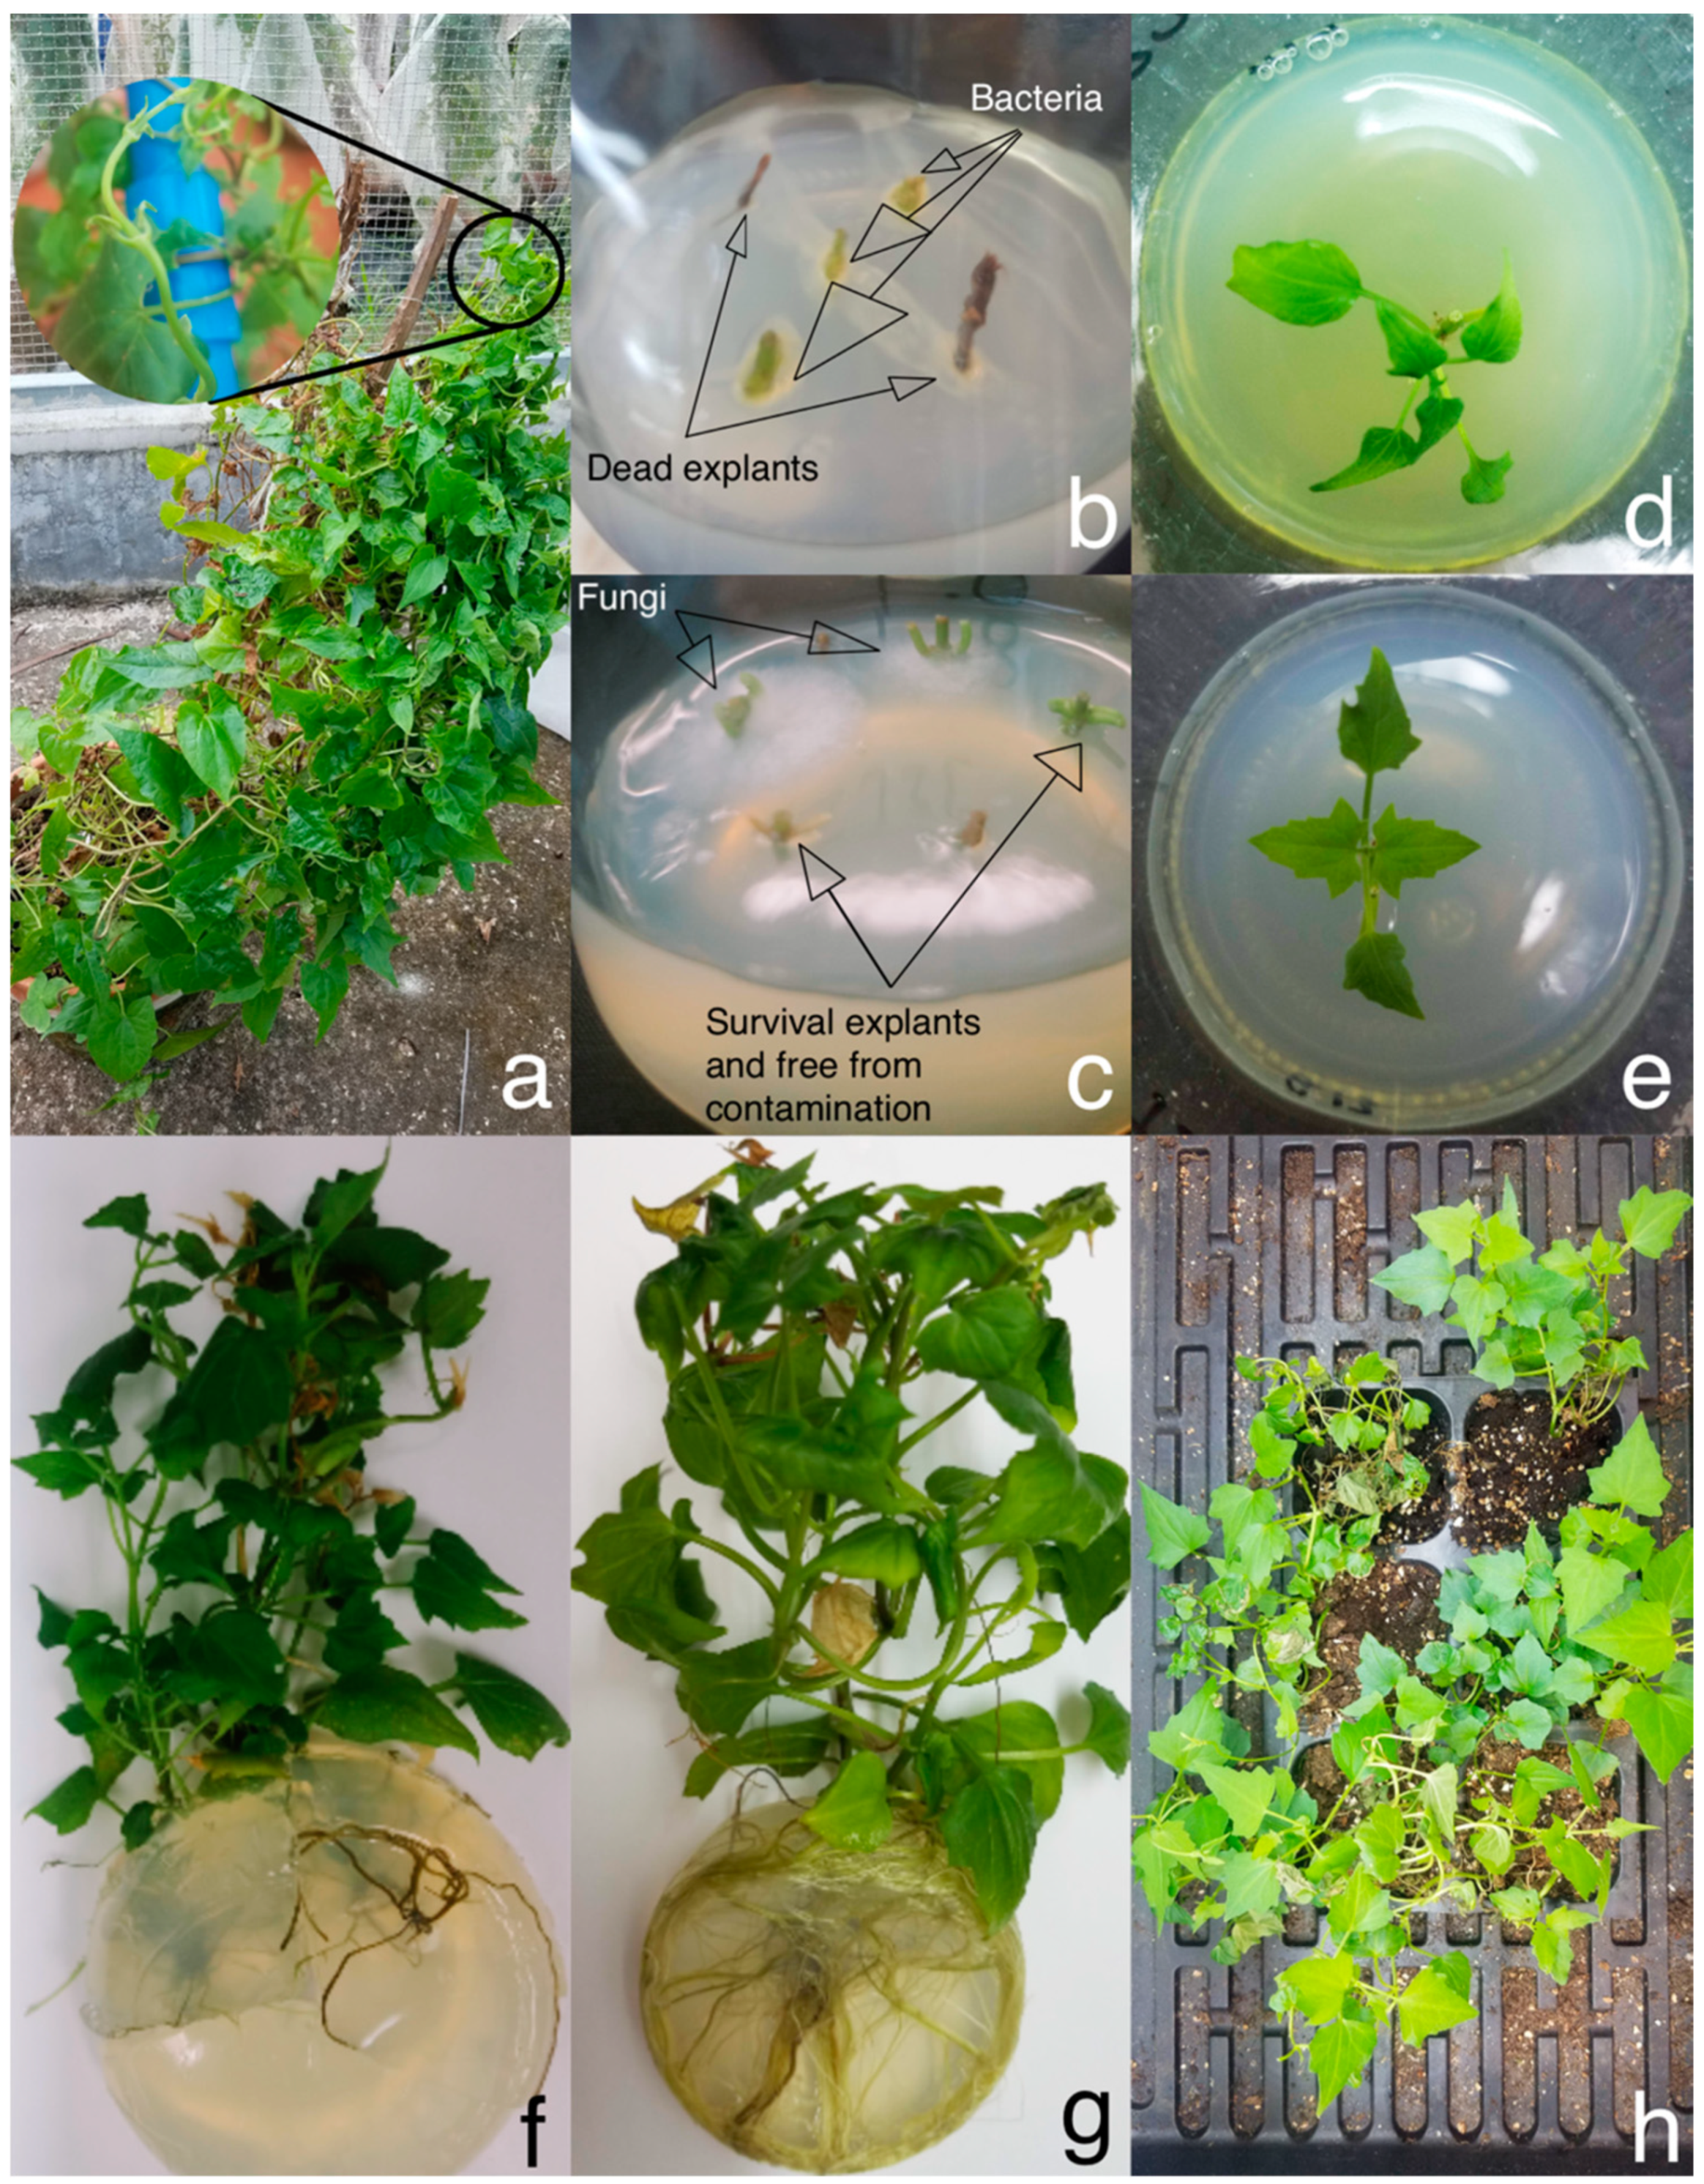
Figure 1. Micropropagation of M. cordata. (a) A greenhouse-grown M. cordata and the juvenile shoots (in the circle) were collected as explant donors. (b) On the 6th day, three explants were colonized by bacteria and two explants died in one antibiotic-free medium. (c) On the 6th day, two explants were colonized by fungi and two explants were potentially aseptic in one TIM-treated medium. (d) The plantlet had sprouted after 6 weeks of cultivation with CTX. (e) The plantlet had sprouted after 6 weeks of cultivation with TIM. (f) After 8 weeks of cultivation on 1/2 MS media with CTX, the plantlet grew sparse roots with relatively small leaves. (g) After 8 weeks of cultivation on 1/2 MS media with TIM, the plantlet grew lush roots with relatively large leaves. (h) The robust plantlets were transferred to plastic pots containing soil and sand (1:1) mixture and were able to establish ex vitro after 4 weeks of cultivation. Abbreviation: CTX, cefotaxime; TIM, timentin; MS, Murashige and Skoog.
Plants 09 01665 g001
Figure 2. GC content and average sequencing depth distribution of in vivo (a) and in vitro (b) M. cordata. The x-axis represents the GC content of contigs while the y-axis represents their average depth. Each dot represents an individual contig. The red region indicates high-density portions of the contigs. The extracted regions are indicated by the dashed rectangle. The distribution of contig depth is posited on the right while the distribution of GC content is on the top.
Plants 09 01665 g002
Figure 3. GC content and average sequencing depth distribution of in vivo (a) and in vitro (b) M. cordata after decontamination. The stray regions at high GC content and low depth were both shrunk dramatically compared to Figure 2. (a) Due to the relatively low sequencing depth of in vivo plant, the high-density region is more concentrated. However, there remains a small stray region at the low depth and high GC content. (b) Due to the relatively high sequencing depth of in vitro plantlets, there are two distinct high-density regions around 76× and 38×, which might be the homologous and heterologous sequences in the genome.
Plants 09 01665 g003
Figure 4. Distribution of 17-mer depth and frequency of in vivo (red line) and in vitro (blue line) M. cordata. The highest cut-off frequency is at 1% and the maximum cut-off depth is at 250×. Arrows indicate the half depth, the depth, and the double depth of the main peak, respectively. The main peak represents the overall sequencing depth of the genome. The second-highest peak around the double depth of the main peak represents repetitive sequences. The nonobvious peak at the half depth of the main peak represents the heterozygous peak. The 17-mer distribution suggests that the genome of M. cordata is highly repetitive.
Plants 09 01665 g004
Figure 5. Genome-wide identification of simple sequence repeats (SSRs) in M. cordata. (a) Generally speaking, the number of simple sequence repeats (SSRs) decreased gradually as the repeat times of motifs increasing; (b) The A/T repeat type was the most dominant (119,542), followed by AT/AT (74,691) and AG/CT (23,854).
Plants 09 01665 g005
Table 1. The effect of antibiotics on the in vitro culture of M. cordata.
Media and PGR (mg·L1)Antibiotic (g·L1)Incubation (Weeks)No. of
Explants/Plantlets
Aseptic
Explants/
Plantlets
Survival (>4 weeks)Sprouting/
Rooting
Plantlets
ControlMS + BA 1.0None411 1400
SproutingMS + BA 1.0CTX 1.0620 2161311
SproutingMS + BA 1.0TIM 0.6620 315108
Rooting1/2 MSCTX 0.581111116
Rooting1/2 MSTIM 0.388 4777
Propagation 1st1/2 MSTIM 0.3864 5606060
Propagation 2nd1/2 MSTIM 0.38∼350 6∼330∼330∼330
1 A total of seven explants were colonized by bacteria. 2 A total of four explants were colonized by fungi. 3 A total of four explants were colonized by bacteria and one by fungi. 4 A total of one plantlet was colonized by fungi. 5 A total of three plantlets were colonized by fungi and one by bacteria. 6 A total of thirteen plantlets were colonized by fungi and six by bacteria. Abbreviation: PGR, plant growth regulator; MS, Murashige and Skoog Medium; BA, 6-Benzylaminopurine; CTX, cefotaxime; TIM, timentin.
Table 2. Statistics for the sequencing data.
LibrariesRead Length
(bases)
Raw Reads
(Gb)
Raw Q30
(%)
Clean Reads
(Gb)
Clean Q30
(%)
GC Content
(%)
In vivo~350300135.489.94120.189.2637.95
In vitro~350300176.692.97154.391.8136.74
Table 3. Top five species distribution of contigs in each stray region from NT blast results.
RegionNo. of ContigsSpeciesPercentage of Contigs in Stray Region
In vivo0−14× depth
0−100% GC content
1,041,992Helianthus maximiliani13.23%
Fusarium fujikuroi110.38%
Ageratina adenophora5.60%
Methylobacterium radiotolerans24.15%
Methylobacterium extorquens23.86%
14−24× depth
0−60% GC content
152,558Helianthus maximiliani37.22%
Ageratina adenophora13.92%
Helianthus annuus3.85%
Solanum lycopersicum3.01%
Guizotia abyssinica2.17%
20−35× depth
60−100% GC content
16,435Methylobacterium extorquens215.17%
Methylobacterium radiotolerans214.07%
Helianthus maximiliani6.38%
Methylobacterium nodulans23.13%
Sphingomonas sp. 21.93%
40−80× depth
60−100% GC content
8216Helianthus maximiliani25.51%
Clavibacter michiganensis25.34%
Methylobacterium extorquens24.10%
Agathis dammara3.17%
Helianthus annuus3.10%
In vitro0−10× depth
57−80% GC content
7832Methylobacterium radiotolerans236.16%
Methylobacterium extorquens216.32%
Methylobacterium sp. 28.96%
Brevundimonas subvibrioides25.34%
Caulobacter sp. 24.34%
1 Fungi. 2 Bacteria.
Table 4. Genome assembly statistics of M. cordata after decontamination.
Clean Reads
(Gb)
GC Content
(%)
Assembly (>100 bp)Total Length
(bp)
Total
Number
Max Length
(bp)
N50
(bp)
N Bases
(%)
In vivo109.636.94Contigs934,276,2843,555,786327,9483520
Scaffolds1,109,673,6081,443,2124,285,95930874.33
In vitro154.236.72Contigs882,531,1423,511,47324,8423120
Scaffolds1,048,004,1731,526,30960,76725705.02
Table 5. Statistics of 17–mer analysis for genome size estimation of M. cordata.
DepthNo. of 17-merGenome Size (Mb)Revised Genome Size (Mb)Heterozygosity
(%)
Repetitive Rate (%)
In vivo5397,798,286,1491845.251816.810.6474.72
In vitro76137,835,582,2121812.831801.990.5078.35
Publisher’s Note: MDPI stays neutral with regard to jurisdictional claims in published maps and institutional affiliations.