Article

The Light Dependence of Mesophyll Conductance and Relative Limitations on Photosynthesis in Evergreen Sclerophyllous Rhododendron Species

1
Kunming Institute of Botany, Chinese Academy of Sciences, Kunming 650201, China
2
University of Chinese Academy of Sciences, Beijing 100049, China
*
Authors to whom correspondence should be addressed.
Plants 2020, 9(11), 1536; https://doi.org/10.3390/plants9111536
Submission received: 22 September 2020 / Revised: 23 October 2020 / Accepted: 30 October 2020 / Published: 10 November 2020
(This article belongs to the Section Plant Physiology and Metabolism)

Abstract

:
Mesophyll conductance (gm) limits CO2 diffusion from sub-stomatal internal cavities to the sites of RuBP carboxylation. However, the response of gm to light intensity remains controversial. Furthermore, little is known about the light response of relative mesophyll conductance limitation (lm) and its effect on photosynthesis. In this study, we measured chlorophyll fluorescence and gas exchange in nine evergreen sclerophyllous Rhododendron species. gm was maintained stable across light intensities from 300 to 1500 μmol photons m−2 s−1 in all these species, indicating that gm did not respond to the change in illumination in them. With an increase in light intensity, lm gradually increased, making gm the major limiting factor for area-based photosynthesis (AN) under saturating light. A strong negative relationship between lm and AN was found at 300 μmol photons m−2 s−1 but disappeared at 1500 μmol photons m−2 s−1, suggesting an important role for lm in determining AN at sub-saturating light. Furthermore, the light-dependent increase in lm led to a decrease in chloroplast CO2 concentration (Cc), inducing the gradual increase of photorespiration. A higher lm under saturating light made AN more limited by RuBP carboxylation. These results indicate that the light response of lm plays significant roles in determining Cc, photorespiration, and the rate-limiting step of AN.

1. Introduction

In southwest China, mountain forest ecosystems are characterized by the presence of evergreen sclerophyllous angiosperms. This vegetation type includes many species of the genus Rhododendron (Ericaceae) that exhibit low mesophyll conductance (gm) [1]. Leaf CO2 diffusion mainly includes diffusion from air to the intercellular cavity (stomatal conductance, gs) and diffusion from the intercellular cavity to the site of RuBP carboxylation (gm). Many previous studies indicated that sclerophyllous plants have relatively lower gm values than herbaceous plants [1,2,3,4,5]. Such low levels of gm in sclerophyllous plants limit AN to a large extent when exposed to high light. Consequently, gm is the major limiting factor for AN under constant high light in sclerophyllous tree species, such as Mediterranean evergreens [4,6,7,8], the sclerophyllous genus Banksia [2], Eucalyptus camaldulensis [9,10], and sclerophyllous Rhododendron species [1]. Therefore, the response of gm to the environment plays a critical role in controlling photosynthesis in sclerophyllous angiosperms.
Under natural field conditions, leaves experience rapid changes in light intensities on timescales of seconds or minutes [11,12]. gs usually increases with increasing light in angiosperms, which raises the question whether gm changes rapidly in response to the change in light intensity. Some studies observed that gm increased with increasing irradiance in Eucalyptus species [13,14], Nicotiana tabacum [15], Camellia species [16], Triticum durum and Arbutus × ‘Marina’ [17], and rice (Oryza sativa) grown under high nitrogen concentrations [18]. Furthermore, a recent study found that with increasing irradiance, gm gradually increased in all six studied angiosperms [19]. In contrast, other studies reported that light intensity did not affect gm in Triticum aestivum [20], N. tabacum [21], and rice grown under low nitrogen concentrations [18]. Therefore, the response of gm to increases in light intensity in angiosperms is species dependent and can be affected by nitrogen nutritional conditions. Previous studies mainly focused on the light response of gm in herbaceous plants. However, the response of gm to light intensity in sclerophyllous evergreen species is not well known.
Many previous studies have analyzed the quantitative relative stomatal, mesophyll, and biochemical limitations of AN under saturating light conditions [4,22,23,24,25]. As we know, the value of AN under saturating light largely determines the growth rate of plants [26,27,28]. However, some shade-tolerant plant species and leaves in lower parts of canopies may experience moderate light. As a result, the value of AN at moderate light can significantly affect plant growth and crop productivity [29]. Therefore, understanding the relative limitations of AN at moderate light may have broad applications in angiosperms and crops in particular. However, light response changes in the relative limitations of AN are poorly understood.
In addition to RuBP carboxylation, Rubisco catalyzes RuBP oxygenation under current atmospheric environmental conditions [30,31,32]. The photorespiratory pathway converts phosphoglycolate (2PG) to 3-phosphoglycerate (3PGA), allowing the Calvin–Benson cycle to operate in the presence of molecular oxygen [33,34]. Under low light, AN is mainly limited by a lack of light energy, and the resulting high chloroplast CO2 concentration (Cc) restricts the rate of RuBP oxygenation (Vo). Under high light, the increased rate of RuBP carboxylation (Vc) leads to a decrease in Cc [9,21], increasing the Vo/Vc ratio and thus enhancing photorespiration [35,36]. Therefore, photorespiration usually increases with increasing light intensity in C3 plants [16,37,38,39,40]. Meanwhile, either an increase in gs or gm can partially compensate for the CO2 consumption in CO2 fixation. However, it is unclear whether the light response of photorespiration is mainly determined by gs or gm.
At saturating light, AN can be limited by RuBP carboxylation and/or RuBP regeneration [41,42,43]. Once the operating Cc is lower than the chloroplast CO2 concentration (Ctrans) at which the transition from RuBP carboxylation limitation to RuBP regeneration limitation occurs, AN is limited by RuBP carboxylation. When Cc is higher than Ctrans, then AN tends to be limited by RuBP regeneration. The major rate-limiting step of AN is species dependent and can be affected by leaf nitrogen content and measurement temperature [21,41,43]. However, the effect of gm on the rate-limiting step of AN is poorly understood. The leaf gm is positively correlated to leaf nitrogen content [18,38,43]. Furthermore, AN tends to be limited by RuBP regeneration in plants grown under high nitrogen concentrations but is limited by RuBP carboxylation in plants grown under nitrogen-deficient concentrations [43]. Therefore, we hypothesize that the rate-limiting step of AN under saturating light is largely determined by gm.
In this study, we measured light responses of gas exchange and chlorophyll fluorescence in nine evergreen sclerophyllous Rhododendron species. The aims of this study were (1) to investigate the light response changes in gm and the relative limitations of AN; (2) to assess whether the increase in Vo/Vc ratio under high light is mainly determined by gs or gm; and (3) to examine the effects of gm and lm on the rate-limiting step of AN.

2. Results

2.1. Light Intensity Dependence of Photosynthesis and Mesophyll Conductance

The A800/A1500 ratios ranged from 0.86 to 1.02, suggesting that AN were saturated or almost saturated at 800 μmol photons m−2 s−1. Under a high light of 1500 μmol photons m−2 s−1, AN were saturated in all Rhododendron species. The light-saturated AN ranged from 10.3 (R. ciliicalyx) to 17.8 μmol CO2 m−2 s−1 (R. glanduliferum), a total variation of 60% between species (Figure 1). Under such saturating light, the PSII electron transport rate (JPSII) ranged from 151.9 (R. decorum subsp. diaprepes) to 205.2 μmol electrons m−2 s−1 (R. delavayi), leading to a variation of 35% in JPSII (Figure 1).
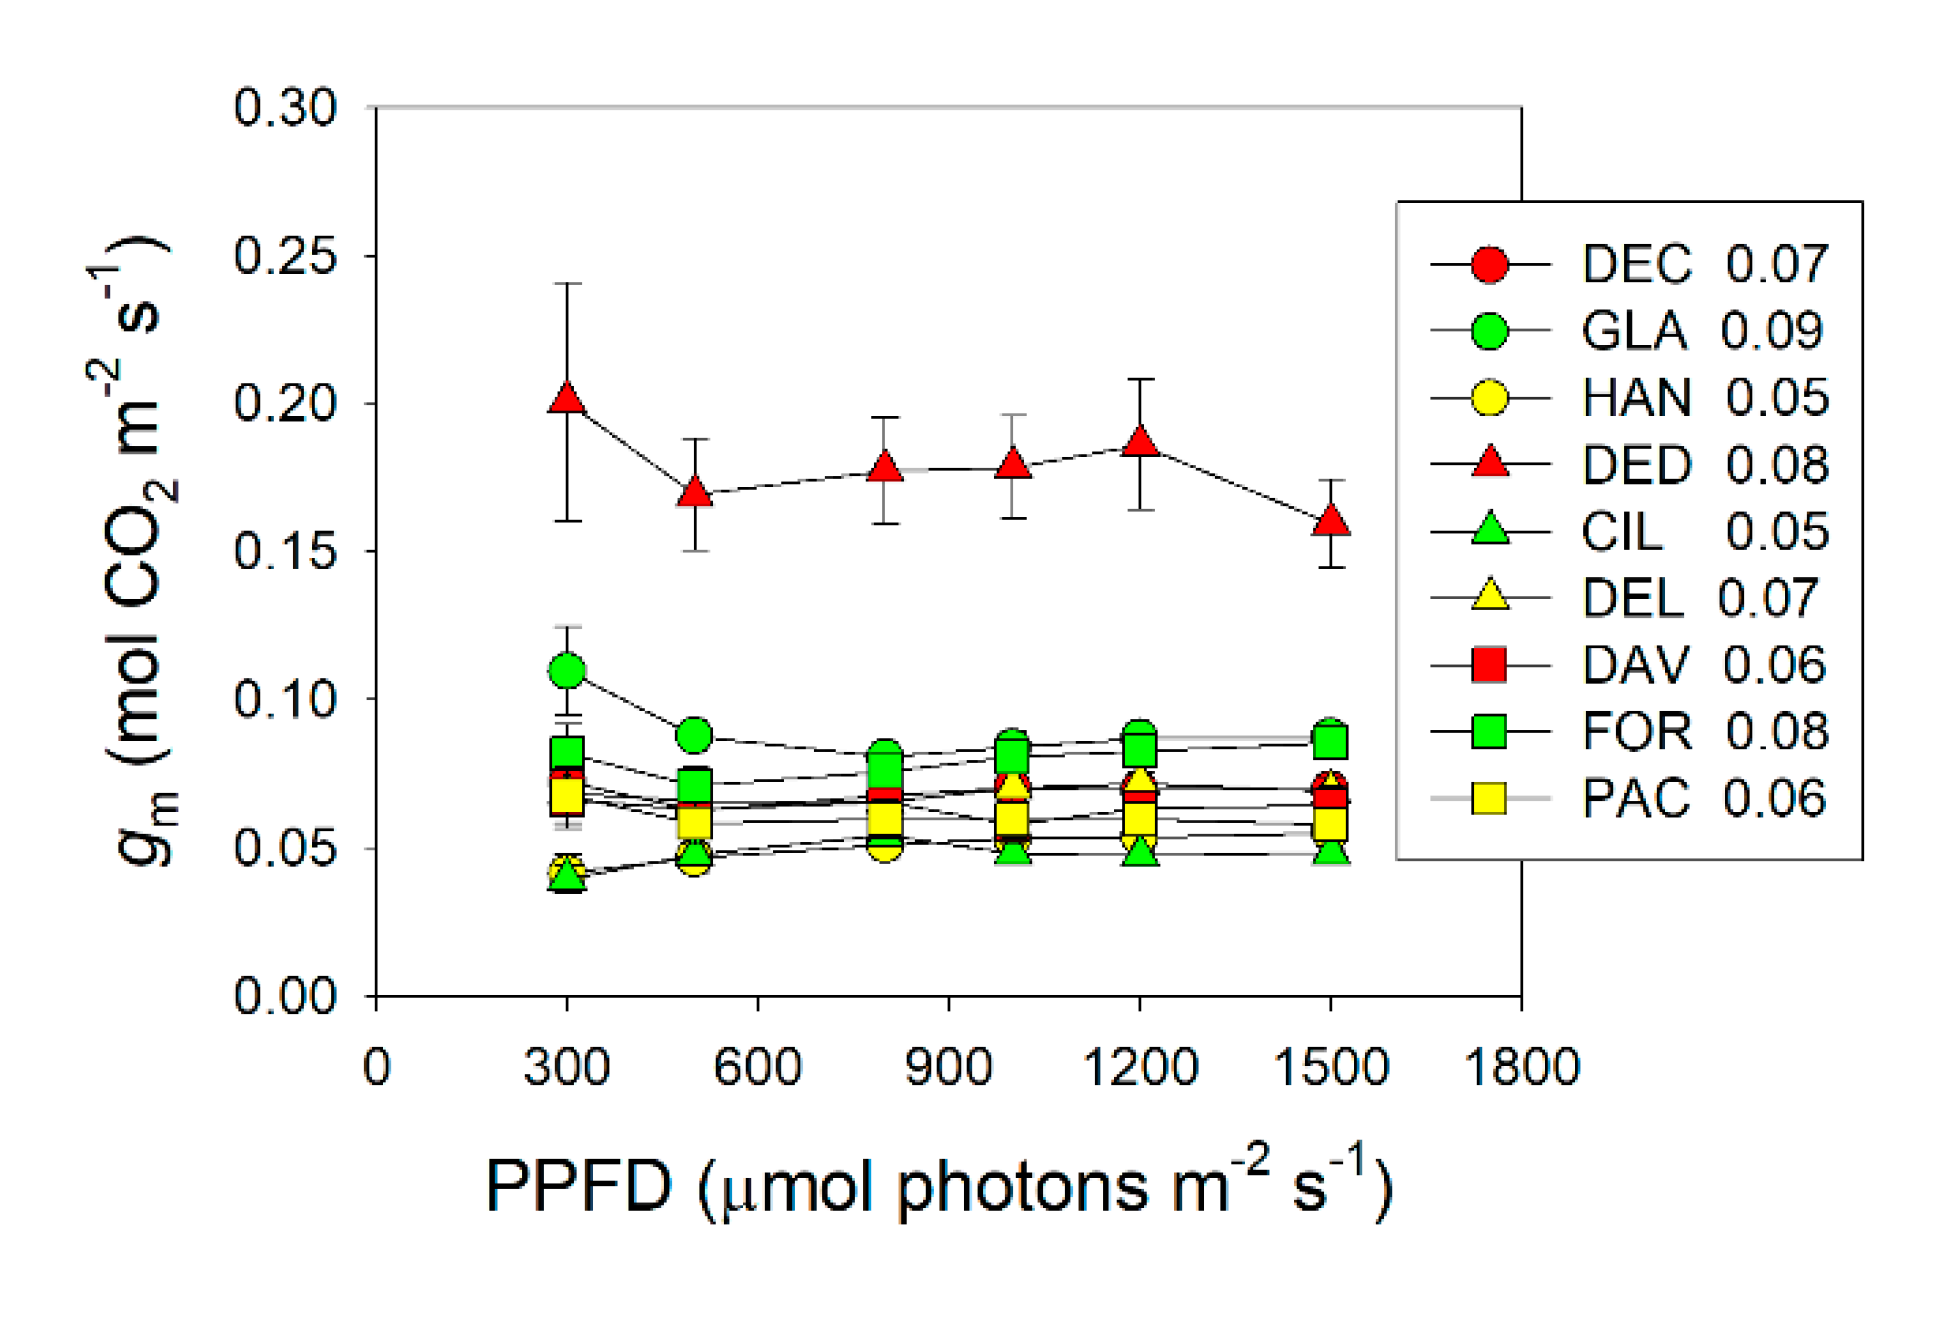
We calculated gm under different light intensities according to the method of [44]. The value of gm at 300 μmol photons m−2 s−1 varied between species, ranging from 0.040 (R. ciliicalyx) to 0.20 mol m−2 s−1 (R. decorum subsp. diaprepes) (Figure 2). At 1500 μmol photons m−2 s−1, gm ranged from 0.049 (R. ciliicalyx) to 0.16 mol m−2 s−1 (R. decorum subsp. diaprepes) (Figure 2). All species showed no significant change in gm between 300 and 1500 μmol photons m−2 s−1 and gm was maintained stable over the light intensity change (Figure 2). The average light response values of gm ranged from 0.048 (R. ciliicalyx) to 0.18 mol m−2 s−1 (R. decorum subsp. diaprepes) (Figure 2).

2.2. Light Intensity Dependence of Relative Limitations of Photosynthesis

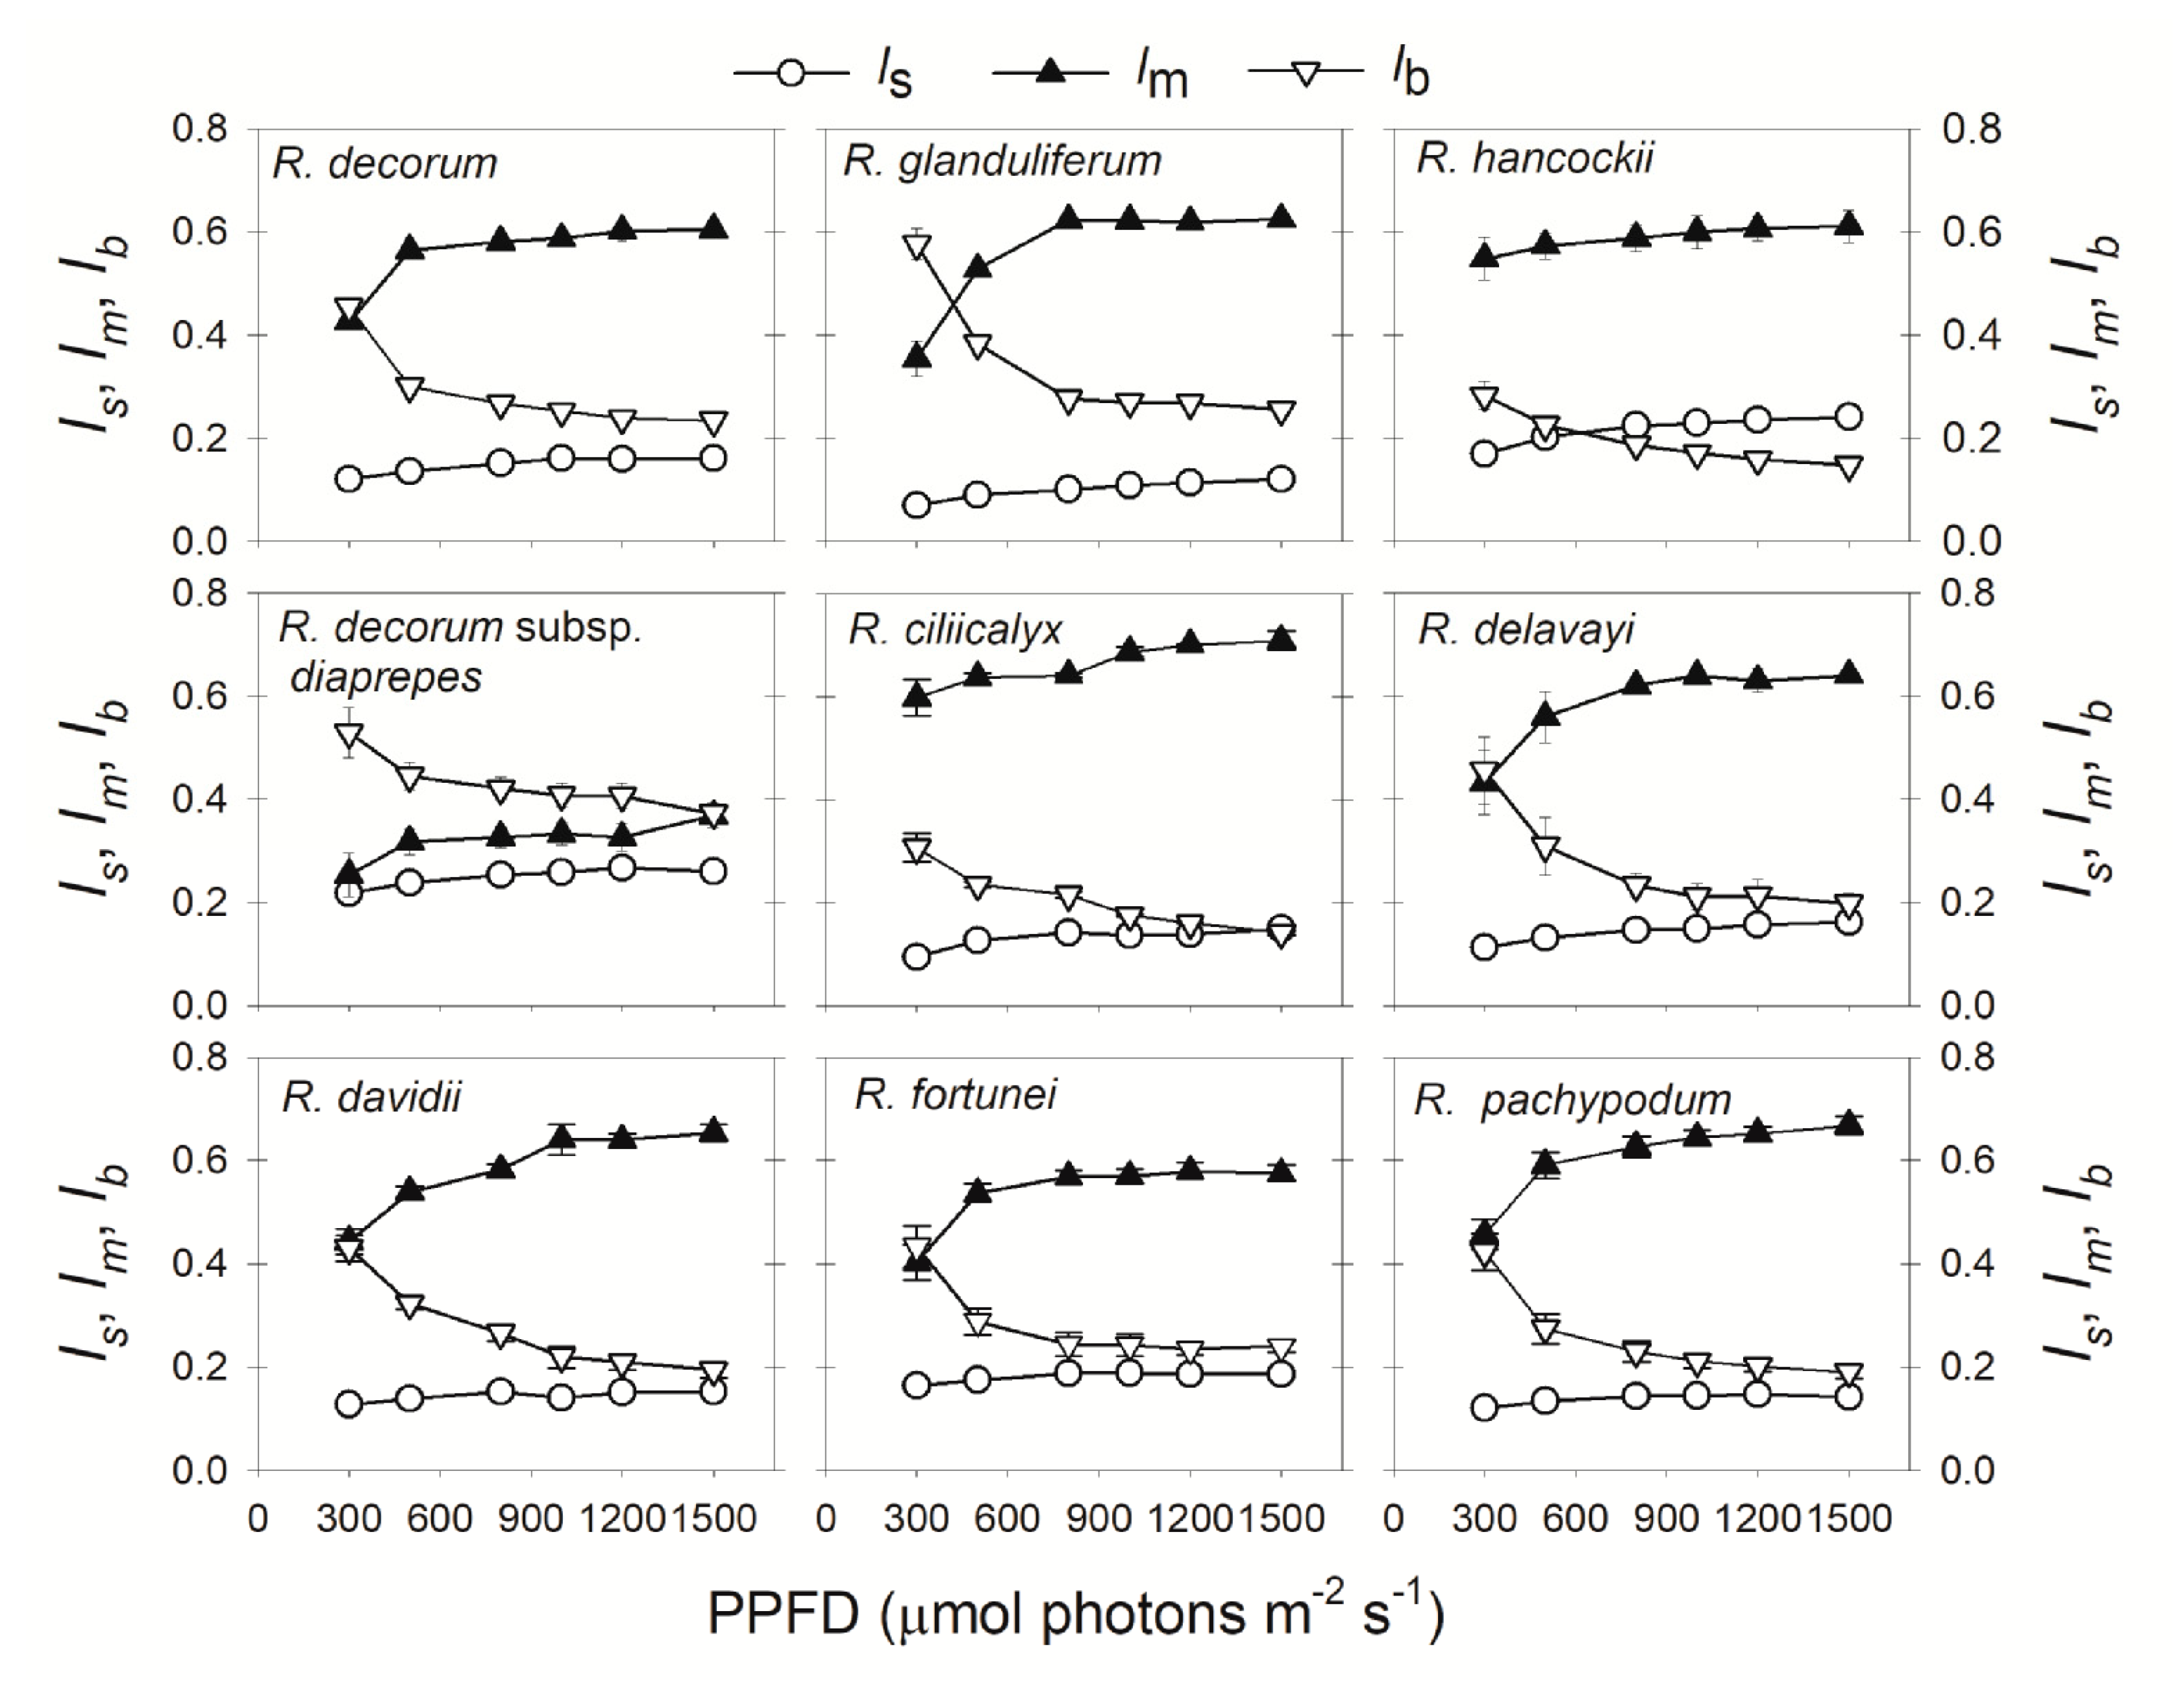
The relative limitations of photosynthesis were significantly affected by the light intensity. Under low light, the rate of photosynthesis was largely limited by biochemical capacity (lb) (Figure 3), owing to the lack of ATP and NADPH. With an increase in light intensity, lb gradually decreased (Figure 3). Meanwhile, mesophyll conductance limitation (lm) gradually increased and stomatal conductance limitation (ls) changed slightly (Figure 3). At a moderate light intensity of 500 μmol photons m−2 s−1, the major limiting factor for photosynthesis shifted from lb to lm, except for the species with the highest gm: R. decorum subsp. diaprepes (Figure 3). Under the saturating light of 1500 μmol photons m−2 s−1, lm ranged from 0.37 to 0.71, lb from 0.15 to 0.37, and ls from 0.12 to 0.26 (Figure 3). Therefore, gm is the major limiting factor for CO2 assimilation at saturating light in Rhododendron species, followed by biochemical capacity and stomatal conductance.
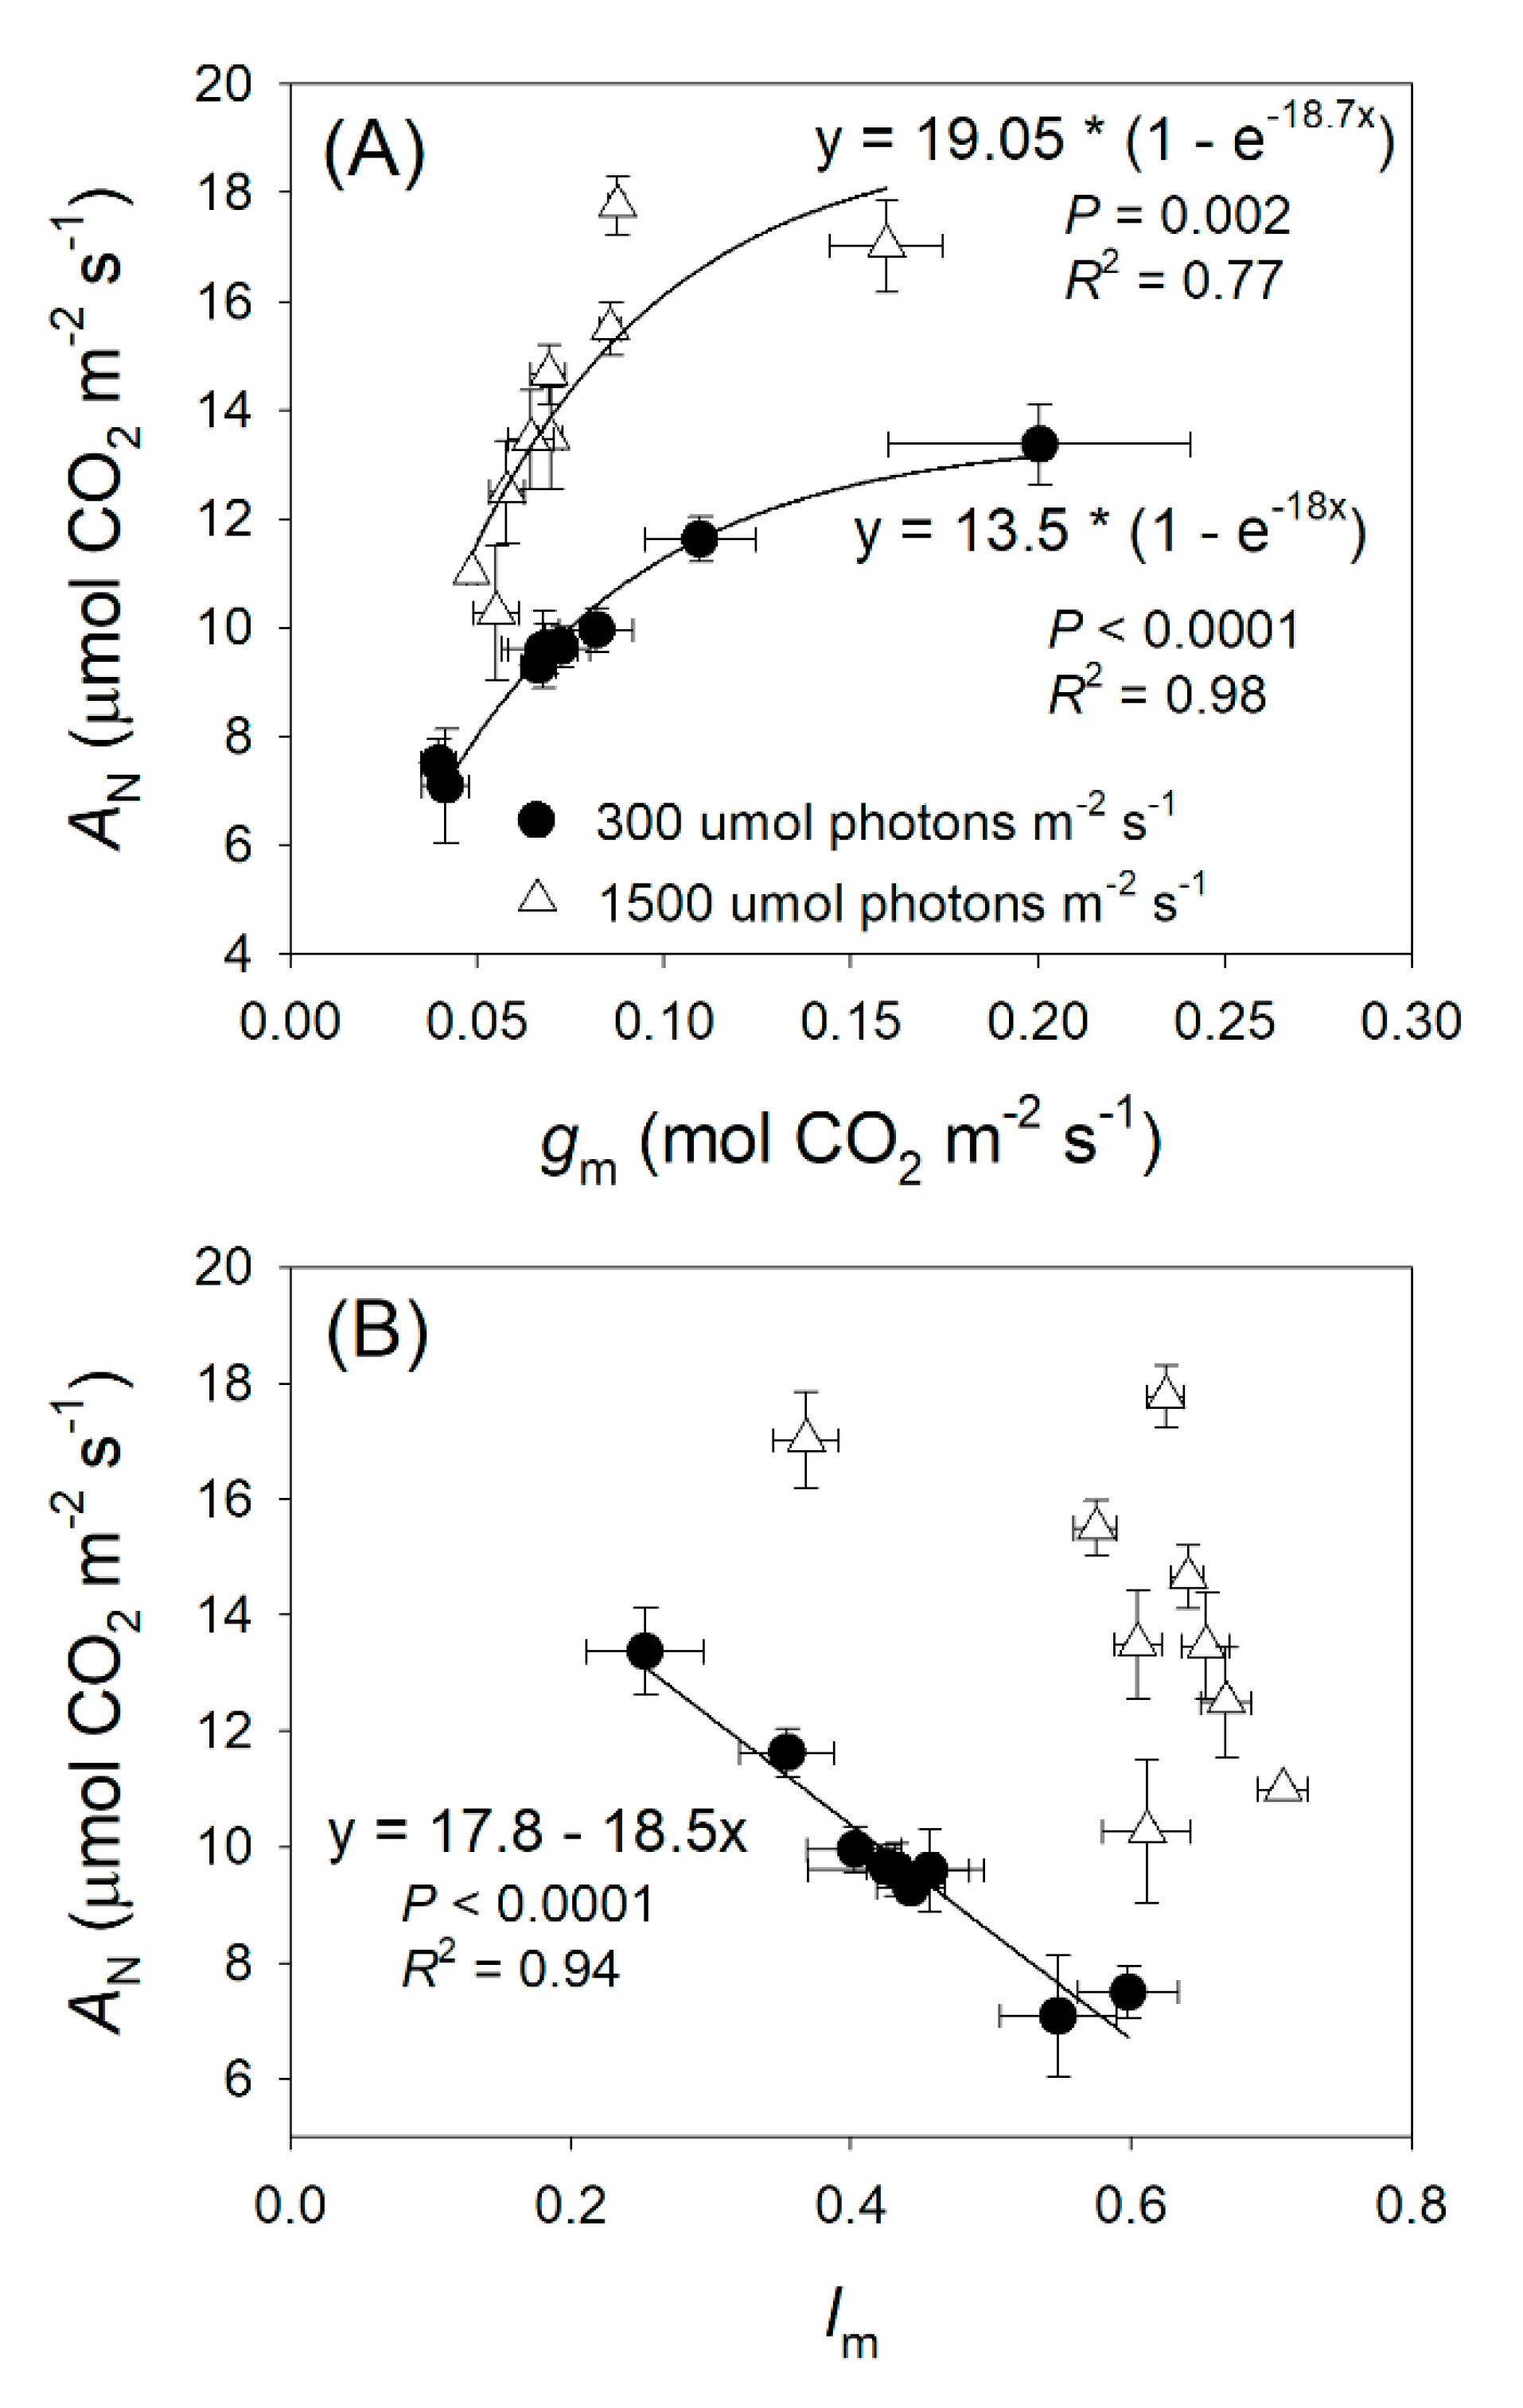
The relationships between gm, lm, and AN at sub-saturating and saturating light intensities were also analyzed in these studied species (Figure 4). As expected, the values of gm were significantly positively correlated to AN. Interestingly, a closer relationship between gm and AN was found at 300 μmol photons m−2 s−1 than that at 1500 μmol photons m−2 s−1 (Figure 4A). Furthermore, a close negative correlation was found between lm and AN at 300 μmol photons m−2 s−1 (Figure 4B). However, this significant relationship disappeared at 1500 μmol photons m−2 s−1 (Figure 4B). These results indicate that gm and lm play more important roles in determining AN at sub-saturating light than at saturating light.

2.3. Light Intensity Dependence of Chloroplast CO2 Concentration and Photorespiration

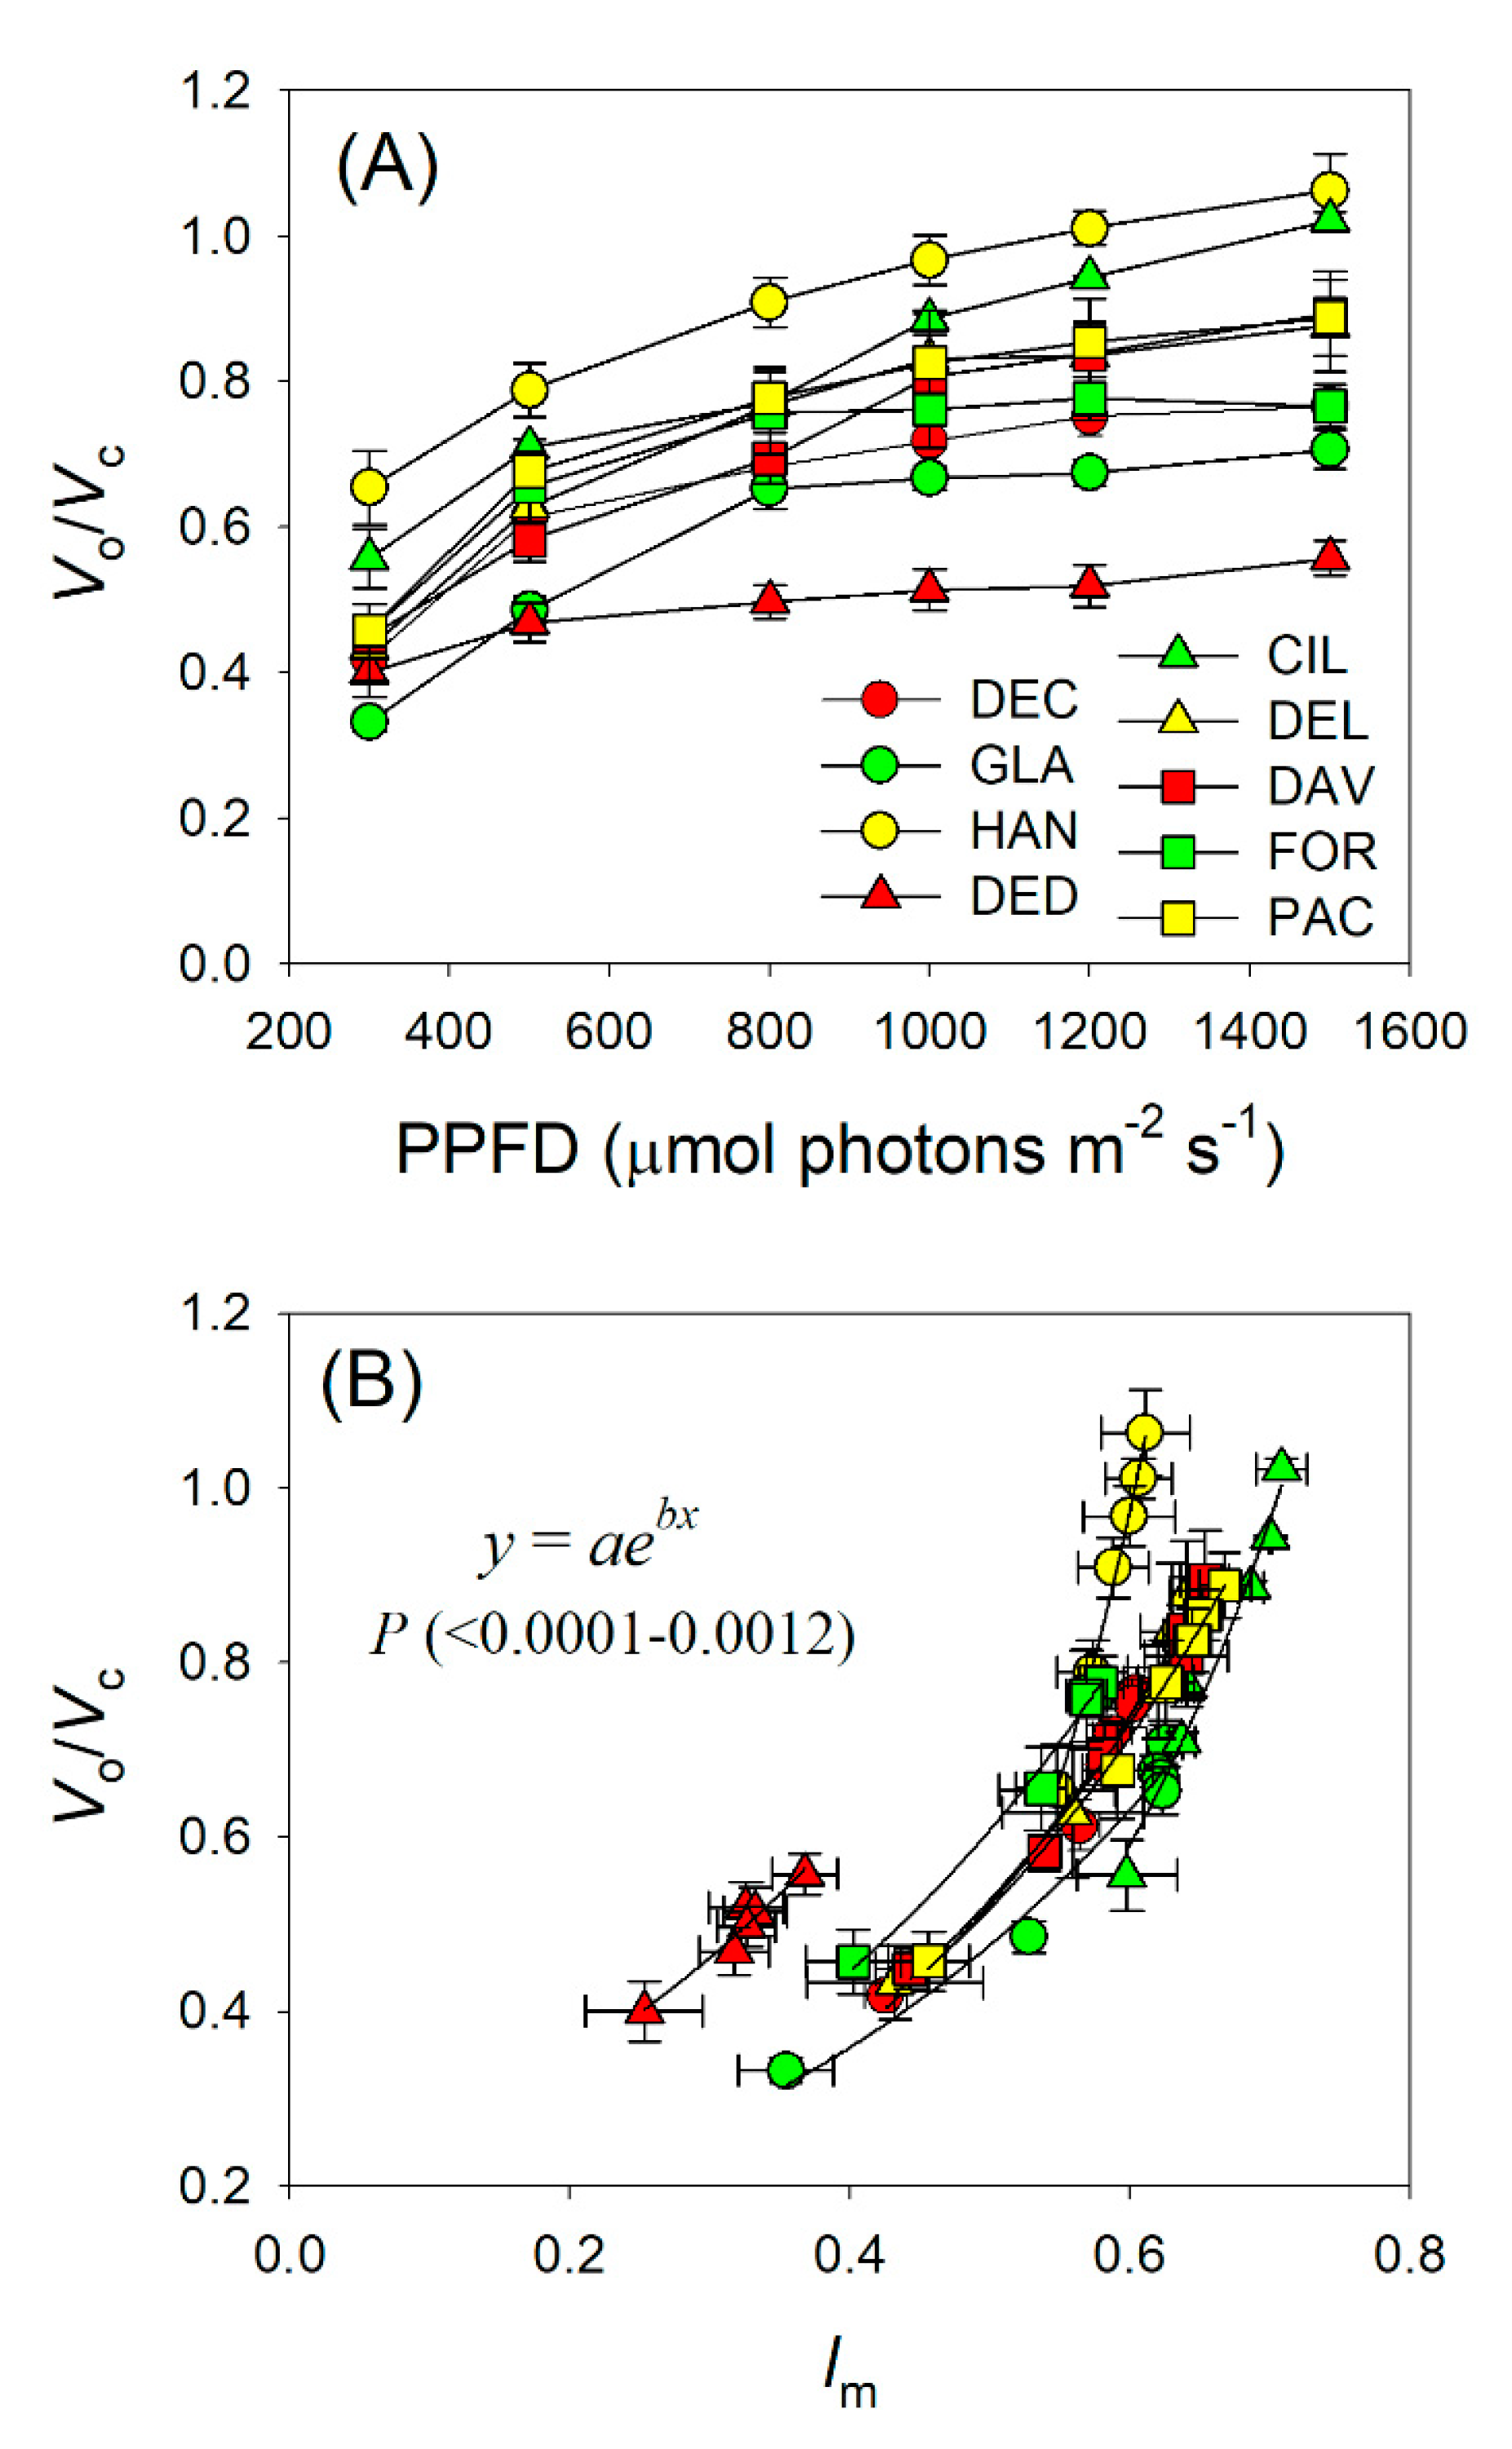
With an increase in light intensity, intercellular CO2 concentration (Ci) and chloroplast CO2 concentration (Cc) gradually decreased in all Rhododendron species (Figure 5A,B). At 1500 μmol photons m−2 s−1, Ci ranged from 253 (R. decorum subsp. diaprepes) to 317 μmol mol−1 (R. glanduliferum) (Figure 5A), and Cc ranged from 76 (R. hancockii) to 144 μmol mol−1 (R. decorum subsp. diaprepes) (Figure 5B). Further analysis found that the drop in Cc was tightly correlated with an increase in lm (Figure 5C). Therefore, the light dependence change in Cc was mainly caused by an increase in lm. Cc is known to be a key factor affecting the affinity of Rubisco to CO2 and O2, and thus determines the value of Vo/Vc. With an increase in illumination, the Vo/Vc ratio gradually increased (Figure 6A). Furthermore, the light dependence of Vo/Vc was positively correlated to lm (Figure 6B). These results indicate that the increased Vo/Vc with increasing irradiance was mainly caused by the enhanced lm.
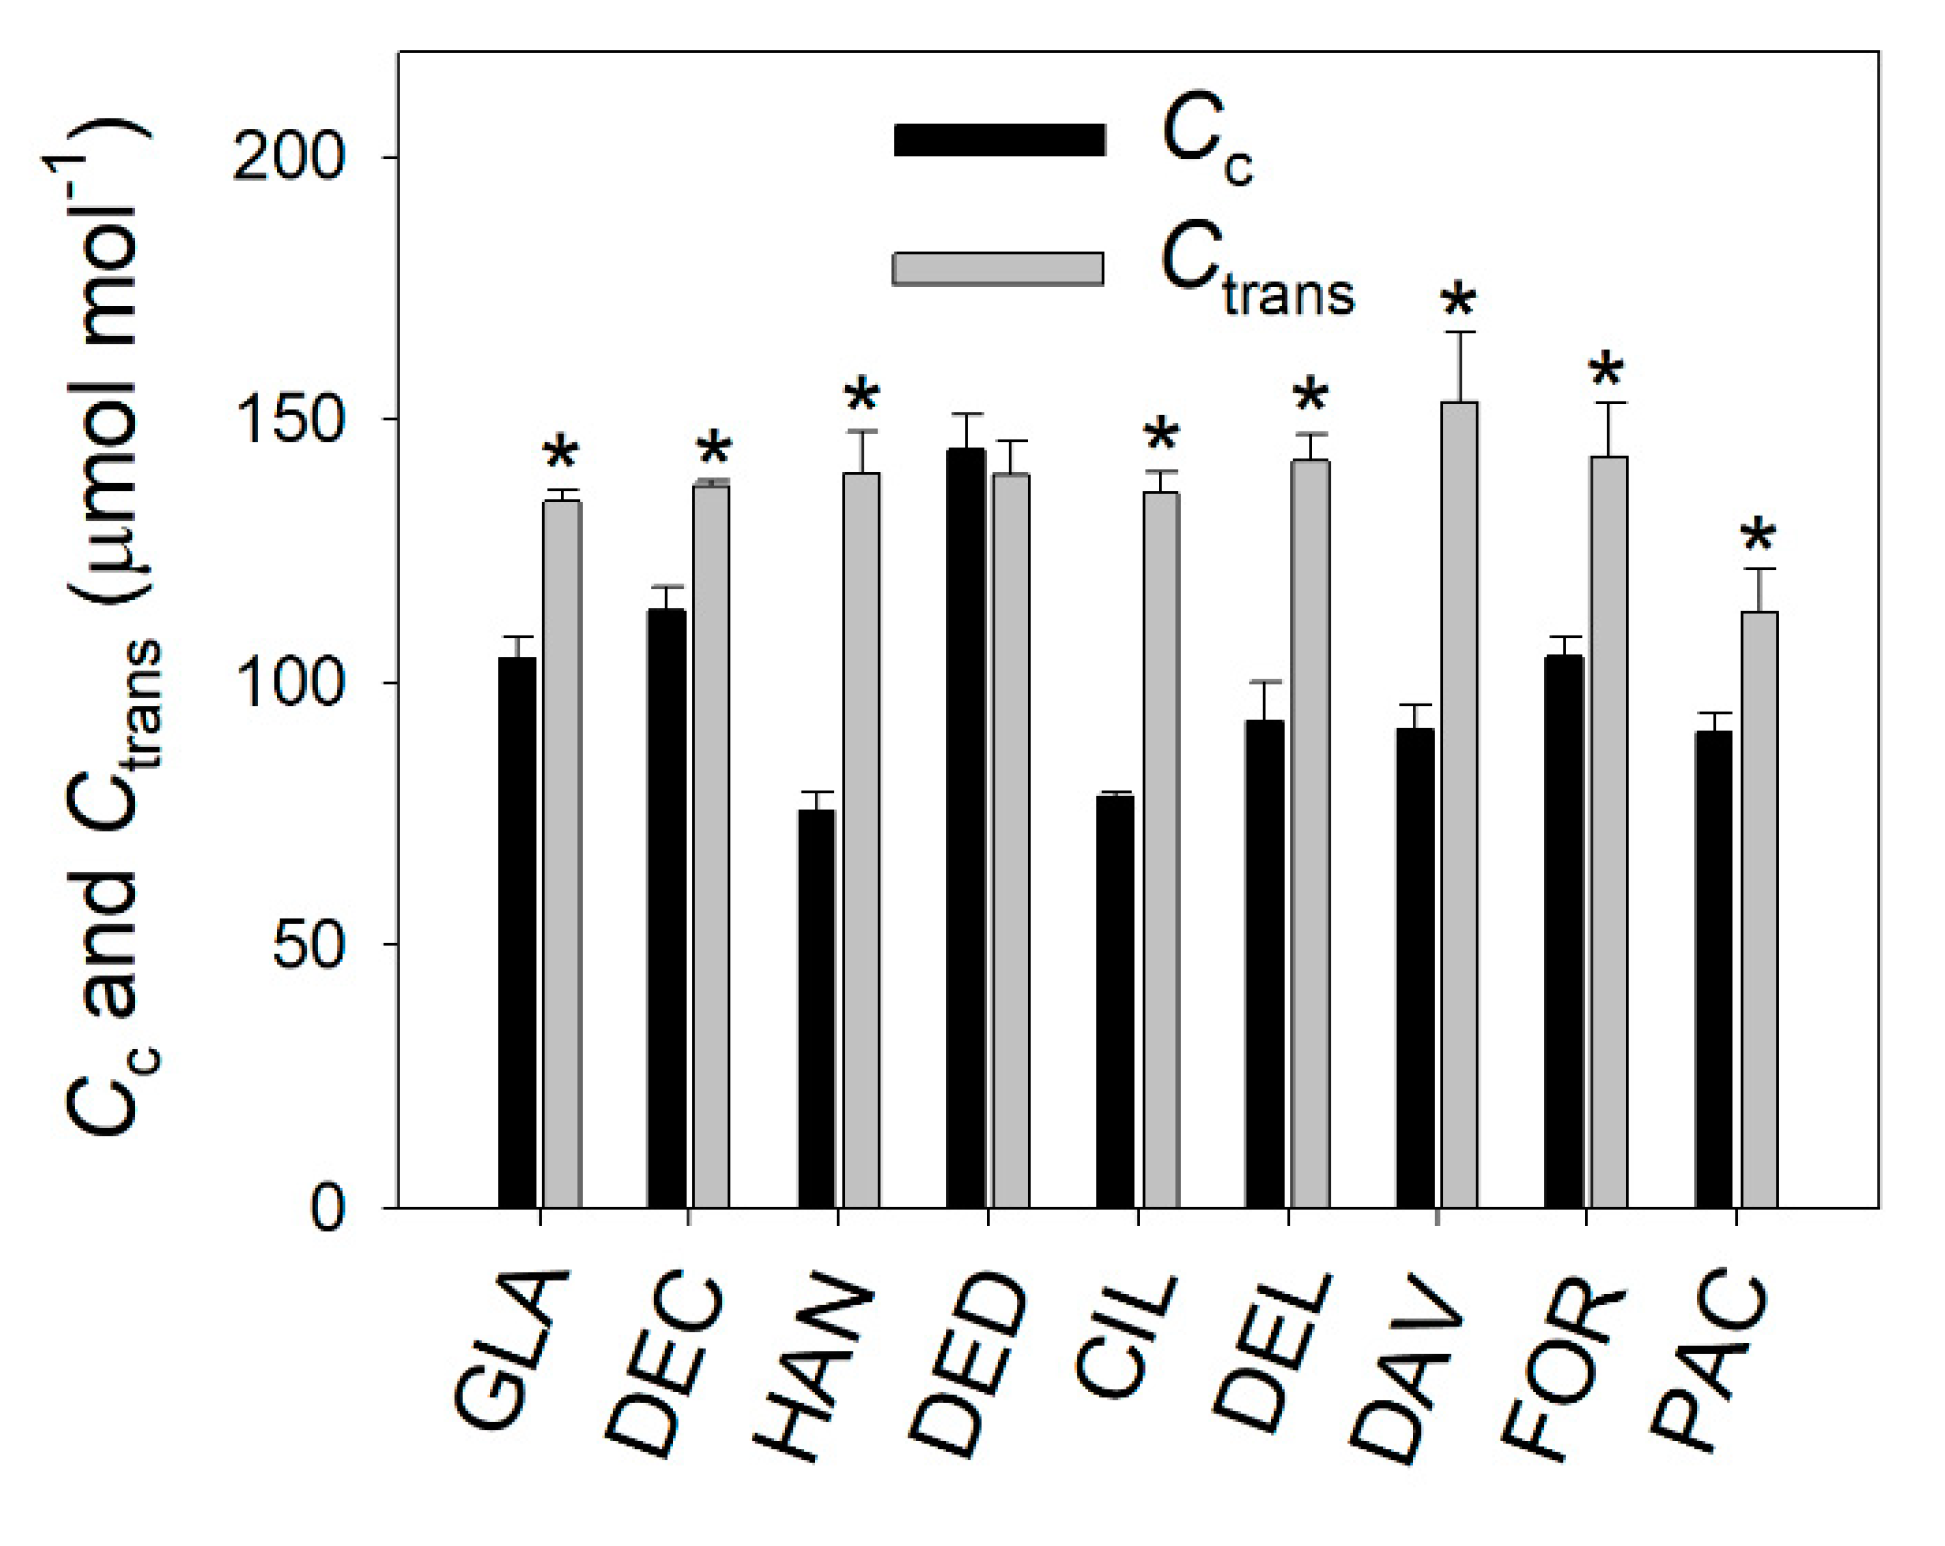
At 1500 μmol photons m−2 s−1, Ctrans was calculated to analyze the rate-limiting step of AN. The operating Cc values are significantly lower than the Ctrans values in these studied species, except for R. decorum subsp. diaprepes (Figure 7). Therefore, the saturating AN at current atmospheric CO2 concentration was mainly limited by RuBP carboxylation in these Rhododendron species. In R. decorum subsp. diaprepes, AN was limited by RuBP carboxylation and regeneration.

3. Discussion

3.1. Rapid Response of gm to Changes in Light Intensity is Consistent among Rhododendron Species

With an increase in light intensity, stomatal conductance gradually increased to enhance the CO2 diffusion from air to sub-stomatal internal cavities and thus to favor photosynthetic CO2 assimilation [45,46,47]. Subsequently, mesophyll conductance limits the diffusion of CO2 from intercellular cavities to the sites of carboxylation, and may respond rapidly to changes in light intensity. Some previous studies observed that gm rapidly increased with increasing irradiance in N. tabacum [15], Triticum durum, and Arbutus × ‘Marina’ [17], and three Eucalyptus species E. globules, E. saligna, and E. sieberi [13,14]. A recent study reported that gm rapidly responded to changes in light intensity in six studied angiosperms [19]. By contrast, some authors found that gm was not responsive to irradiance in Triticum aestivum [20] and N. tabacum [21]. Therefore, the response of gm to light intensity highly differs between species, presenting an important photosynthetic response to environmental change. However, the light response of gm in evergreen sclerophyllous angiosperms is poorly understood.
This article investigated the rapid response of gm to light intensity in nine sclerophyllous Rhododendron species. We found that the values of gm did not change between 300 and 1500 μmol photons m−2 s−1 in either of these species (Figure 2). Therefore, these nine Rhododendron species showed the same response model of gm to changes in light intensity. Consistently, the three Eucalyptus species E. globules, E. saligna, and E. sieberi also showed the same trend in the light response of gm [13,14]. Therefore, we propose that the rapid response of gm to the change in light intensity may be a conservative photosynthetic trait in a given genus. This conclusion is applicable only under normal growth conditions because water and/or nutrition stresses can alter the rapid response of gm to irradiance.

3.2. Light Response Changes in Relative Limitations of Photosynthesis

Many studies have documented that plant growth and crop productivity are largely linked to AN under high light [26,27,28]. However, global rice productivity in agricultural fields was not determined by the maximum AN under saturating light but was linked to the AN under low light [29]. Therefore, in order to optimize the cultivation strategy, we should take into consideration the relative limitations of photosynthesis under different light intensities. While the relative limitations of AN under high light are widely studied, information on the light response of relative limitations is very limited. In this article, we analyzed the relative limitations of AN under different light intensities in nine Rhododendron species. The stomatal conductance limitation was the most insignificant factor for AN in these species, irrespective of light intensity (Figure 3). Under low light, the light-dependent production of ATP and NADPH was restricted by limiting light energy, and AN was mainly limited by biochemical factors (Figure 3). With an increase in light intensity, ETRII rapidly increased (Figure 1), leading to the increased production rates of ATP and NADPH. In contrast, the value of Cc gradually decreased (Figure 5B). Therefore, the change in Cc was out-of-step with the change in energy supply, generating an imbalance between CO2 supply and production of ATP and NADPH. When exposed to a moderate light of 500 μmol photons m−2 s−1, the most limiting factor for AN shifted from biochemical capacity to gm (Figure 3). Therefore, gm was the major limiting factor for AN in these species when exposed to high light. Furthermore, the values of AN at 300 μmol photons m−2 s−1 were largely correlated to the values of gm and lm (Figure 4), indicating that increasing gm has a significant potential to increase AN under sub-saturating light. Taking into consideration that different plants have different light saturating points, measuring the light dependence changes in relative limitations of AN may have broad applications in tree breeding and crop improvement.
With an increase in light intensity, electron transport for photorespiration gradually increased [16,37,38,39]. However, it is unclear whether the light response of photorespiration was caused by the change of lm or ls. In this study, we found that ls showed only small responses to changes in light intensity (Figure 3). By comparison, lm gradually increased with light intensity (Figure 3). Meanwhile, Cc gradually decreased (Figure 5B) and the ratio of Vo/Vc gradually increased (Figure 6A). Furthermore, with an increase in light intensity, the decrease in Cc was tightly correlated to an increased lm (Figure 5C). Thus, the stable gm was insufficient to compensate for CO2 consumption by AN under high light, increasing the affinity of Rubisco to O2, and thus enhancing photorespiration. Therefore, the light response of photorespiration is more determined by lm rather than ls (Figure 6B).

3.3. CO2 Assimilation under High Light Tends to be Limited by RuBP Carboxylation in Rhododendron Species

In C3 plants, AN under saturating light can be limited by RuBP carboxylation and/or RuBP regeneration [21,42,43]. Once the value of Cc is lower than the value of Ctrans, AN tends to be limited by RuBP carboxylation [43]. When Cc is higher than Ctrans, AN is then limited by RuBP regeneration. However, the rate-limiting step of AN in sclerophyllous species is poorly understood. In this study, we found that the values of operating Cc under saturating light were significantly lower than the values of Ctrans in these species, apart from in R. decorum subsp. disprepes (Figure 7). Therefore, AN under saturating light in these Rhododendron species was mainly limited by RuBP carboxylation.
In general, the rate-limiting step of AN can be influenced by temperature and leaf nitrogen content [41,43]. For example, at normal growth temperatures, AN is limited by RuBP carboxylation under nitrogen deficiency but tends to be limited by RuBP regeneration at high nitrogen conditions in C3 crop species [43]. In this article, we found that the rate-limiting step of AN by RuBP carboxylation in Rhododendron species was mainly caused by a relatively lower gm (Figure 2 and Figure 7). In rice (Oryza sativa), wheat (Triticum aestivum), spinach (Spinacia oleracea), and tobacco (Nicotiana tabacum), values for gm at saturating light were higher than 0.2 mol m−2 s−1 [43,48]. By comparison, the studied Rhododendron species displayed gm values ranging from 0.048 to 0.18 mol m−2 s−1 (Figure 2). Such low gm in these Rhododendron species limited the diffusion of CO2 from intercellular cavities to chloroplasts, resulting in Cc being lower than Ctrans. Therefore, gm has the potential to alter the rate-limiting step of AN under high light.

4. Materials and Methods

4.1. Plant Materials and Growth Conditions

Nine evergreen sclerophyllous Rhododendron species from China were studied: R. decorum, R. glanduliferum, R. hancockii, R. decorum subsp. disprepes, R. ciliicalyx, R. delavayi, R. davidii, R. fortunei, and R. pachypodum. All plants of these species are cultivated in a common garden at the Kunming Botanical Garden, Yunnan, China (102°44′31″ E, 25°08′24″ N, 1950 m of elevation). We chose fully expanded but not senescent sun leaves for photosynthetic measurements. For each species, at least four leaves from different individual plants were measured.

4.2. Gas Exchange and Chlorophyll Fluorescence Measurements

Gas exchange and chlorophyll fluorescence were recorded using the 2-cm2 measuring head of LI-6400XT (Li-Cor Biosciences, Lincoln, NE, USA). All measurements were conducted at approximately 25 °C and relative air humidity near 60%. After photosynthetic induction at 1500 μmol photons m−2 s−1 for 20 min, light response curves were recorded at a 400 μmol mol−1 CO2 concentration, and photosynthetic parameters were monitored after exposure to each light intensity for 2 min. After light adaptation at 1500 μmol photons m−2 s−1 and 400 μmol mol−1 CO2 concentration for 20 min, A/Ci measurements were made at 50, 100, 150, 200, 300, 400, 600, 800, 1000, and 1200 μmol mol−1 CO2 concentrations. For each CO2 concentration, photosynthetic measurement was completed in 2 to 3 min. Using the A/Ci curves, the maximum rates of RuBP regeneration (Jmax) and carboxylation (Vcmax) were calculated [49].
The quantum yield of photosystem II (PSII) photochemistry was calculated as ΦPSII = (FmFs)/Fm [50], where Fm and Fs represent the maximum and steady-state fluorescence after light adaption, respectively [51]. The total electron transport rate through PSII (JPSII) was calculated as follows [52]:
J PSII = Φ PSII × PPFD × L abs × 0.5 ,
where PPFD is the photosynthetic photon flux density and leaf absorbance (Labs) is assumed to be 0.84. We applied the constant of 0.5 based on the assumption that photons were equally distributed between PSI and PSII.

4.3. Estimation of Mesophyll Conductance and Chloroplast CO2 Concentration

We calculated mesophyll conductance according to the following equation [44]:
g m = A N C i Γ ( J PSII + 8 ( A N + R d ) ) / ( J PSII 4 ( A N + R d ) ) ,
where AN represents the net rate of CO2 assimilation; Ci is the intercellular CO2 concentration; and Γ* is the CO2 compensation point in the absence of daytime respiration [41,48], and we used a typical value of 40 umol mol−1 in our current study [19]. Respiration rate in the dark (Rd) was considered to be the half of the dark-adapted mitochondrial respiration rate as measured after 10 min of dark adaptation [23].
Based on the estimated gm, we then calculated the chloroplast CO2 concentration (Cc) according to the following equation [49,53]:
C c = C i A N g m .
To identify the rate-limiting step of CO2 assimilation, we subsequently estimated Ctrans (the chloroplast CO2 concentration at which the transition from RuBP carboxylation to RuBP regeneration occurred) [21,43]:
C trans =   K c ( 1 + O / K o ) J max / 4 V cmax 2 Γ 1 J max / 4 V cmax
where Kc (μmol mol−1) and Ko (mmol mol−1) are assumed to be 407 μmol mol−1 and 277 mmol mol−1 at 25 °C, respectively (Long and Bernacchi 2003); O was assumed to be 210 mmol mol−1 (Farquhar et al., 1980). The rate-limiting step for CO2 assimilation was analyzed by comparing the values of Cc and Ctrans. AN tends to be limited by RuBP carboxylation when Cc is lower than Ctrans and tends to be limited by RuBP regeneration when Cc is higher than Ctrans.

4.4. Quantitative Limitation Analysis of AN

Relative photosynthetic limitations were assessed as follows [22]:
l s = g tot / g s × A N / C c g tot + A N / C c
l m = g tot / g m × A N / C c g tot + A N / C c
l b = g tot g tot + A N / C c
where ls, lm, and lb represent the relative limitations of stomatal conductance, mesophyll conductance, and biochemical capacity, respectively, in setting the observed value of AN. gtot is the total conductance of CO2 between the leaf surface and sites of RuBP carboxylation (calculated as 1/gtot = 1/gs + 1/gm).

4.5. Modeling of Vc and Vo

The rates of RuBP carboxylation (Vc) and oxygenation (Vo) were calculated as follows [36]:
V c = A n + R d 1 ( Γ / C c )
and:
V o = A n + R d ( C c / 2 Γ ) 0.5

4.6. Statistical Analysis

Data were displayed as means ± SE (n = 4–5). After testing for normality and homogeneity of variances, one-Way ANOVA tests were used at α = 0.05 significance level to determine whether significant differences existed between different averages.

5. Conclusions

In this study, we examined the light response of gm and its effect on photosynthesis in nine evergreen sclerophyllous Rhododendron species. The results indicated that all species showed no significant response of gm to variations in illumination. Therefore, the response of gm to rapid changes in irradiance may be a conservative photosynthetic trait in a given genus, at least in the genus Rhododendron. Furthermore, we found that the light response of photorespiration was mainly determined by gm limitation rather than gs limitation. At saturating light, gm limitation significantly affected the differentials between Ctrans and Cc, thus altering the rate-limiting step of AN. We propose that examining the light dependence changes in relative limitations of AN can provide some valuable means for tree breeding and crop improvement.

Author Contributions

Conceptualization, H.H. and W.H.; data curation, Y.-J.Y. and W.H.; formal analysis, Y.-J.Y., H.H., and W.H.; funding acquisition, H.H. and W.H.; investigation, Y.-J.Y. and W.H.; project administration, H.H. and W.H.; visualization, Y.-J.Y. and W.H.; writing—original draft, W.H. All authors have read and agreed to the published version of the manuscript.

Funding

This work was supported by the National Natural Science Foundation of China (grant 31670343) and the Youth Innovation Promotion Association of the Chinese Academy of Sciences (grant 2016347).

Conflicts of Interest

The authors declare no conflict of interest.

References

  1. Huang, W.; Yang, Y.-J.; Wang, J.-H.; Hu, H. Photorespiration is the major alternative electron sink under high light in alpine evergreen sclerophyllous Rhododendron species. Plant Sci. 2019, 110275. [Google Scholar] [CrossRef] [PubMed]
  2. Hassiotou, F.; Ludwig, M.; Renton, M.; Veneklaas, E.J.; Evans, J.R. Influence of leaf dry mass per area, CO2, and irradiance on mesophyll conductance in sclerophylls. J. Exp. Bot. 2009, 60, 2303–2314. [Google Scholar] [CrossRef] [PubMed] [Green Version]
  3. Niinemets, Ü.; Díaz-Espejo, A.; Flexas, J.; Galmés, J.; Warren, C.R. Role of mesophyll diffusion conductance in constraining potential photosynthetic productivity in the field. J. Exp. Bot. 2009, 60, 2249–2270. [Google Scholar] [CrossRef] [PubMed] [Green Version]
  4. Peguero-Pina, J.J.; Sisó, S.; Flexas, J.; Galmés, J.; García-Nogales, A.; Niinemets, Ü.; Sancho-Knapik, D.; Saz, M.Á.; Gil-Pelegrín, E. Cell-level anatomical characteristics explain high mesophyll conductance and photosynthetic capacity in sclerophyllous Mediterranean oaks. New Phytol. 2017, 214, 585–596. [Google Scholar] [CrossRef] [PubMed] [Green Version]
  5. Flexas, J.; Diaz-Espejo, A.; Gago, J.; Gallé, A.; Galmés, J.; Gulías, J.; Medrano, H. Photosynthetic limitations in Mediterranean plants: A review. Environ. Exp. Bot. 2014, 103, 12–23. [Google Scholar] [CrossRef]
  6. Niinemets, Ü.; Keenan, T. Photosynthetic responses to stress in Mediterranean evergreens: Mechanisms and models. Environ. Exp. Bot. 2014, 103, 24–41. [Google Scholar] [CrossRef]
  7. Peguero-Pina, J.J.; Sancho-Knapik, D.; Morales, F.; Flexas, J.; Gil-Pelegrin, E. Differential photosynthetic performance and photoprotection mechanisms of three Mediterranean evergreen oaks under severe drought stress. Funct. Plant Biol. 2009, 36, 453–462. [Google Scholar] [CrossRef] [Green Version]
  8. Peguero-Pina, J.J.; Sisó, S.; Fernández-Marín, B.; Flexas, J.; Galmés, J.; García-Plazaola, J.I.; Niinemets, Ü.; Sancho-Knapik, D.; Gil-Pelegrín, E. Leaf functional plasticity decreases the water consumption without further consequences for carbon uptake in Quercus coccifera L. under Mediterranean conditions. Tree Physiol. 2016, 36, 356–367. [Google Scholar] [CrossRef]
  9. Huang, W.; Tong, Y.-G.; Yu, G.-Y.; Yang, W.-X. The sclerophyllous Eucalyptus camaldulensis and herbaceous Nicotiana tabacum have different mechanisms to maintain high rates of photosynthesis. Front. Plant Sci. 2016, 7, 1769. [Google Scholar] [CrossRef] [Green Version]
  10. Yang, Y.-J.; Tong, Y.-G.; Yu, G.-Y.; Zhang, S.-B.; Huang, W. Photosynthetic characteristics explain the high growth rate for Eucalyptus camaldulensis: Implications for breeding strategy. Ind. Crops Prod. 2018, 124, 186–191. [Google Scholar] [CrossRef]
  11. Yamori, W. Photosynthetic response to fluctuating environments and photoprotective strategies under abiotic stress. J. Plant Res. 2016, 129, 379–395. [Google Scholar] [CrossRef] [PubMed]
  12. Valladares, F.; Allen, M.T.; Pearcy, R.W. Photosynthetic responses to dynamic light under field conditions in six tropical rainforest shrubs occurring along a light gradient. Oecologia 1997, 111, 505–514. [Google Scholar] [CrossRef] [PubMed]
  13. Douthe, C.; Dreyer, E.; Epron, D.; Warren, C.R. Mesophyll conductance to CO2, assessed from online TDL-AS records of 13CO2 discrimination, displays small but significant short-term responses to CO2 and irradiance in Eucalyptus seedlings. J. Exp. Bot. 2011, 62, 5335–5346. [Google Scholar] [CrossRef] [PubMed] [Green Version]
  14. Douthe, C.; Dreyer, E.; Brendel, O.; Warren, C.R. Is mesophyll conductance to CO2 in leaves of three Eucalyptus species sensitive to short-term changes of irradiance under ambient as well as low O2? Funct. Plant Biol. 2012, 39, 435–448. [Google Scholar] [CrossRef] [PubMed]
  15. Flexas, J.; Ribas-Carbó, M.; Diaz-Espejo, A.; Galmés, J.; Medrano, H. Mesophyll conductance to CO2: Current knowledge and future prospects. Plant. Cell Environ. 2008, 31, 602–621. [Google Scholar] [CrossRef]
  16. Cai, Y.-F.; Yang, Q.-Y.; Li, S.-F.; Wang, J.-H.; Huang, W. The water-water cycle is a major electron sink in Camellia species when CO2 assimilation is restricted. J. Photochem. Photobiol. B Biol. 2017, 168, 59–66. [Google Scholar] [CrossRef]
  17. Théroux-Rancourt, G.; Gilbert, M.E. The light response of mesophyll conductance is controlled by structure across leaf profiles. Plant. Cell Environ. 2017, 40, 726–740. [Google Scholar] [CrossRef] [Green Version]
  18. Xiong, D.; Liu, X.; Liu, L.; Douthe, C.; Li, Y.; Peng, S.; Huang, J. Rapid responses of mesophyll conductance to changes of CO2 concentration, temperature and irradiance are affected by N supplements in rice. Plant Cell Environ. 2015, 38, 2541–2550. [Google Scholar] [CrossRef]
  19. Xiong, D.; Douthe, C.; Flexas, J. Differential coordination of stomatal conductance, mesophyll conductance, and leaf hydraulic conductance in response to changing light across species. Plant. Cell Environ. 2018, 41, 436–450. [Google Scholar] [CrossRef]
  20. Tazoe, Y.; Von Caemmerer, S.; Badger, M.R.; Evans, J.R. Light and CO2 do not affect the mesophyll conductance to CO2 diffusion in wheat leaves. J. Exp. Bot. 2009, 60, 2291–2301. [Google Scholar] [CrossRef] [Green Version]
  21. Yamori, W.; Evans, J.R.; Von Caemmerer, S. Effects of growth and measurement light intensities on temperature dependence of CO2 assimilation rate in tobacco leaves. Plant Cell Environ. 2010, 33, 332–343. [Google Scholar] [CrossRef]
  22. Grassi, G.; Magnani, F. Stomatal, mesophyll conductance and biochemical limitations to photosynthesis as affected by drought and leaf ontogeny in ash and oak trees. Plant Cell Environ. 2005, 28, 834–849. [Google Scholar] [CrossRef]
  23. Carriquí, M.; Cabrera, H.M.; Conesa, M.; Coopman, R.E.; Douthe, C.; Gago, J.; Gallé, A.; Galmés, J.; Ribas-Carbo, M.; Tomás, M.; et al. Diffusional limitations explain the lower photosynthetic capacity of ferns as compared with angiosperms in a common garden study. Plant Cell Environ. 2015, 38, 448–460. [Google Scholar] [CrossRef] [PubMed]
  24. Tosens, T.; Nishida, K.; Gago, J.; Coopman, R.E.; Cabrera, H.M.; Carriquí, M.; Laanisto, L.; Morales, L.; Nadal, M.; Rojas, R.; et al. The photosynthetic capacity in 35 ferns and fern allies: Mesophyll CO2 diffusion as a key trait. New Phytol. 2016, 209, 1576–1590. [Google Scholar] [CrossRef] [PubMed]
  25. Yang, Z.-H.; Huang, W.; Yang, Q.-Y.; Chang, W.; Zhang, S.-B. Anatomical and diffusional determinants inside leaves explain the difference in photosynthetic capacity between Cypripedium and Paphiopedilum, Orchidaceae. Photosynth. Res. 2018, 136, 315–328. [Google Scholar] [CrossRef] [PubMed]
  26. Yamori, W.; Kondo, E.; Sugiura, D.; Terashima, I.; Suzuki, Y.; Makino, A. Enhanced leaf photosynthesis as a target to increase grain yield: Insights from transgenic rice lines with variable Rieske FeS protein content in the cytochrome b6/f complex. Plant Cell Environ. 2016, 39, 80–87. [Google Scholar] [CrossRef]
  27. Yamori, W.; Sakata, N.; Suzuki, Y.; Shikanai, T.; Makino, A. Cyclic electron flow around photosystem I via chloroplast NAD(P)H dehydrogenase (NDH) complex performs a significant physiological role during photosynthesis and plant growth at low temperature in rice. Plant J. 2011, 68, 966–976. [Google Scholar] [CrossRef]
  28. Yamori, W.; Makino, A.; Shikanai, T. A physiological role of cyclic electron transport around photosystem I in sustaining photosynthesis under fluctuating light in rice. Sci. Rep. 2016, 6, 20147. [Google Scholar] [CrossRef] [Green Version]
  29. Qu, M.; Zheng, G.; Hamdani, S.; Essemine, J.; Song, Q.; Wang, H.; Chu, C.; Sirault, X.; Zhu, X.-G. Leaf photosynthetic parameters related to biomass accumulation in a global rice diversity survey. Plant Physiol. 2017, 175, 248–258. [Google Scholar] [CrossRef] [Green Version]
  30. Timm, S.; Florian, A.; Fernie, A.R.; Bauwe, H. The regulatory interplay between photorespiration and photosynthesis. J. Exp. Bot. 2016, 67, 2923–2929. [Google Scholar] [CrossRef] [Green Version]
  31. Peterhansel, C.; Maurino, V.G. Photorespiration Redesigned. Plant Physiol. 2011, 155, 49–55. [Google Scholar] [CrossRef] [PubMed] [Green Version]
  32. Bauwe, H.; Hagemann, M.; Kern, R.; Timm, S. Photorespiration has a dual origin and manifold links to central metabolism. Curr. Opin. Plant Biol. 2012, 15, 269–275. [Google Scholar] [CrossRef]
  33. Timm, S.; Florian, A.; Arrivault, S.; Stitt, M.; Fernie, A.R.; Bauwe, H. Glycine decarboxylase controls photosynthesis and plant growth. FEBS Lett. 2012, 586, 3692–3697. [Google Scholar] [CrossRef] [PubMed] [Green Version]
  34. Timm, S.; Wittmiß, M.; Gamlien, S.; Ewald, R.; Florian, A.; Frank, M.; Wirtz, M.; Hell, R.; Fernie, A.R.; Bauwe, H. Mitochondrial dihydrolipoyl dehydrogenase activity shapes photosynthesis and photorespiration of Arabidopsis thaliana. Plant Cell 2015, 27, 1968–1984. [Google Scholar] [CrossRef] [PubMed] [Green Version]
  35. Walker, B.J.; Strand, D.D.; Kramer, D.M.; Cousins, A.B. The response of cyclic electron flow around photosystem I to changes in photorespiration and nitrate assimilation. Plant Physiol. 2014, 165, 453–462. [Google Scholar] [CrossRef] [Green Version]
  36. Walker, B.J.; VanLoocke, A.; Bernacchi, C.J.; Ort, D.R. The costs of photorespiration to food production now and in the future. Annu. Rev. Plant Biol. 2016, 67, 107–129. [Google Scholar] [CrossRef] [Green Version]
  37. Zhang, W.; Huang, W.; Yang, Q.Y.; Zhang, S.B.; Hu, H. Effect of growth temperature on the electron flow for photorespiration in leaves of tobacco grown in the field. Physiol. Plant. 2013, 149, 141–150. [Google Scholar] [CrossRef]
  38. Huang, W.; Yang, Y.J.; Hu, H.; Zhang, S.B. Response of the water-water cycle to the change in photorespiration in tobacco. J. Photochem. Photobiol. B Biol. 2016, 157, 97–104. [Google Scholar] [CrossRef]
  39. Valentini, R.; Epron, D.; Angelis, P.D.E.; Matteucci, G.; Dreyer, E. In situ estimation of net CO2 assimilation, photosynthetic electron flow and photorespiration in Turkey oak (Q. cerris L.) leaves: Diurnal cycles under different levels of water supply. Plant Cell Environ. 1995, 18, 631–640. [Google Scholar] [CrossRef]
  40. Vines, H.M.; Armitage, A.M.; Chen, S.-S.; Tu, Z.-P.; Black, C.C. A Transient Burst of CO 2 from Geranium Leaves during Illumination at Various Light Intensities as a Measure of Photorespiration. Plant Physiol. 1982, 70, 629–631. [Google Scholar] [CrossRef] [Green Version]
  41. Yamori, W.; Noguchi, K.; Hikosaka, K.; Terashima, I. Phenotypic plasticity in photosynthetic temperature acclimation among crop species with different cold tolerances. Plant Physiol. 2010, 152, 388–399. [Google Scholar] [CrossRef] [PubMed] [Green Version]
  42. Farquhar, G.D.; von Caemmerer, S.; Berry, J.A. A biochemical model of photosynthetic CO2 assimilation in leaves of C3 species. Planta 1980, 149, 78–90. [Google Scholar] [CrossRef] [PubMed] [Green Version]
  43. Yamori, W.; Nagai, T.; Makino, A. The rate-limiting step for CO2 assimilation at different temperatures is influenced by the leaf nitrogen content in several C3 crop species. Plant Cell Environ. 2011, 34, 764–777. [Google Scholar] [CrossRef] [PubMed]
  44. Harley, P.C.; Loreto, F.; Di Marco, G.; Sharkey, T.D. Theoretical considerations when estimating the mesophyll conductance to CO2 flux by analysis of the response of photosynthesis to CO2. Plant Physiol. 1992, 98, 1429–1436. [Google Scholar] [CrossRef] [Green Version]
  45. De Souza, A.P.; Wang, Y.; Orr, D.J.; Carmo-Silva, E.; Long, S.P. Photosynthesis across African cassava germplasm is limited by Rubisco and mesophyll conductance at steady state, but by stomatal conductance in fluctuating light. New Phytol. 2020, 225, 2498–2512. [Google Scholar] [CrossRef] [Green Version]
  46. Yamori, W.; Kusumi, K.; Iba, K.; Terashima, I. Increased stomatal conductance induces rapid changes to photosynthetic rate in response to naturally fluctuating light conditions in rice. Plant. Cell Environ. 2020, 43, 1230–1240. [Google Scholar] [CrossRef]
  47. Huang, W.; Hu, H.; Zhang, S.-B. Photorespiration plays an important role in the regulation of photosynthetic electron flow under fluctuating light in tobacco plants grown under full sunlight. Front. Plant Sci. 2015, 6, 621. [Google Scholar] [CrossRef] [Green Version]
  48. von Caemmerer, S.; Evans, J.R. Temperature responses of mesophyll conductance differ greatly between species. Plant Cell Environ. 2015, 38, 629–637. [Google Scholar] [CrossRef]
  49. Long, S.P.; Bernacchi, C.J. Gas exchange measurements, what can they tell us about the underlying limitations to photosynthesis? Procedures and sources of error. J. Exp. Bot. 2003, 54, 2393–2401. [Google Scholar] [CrossRef] [Green Version]
  50. Genty, B.; Briantais, J.-M.; Baker, N.R. The relationship between the quantum yield of photosynthetic electron transport and quenching of chlorophyll fluorescence. Biochim. Biophys. Acta Gen. Subj. 1989, 990, 87–92. [Google Scholar] [CrossRef]
  51. Baker, N.R. Applications of chlorophyll fluorescence can improve crop production strategies: An examination of future possibilities. J. Exp. Bot. 2004, 55, 1607–1621. [Google Scholar] [CrossRef] [PubMed] [Green Version]
  52. Krall, J.P.; Edwards, G.E. Relationship between photosystem II activity and CO2 fixation in leaves. Physiol. Plant. 1992, 86, 180–187. [Google Scholar] [CrossRef]
  53. Warren, C.R.; Dreyer, E. Temperature response of photosynthesis and internal conductance to CO2: Results from two independent approaches. J. Exp. Bot. 2006, 57, 3057–3067. [Google Scholar] [CrossRef] [PubMed] [Green Version]
Figure 1. Responses of the leaf CO2 assimilation rate (AN) and electron transport rate (JPSII) to incident photosynthetic photon flux density (PPFD) in nine Rhododendron species. Symbols represent means ± SE (n = 4–5).
Plants 09 01536 g001
Figure 2. Response of mesophyll conductance (gm) to incident light intensity in nine Rhododendron species. The average gm values across light response curves in these nine Rhododendron species are displayed with the symbols. Symbols represent means ± SE (n = 4–5). Species abbreviations: DEC, R. decorum; GLA, R. glanduliferum; HAN, R. hancockii; DED, R. decorum subsp. disprepes; CIL, R. ciliicalyx; DEL, R. delavayi; DAV, R. davidii; FOR, R. fortunei; PAC, R. pachypodum.
Plants 09 01536 g002
Figure 3. Light intensity dependence of relative limitations of photosynthesis in nine Rhododendron species. ls, relative stomatal conductance limitation; lm, relative mesophyll conductance limitation; lb, relative biochemical limitation. Symbols represent means ± SE (n = 4–5).
Plants 09 01536 g003
Figure 4. The relationship between gm and AN (A), lm and AN (B) at 300 and 1500 μmol photons m−2 s−1 in nine Rhododendron species. Symbols represent means ± SE (n = 4–5).
Plants 09 01536 g004
Figure 5. (A,B) Responses of intercellular and chloroplast CO2 concentrations (Ci and Cc, respectively) to incident light intensity in nine Rhododendron species. (C) Relationship between lm and Cc across light response curves in these nine Rhododendron species. Symbols represent means ± SE (n = 4–5). Species abbreviations: DEC, R. decorum; GLA, R. glanduliferum; HAN, R. hancockii; DED, R. decorum subsp. disprepes; CIL, R. ciliicalyx; DEL, R. delavayi; DAV, R. davidii; FOR, R. fortunei; PAC, R. pachypodum.
Plants 09 01536 g005
Figure 6. (A) Light intensity dependence of the Vo/Vc ratio in nine Rhododendron species. (B) Relationship between lm and Vo/Vc across light response curves in these nine Rhododendron species. Symbols represent means ± SE (n = 4–5). Species abbreviations: DEC, R. decorum; GLA, R. glanduliferum; HAN, R. hancockii; DED, R. decorum subsp. disprepes; CIL, R. ciliicalyx; DEL, R. delavayi; DAV, R. davidii; FOR, R. fortunei; PAC, R. pachypodum.
Plants 09 01536 g006
Figure 7. Comparison of Cc and Ctrans at 1500 μmol photons m−2 s−1 in nine Rhododendron species. Symbols represent means ± SE (n = 4–5). Significant differences at a 5% confidence level are indicated with an asterisk. Species abbreviations: DEC, R. decorum; GLA, R. glanduliferum; HAN, R. hancockii; DED, R. decorum subsp. disprepes; CIL, R. ciliicalyx; DEL, R. delavayi; DAV, R. davidii; FOR, R. fortunei; PAC, R. pachypodum.
Plants 09 01536 g007
Publisher’s Note: MDPI stays neutral with regard to jurisdictional claims in published maps and institutional affiliations.