Advances in Non-Destructive Early Assessment of Fruit Ripeness towards Defining Optimal Time of Harvest and Yield Prediction—A Review


Abstract
1. Introduction
2. Colour Measurement
2.1. Colorimeter
2.2. Visible Imaging
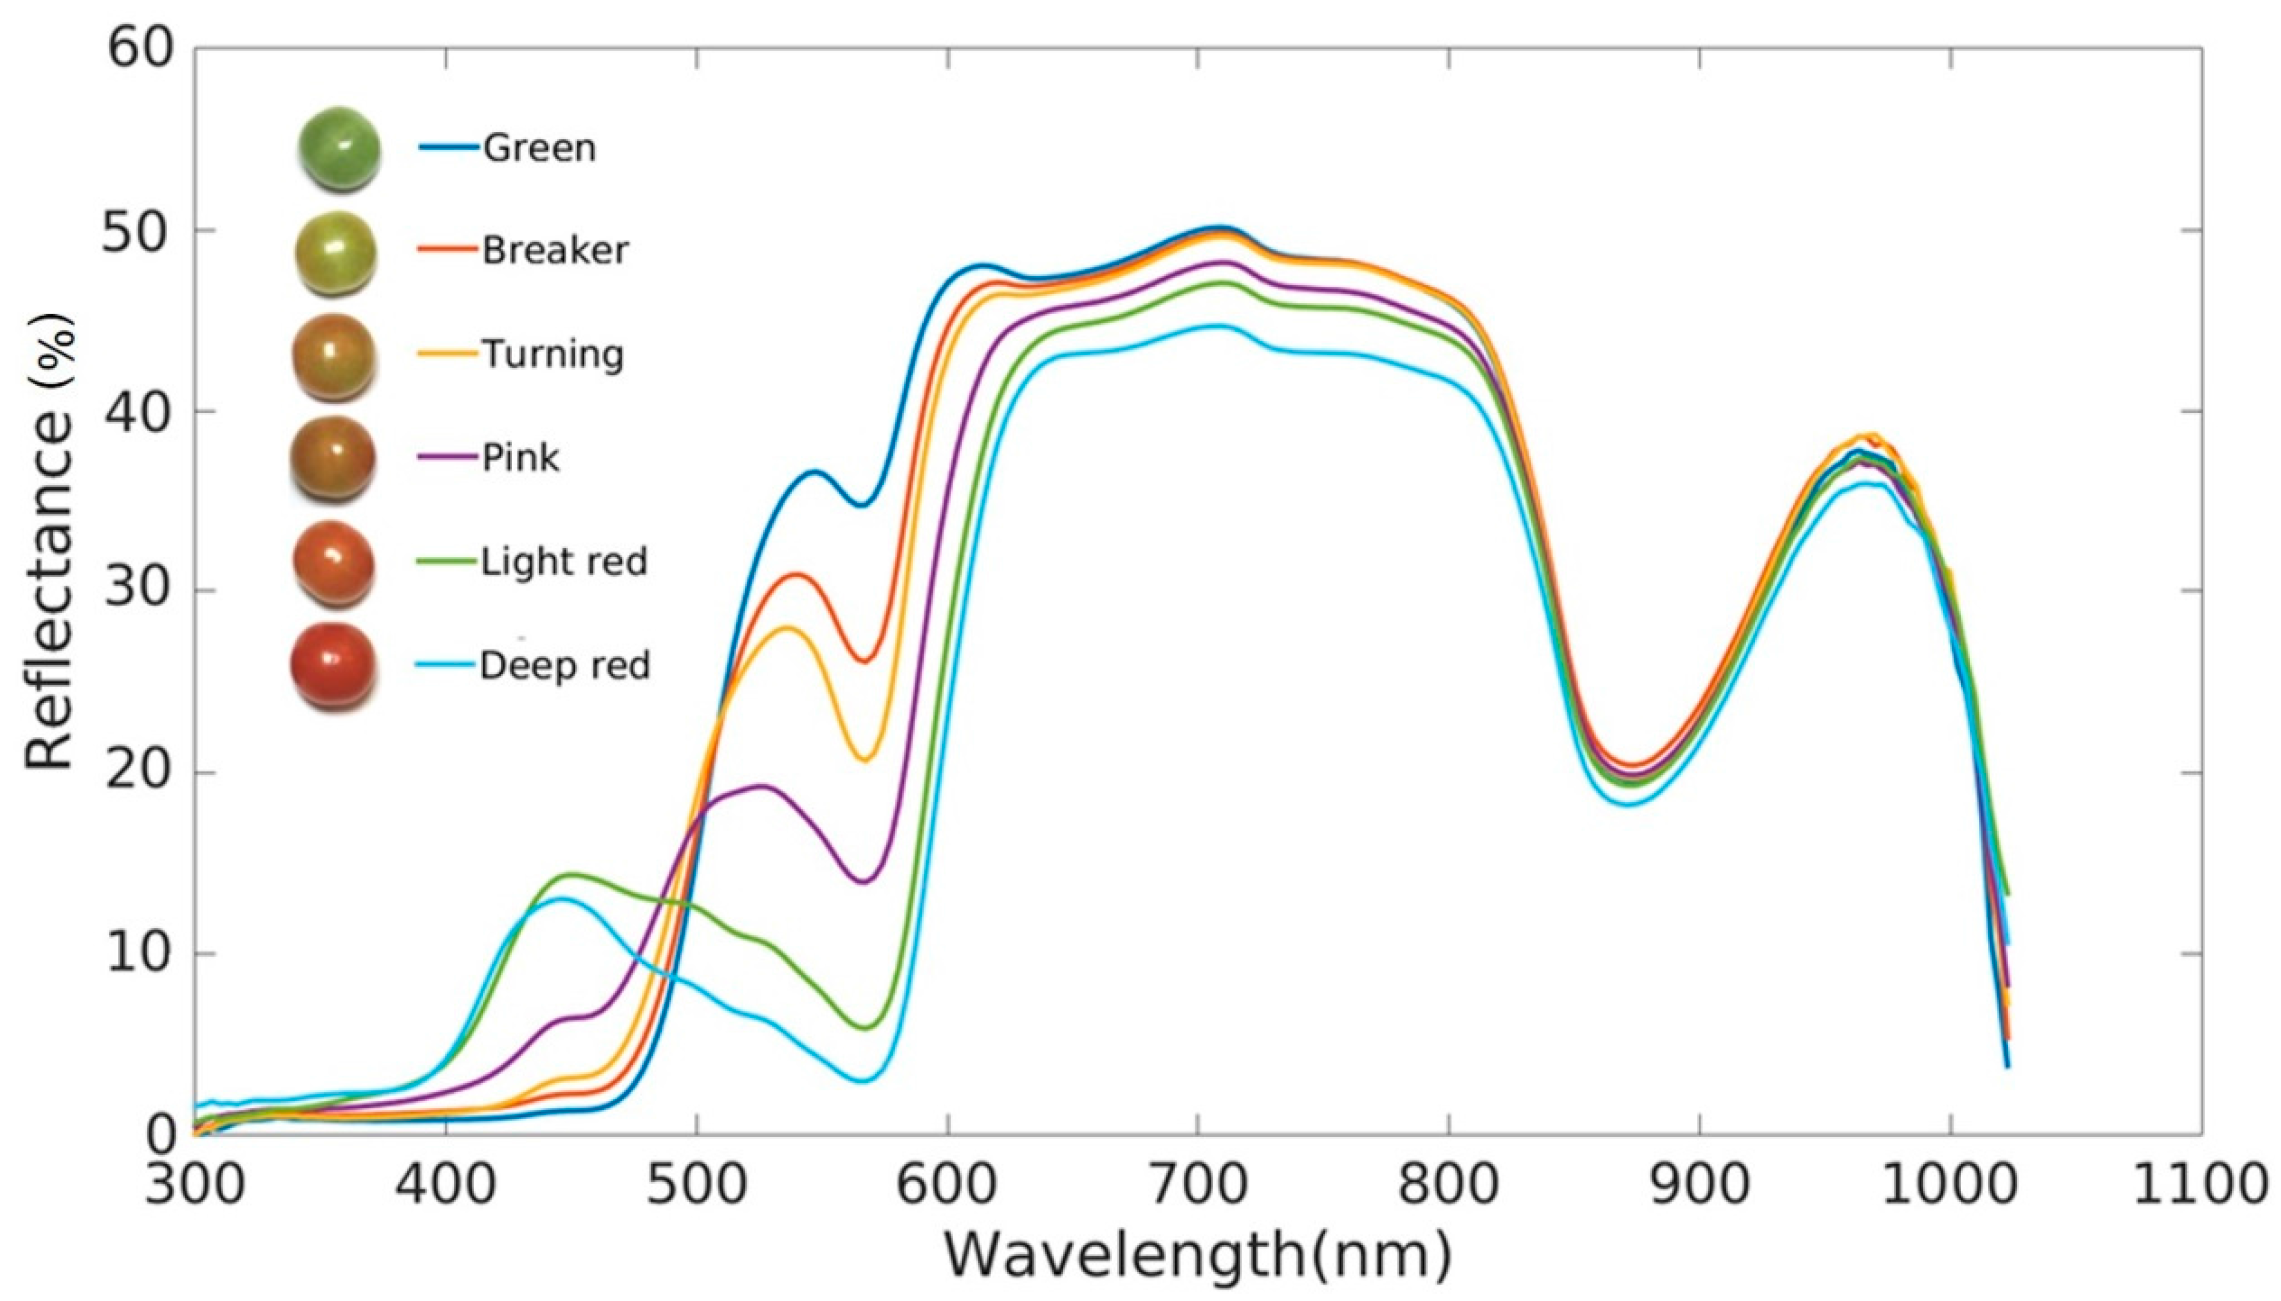
3. Visible and Infrared Spectroscopy
3.1. Spectral Indices
3.2. Full or Selected Wavelengths
4. Fluorescence Sensor
5. Spectral Imaging
5.1. Hyperspectral Imaging (HSI)
5.2. Multispectral Imaging (MSI)
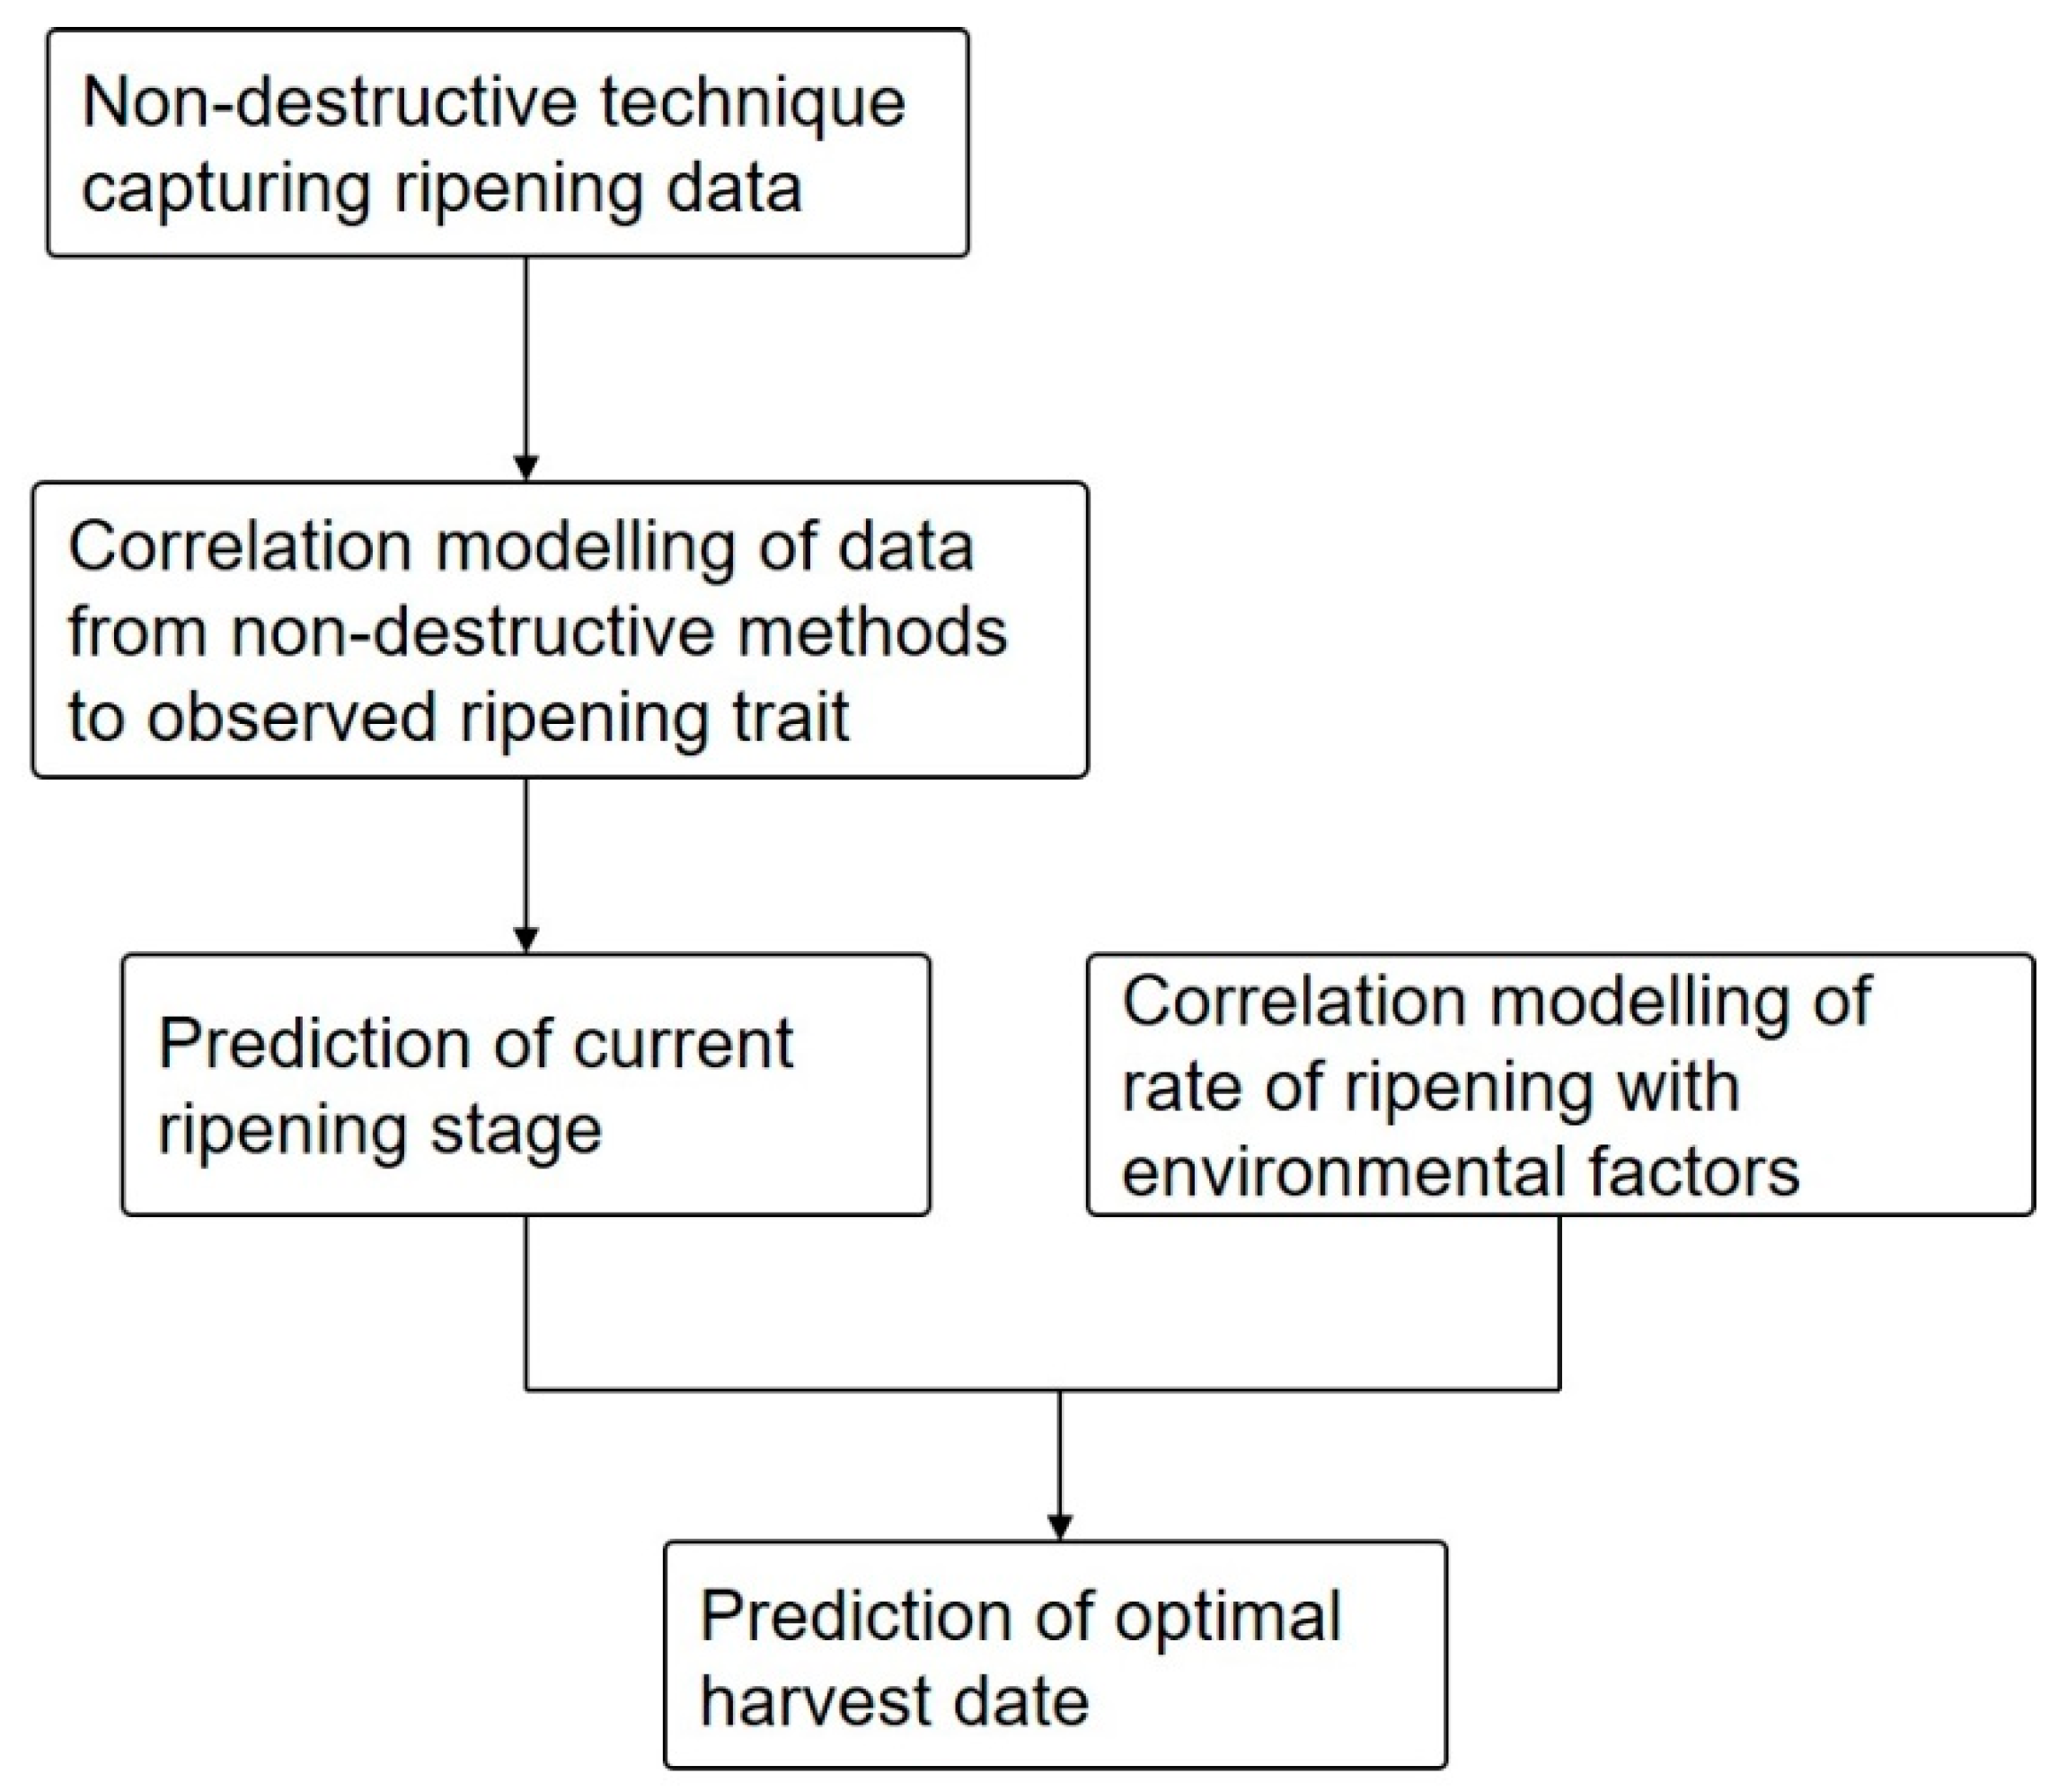
6. Prediction of Optimal Harvest Date
7. Conclusions
Acknowledgments
Author Contributions
Conflicts of Interest
References
- Reid, M.S. Maturation and Maturity Indices. Postharvest Technol. Hortic. Crops 2009, 3, 55–62. [Google Scholar]
- Vanoli, M.; Buccheri, M. Overview of the methods for assessing harvest maturity. Stewart Postharvest Rev. 2012, 8, 1–6. [Google Scholar] [CrossRef]
- Birth, G.S.; Norris, K.H. An instrument using light transmittance for nondestructive measurement of fruit maturity. Food Technol. 1958, 12, 592–595. [Google Scholar]
- Ernest, J.V.; Birth, G.A.; Sidwell, A.P.; Golumbic, C. Evaluation of light transmittance techniques for maturity measurements of the purple plum (Italian prune). Food Technol. 1958, 12, 42. [Google Scholar]
- Baltazar, A.; Aranda, J.I.; González-Aguilar, G. Bayesian classification of ripening stages of tomato fruit using acoustic impact and colorimeter sensor data. Comput. Electron. Agric. 2008, 60, 113–121. [Google Scholar] [CrossRef]
- Choi, K.; Lee, G.; Han, Y.J.; Bunn, J.M. Tomato maturity evaluation using color image analysis. Trans. ASAE 1995, 38, 171–176. [Google Scholar] [CrossRef]
- Yang, H.Q. Nondestructive Prediction of Optimal Harvest Time of Cherry Tomatoes Using VIS-NIR Spectroscopy and PLSR Calibration. Adv. Eng. Forum 2011, 1, 92–96. [Google Scholar] [CrossRef]
- Sivakumar, S.S.; Qiao, J.; Wang, N.; Gariépy, Y.; Raghavan, G.S.V.; McGill, J. Detecting maturity parameters of mango using hyperspectral imaging technique. In Proceedings of the 2006 ASAE Annual Meeting, Portland, OR, USA, 9–12 July 2006. [Google Scholar]
- Lleó, L.; Barreiro, P.; Ruiz-Altisent, M.; Herrero, A. Multispectral images of peach related to firmness and maturity at harvest. J. Food Eng. 2009, 93, 229–235. [Google Scholar] [CrossRef]
- Cerovic, Z.G.; Goutouly, J.; Hilbert, G.; Destrac-Irvine, A.; Martinon, V.; Moise, N. Mapping winegrape quality attributes using portable fluorescence-based sensors Zoran. Frutic 2009, 9, 301–310. [Google Scholar] [CrossRef]
- Stone, M.L.; Armstrong, P.R.; Zhang, X.; Brusewitz, G.H.; Chen, D.D. Watermelon maturity determination in the field using acoustic impulse impedance techniques. Trans. ASAE 1996, 39, 2325–2330. [Google Scholar] [CrossRef]
- Kotwaliwale, N. Monitoring of mango (Mangifera indica L.) (Cv.: Chousa) ripening using X-ray computed tomography. In Proceedings of the 2012 Sixth International Conference on Sensing Technology (ICST), Kolkata, India, 18–21 December 2012. [Google Scholar]
- Zhang, L.; McCarthy, M.J. Measurement and evaluation of tomato maturity using magnetic resonance imaging. Postharvest Biol. Technol. 2012, 67, 37–43. [Google Scholar] [CrossRef]
- Taniwaki, M.; Hanada, T.; Tohro, M.; Sakurai, N. Non-destructive determination of the optimum eating ripeness of pears and their texture measurements using acoustical vibration techniques. Postharvest Biol. Technol. 2009, 51, 305–310. [Google Scholar] [CrossRef]
- Brezmes, J.; Fructuoso, M.L.L.; Llobet, E.; Vilanova, X.; Recasens, I.; Orts, J.; Saiz, G.; Correig, X. Evaluation of an electronic nose to assess fruit ripeness. IEEE Sens. J. 2005, 5, 97–108. [Google Scholar] [CrossRef]
- Wu, D.; Sun, D.-W. Advanced applications of hyperspectral imaging technology for food quality and safety analysis and assessment: A review—Part I: Fundamentals. Innov. Food Sci. Emerg. Technol. 2013, 19, 1–14. [Google Scholar] [CrossRef]
- François, I.M.; Mariën, E.; Brijs, K.; Coppin, P.; De Proft, M. The use of Vis/NIR spectroscopy to predict the optimal root harvesting date of chicory (Cichorium intybus L.). Postharvest Biol. Technol. 2009, 53, 77–83. [Google Scholar] [CrossRef]
- Muñoz, C.; Ávila, J.; Salvo, S.; Huircán, J.I. Prediction of harvest start date in highbush blueberry using time series regression models with correlated errors. Sci. Hortic. 2012, 138, 165–170. [Google Scholar] [CrossRef]
- Hatfield, J.L.; Prueger, J.H. Temperature extremes: Effect on plant growth and development. Weather Clim. Extremes 2015, 10, 4–10. [Google Scholar] [CrossRef]
- Adams, S.R.; Cockshull, K.E.; Cave, C.R.J. Effect of temperature on the growth and development of tomato fruits. Ann. Bot. 2001, 88, 869–877. [Google Scholar] [CrossRef]
- Ferre, G.; Massol, G.; Le Fur, G.; Villeneuve, F. Apple Colour and Ripeness. Use of a Colorimeter: Prospects; Infos CTIFL: Paris, France, 1987. [Google Scholar]
- Dadwal, M.; Banga, V.K. Estimate ripeness level of fruits using RGB color space and fuzzy logic technique. Int. J. Eng. Adv. Technol. 2012, 2, 225–229. [Google Scholar]
- Zude, M. Comparison of indices and multivariate models to non-destructively predict the fruit chlorophyll by means of visible spectrometry in apple fruit. Anal. Chim. Acta 2003, 481, 119–126. [Google Scholar] [CrossRef]
- Merzlyak, M.N.; Solovchenko, A.E.; Gitelson, A.A. Reflectance spectral features and non-destructive estimation of chlorophyll, carotenoid and anthocyanin content in apple fruit. Postharvest Biol. Technol. 2003, 27, 197–211. [Google Scholar] [CrossRef]
- Solovchenko, A.E.; Chivkunova, O.B.; Gitelson, A.A.; Merzlyak, M.N. Non-destructive estimation pigment content, ripening, quality and damage in apple fruit with spectral reflectance in the visible range. Fresh Prod. 2010, 4, 91–102. [Google Scholar]
- Peirs, A.; Scheerlinck, N.; Nicolaı, B.M. Temperature compensation for near infrared reflectance measurement of apple fruit soluble solids contents. Postharvest Biol. Technol. 2003, 30, 233–248. [Google Scholar] [CrossRef]
- Zude, M.; Herold, B.; Roger, J.M.; Bellon-Maurel, V.; Landahl, S. Non-destructive tests on the prediction of apple fruit flesh firmness and soluble solids content on tree and in shelf life. J. Food Eng. 2006, 77, 254–260. [Google Scholar] [CrossRef]
- Zude-Sasse, M.; Truppel, I.; Herold, B. An approach to non-destructive apple fruit chlorophyll determination. Postharvest Biol. Technol. 2002, 25, 123–133. [Google Scholar] [CrossRef]
- Betemps, D.L.; Fachinello, J.C.; Galarça, S.P.; Portela, N.M.; Remorini, D.; Massai, R.; Agati, G. Non-destructive evaluation of ripening and quality traits in apples using a multiparametric fluorescence sensor. J. Sci. Food Agric. 2012, 92, 1855–1864. [Google Scholar] [CrossRef] [PubMed]
- Peng, Y.; Lu, R. Analysis of spatially resolved hyperspectral scattering images for assessing apple fruit firmness and soluble solids content. Postharvest Biol. Technol. 2008, 48, 52–62. [Google Scholar] [CrossRef]
- Mendoza, F.; Lu, R.; Ariana, D.; Cen, H.; Bailey, B. Integrated spectral and image analysis of hyperspectral scattering data for prediction of apple fruit firmness and soluble solids content. Postharvest Biol. Technol. 2011, 62, 149–160. [Google Scholar] [CrossRef]
- Peng, Y.; Lu, R. An LCTF-based multispectral imaging system for estimation of apple fruit firmness: Part II. Selection of optimal wavelengths and development of prediction models. Trans. ASABE 2006, 49, 269–275. [Google Scholar] [CrossRef]
- Peng, Y.; Lu, R. Prediction of apple fruit firmness and soluble solids content using characteristics of multispectral scattering images. J. Food Eng. 2007, 82, 142–152. [Google Scholar] [CrossRef]
- Cavaco, A.M.; Pinto, P.; Antunes, M.D.; Silva, J.M.; da Guerra, R. “Rocha” pear firmness predicted by a Vis/NIR segmented model. Postharvest Biol. Technol. 2009, 51, 311–319. [Google Scholar] [CrossRef]
- Shao, Y.; Bao, Y.; He, Y. Visible/Near-Infrared spectra for linear and nonlinear calibrations: A case to predict soluble solids contents and pH value in peach. Food Bioprocess Technol. 2011, 4, 1376–1383. [Google Scholar] [CrossRef]
- Tiansheng, H.; Jun, Q.; Wang, N.; Ngadi, M.O.; Zuoxi, Z.; Zhen, L. Non-destructive inspection of Chinese pear quality based on hyperspectral imaging technique. Trans. Chin. Soc. Agric. Eng. 2007, 2, 29. [Google Scholar]
- Ferrer, A.; Remon, S.; Negueruela, A.I.; Oria, R. Changes during the ripening of the very late season Spanish peach cultivar Calanda: Feasibility of using CIELAB coordinates as maturity indices. Sci. Hortic. 2005, 105, 435–446. [Google Scholar] [CrossRef]
- Lafuente, V.; Herrera, L.J.; Pérez, M.D.M.; Val, J.; Negueruela, I. Firmness prediction in Prunus persica ‘Calrico’peaches by visible/short-wave near infrared spectroscopy and acoustic measurements using optimised linear and non-linear chemometric models. J. Sci. Food Agric. 2015, 95, 2033–2040. [Google Scholar] [CrossRef] [PubMed]
- Ziosi, V.; Noferini, M.; Fiori, G.; Tadiello, A.; Trainotti, L.; Casadoro, G.; Costa, G. A new index based on vis spectroscopy to characterize the progression of ripening in peach fruit. Postharvest Biol. Technol. 2008, 49, 319–329. [Google Scholar] [CrossRef]
- Bodria, L.; Fiala, M.; Guidetti, R.; Oberti, R. Optical techniques to estimate the ripeness of red-pigmented fruits. Trans. ASAE 2004, 47, 815–820. [Google Scholar] [CrossRef]
- Lu, R.; Peng, Y. Hyperspectral Scattering for assessing Peach Fruit Firmness. Biosyst. Eng. 2006, 93, 161–171. [Google Scholar] [CrossRef]
- Olarewaju, O.O.; Bertling, I.; Magwaza, L.S. Non-destructive evaluation of avocado fruit maturity using near infrared spectroscopy and PLS regression models. Sci. Hortic. 2016, 199, 229–236. [Google Scholar] [CrossRef]
- Girod, D.; Landry, J.A.; Doyon, G.; Osuna-García, J.A.; Salazar-García, S.; Goenaga-Portela, R. Evaluating Hass avocado maturity using hyperspectral imaging. Caribb. Food Crops Soc. Proc. 2008, 44, 144–154. [Google Scholar]
- Luchsinger, L.E.; Walsh, C.S. Development of an objective and non-destructive harvest maturity index for peaches and nectarines. Acta Hortic. 1998, 465, 679–688. [Google Scholar] [CrossRef]
- Pérez-Marín, D.; Sánchez, M.T.; Paz, P.; Soriano, M.A.; Guerrero, J.E.; Garrido-Varo, A. Non-destructive determination of quality parameters in nectarines during on-tree ripening and postharvest storage. Postharvest Biol. Technol. 2009, 52, 180–188. [Google Scholar] [CrossRef]
- Jha, S.N.; Chopra, S.; Kingsly, A.R.P. Modeling of color values for nondestructive evaluation of maturity of mango. J. Food Eng. 2007, 78, 22–26. [Google Scholar] [CrossRef]
- Subedi, P.; Walsh, K.; Purdy, P. Determination of optimum maturity stages of mangoes using fruit spectral signatures. Int. Soc. Hortic. Sci. 2010. [Google Scholar] [CrossRef]
- Saranwong, S.; Sornsrivichai, J.; Kawano, S. On-tree evaluation of harvesting quality of mango fruit using a hand-held NIR instrument. J. Near Infrared Spectrosc. 2003, 11, 283–293. [Google Scholar] [CrossRef]
- Jha, S.N.; Kingsly, A.R.P.; Chopra, S. Non-destructive determination of firmness and yellowness of mango during growth and storage using visual spectroscopy. Biosyst. Eng. 2006, 94, 397–402. [Google Scholar] [CrossRef]
- Schmilovitch, Z.; Mizrach, A.; Hoffman, A.; Egozi, H.; Fuchs, Y. Determination of mango physiological indices by near-infrared spectrometry. Postharvest Biol. Technol. 2000, 19, 245–252. [Google Scholar] [CrossRef]
- Mendoza, F.; Dejmek, P.; Aguilera, J.M. Calibrated color measurements of agricultural foods using image analysis. Postharvest Biol. Technol. 2006, 41, 285–295. [Google Scholar] [CrossRef]
- Jaiswal, P.; Jha, S.N.; Bharadwaj, R. Non-destructive prediction of quality of intact banana using spectroscopy. Sci. Hortic. 2012, 135, 14–22. [Google Scholar] [CrossRef]
- Adebayo, S.E.; Hashim, N.; Abdan, K.; Hanafi, M.; Mollazade, K. Prediction of quality attributes and ripeness classification of bananas using optical properties. Sci. Hortic. 2016, 212, 171–182. [Google Scholar] [CrossRef]
- Rajkumar, P.; Wang, N.; EImasry, G.; Raghavan, G.S.V.; Gariepy, Y. Studies on banana fruit quality and maturity stages using hyperspectral imaging. J. Food Eng. 2012, 108, 194–200. [Google Scholar] [CrossRef]
- El-Bendary, N.; El Hariri, E.; Hassanien, A.E.; Badr, A. Using machine learning techniques for evaluating tomato ripeness. Expert Syst. Appl. 2015, 42, 1892–1905. [Google Scholar] [CrossRef]
- Batu, A. Determination of acceptable firmness and colour values of tomatoes. J. Food Eng. 2004, 61, 471–475. [Google Scholar] [CrossRef]
- Saad, A.; Ibrahim, A.; El-Bialee, N. Internal quality assessment of tomato fruits using image color analysis. Agric. Eng. Int. CIGR J. 2016, 18, 339–352. [Google Scholar]
- Gastélum-Barrios, A.; López-Bórquez, R.; Rico-García, E.; Toledano-Ayala, M.; Soto-Zarazúa, G. Tomato quality evaluation with image processing: A review. Afr. J. Agric. Res. 2011, 6, 3333–3339. [Google Scholar] [CrossRef]
- Schouten, R.E.; Huijben, T.P.M.; Tijskens, L.M.M.; van Kooten, O. Modelling quality attributes of truss tomatoes: Linking colour and firmness maturity. Postharvest Biol. Technol. 2007, 45, 298–306. [Google Scholar] [CrossRef]
- Clément, A.; Dorais, M.; Vernon, M. Nondestructive measurement of fresh tomato lycopene content and other physicochemical characteristics using visible NIR spectroscopy. J. Agric. Food Chem. 2008, 56, 9813–9818. [Google Scholar] [CrossRef] [PubMed]
- Clément, A.; Dorais, M.; Vernon, M. Multivariate approach to the measurement of tomato maturity and gustatory attributes and their rapid assessment by vis-NIR spectroscopy. J. Agric. Food Chem. 2008, 56, 1538–1544. [Google Scholar] [CrossRef] [PubMed]
- Hoffmann, A.M.; Noga, G.; Hunsche, M. Fluorescence indices for monitoring the ripening of tomatoes in pre- and postharvest phases. Sci. Hortic. 2015, 191, 74–81. [Google Scholar] [CrossRef]
- Liu, C.; Liu, W.; Chen, W.; Yang, J.; Zheng, L. Feasibility in multispectral imaging for predicting the content of bioactive compounds in intact tomato fruit. Food Chem. 2015, 173, 482–488. [Google Scholar] [CrossRef] [PubMed]
- Long, R.L.; Walsh, K.B. Limitations to the measurement of intact melon total soluble solids using near infrared spectroscopy. Aust. J. Agric. Res. 2006, 57, 403–410. [Google Scholar] [CrossRef]
- McGlone, V.A.; Fraser, D.G.; Jordan, R.B.; Künnemeyer, R. Internal quality assessment of mandarin fruit by vis/NIR spectroscopy. J. Near Infrared Spectrosc. 2003, 11, 323–332. [Google Scholar] [CrossRef]
- Greensill, C.V.; Walsh, K.B. Calibration transfer between miniature photodiode array-based spectrometers in the near infrared assessment of mandarin soluble solids content. J. Near Infrared Spectrosc. 2002, 10, 27–36. [Google Scholar] [CrossRef]
- Gómez, A.H.; He, Y.; Pereira, A.G. Non-destructive measurement of acidity, soluble solids and firmness of Satsuma mandarin using Vis/NIR-spectroscopy techniques. J. Food Eng. 2006, 77, 313–319. [Google Scholar] [CrossRef]
- Guthrie, J.A.; Reid, D.J.; Walsh, K.B. Assessment of internal quality attributes of mandarin fruit. 2. NIR calibration model robustness. Aust. J. Agric. Res. 2005, 56, 417–426. [Google Scholar] [CrossRef]
- Crisosto, C.H.; Crisosto, G.M.; Ritenour, M.A. Testing the reliability of skin color as an indicator of quality for early season “Brooks” (Prunus avium L.) cherry. Postharvest Biol. Technol. 2002, 24, 147–154. [Google Scholar] [CrossRef]
- Lu, R. Predicting firmness and sugar content of sweet cherries using near-infrared diffuse reflectance spectroscopy. Trans. Am. Soc. Agric. Eng. 2001, 44, 1265–1271. [Google Scholar] [CrossRef]
- Carlini, P.; Massantini, R.; Mencarelli, F. Vis-NIR measurement of soluble solids in cherry and apricot by PLS regression and wavelength selection. J. Agric. Food Chem. 2000, 48, 5236–5242. [Google Scholar] [CrossRef] [PubMed]
- Sánchez, M.T.; De La Haba, M.J.; Benítez-López, M.; Fernández-Novales, J.; Garrido-Varo, A.; Pérez-Marín, D. Non-destructive characterization and quality control of intact strawberries based on NIR spectral data. J. Food Eng. 2012, 110, 102–108. [Google Scholar] [CrossRef]
- Amodio, M.L.; Ceglie, F.; Chaudhry, M.M.A.; Piazzolla, F.; Colelli, G. Potential of NIR spectroscopy for predicting internal quality and discriminating among strawberry fruits from different production systems. Postharvest Biol. Technol. 2017, 125, 112–121. [Google Scholar] [CrossRef]
- Liu, C.; Liu, W.; Lu, X.; Ma, F.; Chen, W.; Yang, J.; Zheng, L. Application of multispectral imaging to determine quality attributes and ripeness stage in strawberry fruit. PLoS ONE 2014, 9, e87818. [Google Scholar] [CrossRef] [PubMed]
- ElMasry, G.; Wang, N.; ElSayed, A.; Ngadi, M. Hyperspectral imaging for nondestructive determination of some quality attributes for strawberry. J. Food Eng. 2007, 81, 98–107. [Google Scholar] [CrossRef]
- Liu, M.; Fu, P.; Cheng, R. Non destructive estimation peach SSC and firmness by mutispectral reflectance imaging. N. Z. J. Agric. Res. 2007, 50, 601–608. [Google Scholar] [CrossRef]
- Tallada, J.G.; Nagata, M.; Kobayashi, T. Non-destructive estimation of firmness of strawberries (Fragaria × ananassa Duch.) using NIR hyperspectral imaging. Environ. Control Biol. 2006, 44, 245–255. [Google Scholar] [CrossRef]
- Camps, C.; Christen, D. Non-destructive assessment of apricot fruit quality by portable visible-near infrared spectroscopy. LWT Food Sci. Technol. 2009, 42, 1125–1131. [Google Scholar] [CrossRef]
- Slaughter, D.C.; Crisosto, C.H. Nondestructive internal quality assessment of kiwifruit using near-infrared spectroscopy. Semin. Food Anal. 1998, 3, 131–140. [Google Scholar]
- Lee, J.; Kim, S.; Seong, K.; Kim, C.; Um, Y.; Lee, S. Quality prediction of kiwifruit based on near infrared spectroscopy. Korean J. Hortic. Sci. Technol. 2012, 30, 709–717. [Google Scholar] [CrossRef]
- McGlone, V.A.; Kawano, S. Firmness, dry-matter and soluble-solids assessment of postharvest kiwifruit by NIR spectroscopy. Postharvest Biol. Technol. 1998, 13, 131–141. [Google Scholar] [CrossRef]
- Jannok, P.; Kamitani, Y.; Kawano, S. Development of a common calibration model for determining the Brix value of intact apple, pear and persimmon fruits by near infrared spectroscopy. J. Near Infrared Spectrosc. 2014, 22, 367–373. [Google Scholar] [CrossRef]
- Wei, X.; Liu, F.; Qiu, Z.; Shao, Y.; He, Y. Ripeness classification of Astringent persimmon using hyperspectral imaging technique. Food Bioprocess Technol. 2014, 7, 1371–1380. [Google Scholar] [CrossRef]
- Omar, A.F. Spectroscopic profiling of soluble solids content and acidity of intact grape, lime, and star fruit. Sens. Rev. 2013, 33, 238–245. [Google Scholar] [CrossRef]
- Janik, L.J.; Cozzolino, D.; Dambergs, R.; Cynkar, W.; Gishen, M. The prediction of total anthocyanin concentration in red-grape homogenates using visible-near-infrared spectroscopy and artificial neural networks. Anal. Chim. Acta 2007, 594, 107–118. [Google Scholar] [CrossRef] [PubMed]
- Agati, G.; D’Onofrio, C.; Ducci, E.; Cuzzola, A.; Remorini, D.; Tuccio, L.; Lazzini, F.; Mattii, G. Potential of a multiparametric optical sensor for determining in situ the maturity components of red and white Vitis vinifera wine grapes. J. Agric. Food Chem. 2013, 61, 12211–12218. [Google Scholar] [CrossRef] [PubMed]
- Lenk, S.; Buschmann, C.; Pfündel, E.E. In vivo assessing flavonols in white grape berries (Vitis vinifera L. cv. Pinot Blanc) of different degrees of ripeness using chlorophyll fluorescence imaging. Funct. Plant Biol. 2007, 34, 1092–1104. [Google Scholar] [CrossRef]
- Baiano, A.; Terracone, C.; Peri, G.; Romaniello, R. Application of hyperspectral imaging for prediction of physico-chemical and sensory characteristics of table grapes. Comput. Electron. Agric. 2012, 87, 142–151. [Google Scholar] [CrossRef]
- Abu Bakar, B.H.; Ishak, A.J.; Shamsuddin, R.; Wan Hassan, W.Z. Ripeness level classification for pineapple using RGB and HSI colour maps. J. Theor. Appl. Inf. Technol. 2013, 57, 587–593. [Google Scholar]
- Guthrie, J.; Walsh, K. Non-invasive assessment of pineapple and mango fruit quality using near infra-red spectroscopy. Aust. J. Exp. Agric. 1997, 37, 253–263. [Google Scholar] [CrossRef]
- Chia, K.S.; Abdul Rahim, H.; Abdul Rahim, R. Prediction of soluble solids content of pineapple via non-invasive low cost visible and shortwave near infrared spectroscopy and artificial neural network. Biosyst. Eng. 2012, 113, 158–165. [Google Scholar] [CrossRef]
- Infante, R.; Contador, L.; Rubio, P.; Mesa, K.; Meneses, C. Non-destructive monitoring of flesh softening in the black-skinned Japanese plums “Angeleno” and “Autumn beaut” on-tree and postharvest. Postharvest Biol. Technol. 2011, 61, 35–40. [Google Scholar] [CrossRef]
- Paz, P.; Sánchez, M.T.; Pérez-Marín, D.; Guerrero, J.E.; Garrido-Varo, A. Nondestructive determination of total soluble solid content and firmness in plums using near-infrared reflectance spectroscopy. J. Agric. Food Chem. 2008, 56, 2565–2570. [Google Scholar] [CrossRef] [PubMed]
- Mendoza, F.; Aguilera, J.M. Application of Image Analysis for Classification of Ripening Bananas. Food Eng. Phys. Prop. 2004, 69, 478–487. [Google Scholar] [CrossRef]
- Olmo, M.; Nadas, A.; García, J.M. Nondestructive Methods to Evaluate Maturity Level of Oranges. Sens. Nutr. Qual. Food Nondestruct. 1998, 65, 365–369. [Google Scholar] [CrossRef]
- Shewfelt, R.L.; Thai, C.N.; Davis, J.W. Prediction of changes in color of tomatoes during ripening at different constant temperatures. J. Food Sci. 1988, 53, 1433. [Google Scholar] [CrossRef]
- Mercado-Silva, E.; Benito-Bautista, P.; De los Angeles García-Velasco, M. Fruit development, harvest index and ripening changes of guavas produced in central Mexico. Postharvest Biol. Technol. 1998, 13, 143–150. [Google Scholar] [CrossRef]
- Shinya, P.; Contador, L.; Predieri, S.; Rubio, P.; Infante, R. Peach ripening: Segregation at harvest and postharvest flesh softening. Postharvest Biol. Technol. 2013, 86, 472–478. [Google Scholar] [CrossRef]
- Raut, K.; Bora, V. Assessment of fruit maturity using digital image processing. Int. J. Sci. Technol. Eng. 2016, 3, 273–279. [Google Scholar]
- Taghadomi-Saberi, S.; Omid, M.; Emam-Djomeh, Z.; Faraji-Mahyari, K.H. Determination of cherry color parameters during ripening by artificial neural network assisted image processing technique. J. Agric. Sci. Technol. 2015, 17, 589–600. [Google Scholar]
- Hobson, G.E.; Adams, P.; Dixon, T.J. Assessing the colour of tomato fruit during ripening. J. Sci. Food Agric. 1983, 34, 286–292. [Google Scholar] [CrossRef]
- Camelo, A.F.L.; Gómez, P.A. Comparison of color indexes for tomato ripening. Hortic. Bras. 2004, 22, 534–537. [Google Scholar] [CrossRef]
- Wu, D.; Sun, D.W. Colour measurements by computer vision for food quality control—A review. Trends Food Sci. Technol. 2013, 29, 5–20. [Google Scholar] [CrossRef]
- Tijskens, L.M.M.; Evelo, R.G. Modelling colour of tomatoes during postharvest storage. Postharvest Biol. Technol. 1994, 4, 85–98. [Google Scholar] [CrossRef]
- Arias, R.; Lee, T.-C.; Logendra, L.; Janes, H. Correlation of lycopene measured by HPLC with the L*, a*, b* color readings of a hydroponic tomato and the relationship of maturity with color and lycopene content. J. Agric. Food Chem. 2000, 48, 1697–1702. [Google Scholar] [CrossRef] [PubMed]
- Brandt, S.; Pék, Z.; Barna, É.; Lugasi, A.; Helyes, L. Lycopene content and colour of ripening tomatoes as affected by environmental conditions. J. Sci. Food Agric. 2006, 86, 568–572. [Google Scholar] [CrossRef]
- D’Souza, M.C.; Singha, S.; Ingle, M. Lycopene concentration of tomato fruit can be estimated from chromaticity values. HortScience 1992, 27, 465–466. [Google Scholar]
- Jiménez-Cuesta, M.; Cuquerella, J.; Martinez-Javaga, J.M. Determination of a color index for citrus fruit degreening. In Proceedings of the International Society of Citriculture, Tokyo, Japan, 15–23 August 1978. [Google Scholar]
- Yam, K.L.; Papadakis, S.E. A simple digital imaging method for measuring and analyzing color of food surfaces. J. Food Eng. 2004, 61, 137–142. [Google Scholar] [CrossRef]
- León, K.; Mery, D.; Pedreschi, F.; León, J. Color measurement in L*,a*,b* units from RGB digital images. Food Res. Int. 2006, 39, 1084–1091. [Google Scholar] [CrossRef]
- Klir, G.; Yuan, B. Fuzzy Sets and Fuzzy Logic; Prentice hall: Upper Saddle River, NJ, USA, 1995; Volume 4. [Google Scholar]
- Mansor, A.R.; Othman, M.; Ahmad, K.A.; Nazari, M.; Bakar, A.; Razak, T.R. Fuzzy RGB colour sensor model for mango ripening index. In Proceedings of the 2013 IEEE Symposium on Humanities, Science & Engineering Research, Penang, Malaysia, 23–26 June 2013; pp. 118–123. [Google Scholar]
- Goel, N.; Sehgal, P. Fuzzy classification of pre-harvest tomatoes for ripeness estimation—An approach based on automatic rule learning using decision tree. Appl. Soft Comput. J. 2015, 36, 45–56. [Google Scholar] [CrossRef]
- Hartigan, J.A.; Wong, M.A. Algorithm AS 136: A k-means clustering algorithm. J. R. Stat. Soc. Ser. C (Appl. Stat.) 1979, 28, 100–108. [Google Scholar] [CrossRef]
- Lesot, M.-J.; Kruse, R. Gustafson-Kessel-like clustering algorithm based on typicality degrees. In Uncertainty and Intelligent Information Systems; World Scientific: Hackensack, NJ, USA, 1986; pp. 117–130. [Google Scholar]
- Dadwal, M.; Banga, V.K. Color image segmentation for fruit ripeness detection: A review. In Proceedings of the 2nd International Conference on Electrical, Electronics and Civil Engineering (ICEECE’2012), Singapore, 28–29 April 2012; pp. 190–193. [Google Scholar]
- Niño-Medina, G.; Rivera-Castro, J.C.; Vidales-Contreras, J.A.; Rodriguez-Fuentes, H.; Luna-Maldonado, A.I. Physicochemical parameters for obtaining prediction models in the postharvest quality of tomatoes (Solanum Lycopersicum L.). Trans. Mach. Learn. 2013, 6, 54–66. [Google Scholar]
- Takahashi, N.; Maki, H.; Nishina, H.; Takayama, K. Evaluation of tomato fruit color change with different maturity stages and storage temperatures using image analysis. IFAC Proc. 2013, 46, 147–149. [Google Scholar] [CrossRef]
- Yanai, H.; Mayekawa, S. Review of linear algebra and linear models by R.B. Bapat. Linear Algebra Appl. 1994, 207, 273–277. [Google Scholar] [CrossRef]
- Jain, A.K.; Mao, J. Artificial neural network: A tutorial. Communications 1996, 29, 31–44. [Google Scholar] [CrossRef]
- Hartmann, A.; Czauderna, T.; Hoffmann, R.; Stein, N.; Schreiber, F. HTPheno: An image analysis pipeline for high-throughput plant phenotyping. BMC Bioinform. 2011, 12, 148. [Google Scholar] [CrossRef] [PubMed]
- Sural, S.; Qian, G.; Pramanik, S. Segmentation and histogram generation using the HSV color space for image retrival. In Proceedings of the 2002 International Conference on Image Processing, New York, NY, USA, 22–25 September 2002; Volume 2. [Google Scholar]
- Ukirade, N.S. Color grading system for evaluating tomato maturity. Int. J. Res. Manag. Sci. Technol. 2014, 2, 41–45. [Google Scholar]
- Duda, R.O.; Hart, P.E.; Stork, D.G. Pattern Classification; John Wiley & Sons: Hoboken, NJ, USA, 2012; ISBN 111858600X. [Google Scholar]
- Li, H.; Lee, W.S.; Wang, K. Identifying blueberry fruit of different growth stages using natural outdoor color images. Comput. Electron. Agric. 2014, 106, 91–101. [Google Scholar] [CrossRef]
- Tarkosova, J.; Copikova, J. Determination of carbohydrate content in bananas during ripening and storage by near infrared spectroscopy. J. Near Infrared Spectrosc. 2000, 8, 21–26. [Google Scholar] [CrossRef]
- Makky, M.; Soni, P. In situ quality assessment of intact oil palm fresh fruit bunches using rapid portable non-contact and non-destructive approach. J. Food Eng. 2014, 120, 248–259. [Google Scholar] [CrossRef]
- Lleó, L.; Roger, J.M.; Herrero-Langreo, A.; Diezma-Iglesias, B.; Barreiro, P. Comparison of multispectral indexes extracted from hyperspectral images for the assessment of fruit ripening. J. Food Eng. 2011, 104, 612–620. [Google Scholar] [CrossRef]
- Ruiz-Altisent, M.; Lleó, L.; Riquelme, F. Instrumental quality assessment of peaches: Fusion of optical and mechanical parameters. J. Food Eng. 2006, 74, 490–499. [Google Scholar] [CrossRef]
- Lurie, S.; Friedman, H.; Weksler, A.; Dagar, A.; Eccher Zerbini, P. Maturity assessment at harvest and prediction of softening in an early and late season melting peach. Postharvest Biol. Technol. 2013, 76, 10–16. [Google Scholar] [CrossRef]
- Costa, G.; Noferini, M.; Fiori, G.; Ziosi, V.; Berthod, N.; Rossier, J. Establishment of the optimal harvest time in apricot (‘Orangered’ and ‘Bergarouge’) by means of a new index based on vis spectroscopy. Acta Hortic. 2010, 862, 533–539. [Google Scholar] [CrossRef]
- Costa, G.; Noferini, M.; Fiori, G.; Torrigiani, P. Use of vis/nir spectroscopy to assess fruit ripening stage and improve management in post-harvest chain. Fresh Prod. 2009, 3, 35–41. [Google Scholar]
- Bonora, E.; Noferini, M.; Stefanelli, D.; Costa, G. A new simple modeling approach for the early prediction of harvest date and yield in nectarines. Sci. Hortic. 2014, 172, 1–9. [Google Scholar] [CrossRef]
- Helland, I. Partial least squares regression. In Encyclopedia of Statistical Sciences; John Wiley & Sons: Hoboken, NJ, USA, 2006. [Google Scholar] [CrossRef]
- Mahesh, S.; Jayas, D.S.; Paliwal, J.; White, N.D.G. Comparison of partial least squares regression (PLSR) and principal components regression (PCR) methods for protein and hardness predictions using the near-infrared (NIR) hyperspectral images of bulk samples of Canadian wheat. Food Bioprocess Technol. 2014, 8, 31–40. [Google Scholar] [CrossRef]
- Rinnan, Å.; Berg, F.V.D.; Engelsen, S.B. Review of the most common pre-processing techniques for near-infrared spectra. TrAC Trends Anal. Chem. 2009, 28, 1201–1222. [Google Scholar] [CrossRef]
- Mollazade, K.; Omid, M.; Tab, F.A.; Mohtasebi, S.S. Principles and applications of light backscattering imaging in quality evaluation of agro-food products: A review. Food Bioprocess Technol. 2012, 5, 1465–1485. [Google Scholar] [CrossRef]
- Herrera, J.; Guesalaga, A.; Agosin, E. Shortwave near infrared spectroscopy for non-destructive determination of maturity of wine grapes. Meas. Sci. Technol. 2003, 14, 689–697. [Google Scholar] [CrossRef]
- Guo, Z.; Huang, W.; Chen, L.; Wang, X.; Peng, Y. Nondestructive evaluation of soluble solid content in strawberry by near infrared spectroscopy. In Proceedings of the Third International Conference on Photonics and Image in Agriculture Engineering (PIAGENG 2013), Sanya, China, 4 March 2013. [Google Scholar] [CrossRef]
- Gorry, P.A. General least-squares smoothing and differentiation by the convolution (Savitzky-Golay) method. Anal. Chem. 1990, 62, 570–573. [Google Scholar] [CrossRef]
- Nicolai, B.M.; Beullens, K.; Bobelyn, E.; Peirs, A.; Saeys, W.; Theron, K.I.; Lammertyn, J. Nondestructive measurement of fruit and vegetable quality by means of NIR spectroscopy: A review. Postharvest Biol. Technol. 2007, 46, 99–118. [Google Scholar] [CrossRef]
- Marques, E.J.N.; De Freitas, S.T.; Pimentel, M.F.; Pasquini, C. Rapid and non-destructive determination of quality parameters in the “Tommy Atkins” mango using a novel handheld near infrared spectrometer. Food Chem. 2016, 197, 1207–1214. [Google Scholar] [CrossRef] [PubMed]
- Torres, I.; Pérez-Marín, D.; De la Haba, M.J.; Sánchez, M.T. Fast and accurate quality assessment of Raf tomatoes using NIRS technology. Postharvest Biol. Technol. 2015, 107, 9–15. [Google Scholar] [CrossRef]
- He, Y.; Zhang, Y.; Pereira, A.G.; Gómez, A.H.; Wang, J. Nondestructive determination of tomato fruit quality characteristics using vis/nir spectroscopy technique. Int. J. Inf. Technol. 2005, 11, 97–108. [Google Scholar]
- Saranwong, S.; Sornsrivichai, J.; Kawano, S. Prediction of ripe-stage eating quality of mango fruit from its harvest quality measured nondestructively by near infrared spectroscopy. Postharvest Biol. Technol. 2004, 31, 137–145. [Google Scholar] [CrossRef]
- Ma, G.; Fu, X.; Zhou, Y.; Ying, Y.; Xu, H.; Xie, L.; Lin, T. Nondestructive sugar content determination of peaches by using near infrared spectroscopy technique. Spectrosc. Spectr. Anal. 2007, 27, 907–910. [Google Scholar]
- Dhanoa, M.; Lister, S.; Sanderson, R.; Barnes, R. The link between multiplicative scatter correction (MSC) and standard normal variate (SNV) transformations of NIR spectra. J. Near Infrared Spectrosc. 1994, 2, 43–47. [Google Scholar] [CrossRef]
- Nishizawa, T.; Mori, Y.; Fukushima, S.; Natsuga, M.; Maruyama, Y. Non-destructive analysis of soluble sugar components in strawberry fruits using near-infrared spectroscopy. J. Jpn. Soc. Food Sci. Technol. 2009, 56, 229–235. [Google Scholar] [CrossRef]
- Peiris, K.H.S.; Dull, G.G.; Leffler, R.G.; Kays, S.J. Near-infrared spectrometric method for nondestructive determination of soluble solids content of peaches. J. Am. Soc. Hortic. Sci. 1998, 123, 898–905. [Google Scholar]
- Saranwong, S.; Sornsrivichai, J.; Kawano, S. Improvement of PLS calibration for Brix value and dry matter of mango using information from MLR calibration. J. Near Infrared Spectrosc. 2001, 9, 287–295. [Google Scholar] [CrossRef]
- Kawano, S.; Watanabe, H.; Iwamoto, M. Determination of sugar content in intact peaches by near infrared spectroscopy with fiber optics in interactance mode. J. Jpn. Soc. Hortic. Sci. 1992, 61, 445–451. [Google Scholar] [CrossRef]
- Jiang, M.; Lu, H.; Ying, Y.; Xu, H. Design and validation of software for real-time soluble solids content evaluation of peach by near infrared spectroscopy. Opt. Natl. Resour. Agric. Foods 2006, 6381, 638118. [Google Scholar] [CrossRef]
- Guthrie, J.; Wedding, B.; Walsh, K. Robustness of NIR calibrations for soluble solids in intact melon and pineapple. J. Near Infrared Spectrosc. 1998, 6, 259–265. [Google Scholar] [CrossRef]
- Ouyang, A.G. Partial least squares regression variable screening studies on apple soluble solids nir spectral detection. Spectrosc. Spectr. Anal. 2012, 32, 2680–2684. [Google Scholar]
- Jha, S.N.; Narsaiah, K.; Jaiswal, P.; Bhardwaj, R.; Gupta, M.; Kumar, R.; Sharma, R. Nondestructive prediction of maturity of mango using near infrared spectroscopy. J. Food Eng. 2014, 124, 152–157. [Google Scholar] [CrossRef]
- Park, B.; Abbott, J.A.; Lee, K.J.; Choi, C.H.; Choi, K.H. Near-infrared diffuse reflectance for quantitative and qualitative measurement of soluble solids and firmness of Delicious and Gala apples. Trans. ASAE 2003, 46, 1721–1731. [Google Scholar] [CrossRef]
- Gracia, A.; León, L. Non-destructive assessment of olive fruit ripening by portable near infrared spectroscopy. Grasas Y Aceites 2011, 62, 268–274. [Google Scholar] [CrossRef]
- Herold, B.; Truppel, I.; Zude, M.; Geyer, M. Spectral measurements on ‘Elstar’ apples during fruit development on the tree. Biosyst. Eng. 2005, 91, 173–182. [Google Scholar] [CrossRef]
- Royer, C.A. Fluorescence spectroscopy. Methods Mol. Biol. 1995, 40, 65–89. [Google Scholar] [CrossRef] [PubMed]
- Song, J.; Deng, W.; Beaudry, R.M.; Armstrong, P.R. Changes in chlorophyll fluorescence of apple fruit during maturation, ripening, and senescence. HortScience 1997, 32, 891–896. [Google Scholar]
- Bron, I.U.; Ribeiro, R.V.; Azzolini, M.; Jacomino, A.P.; Machado, E.C. Chlorophyll fluorescence as a tool to evaluate the ripening of “Golden” papaya fruit. Postharvest Biol. Technol. 2004, 33, 163–173. [Google Scholar] [CrossRef]
- Morales, F.; Cerovic, Z.G.; Moya, I. Time-resolved blue-green fluorescence of sugar beet (Beta vulgaris L.) leaves. Spectroscopic evidence for the presence of ferulic acid as the main fluorophore of the epidermis. Biochim. Biophys. Acta Bioenergy 1996, 1273, 251–262. [Google Scholar] [CrossRef]
- Hazir, M.H.M.; Shariff, A.R.M.; Amiruddin, M.D.; Ramli, A.R.; Iqbal Saripan, M. Oil palm bunch ripeness classification using fluorescence technique. J. Food Eng. 2012, 113, 534–540. [Google Scholar] [CrossRef]
- ElMasry, G.M.; Nakauchi, S. Image analysis operations applied to hyperspectral images for non-invasive sensing of food Quality—A comprehensive review. Biosyst. Eng. 2016, 142, 53–82. [Google Scholar] [CrossRef]
- Mahesh, S.; Jayas, D.S.; Paliwal, J.; White, N.D.G. Hyperspectral imaging to classify and monitor quality of agricultural materials. J. Stored Prod. Res. 2015, 61, 17–26. [Google Scholar] [CrossRef]
- Bauriegel, E.; Giebel, A.; Geyer, M.; Schmidt, U.; Herppich, W.B. Early detection of Fusarium infection in wheat using hyper-spectral imaging. Comput. Electron. Agric. 2011, 75, 304–312. [Google Scholar] [CrossRef]
- Zhao, Y.; Gong, L.; Huang, Y.; Liu, C. Robust tomato recognition for robotic harvesting using feature images fusion. Sensors 2016, 16, 173. [Google Scholar] [CrossRef] [PubMed]
- Honkavaara, E.; Kaivosoja, J.; Mäkynen, J.; Pellikka, I.; Pesonen, L.; Saari, H.; Salo, H.; Hakala, T.; Marklelin, L.; Rosnell, T. Hyperspectral reflectance signatures and point clouds for precision agriculture by light weight uav imaging system. ISPRS Ann. Photogramm. Remote Sens. Spat. Inf. Sci. 2012, I-7, 353–358. [Google Scholar] [CrossRef]
- Centner, V.; Massart, D.-L.; de Noord, O.E.; de Jong, S.; Vandeginste, B.M.; Sterna, C. Elimination of uninformative variables for multivariate calibration. Anal. Chem. 1996, 68, 3851–3858. [Google Scholar] [CrossRef] [PubMed]
- Zhu, Q.; Huang, M.; Zhao, X.; Wang, S. Wavelength selection of hyperspectral scattering image using new semi-supervised affinity propagation for prediction of firmness and soluble solid content in apples. Food Anal. Methods 2013, 6, 334–342. [Google Scholar] [CrossRef]
- Wang, S.; Huang, M.; Zhu, Q. Model fusion for prediction of apple firmness using hyperspectral scattering image. Comput. Electron. Agric. 2012, 80, 1–7. [Google Scholar] [CrossRef]
- Leiva-Valenzuela, G.A.; Lu, R.; Aguilera, J.M. Assessment of internal quality of blueberries using hyperspectral transmittance and reflectance images with whole spectra or selected wavelengths. Innov. Food Sci. Emerg. Technol. 2014, 115, 91–98. [Google Scholar] [CrossRef]
- Araújo, M.C.U.; Saldanha, T.C.B.; Galvão, R.K.H.; Yoneyama, T.; Chame, H.C.; Visani, V. The successive projections algorithm for variable selection in spectroscopic multicomponent analysis. Chemom. Intell. Lab. Syst. 2001, 57, 65–73. [Google Scholar] [CrossRef]
- Peng, Y.; Lu, R. An LCTF-based multispectral imaging system for estimation of apple fruit firmness: Part I. Acquisition and characterization of scattering images. Trans. ASABE 2006, 49, 259–267. [Google Scholar] [CrossRef]
- Saeed, O.M.B.; Sankaran, S.; Shariff, A.R.M.; Shafri, H.Z.M.; Ehsani, R.; Alfatni, M.S.; Hazir, M.H.M. Classification of oil palm fresh fruit bunches based on their maturity using portable four-band sensor system. Comput. Electron. Agric. 2012, 82, 55–60. [Google Scholar] [CrossRef]
- Yang, H. Remote sensing technique for predicting harvest time of tomatoes. Procedia Environ. Sci. 2011, 10, 666–671. [Google Scholar] [CrossRef]
- Peirs, A.; Lammertyn, J.; Ooms, K.; Nicolaï, B.M. Prediction of the optimal picking date of different apple cultivars by means of VIS/NIR-spectroscopy. Postharvest Biol. Technol. 2001, 21, 189–199. [Google Scholar] [CrossRef]
- Teng, L.; Cheng, Z.; Chen, X.; Lai, L. Study on simulation models of tomato fruit quality related to cultivation environmental factors. Acta Ecol. Sin. 2012, 32, 111–116. [Google Scholar] [CrossRef]
- Loomis, R.S.; Williams, W.A. Maximum crop productivity: An extimate. Crop Sci. 1963, 3, 67–72. [Google Scholar] [CrossRef]
- Jones, C.A.; Kiniry, J.R. CERES-Maize: A Simulation Aodel of Maize Growth and Development; Texas A&M University Press: College Station, TX, USA, 1986. [Google Scholar]
- Whisler, F.D.; Acock, B.; Baker, D.N.; Fye, R.E.; Hodges, H.F.; Lambert, J.R.; Lemmon, H.E.; McKinion, J.M.; Reddy, V.R. Crop simulation models in agronomic systems. Adv. Agron. 1986, 40, 141–208. [Google Scholar]
- Yang, H.; Dobermann, A.; Cassman, K.G.; Walters, D.T. Features, applications, and limitations of the hybrid-maize simulation model. Agron. J. 2006, 98, 737–748. [Google Scholar] [CrossRef]
- Jones, J.W.; Dayan, E.; Allen, L.H.; Keulen, H.V.; Challa, H. A dynamic tomato growth and yield model (Tomgro). Trans. ASAE 1991, 34, 663–672. [Google Scholar] [CrossRef]
- Gijzen, H.; Heuvelink, E.; Challa, H.; Dayan, E.; Marcelis, L.F.M.; Cohen, S.; Fuchs, M. Hortisim: A model for greenhouse crops and greenhouse climate. Acta Hortic. 1998, 456, 441–450. [Google Scholar] [CrossRef]
- Qiu, Q.; Shi, K.; Qiao, X.J.; Jiang, K. Determining the dominant environmental parameters for greenhouse tomato seedling growth modeling using canonical correlation analysis. IFAC-PapersOnLine 2016, 49, 387–391. [Google Scholar] [CrossRef]
- Tomana, T.; Utsunomiya, N.; Kataoka, I. The effect of environmental temperatures on fruit ripening on the tree II. The effect of temperatures around whole vines and clusters on the coloration of “Kyoho” grapes. J. Jpn. Soc. Hortic. Sci. 1979, 48, 261–266. [Google Scholar] [CrossRef]
- Yamada, H.; Ohmura, H.; Arai, C.; Terui, M. Effect of preharvest fruit temperature on ripening, sugars, and watercore occurrence in apples. J. Am. Soc. Hortic. Sci. 1994, 119, 1208–1214. [Google Scholar]
- Medlicott, A.P.; Reynolds, S.B.; Thompson, A.K. Effects of temperature on the ripening of mango. J. Sci. Food Agric. 1986, 37, 469–474. [Google Scholar] [CrossRef]
- Nanos, G.D.; Lazaridou, M.; Tsoukidou, M.; Sfakiotakis, E.M. Effects of temperature and propylene on apricot ripening. Int. Soc. Hortic. Sci. 1997, 488. [Google Scholar] [CrossRef]
- Cordenunsi, B.R.; Genovese, M.I.; Oliveira Do Nascimento, J.R.; Aymoto Hassimotto, N.M.; José Dos Santos, R.; Lajolo, F.M. Effects of temperature on the chemical composition and antioxidant activity of three strawberry cultivars. Food Chem. 2005, 91, 113–121. [Google Scholar] [CrossRef]
- Kawano, S.; Abe, H. Development of a calibration equation with temperature compensation for determining the Brix value in intact peaches. J. Near Infrared Spectrosc. 1995, 3, 211–218. [Google Scholar] [CrossRef]
- Gustafsson, J.; Cederberg, C.; Sonesson, U.; Emanuelsson, A. The Methodology of the FAO Study: Global Food Losses and Food Waste-Extent, Causes and Prevention-FAO, 2011; The Swedish Institute for Food and Biotechnology: Stockholm, Sweden, 2013. [Google Scholar]


| Colorimetry | Visible Imaging | Spectroscopy | Fluorescence | Hyperspectral Imaging | Multispectral Imaging | |
|---|---|---|---|---|---|---|
| Apple | Colour [21] | Colour [22] | Chlorophyll [23], anthocyanins [24], carotenoids [24], flavonols [25], SSC [26], firmness [27] | Chlorophyll [28], anthocyanins [29], flavonols [29], firmness [29], SSC [29] | Firmness [30], SSC [31] | Firmness [32], SSC [33] |
| Pear | Firmness [34], SSC [35] | SSC [36] | ||||
| Peach | Colour [37] | Firmness [38], chlorophyll [39], colour [37] | Firmness [40] | Firmness [41] | Firmness [9], SSC | |
| Avocado | MC [42], DM [42] | DM [43] | ||||
| Nectarine | Colour [44] | SSC [45], firmness [45] | Firmness [40] | |||
| Mango | Colour [46] | DM [47], starch [48], SSC [47], colour [49], firmness [50] | Firmness [8], SSC [8], WC [8] | |||
| Banana | Colour [51] | Colour [51] | TSS [52], Chlorophyll [53] | Firmness [54], TSS [54] | ||
| Tomato | Colour [55], firmness [56], TSS [57] | Colour [58], firmness [59] | Lycopene [60], SSC [61] | Chlorophyll [62] | Phenolic [63], lycopene [63] | |
| Melon | SSC [64] | |||||
| Mandarin | TTA [65], SSC [66], firmness [67], DM [68] | |||||
| Cherry | Colour [69] | Firmness [70], SSC [71] | ||||
| Strawberry | Colour [72], TSS [73], Firmness [72], TTA [73] | Firmness [74], TSS [75], TTA [75] | SSC [76], firmness [77] | |||
| Apricot | SSC [78], firmness [78], TTA [78] | |||||
| Kiwifruit | TSS [79], SSC [79], firmness [80], DM [81], Starch content [79] | |||||
| Persimmon | SSC [82] | Firmness [83] | ||||
| Grape | SSC [84], TTA [84], anthocyanin [85] | Chlorophyll [86], anthocyanin [86], TSS [86], flavonols [87] | SSC [88], TTA [88] | |||
| Pineapple | Colour [89] | DM [90], SSC [91] | ||||
| plum | Firmness [92], SSC [93], colour [92] |
© 2018 by the authors. Licensee MDPI, Basel, Switzerland. This article is an open access article distributed under the terms and conditions of the Creative Commons Attribution (CC BY) license (http://creativecommons.org/licenses/by/4.0/).
Share and Cite
Li, B.; Lecourt, J.; Bishop, G. Advances in Non-Destructive Early Assessment of Fruit Ripeness towards Defining Optimal Time of Harvest and Yield Prediction—A Review. Plants 2018, 7, 3. https://doi.org/10.3390/plants7010003
Li B, Lecourt J, Bishop G. Advances in Non-Destructive Early Assessment of Fruit Ripeness towards Defining Optimal Time of Harvest and Yield Prediction—A Review. Plants. 2018; 7(1):3. https://doi.org/10.3390/plants7010003
Chicago/Turabian StyleLi, Bo, Julien Lecourt, and Gerard Bishop. 2018. "Advances in Non-Destructive Early Assessment of Fruit Ripeness towards Defining Optimal Time of Harvest and Yield Prediction—A Review" Plants 7, no. 1: 3. https://doi.org/10.3390/plants7010003
APA StyleLi, B., Lecourt, J., & Bishop, G. (2018). Advances in Non-Destructive Early Assessment of Fruit Ripeness towards Defining Optimal Time of Harvest and Yield Prediction—A Review. Plants, 7(1), 3. https://doi.org/10.3390/plants7010003