Article

Pan-Genome-Based Characterization of the SRS Transcription Factor Family in Foxtail Millet

Shanxi Hou Ji Laboratory, College of Life Sciences, Shanxi Agricultural University, Taigu, Jinzhong 030801, China
*
Authors to whom correspondence should be addressed.
Plants 2025, 14(8), 1257; https://doi.org/10.3390/plants14081257
Submission received: 1 March 2025 / Revised: 5 April 2025 / Accepted: 16 April 2025 / Published: 21 April 2025
(This article belongs to the Section Plant Genetics, Genomics and Biotechnology)

Abstract

:
The Short Internodes-Related Sequence (SRS) family, a class of plant-specific transcription factors crucial for diverse biological processes, was systematically investigated in foxtail millet using pan-genome data from 110 core germplasm resources as well as two high-quality genomes (xm and Yu1). We identified SRS members and analyzed their intra-species distribution patterns, including copy number variation (CNV) and interchromosomal translocations. A novel standardized nomenclature (Accession_SiSRSN[.n]_xDy or xTy) was proposed to unify gene family nomenclature, enabling the direct visualization of member number variation across germplasms and the identification of core/variable members while highlighting chromosomal translocations. Focusing on the two high-quality genomes, both harboring six core SRS members, we performed whole-genome collinearity analysis with Arabidopsis, rice, maize, soybean, and green foxtail. Ka/Ks analysis of collinear gene pairs revealed purifying selection acting on SiSRS genes. Promoter analysis identified abundant stress-responsive cis-elements. Among core members, the xm_SiSRS5 gene exhibited the highest expression during vegetative growth but showed significant downregulation under drought and salt stress, suggesting its role as a key negative regulator in abiotic stress responses. This study demonstrates the utility of pan-genomics in resolving gene family dynamics and establishes SiSRS5 as a critical target for stress tolerance engineering in foxtail millet.

1. Introduction

The Short Internodes-Related Sequence (SRS) transcription factor family, also referred to as the SHI (Short Internodes) family, represents a plant-specific group of transcriptional regulators that play pivotal roles in diverse developmental and stress-responsive processes. To date, SRS members have been identified across multiple species, including Arabidopsis thaliana [1,2], maize (Zea mays) [3], rice (Oryza sativa) [4], and barley (Hordeum vulgare) [5]. In A. thaliana, this family comprises 10 members, including SHI, STY1 (STYLISH1), STY2, LRP1 (Lateral Root Primordium 1), and SRS3–SRS8, that exhibit functional redundancy [2]. Structurally, SRS proteins are characterized by two conserved domains as follows: an N-terminal RING-like zinc finger domain and a C-terminal IXGH domain. The zinc finger domain harbors a C-X2-C-X7-C-X4-C-X2-C2-X6-C cysteine-rich motif. The IXGH domain contains a conserved “IXGH” (X means any amino acid) tetrapeptide motif enriched with acidic residues, facilitating homomeric or heteromeric dimerization [2,6]. Intriguingly, evolutionary analyses reveal that the IXGH domain has been lost in certain SRS members such as SRS8 (AT5G33210) [2].
SRS proteins regulate diverse plant development by modulating hormonal crosstalk. The shi mutant, a transposon-insertion mutant that leads to SHI overexpression in A. thaliana, exhibits gibberellin acid (GA)-insensitive dwarfism, delayed flowering, and twisted leaves, which are attributed to defects in GA biosynthesis, suggesting that SHI may act as a negative regulator of GA signaling [1,7]. STY1 directly activates YUCCA4 (YUC4), a key gene in auxin biosynthesis, to orchestrate apical meristem formation during embryogenesis. This process is further modulated through auxin transport/signaling components such as PIN-FORMED 1 (PIN1) and PINOID (PID), highlighting the role of SRS proteins in coordinating auxin homeostasis to regulate developmental polarity [8]. STY1 and STY2 synergistically regulate gynoecium development in a dose-dependent manner, while higher-order mutants (e.g., quintuple mutants sty1-1 sty2-1 shi-3 lrp1 srs5-1) display severe phenotypic abnormalities, including disrupted apical tissue formation in gynoecia and enhanced leaf serration [1,2,6]. The expression of LRP1, which is involved in A. thaliana early lateral root formation by induction of the YUC4 expression, was identified during the initial stages of lateral and adventitious root primordia development and at the primary root primordium [9,10]. ZmLRP1 (GRMZM2G077752) plays an essential role in the formation of lateral roots and crown roots in maize. Its expression is directly repressed by RUM1 (Rootless with Undetectable Meristem 1) and Aux/IAA (Auxin/Indole-3-Acetic Acid) proteins by binding to the ZmLRP1 promoter [11]. Additionally, ZmLRP1 is the only SRS member with high expression level in senescing leaves, and it may activate carbohydrate remobilization via abscisic acid (ABA) signaling, underscoring the complexity of SRS–hormone interactions [3]. SRS5 promotes photomorphogenesis by activating ELONGATED HYPOCOTYL5 (HY5) and B-BOX PROTEIN (BBX21 and BBX22) genes while inhibiting lateral root formation by suppressing LATERAL ORGAN BOUNDARIES-DOMAIN (LBD16 and LBD29) expression [12,13]. In barley, VRS2 balances gradients of auxin, cytokinin, and GA to regulate the spike architecture and floret patterning [5].
SRS proteins are also involved in abiotic stress responses, exhibiting species-specific patterns. Rice OsSHI1 integrates auxin, brassinosteroid (BR), and ABA signaling to coordinate growth-stress trade-offs [14]. The overexpression of soybean (Glycine max) GmSRS18 in A. thaliana negatively regulates drought and salt tolerance [15], whereas five OsSRSs in rice are upregulated under salt and drought stress [4]. Cotton (Gossypium hirsutum) GhSRS21 negatively modulates salt tolerance by regulating ROS (Reactive Oxygen Species) homeostasis [16]. In Solanum lycopersicum, eight SlSRS genes were identified and seven members showed responsiveness at a transcription level to different abiotic treatments, including dehydration, oxidative stress, salinity, drought, injury, and osmotic stress [17].
Despite these advances, the functional characterization of the SRS family in foxtail millet (Setaria italica), a drought-tolerant C4 model crop, remains unexplored. While pan-genomic studies have elucidated core-variable gene distributions (core genes present in most of all individuals; variable genes include copy-number variations (CNVs) and gene presence/absence variations (gPAVs) within species [18,19]), systematic analyses of SRS members in foxtail millet are lacking. Deciphering the roles of SRS genes in this resilient species could unveil the molecular mechanisms underlying stress adaptation and provide novel targets for crop improvement.

2. Materials and Methods

2.1. Data Acquisition

Genomic and proteomic data for A. thaliana SRS family members were retrieved from the TAIR database (https://www.arabidopsis.org/, accessed on 14 July 2024), and conserved domain features were annotated using InterPro (http://pfam-legacy.xfam.org/, accessed on 14 July 2024). Hidden Markov Models (HMMs) corresponding to SRS domains were downloaded for subsequent analysis. Protein sequences, genome annotations, and biological information for green foxtail (Setaria viridis), maize, rice, soybean, and A. thaliana were obtained from Phytozome (https://phytozome-next.jgi.doe.gov/, accessed on 14 July 2024). The mutant with a short life cycle of the foxtail millet elite cultivar Jingu21 xiaomi (xm) dataset was sourced from the Setaria italica Multi-Omics Database (http://sky.sxau.edu.cn/MDSi.htm, accessed on 15 July 2024) [20], while the Telomere-to-Telomere (T2T) assembled genome of the Yugu1 (Yu1) cultivar was acquired from Setaria-DB (http://111.203.21.71:8000/index.html, accessed on 1 January 2024) [21]. Transcriptomic data from 110 foxtail millet pan-genome accessions [22], Yu1, and xm were processed using Perl hash structures to extract primary protein-coding transcripts, which were compiled into a pan-genome protein database.

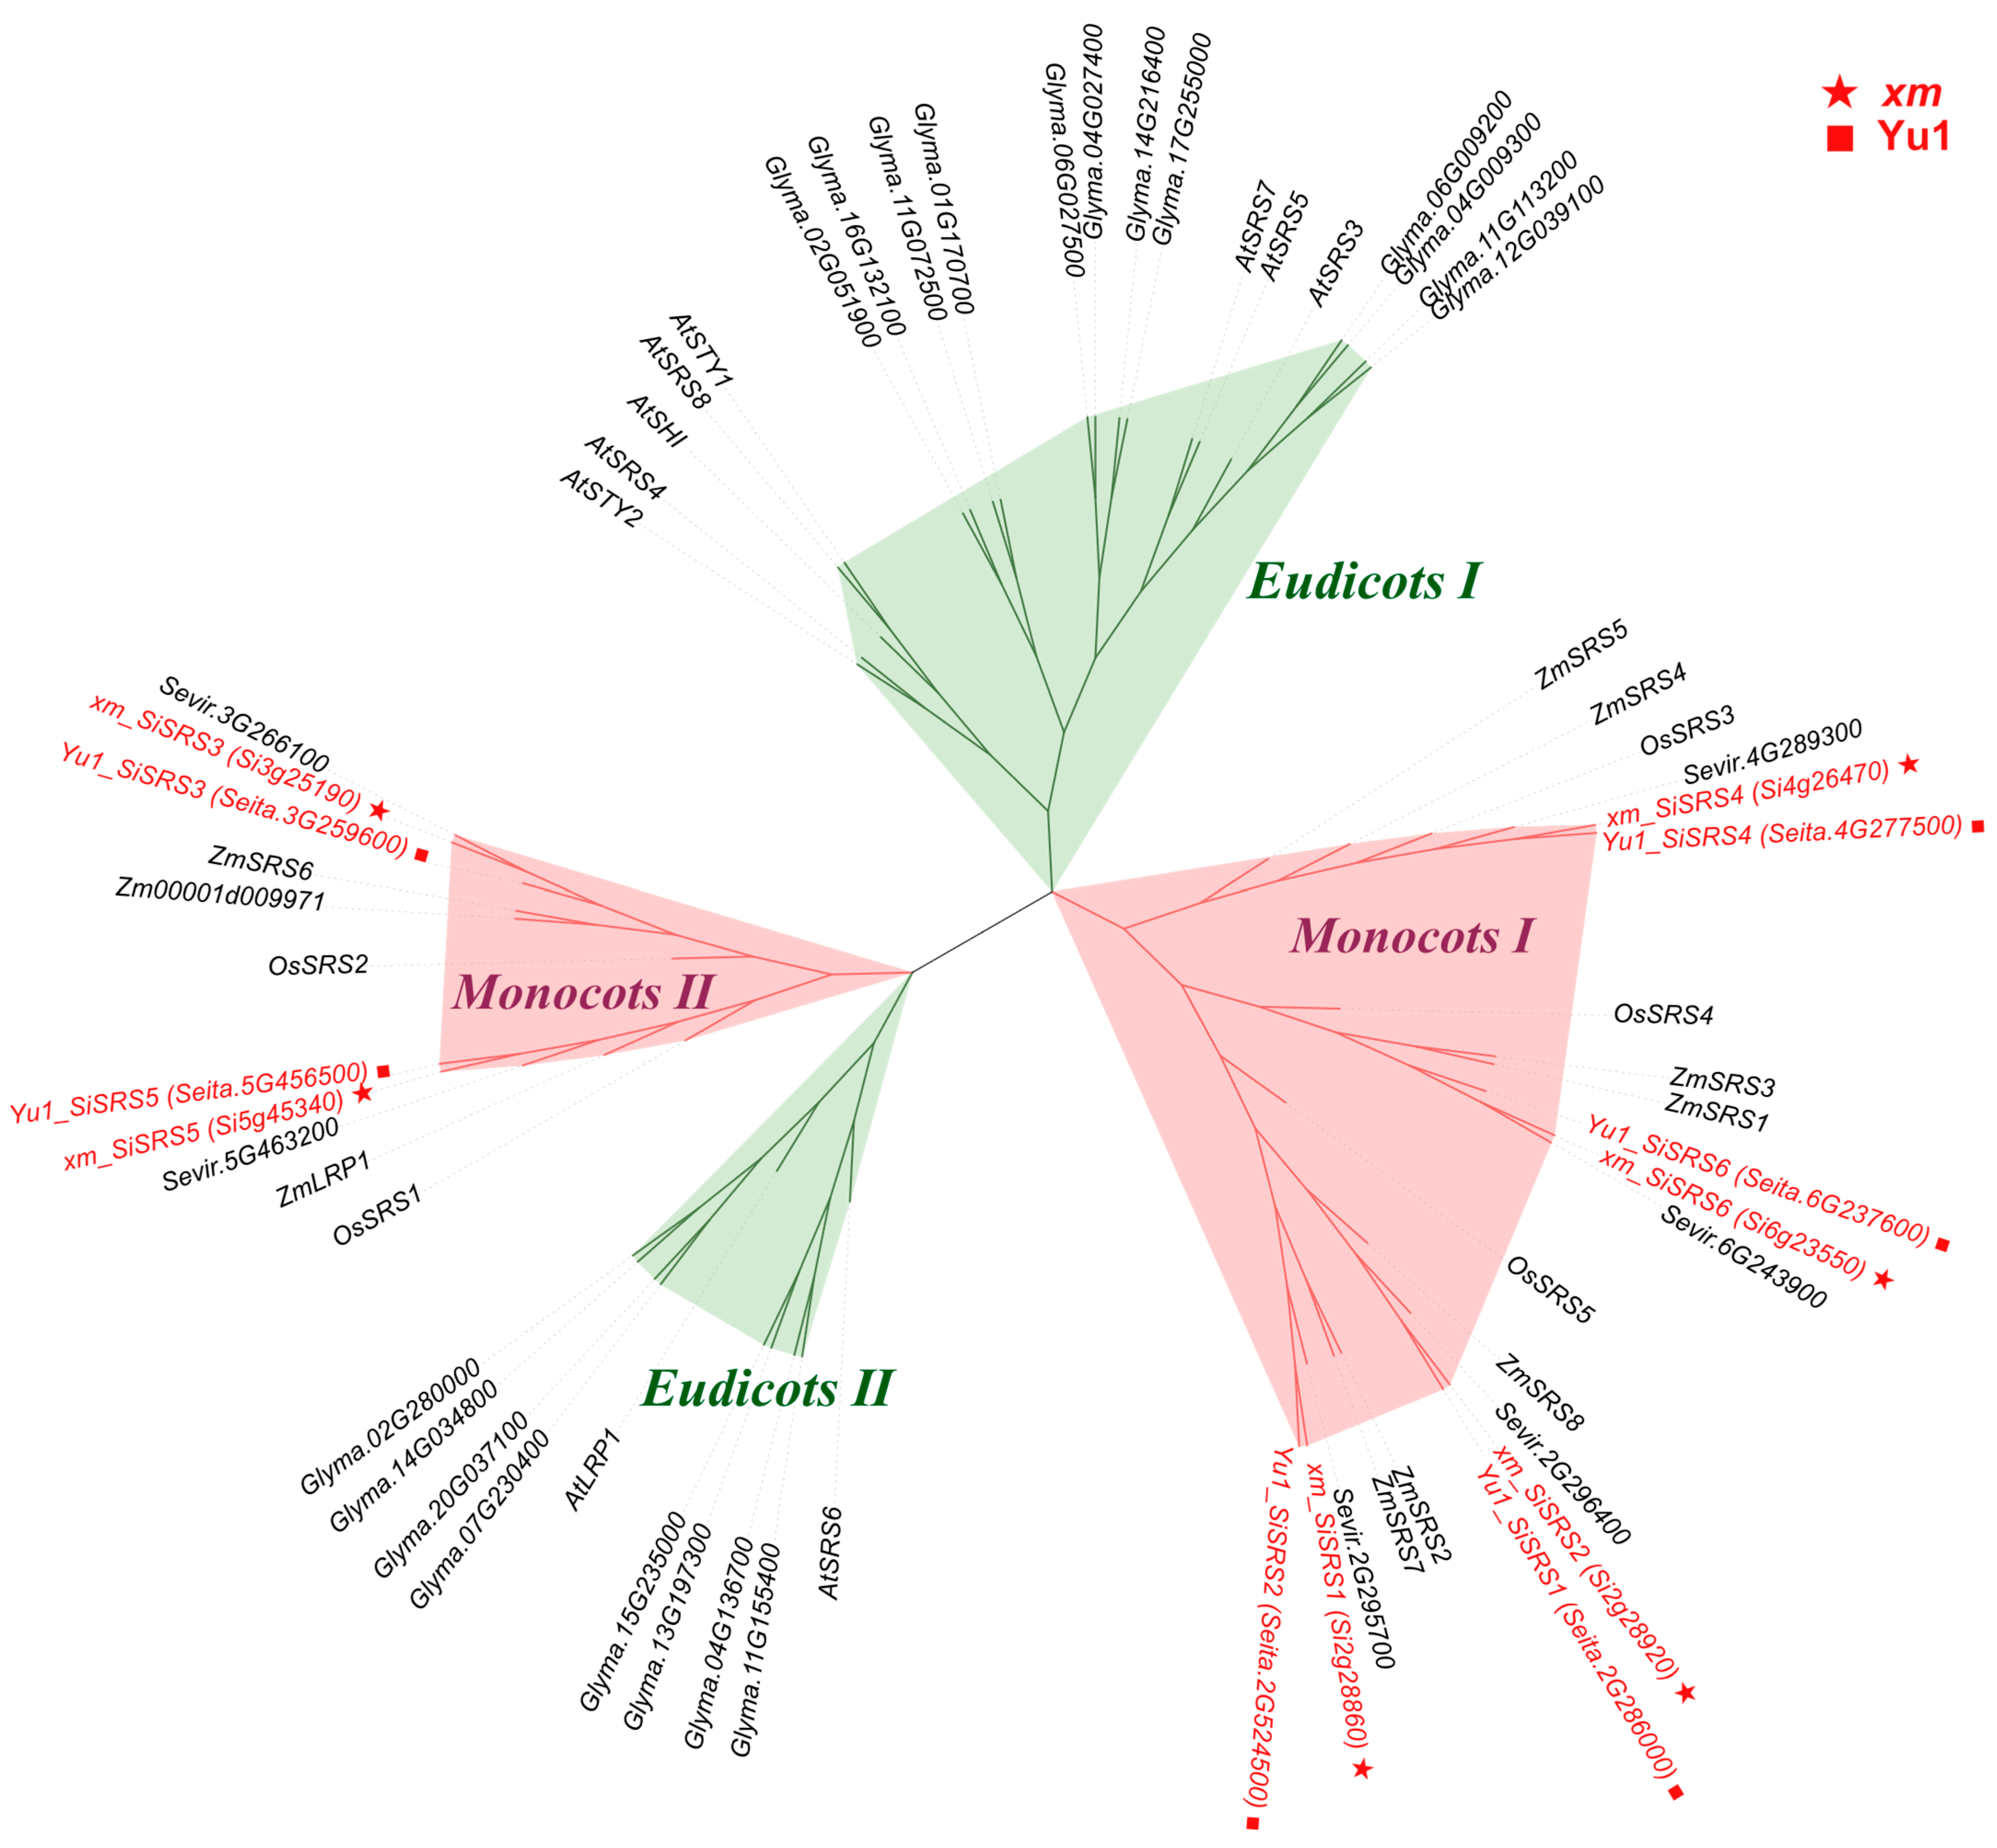
2.2. Identification and Phylogenetic Analysis of SRS Family Members

A dual approach combining BLASTP- and HMM-based screening was employed to comprehensively identify SRS homologs. First, 10 A. thaliana SRS protein sequences were used as queries for BLASTP (blast+, v2.13.0, National Center for Biotechnology Information, Bethesda, MD, USA) searches against protein databases containing A. thaliana, soybean, maize, rice, green foxtail, and foxtail millet (Yu1 and xm), with an E-value cutoff of <1 × 10⁻⁵. Second, an HMM profile specific to the SRS family was constructed from A. thaliana SRS using InterPro (https://www.ebi.ac.uk/interpro/, accessed on 21 July 2024) and applied to screen the same databases via HMMER (v3.3.2, Howard Hughes Medical Institute, Chevy Chase, MD, USA) [23] (E-value < 1 × 10⁻⁵). Candidate sequences from both methods were aligned using MAFFT (v7.505, Research Institute for Microbial Diseases, Osaka University, Osaka, Japan, L-INS-i algorithm) [24], and the alignment was iteratively refined with HMMER to reconstruct a high-confidence HMM. This refined model was reapplied to the databases under identical thresholds, and the intersection of BLASTP and HMM results yielded the final candidate SRS gene set.
For phylogenetic reconstruction, candidate protein sequences were aligned with MAFFT, and a maximum-likelihood tree was generated using IQ-Tree (v2.0.3, Center for Integrative Bioinformatics Vienna, Max F. Perutz Laboratories, University of Vienna, Vienna, Austria) [25] under the best-fit substitution model (automatically selected by ModelFinder). Branch support was assessed with UFboot (UltraFast bootstrap approximation, 1000 replicates) [26] and SH-aLRT (approximate likelihood ratio test) [27]. The resulting topology was visualized as a cladogram using iTOL (v7, Biobyte Solutions GmbH, Heidelberg, Germany, https://itol.embl.de/, accessed on 15 July 2024).
For pan-genome analyses, the same pipeline was applied, substituting the protein database with the pan-genome and the xm and Yu1 dataset. Subspecies-specific gene distributions across phylogenetic clades were quantified using R (v4.3.1, R Foundation for Statistical Computing, Vienna, Austria), and candidate genes were mapped to their genomic loci on the T2T assembly using Python (v3.9.11, Python Software Foundation, Wilmington, DE, USA). Visualization of chromosomal positions was performed with the R package Rideogram (v0.2.2) [28]. We constructed a phylogenetic tree of pan-genome gene family members using FastTree (v2.1.11, Lawrence Berkeley National Laboratory, Berkeley, CA, USA) [29].

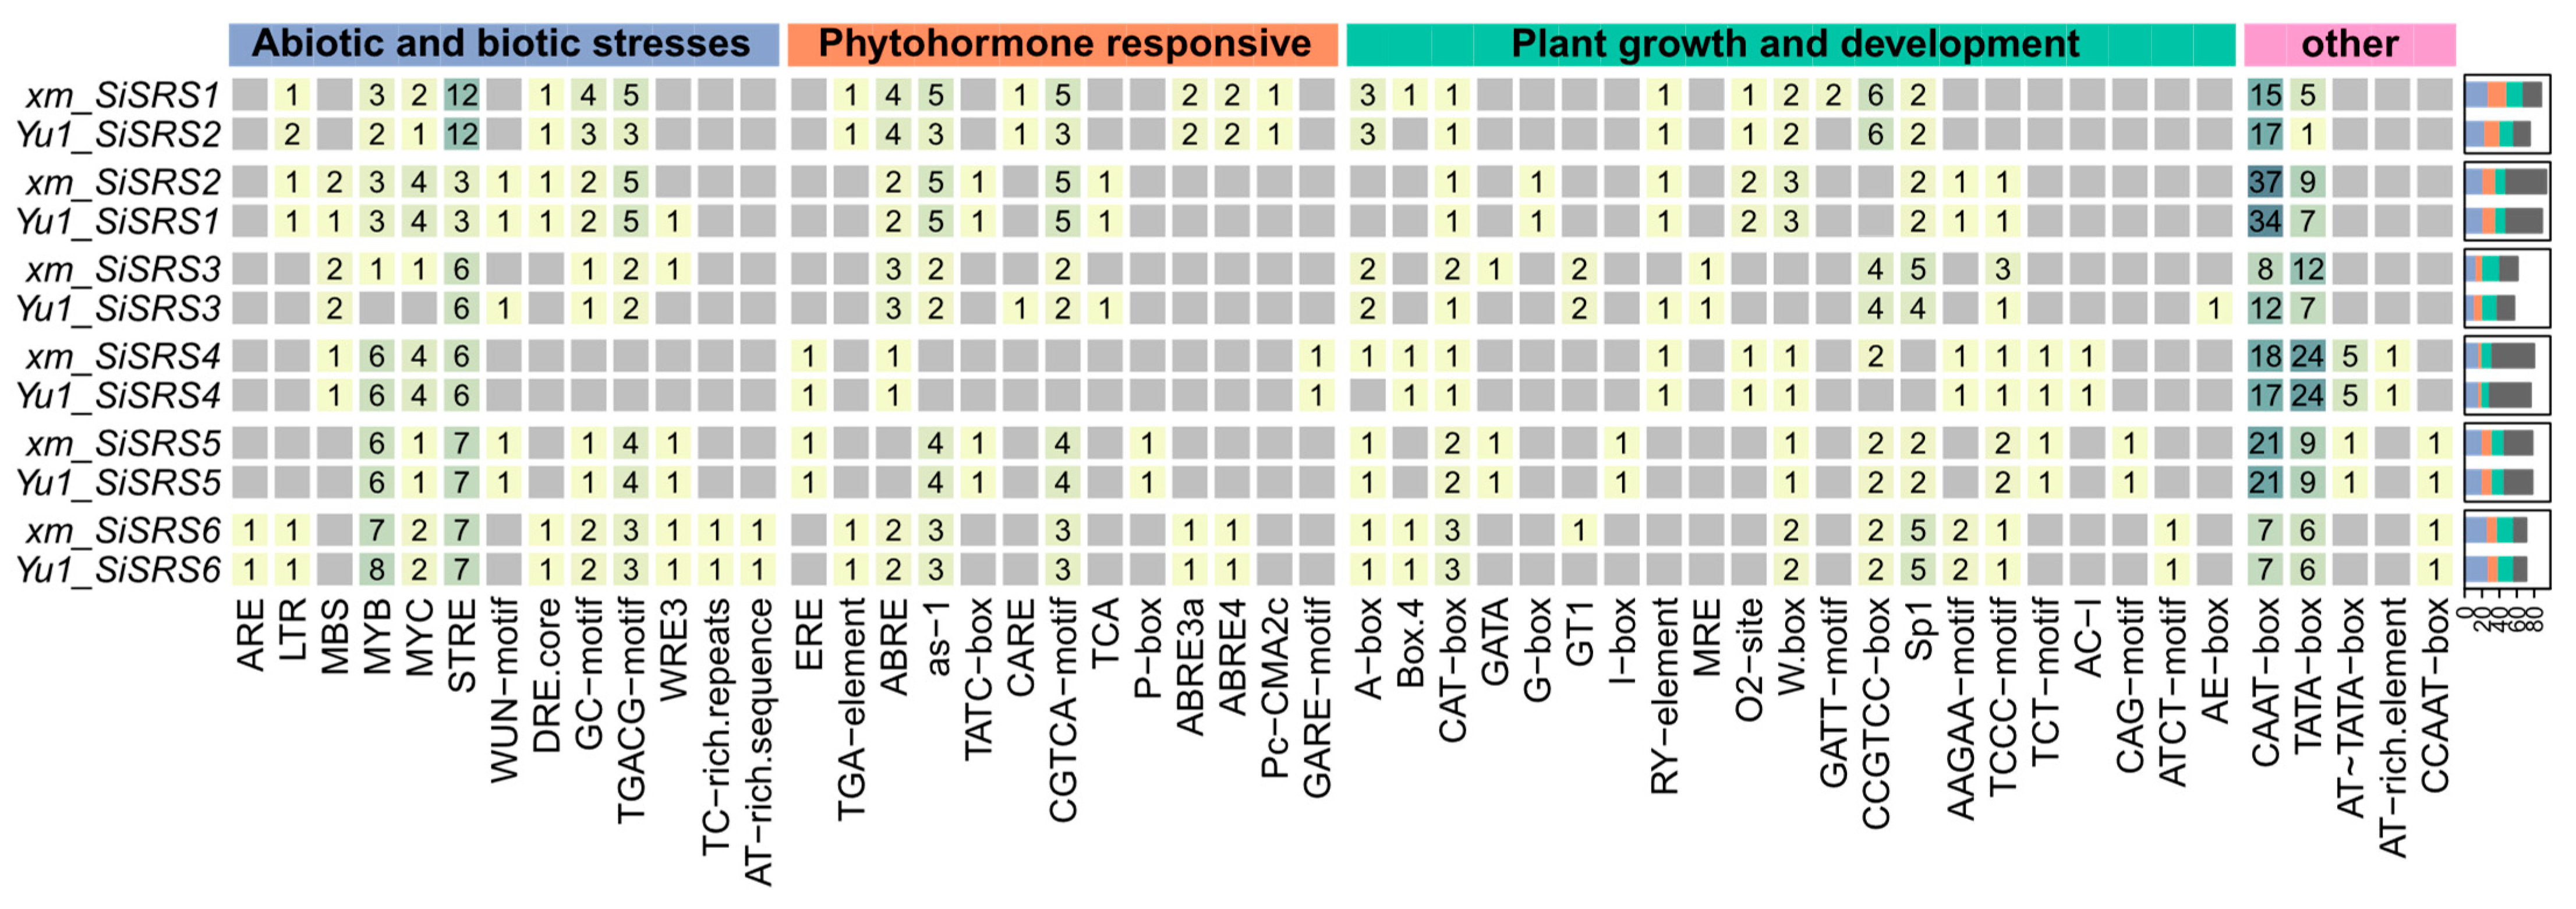
2.3. Analysis of Promoter Sequences of SRS Family Members at the Pan-Genome Level

The upstream 2000 bp sequences of all SRS members in the 112 accessions were extracted using bedtools (v2.31.1, Quinlan Laboratory, University of Utah, Salt Lake City, UT, USA) and submitted to PlantCARE (http://bioinformatics.psb.ugent.be/webtools/plantcare/html/, accessed on 4 April 2025) for the prediction of their cis-regulatory element (CRE) distributions [30]. Visualization was performed using TBtools (v2.003) [31]. Predicted elements were categorized by function (e.g., abiotic stress response, phytohormone signaling, and plant growth and development) and visualized as a heatmap using the ComplexHeatmap (v2.22.0, Bioconductor Project, Dana-Farber Cancer Institute, Boston, MA, USA) R package [32].

2.4. Motif and Conserved Domain Analysis

Conserved motifs in SiSRS proteins were predicted using MEME Suite (https://meme-suite.org/meme/tools/meme, last accessed on 1 April 2025) [33], with parameters set to identify 6-100 aa motifs (maximum 10 motifs per sequence, E-value < 1 × 10⁻⁵). Conserved domains were annotated via NCBI’s Batch-CD-Search (https://www.ncbi.nlm.nih.gov/Structure/bwrpsb/bwrpsb.cgi, accessed on 1 April 2025) [34], using the default thresholds. Results were visualized using TBtools (v2.003) [30] to generate integrated diagrams of the motif-domain architectures.

2.5. Collinearity and Selective Pressure Analysis

The intra- and inter-species collinearity of SRS genes was analyzed using MCScanX (Plant Genome Mapping Laboratory, Institute of Bioinformatics, Department of Plant Biology, University of Georgia, Athens, GA, USA) [35]. For cross-species comparisons, reciprocal BLASTP (E-value < 1 × 10⁻⁵, num Hits = 10) was performed between foxtail millet (xm and Yu1) and reference species to identify syntenic gene pairs. Intra-species collinearity within foxtail millet was assessed using the Yu1 genome as the reference. To evaluate evolutionary selection pressure, Ka/Ks ratios for collinear SiSRS gene pairs were calculated with KaKs_Calculator (v3.0, National Genomics Data Center, Beijing Institute of Genomics, Chinese Academy of Sciences, Beijing, China) [36] with the NG86 model, which accounts for non-synonymous (Ka) and synonymous (Ks) substitution rates.

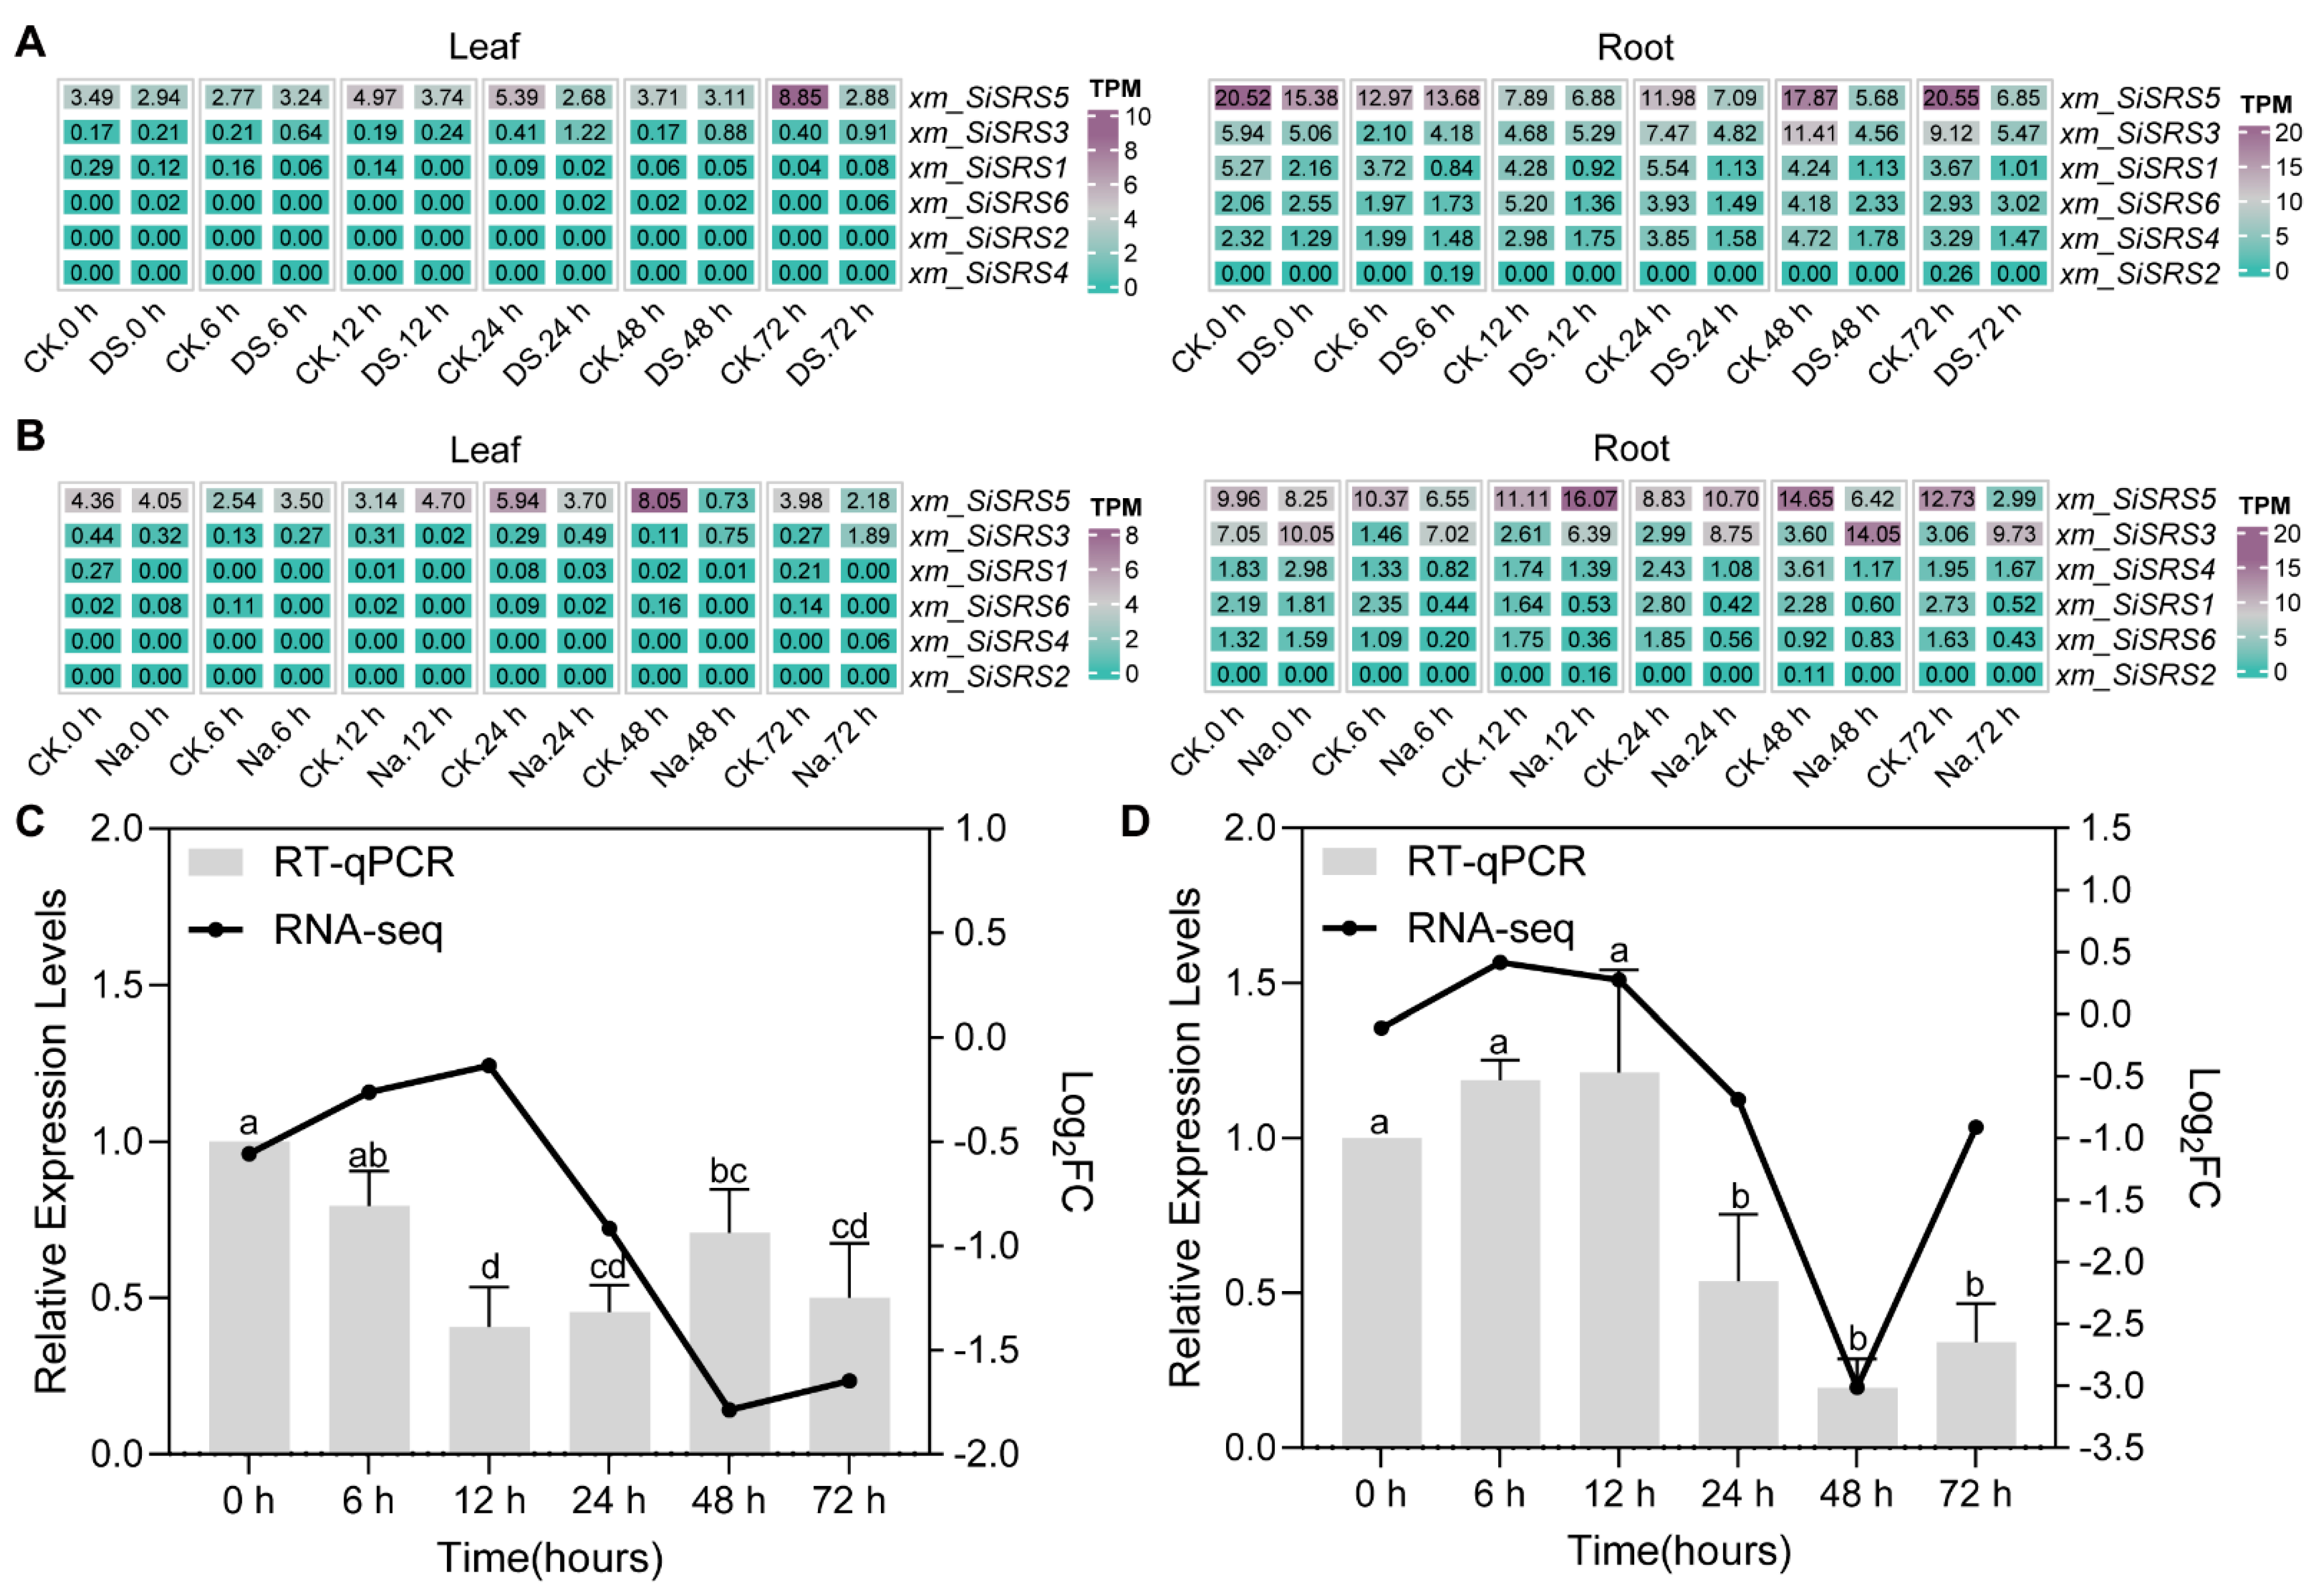
2.6. RNA-seq Data Mining

The expression profiles of SiSRS genes across spatiotemporal tissues were extracted from transcriptomic datasets. Expression values were normalized to TPM (transcripts per million), and a tissue-specific expression heatmap was generated using the pheatmap (v1.0.12, R Foundation for Statistical Computing, Vienna, Austria) R package [37]. Pairwise Pearson correlation coefficients of gene expression patterns were calculated and visualized with corrplot (v0.95, R Foundation for Statistical Computing, Vienna, Austria).

2.7. RT-qPCR Validation

Stress treatments: Twenty-one-day-old xm seedlings were subjected to drought (20% PEG6000, w/v) or salt stress (250 mM NaCl). Leaf and root tissues were sampled at 0, 6, 12, 24, 48, and 72 h post-treatment. Untreated seedlings at corresponding time points served as controls.
RNA extraction and cDNA synthesis: Total RNA was isolated using the Plant RNA Kit (R6827, OMEGA, Guangzhou, China). Genomic DNA was removed with the PrimerScript™ gDNA Eraser, and cDNA was synthesized using the PrimerScript™ RT Reagent Kit (RR047A, TaKaRa, Beijing, China).
qPCR Amplification: Reactions were performed on a Bio-Rad CFX96 system (Bio-Rad Laboratories, Hercules, CA, USA) in 10 µL volumes containing the following: 5 µL TB green premix Ex Taq II (2×), 0.5 µL forward/reverse primers (10 µM each), 0.2 µL ROX reference dye II (50×), 1 µL cDNA template, and 2.8 µL ddH2O. The thermal cycling conditions were as follows: initial denaturation at 95 °C for 30 s, followed by 40 cycles of denaturation at 95 °C for 5 s and annealing/extension at 60 °C for 34 s. Three biological replicates with technical triplicates were included for each sample.

2.8. Gene Co-Expression and Protein–Protein Interaction Networks

Co-expression network analysis: A weighted gene co-expression network was constructed using the WGCNA (v1.73, R Foundation for Statistical Computing, Vienna, Austria) R package [38]. Transcriptomic data were preprocessed to retain genes with non-zero variance and a sample missing rate < 10%. Soft thresholding power was determined via the scale-free topology criteria (R2 > 0.80). For each SiSRS gene, the top 50 co-expressed partners (ranked by connection weight) were selected to build sub-networks, which were visualized using Cytoscape (v3.10.2, The Cytoscape Consortium, San Diego, CA, USA) [39].
Protein–Protein Interaction (PPI) network: SiSRS protein sequences were queried against the STRING database (https://string-db.org/, accessed on 26 August 2024) [40] using A. thaliana as the reference species. Interactions with a confidence score > 0.70 were retained, and the network topology was refined to highlight high-confidence nodes (e.g., hubs with ≥5 edges). The final PPI network was imported into Cytoscape for layout optimization and functional annotation.

3. Results

3.1. Pan-Genome Distribution of the SiSRS Gene Family

Alongside the pan-genome dataset comprising 110 foxtail millet accessions (35 cultivars, 40 landraces, and 35 wild varieties), genomic resources from the elite cultivar Yu1 and the Jingu21-derived mutant line xm were integrated, resulting in a consolidated dataset of 112 accessions. Comprehensive analysis of the 112 accessions identified 678 SiSRS members, phylogenetically classified into six distinct clades (Clade 1-6) based on the encoded polypeptides (Figure 1A), suggesting there are six core genes in the species. The clade-specific member counts remained stable across subspecies (Figure 1B), with 91 accessions harboring all six core SiSRS genes (SiSRS1-6), confirming their conserved status (Figure 1C). These core genes exhibited conserved chromosomal localization as follows: SiSRS1 and SiSRS2 co-localized on chromosome 2 (Chr2), while SiSRS3-6 mapped to chromosomes 3-6, respectively (Figure 1D).
Twelve accessions harbored a seventh SiSRS copy, and Q13 uniquely retained an eighth copy. These additional copies displayed high homology to specific core genes, suggesting the existence of recent duplication events (Figure 1C, Supplementary Table S1). C16, Q14, and Q35 shared near-identical sequences with SiSRS2 (Chr2). However, Q14′s copy localized to Chr9, while C16/Q35 copies remained unanchored to chromosomes. L10 and Q15 duplicates showed highest homology to SiSRS3 (Chr3) but were positioned on Chr8 and Chr9, respectively. L3 and Q1 duplicates aligned with SiSRS4 (Chr4) but remained in unassembled regions. Q4, Q9, Q12, and Q31 duplicates clustered adjacently on Chr5, mirroring SiSRS5’s locus. Q3′s duplicate belonged to clade 6 but also remained unassembled. Q13 retained an extra SiSRS6 copy on Chr6 and a SiSRS3 duplicate on Chr3. Notably, no accessions contained additional SiSRS1 copies, underscoring its evolutionary stability (Supplementary Table S2).
The core genes of SiSRS exhibit evidence of cross-chromosomal distribution. For instance, L23 contains six SRS genes, yet SiSRS1 is located on Chr5 instead of the expected Chr2, while SiSRS1 of Q25 has translocated from Chr2 to Chr7. Similarly, SiSRS2 in accession L14 has translocated from Chr2 to Chr4. Additionally, SiSRS3 in Q1, Q28, and Q30 is positioned on Chr8, 5, and 2, respectively, rather than Chr3. Gene SiSRS4 in C27 and L11 has relocated to chromosomes 7 and 2, respectively. Furthermore, the SiSRS6 gene in C15, C26, C29, and L11 is found on Chr3, 1, 5 and 5, respectively (Figure 1D, Supplementary Table S1). Moreover, certain accessions (C16, L3, Q1, Q3, and Q35) contain SiSRS genes that have not been assembled into specific chromosomal regions; however, these genes are still distributed across the six branches (Supplementary Table S2).
Additionally, eight accessions (C4, L7, L20, L24, L34, L35, Q24, and Q33) lack certain core members of the SiSRS family, containing only five SRS genes. Among these, L7 lacks SiSRS1, L34 lacks SiSRS2, L20 lacks SiSRS3, L24 and L35 lack SiSRS4, C4 and Q33 lack SiSRS5, and Q24 lacks SiSRS6. These deficiencies may be due to issues related to sequencing depth or annotation quality. The case of Me34V is particularly noteworthy as it lacks SiSRS2 but possesses an additional copy of SiSRS6 (Figure 1C, Supplementary Table S1).

3.2. Pan-Genome-Based Nomenclature for Gene Family Members

Based on previous analyses, this study has systematically established a naming convention for members of the SiSRS gene family at the pan-genome level. The proposed system is designed to provide clarity and consistency in gene nomenclature, facilitating the identification and classification of gene copies across different genomes. The naming format is outlined as follows:
Core gene naming: The naming of core members begins with the accession name as a prefix, followed by their chromosomal locations using the format “SiSRSN” (where N ranges from 1 to 6), separated by an underscore “_”. This numbering process remains consistent even if a specific member is absent in a particular germplasm. When describing the SRS core genes of the species, the accession name can be omitted, such as SiSRS1.
Additional copies based on phylogenetic relationships: Based on phylogenetic relationships, the additional copies of a core member are designated as ‘1′, ‘2′, etc., according to the chromosomal physical position order. That is, if there exists an nth additional copy, it is suffixed with ‘.n’. This approach ensures that each copy is uniquely identified based on its phylogenetic relationship to the core gene.
Interchromosomal localization of gene copies: The naming system emphasizes the interchromosomal localization of gene copies. After the name of a core gene, the chromosomal localization x followed an underscore, which can be omitted. For an additional copy, the primary chromosomal position x of the corresponding core gene with the highest homology is indicated after an underscore, followed by the actual chromosomal location y of the additional copy, separated by the letter “D”, i.e., “_xDy” (“D” means “duplicate of”). For genes that have not undergone interchromosomal insertional translocation and duplication relative to their corresponding core gene, the single value x suffices and may be omitted if there is no ambiguity. For core genes transferred to unexpected chromosomes, x represents the expected chromosome number, and y represents the actual chromosome number. These two values are connected by the letter “T”, i.e., “_xTy” (“T” means “transfer to”).
The complete naming convention is as follows:
Accession_SiSRSN[.n]_xDy or xTy
For example, in Q13, additional copies of SiSRS3 and SiSRS6 are denoted by Q13_SiSRS3.1_3D3 (alternatively denoted as Q13_SiSRS3.1_3 or Q13_SiSRS3.1), Q13_SiSRS6.1_6D6 (alternatively denoted as Q13_SiSRS6.1_6 or Q13_SiSRS6.1). In C26, the core gene SiSRS6 has transferred from chromosome 6 to chromosome 1, which is named C26_SiSRS6_6T1. In L10, an additional copy of SiSRS3 (Chr3) is located on chromosome 8, named L10_SiSRS3.1_3D8. In L34, although the core gene SiSRS2 is missing, the other core genes retain their original numbering, i.e., L34_SiSRS1_2, L34_SiSRS3_3, L34_SiSRS4_4, L34_SiSRS5_5, and L34_SiSRS6_6. The core gene names of L34 can also be abbreviated, for instance, L34_SiSRS1_2 can be written as L34_SiSRS1.

3.3. Pan-Genome-Based Promoter Analysis

The promoters of SiSRSs can also be classified into six phylogenetic branches, with each branch primarily representing the corresponding clade of SRS family, along with additional copies identified through evolutionary analysis based on amino acid sequences (Supplementary Figure S1). However, unexpected members from other branches were found within each phylogenetic group. For instance, the SiSRS1 branch contains Yu1_SiSRS2, and the SiSRS2 branch contains Yu1_SiSRS1, Q18_SiSRS5, Q14_SiSRS5, Q13_SiSRS5.
Regarding the distribution of CREs, differences exist between branches, and various distributions are also observed within each branch. For instance, the SiSRS5 clade predominantly exhibits three distribution patterns (pattern5_1, pattern5_2, and pattern5_3). Intriguingly, pattern5_2 and pattern5_3 are exclusively detected in a subset of cultivated accessions and landraces, whereas all 35 wild accessions completely lacked these patterns in their SiSRS5 promoters. Compared to pattern5_2, pattern5_3 demonstrates a 5′-ward shift, suggesting 3′-prime fragment insertion. Conversely, this phenomenon could alternatively result from regional fragment deletion in pattern5_2. Notably, pattern5_1 represents the predominant structural configuration observed in wild-type CREs, encompassing only sporadic cases of landrace varieties such as L9_SiSRS5, L23_SiSRS5, and L25_SiSRS5. The absence of explicit pattern specifications for certain accessions stems from these forms being only slight variations of existing patterns. For instance, xm_SiSRS5 and Yu1_SiSRS5 exhibit merely marginal deviations from the established pattern5_3 framework. Moreover, certain wild-type accessions (e.g., Q31_SiSRS5 and Q30_SiSRS5) exhibit divergent spatial arrangements that deviate markedly from pattern5_1, from which no clear migration patterns could be discerned. The SiSRS2 clade also demonstrates three patterns (pattern2_1, pattern2_2, and pattern2_3). Pattern2_1 and pattern2_2 comprehensively encompass the majority of wild accessions, whereas pattern2_3 represents the genetic profile characteristic of landraces and cultivars, emerging as the predominant configuration in contemporary agricultural systems.
The SiSRS4 clade contains pattern4_1 and pattern4_2, which exhibit differentiation patterns analogous to those between the previously described pattern5_2 and pattern5_3. Additionally, the SiSRS1 clade and SiSRS6 clade predominantly exhibit one distribution pattern, respectively. The SiSRS3 promoter displays the most complex variation.

3.4. Pan-Genome-Based Motif and Conserved Domain Analysis

The motif arrangement characteristics of the SiSRS family can be clustered into six major branches, designated as Type I–VI (Supplementary Figure S2A). Type I includes SiSRS1 members, with a conserved representative motif arrangement from the amino terminus to the carboxyl terminus as follows: motif 8-5-10-1-4-7-3-2-9-6. Notably, two sequence-length variations exist between motif 7 and motif 3, classified as Type I-L (50 accessions) and Type I-S (59 accessions). Type I-L exclusively contains two wild accessions (Q33 and Q36). Intriguingly, L14_SiSRS1 exhibits nearly duplicated sequence length and two nearly identical motif arrangements, with the first set lacking motif 6. This suggests a potential duplication event of SRS gene copies in the corresponding chromosomal region, where intervening sequences were lost during duplication. Type II is composed of SiSRS2 members, characterized by the motif order 7-8-9-5-1-4-3-2-10. Variations occur between motif 7 and motif 9 across different germplasms. Type III (SiSRS3) features the representative motif arrangement 9-5-1-4-7-3-2-10-8. However, 40 members display additional amino acid sequences preceding motif 9. Type IV (SiSRS4) exhibits two distinct motif arrangements differentiated by the presence or absence of N-terminal motif 9. Remarkably, among 73 accessions containing motif 9, only 7 are wild species (Q33, Q31, Q23, Q22, Q12, Q9, and Q2), while other wild SiSRS4 members lack this motif entirely. Type V (SiSRS5) displays the motif order 5-9-1-4-7-3-2-10-8. A unique duplication of motif 5 at the carboxyl terminus of motif 9 is observed in 39 landraces and cultivars and 12 wild accessions. The 9-10-5-1-4-7-3-2-8-6 motif arrangement constitutes the predominant organizational pattern in Type VI systems assembled by SiSRS6 members. All SiSRS members retain the DUF702 domain, a defining core feature of the SRS family (Supplementary Figure S2B). Strikingly, the Transposase_28 domain was identified in SiSRS5 members from three wild accessions (Q13, Q14, and Q18), suggesting potential transposon-mediated evolutionary events in these lineages.

3.5. SiSRS Family Members in xm and Yu1

This study employed two representative foxtail millet accessions (xm and Yugu1), which possess high-quality genomes and comprehensive multi-omics datasets, to systematically investigate the characteristic patterns of SiSRS core family members. Both cultivars harbored six conserved SiSRS core members. Maximum likelihood phylogenetic reconstruction revealed that the entire SiSRS family can be divided into two major clades (Figure 2). Within each developmental clade, monocot and dicot SRS genes exhibit distinct independence, with the overall family being further subdivided into the following two groups: Monocots I and II and Eudicots I and II. Specifically, SiSRS3 and SiSRS5 are classified under Monocots I, including the LRP of A. thaliana, while SiSRS1, SiSRS2, SiSRS4, and SiSRS6 are grouped under STY/SHIs containing Monocots II. Additionally, SiSRS1 and SiSRS2 genes exhibit a cross-corresponding relationship between the xm and Yu1 varieties.
Genome-wide collinearity analysis identified strong syntenic relationships between SiSRS genes and SRS homologs across five species (Figure 3A). For the number of collinear gene pairs in A. thaliana, soybean, rice, green foxtail, and maize were 7, 11, 5, 5, and 9, respectively (Figure 3A). Ka/Ks analysis of orthologous pairs revealed values < 1 across all comparisons (Figure 3B), consistent with purifying selection preserving core functional domains. Intraspecific collinearity in Yu1 further identified two paralogous pairs (SiSRS1-SiSRS6 and SiSRS3-SiSRS5) with Ka/Ks < 1 (Figure 3C; Supplementary Table S3), reinforcing functional conservation under neutral evolutionary regimes.
The SiSRS protein family exhibits considerable variation in polypeptide length (226–411 amino acids), with molecular weights ranging from 22.98 to 42.06 kDa and isoelectric points (pI) spanning 7.70–9.10 (Supplementary Table S3). Protein sequence alignment confirmed that all members harbor signature features, including the C-X2-C-X7-C-X4-C-X2-C2-X6-C zinc-binding motif, IXGH motif, nuclear localization signal (NLS), and variable-length Q-rich region (Supplementary Figures S3 and S4).

3.6. SiSRS Promoter Architecture and Stress-Responsive Cis-Regulatory Element Profiling in xm and Yu1

To elucidate the transcriptional regulation mechanisms, the promoter regions (2 kb upstream of initiation codon) of xm_SiSRSs and Yu1_SiSRSs were aligned (Supplementary Figure S5) and analyzed using PlantCARE (Figure 4). A total of 52 cis-elements were identified, categorized into four functional groups as follows: plant growth/development (21 elements), stress response (13 elements), hormone signaling (13 elements), and essential/core regulatory elements (5 elements). Among the most closely related gene pairs, except for xm_SiSRS1 vs. Yu1_SiSRS2 (81.40%) and xm_SiSRS3 vs. Yu1_SiSRS3 (85.61%), their promoter sequences exhibit extremely high homology (>99%), resulting in closely distributed regulatory elements. However, among SiSRS pairs, stress-responsive elements displays distinct distribution patterns. For instance, the environmental adaptation-related Myb element shows marked variability, with xm/Yu1_SiSRS3 containing minimal counts (≤1) versus xm/Yu1_SiSRS6 harboring the highest density (≥7 elements). Hypoxia/oxidative stress responsive GC-motifs are ubiquitously present, except in xm/Yu1_SiSRS4, peaking at xm_SiSRS1 (4 elements) and Yu1_SiSRS2 (3 elements). Stress response elements (STRE) playing a role in general stress response demonstrates broad distribution, with maximal enrichment in xm_SiSRS1 and Yu1_SiSRS2 (12 elements). Anaerobic response elements (AREs) localizes solely to xm/Yu1_SiSRS6, while drought-responsive MBS elements occurrs in xm/Yu1_SiSRS2/3/4. Wound-responsive WUN-motifs appears in xm_SiSRS2/3/5. LTR (Long Terminal Repeat) retrotransposon sequences were identified in xm/Yu1_SiSRS1/2/6. Hormone-specific elements P-box for gibberellin/drought response and light response elements (LREs) I-box are exclusively located in xm/Yu1_SiSRS5.

3.7. Expression Profiling of xm_SiSRS Genes in Salt and Drought Stress

Transcriptomic analysis across developmental stages and tissues of xm revealed distinct expression patterns among SiSRS family members. xm_SiSRS5 displayed the highest overall expression, with its peak transcript abundance (TPM = 117.23 ± 11.90) observed in panicles at 2 days post-heading (Figure 5A). Notably, xm_SiSRS3 and xm_SiSRS6 also exhibited pronounced expressions in panicles. During grain filling, xm_SiSRS5 and xm_SiSRS3 genes maintained elevated expressions in roots (40.43 ± 2.31; 47.38 ± 2.11) and stems (26.60 ± 13.80; 27.23 ± 10.70), while their leaf expressions remained comparatively low across all developmental phases. In contrast, xm_SiSRS1, xm_SiSRS2, and xm_SiSRS4 showed minimal transcriptional activity with xm_SiSRS2, demonstrating near-undetectable expression levels (TPM ≤ 0.03 ± 0.05). Correlation analysis identified significant positive correlations between xm_SiSRS1 and both xm_SiSRS3 and xm_SiSRS4 (r = 0.68–0.72, p < 0.001), while xm_SiSRS3 exhibited strong associations with xm_SiSRS4/5/6 (r > 0.6, p < 0.001) (Figure 5B), suggesting coordinated regulatory mechanisms among these genes.
Under abiotic stress conditions, RNA-seq profiling revealed tissue-specific responses. Salt (Na+) and drought (DS) treatments during seedling development induced significantly higher expression in roots than leaves (Figure 6A,B). SiSRS5 emerged as the most stress-responsive member, with mean TPM values reaching 2.99 ± 1.30 at 72 h (Na+) and 5.68 ± 2.22 (DS) at 48 h in the root, compared to leaf values of 0.73 ± 0.31 at 48 h (Na+) and 2.68 ± 0.68 at 24 h (DS). Notwithstanding its secondary ranking in stress responsiveness, the SiSRS3 gene exhibited low transcriptional activity, with TPM values hovering marginally above 1 throughout the experimental samples. Differential expression analysis (|Log2FC| ≥ 1, p.adj < 0.05) identified significant drought-induced downregulation of SiSRS4 (24 h: Log2FC = −1.47, p.adj = 0.032; 48 h: Log2FC = −1.62, p.adj = 0.011) and SiSRS5 (48 h: Log2FC = −1.79, p.adj = 6.50 × 10⁻⁴; 72 h: Log2FC = −1.65, p.adj = 0.002) in roots (Supplementary Table S6). Salt stress triggered the progressive suppression of SiSRS5 in both leaves (48 h: Log2FC = −3.01, p.adj = 2.22 × 10⁻⁷) and roots (72 h: Log2FC = −1.87, p.adj = 0.0008) (Supplementary Table S6). The SiSRS3 gene showed sustained upregulation in roots starting from 6 h of the stress treatment (6 h: Log2FC = 2.89, p.adj = 5.81 × 10⁻⁵; 12 h: 1.53, p.adj = 0.043; 24 h: 1.61, p.adj = 0.033; 48 h: 2.04, p.adj = 0.0046; 72 h: 1.87, p.adj = 0.0084). qRT-PCR validation also confirmed the trends of the SiSRS5 gene, demonstrating significant root-specific downregulation after 12 h of drought (2.8-fold decrease, p < 0.01) and leaf-specific suppression (3.1-fold decrease, p < 0.05) following 24 h of salinity stress, consistent with transcriptome predictions (Figure 6C,D). However, the upregulation of the SiSRS3 gene under salt treatment was not observed in the qRT-PCR results, which might be attributed to its lower transcription level.

3.8. Gene Co-Expression Network and PPI Analysis

Under drought stress conditions, co-expression network analysis revealed the distinct modular organization of SiSRS family members. Specifically, xm_SiSRS3, xm_SiSRS4, and xm_SiSRS6 were clustered within the turquoise module, while xm_SiSRS1 and xm_SiSRS5 were localized to the yellow module, with xm_SiSRS2 uniquely assigned to the magenta module (Supplementary Figure S6A). Within the yellow module, xm_SiSRS5 exhibited co-expression with key transcription factors including WRKY (Si3g20060), the homeodomain-leucine zipper (HD-ZIP, Si4g03500), and MYB gene (Si5g12210) (Figure 7A). The turquoise module featured robust associations between xm_SiSRS3 and transcription factors HD-ZIP (Si9g15590), three-amino acid loop extension (TALE, Si3g21560), and the basic leucine zipper (bZIP) family member ARF gene (Si5g01440) (Figure 7B). Furthermore, xm_SiSRS5 demonstrated strong correlations with genes functionally linked to auxin biosynthesis (YUCCA gene Si5g05800), cytoskeletal dynamics (Tubulin Beta, TUBB, Si5g04670), membrane transport (PIN, Si0g16260; TIP aquaporin, Si1g26570), redox regulation (peroxidase, POD, Si5g17460), floral organ primordia forming (polygalacturonase-inhibiting protein, PGIP, Si2g35890), and stress signaling (zinc finger protein SPOP gene, Si7g32960; IST, Si2g30010). Notably, xm_SiSRS3 displayed co-expression patterns with auxin biosynthesis genes (TAA1, Si5g12270; YUCCA family members, Si5g31170), microtubule components (Tubulin Alpha, TUBA, Si2g36450), and POD (Si1g03340, Si9g33960), suggesting its role in integrating growth regulation and oxidative stress responses under drought conditions. PGIP homologs (Si2g35890) displayed stress-responsive expression patterns overlapping with xm_SiSRS5.
Under salt stress, the SiSRS family members were partitioned into two distinct co-expression modules. xm_SiSRS2 was exclusively assigned to the grey60 module, whereas the remaining five members (xm_SiSRS1/3/4/5/6) co-localized within the turquoise module (Supplementary Figure S6B). In the turquoise module, xm_SiSRS5 formed co-expression hubs with cell cycle regulators (E2F/DP, Si5g27800) and developmental regulator genes (GRAS, Si2g37190) (Figure 7C), while xm_SiSRS3 showed extensive connectivity with transcription factors spanning multiple families as follows: MYB (Si2g39750, Si3g06860), HD-ZIP (Si9g15590), bZIP (Si5g35710), basic helix-loop-helix (bHLH, Si7g12250), and nuclear transcription factor Y subunit beta (NF-YB, Si5g44110) (Figure 7D). Functional annotations revealed co-expressed partners of xm_SiSRS3 included the stress-responsive 2OG-Fe(II) oxygenase gene (Si9g01560), while xm_SiSRS5 was linked to transporter genes (MATE, Si9g47700; PIN, Si1g29010), cell wall modification enzyme genes (endo-β-glucanase, Si7g16650), and ROS signaling components (RBOH, Si5g17090). Intriguingly, multiple xm_SiSRS members exhibited co-expression relationships with auxin biosynthesis genes (YUCCA, Si5g31170) and auxin-responsive loci (IAA, Si3g37160, Si5g12990), highlighting the conserved regulatory interfaces between SiSRS proteins and hormonal pathways under salt stress (Supplementary Figure S6).
PPI network analysis delineated the functional orthology relationships between Yu1_SiSRS members and A. thaliana proteins. Yu1_SiSRS1 and Yu1_SiSRS2 corresponded to SRS1, Yu1_SiSRS3 to SRS7, Yu1_SiSRS4/Yu1_SiSRS6 to SHI, and Yu1_SiSRS5 to LRP1. Network topology revealed the significant interactions between NGA3 (AT1G01030, NGATHA) and four Yu1_SiSRS members (Yu1_SiSRS1, Yu1_SiSRS2, Yu1_SiSRS4, Yu1_SiSRS6), whereas YUC4 (AT5G11320, YUCCA4) interacted with all members except Yu1_SiSRS5. The ubiquitin-related factor F6N18.11 (AT1G32730) emerged as a universal interactor across the SiSRS family. Notably, Yu1_SiSRS5 exhibited exclusive interaction with translation initiation factor EIF4B3 (AT4G38710), while Yu1_SiSRS3 uniquely associated with proteolytic regulator Q9LU10_ARATH (AT5G39830, DEG8), suggesting specialized functional diversification within the SiSRS family (Supplementary Figure S7).

4. Discussion

4.1. Pan-Genome Analysis as a Paradigm Shift in Gene Family Annotation

The emergence of pan-genomic approaches has fundamentally transformed population genomic studies by overcoming the limitations of single-reference genome frameworks. While foundational studies in model plants like rice [41] and A. thanalia [42] established the essential genomic resources, these individual-centric references inherently fail to capture species-wide genetic diversity. Recent advances in multi-sample whole-genome sequencing have enabled the systematic characterization of structural variations (SVs) and copy number variations (CNVs) across cereal crops such as wheat [43], maize [44,45], and sorghum (Sorghum bicolor) [46], revealing their critical associations with agronomic traits. This pan-genomic perspective not only facilitates gene family identification at population scales but also enables integrative analyses of transcriptional and structural diversity, as demonstrated in barley bHLH transcription factor family studies [47].
To address the growing need for standardized nomenclature in pan-genome studies, we propose a novel annotation system as follows: Accession_genefamilyN[.n]_xDy or xTy. This framework integrates the following three key elements: (1) germplasm identifier, (2) gene family classification, and (3) chromosomal localization of core/variable genes. By explicitly encoding spatial distribution and CNV patterns, this system enhances cross-study comparability while maintaining backward compatibility with traditional annotation methods.

4.2. Evolutionary Conservation and Functional Constraints of SiSRS Genes

Analysis of 112 foxtail millet accessions revealed six core SiSRS members with near-universal conservation. Notably, eight accessions exhibited reduced copy numbers (five members), a phenomenon guaranteed by high-coverage PacBio (91.1×) and Illumina (48.1×) sequencing that excludes technical artifacts [22]. The exceptional stability of SiSRS1—showing no CNVs across all analyzed genomes—suggests stringent purifying selection, potentially linked to its constitutive low expression and limited stress responsiveness. With the exception of a small subset of members, the polypeptide sequence-based phylogenetic relationships of SiSRS were further corroborated by the clustering analysis of their corresponding promoter sequences. Interestingly, the distribution of CREs within promoter regions directly confirmed sequence insertion or deletion events occurring during domestication in wild progenitors. A notable example was the transition from the ancestral pattern5_1 to the derived pattern5_3 observed in the promoter region of SiSRS5. These findings comprehensively demonstrate that pan-genomic data harbor more abundant variation information critical for precision breeding.

4.3. xm_SiSRS5 Is the Important SiSRS Member

The SRS family exerts pleiotropic effects on auxin signaling and exhibit functional redundancy [2]. The co-expression network analysis in the study revealed the coordinated expression between xm_SiSRS members and both IAA and YUCCA family genes, suggesting the evolutionary conservation of auxin regulatory modules. xm_SiSRS5, the member exhibiting the highest expression level, showed functional parallels with LRP1, supported by its co-expression with MYB (Si5g12210) and WRKY (Si3g20060) transcription factors. This interaction mirrors the direct targeting of PuLRP1 by PuMYB40 and PuWRKY75 during adventitious root formation in Populus ussuriensis [48], indicating potential cross-species conservation in root developmental regulation. The co-occurrence of xm_SiSRS5 with PIN genes suggests its involvement in auxin polar transport [49], a mechanism further corroborated by the ARF transcription factor gene (Si5g01440, linked to xm_SiSRS3) that modulates floral development through auxin-mediated pathways [50]. The PGIP gene (Si2g35890) also displayed expression patterns overlapping with xm_SiSRS5. The OsPGIP encoded by OsFOR1 regulates floral organ primordia through LRR-mediated protein interactions in rice [51]. This functional convergence implies that xm_SiSRS5 may integrate floral development with environmental adaptation, though our sampling limitation to 21-day seedlings precludes conclusions about expression peaks during heading stages.
Notably, xm_SiSRS5 is also the only member which is negatively regulated under drought and salt stress, validated by both RNA-seq and qRT-PCR analysis, simultaneously. The co-expressed RBOH (Si5g17090) and POD (Si5g17460), key enzymes in regulating ROS homeostasis, would support the observation further. RBOH generate superoxide radicals that are converted to H2O2 spontaneously or by SOD. The cell wall-bound Class III PODs also contribute to apoplastic H2O2 production. H2O2 plays an important role in regulating stomatal closure in response to drought [52] and modulating Na+/K+ homeostasis in salt stress condition [53,54]. This dual association would position xm_SiSRS5 as a potential modulator of ROS signaling cascades during abiotic stress. The effects of xm_SiSRS5 overexpression or knockout on host resistance, as well as the functional performance of other homologs in other accessions, still warrant further validation.

5. Conclusions

This study systematically analyzed the presence, CREs, and motif distribution of the SRS family in 112 foxtail millet samples. A novel nomenclature for pan-genome gene families was proposed based on these findings, effectively illustrating the diversity of copy numbers and chromosomal location shifts among gene family members. Further analysis indicates that xm_SiSRS5 exhibits the highest expression during the vegetative growth stage and has the strongest response to drought and salt stress. Future research should validate the specific molecular mechanisms of SiSRS5 and investigate its potential applications in enhancing crop stress resistance.

Supplementary Materials

The following supporting information can be downloaded at: https://www.mdpi.com/article/10.3390/plants14081257/s1, Figure S1. Cis-regulatory elements profiling in promoters of 678 SiSRS genes; Figure S2. Conserved motif (A) and domain (B) analysis of of 678 SiSRS proteins; Figure S3. Conservation analysis of the C-X2-C-X7-C-X4-C-X2-C2-X6-C motif of the SRS family in xm and Yu1; Figure S4. The multi-sequence alignment of SiSRS members of xm and Yu1. The Q-rich region, C-X2-C-X7-C-X4-C-X2-C2-X6-C and IXGH motifs were indicated by blue box; Figure S5. Alignment analysis of SiSRS promoters of xm and Yu1; Figure S6. Gene co-expression network of xm_SiSRS genes constructed in drought (A) and salt (B) stress; Figure S7. Protein-Protein Interaction network of xm_SiSRS proteins; Table S1. The distribution of SiSRS in the foxtail millet pan-genome; Table S2. BLASTP results of all SRS members in the pan-genome against the T2T genome; Table S3. Physicochemical property analysis of SRS proteins from xm and Yu1; Table S4. Ka/Ks analysis of SiSRS collinear gene pairs based on NG86 logic; Table S5. The component classification, names, and functions of cis-acting elements analysis; Table S6. Fold Changes of SiSRS genes under two stress conditions and two tissue types.

Author Contributions

Conceptualization, R.L., X.L. and J.G.; Methodology, R.L. and J.G.; Software, R.L.; Validation, R.L., C.L., Q.Z., X.G. and X.C.; Formal analysis, R.L., C.L. and Q.Z.; Investigation, R.L., C.L. and Q.Z.; Resources, X.L. and J.G.; Data curation, R.L.; Writing—original draft, R.L.; Writing —review & editing, R.L., X.W., X.L. and J.G.; Visualization, R.L.; Supervision, X.W., X.L. and J.G.; Funding acquisition, X.L. and J.G. All authors have read and agreed to the published version of the manuscript.

Funding

This research was funded by the National Key R&D Program of China (Grant No. 2023YFD1200700/2023YFD1200701, 2023YFD1202705/2023YFD120270502), the Joint Funds of the National Natural Science Foundation of China (Grant No. U22A20445), the Central Government’s Guidance Fund for Local Science and Technology Development (Grant No. YDZJSX20231B007), and the Basic Research Program of Shanxi Province (Grant No. 20210302123383, 202303021221097).

Institutional Review Board Statement

The manuscript has been reviewed and approved by all authors and has not been submitted elsewhere for consideration.

Informed Consent Statement

The code used for the analysis in this study is fully open and available on GitHub (https://github.com/RuimiaoLi/Pan_SRS, accessed on 14 July 2024).

Data Availability Statement

Data are contained within the article and Supplementary Materials.

Conflicts of Interest

The authors declare that they have no competing interests relevant to the content of this article.

References

  1. Fridborg, I.; Kuusk, S.; Moritz, T.; Sundberg, E. The Arabidopsis dwarf mutant shi exhibits reduced gibberellin responses conferred by overexpression of a new putative zinc finger protein. Plant Cell 1999, 11, 1019–1031. [Google Scholar] [CrossRef] [PubMed]
  2. Kuusk, S.; Sohlberg, J.J.; Magnus Eklund, D.; Sundberg, E. Functionally redundant SHI family genes regulate Arabidopsis gynoecium development in a dose-dependent manner. Plant J. 2006, 47, 99–111. [Google Scholar] [CrossRef] [PubMed]
  3. He, B.; Shi, P.; Lv, Y.; Gao, Z.; Chen, G. Gene coexpression network analysis reveals the role of SRS genes in senescence leaf of maize (Zea mays L.). J. Genet. 2020, 99, 3. [Google Scholar] [CrossRef]
  4. Yang, J.; Xu, P.; Yu, D. Genome-wide identification and characterization of the SHI-related sequence gene family in rice. Evol. Bioinform. 2020, 16, 1176934320941495. [Google Scholar] [CrossRef] [PubMed]
  5. Youssef, H.M.; Eggert, K.; Koppolu, R.; Alqudah, A.M.; Poursarebani, N.; Fazeli, A.; Sakuma, S.; Tagiri, A.; Rutten, T.; Govind, G.; et al. VRS2 regulates hormone-mediated inflorescence patterning in barley. Nat. Genet. 2017, 49, 157–161. [Google Scholar] [CrossRef]
  6. Eklund, D.M.; Staldal, V.; Valsecchi, I.; Cierlik, I.; Eriksson, C.; Hiratsu, K.; Ohme-Takagi, M.; Sundstrom, J.F.; Thelander, M.; Ezcurra, I.; et al. The Arabidopsis thaliana STYLISH1 protein acts as a transcriptional activator regulating auxin biosynthesis. Plant Cell 2010, 22, 349–363. [Google Scholar] [CrossRef]
  7. Jin, J.; He, K.; Tang, X.; Li, Z.; Lv, L.; Zhao, Y.; Luo, J.; Gao, G. An Arabidopsis transcriptional regulatory map reveals distinct functional and evolutionary features of novel transcription factors. Mol. Biol. Evol. 2015, 32, 1767–1773. [Google Scholar] [CrossRef]
  8. Sohlberg, J.J.; Myrenas, M.; Kuusk, S.; Lagercrantz, U.; Kowalczyk, M.; Sandberg, G.; Sundberg, E. STY1 regulates auxin homeostasis and affects apical-basal patterning of the Arabidopsis gynoecium. Plant J. 2006, 47, 112–123. [Google Scholar] [CrossRef]
  9. Smith, D.L.; Fedoroff, N.V. LRP1, a Gene Expressed in Lateral and Adventitious Root Primordia of Arabidopsis. Plant Cell 1995, 7, 735–745. [Google Scholar]
  10. Singh, S.; Yadav, S.; Singh, A.; Mahima, M.; Singh, A.; Gautam, V.; Sarkar, A.K. Auxin signaling modulates LATERAL ROOT PRIMORDIUM1 (LRP1) expression during lateral root development in Arabidopsis. Plant J. 2020, 101, 87–100. [Google Scholar] [CrossRef]
  11. Zhang, Y.; von Behrens, I.; Zimmermann, R.; Ludwig, Y.; Hey, S.; Hochholdinger, F. LATERAL ROOT PRIMORDIA 1 of maize acts as a transcriptional activator in auxin signalling downstream of the Aux/IAA gene rootless with undetectable meristem 1. J. Exp. Bot. 2015, 66, 3855–3863. [Google Scholar] [CrossRef] [PubMed]
  12. Yuan, T.-T.; Xu, H.-H.; Zhang, Q.; Zhang, L.-Y.; Lu, Y.-T. The COP1 Target SHI-RELATED SEQUENCE5 Directly Activates Photomorphogenesis-Promoting Genes. Plant Cell 2018, 30, 2368–2382. [Google Scholar] [CrossRef] [PubMed]
  13. Yuan, T.-T.; Xu, H.-H.; Li, J.; Lu, Y.-T. Auxin abolishes SHI-RELATED SEQUENCE5-mediated inhibition of lateral root development in Arabidopsis. New Phytol. 2020, 225, 297–309. [Google Scholar] [CrossRef] [PubMed]
  14. Duan, E.; Wang, Y.; Li, X.; Lin, Q.; Zhang, T.; Wang, Y.; Zhou, C.; Zhang, H.; Jiang, L.; Wang, J.; et al. OsSHI1 Regulates Plant Architecture Through Modulating the Transcriptional Activity of IPA1 in Rice. Plant Cell 2019, 31, 1026–1042. [Google Scholar] [CrossRef]
  15. Zhao, S.P.; Song, X.Y.; Guo, L.L.; Zhang, X.Z.; Zheng, W.J. Genome-Wide Analysis of the Shi-Related Sequence Family and Functional Identification of GmSRS18 Involving in Drought and Salt Stresses in Soybean. Int. J. Mol. Sci. 2020, 21, 1810. [Google Scholar] [CrossRef]
  16. Sun, C.; Yu, L.; Zhang, S.; Gu, Q.; Wang, M. Genome-wide characterization of the SHORT INTER-NODES/STYLISH and Shi-Related Sequence family in Gossypium hirsutum and functional identification of GhSRS21 under salt stress. Front. Plant Sci. 2022, 13, 1078083. [Google Scholar] [CrossRef]
  17. Lu, W.; Wang, Y.; Shi, Y.; Liang, Q.; Lu, X.; Su, D.; Xu, X.; Pirrello, J.; Gao, Y.; Huang, B.; et al. Identification of SRS transcription factor family in Solanum lycopersicum, and functional characterization of their responses to hormones and abiotic stresses. BMC Plant Biol. 2023, 23, 495. [Google Scholar] [CrossRef]
  18. Li, W.; Liu, J.; Zhang, H.; Liu, Z.; Wang, Y.; Xing, L.; He, Q.; Du, H. Plant pan-genomics: Recent advances, new challenges, and roads ahead. J. Genet. Genom. 2022, 49, 833–846. [Google Scholar] [CrossRef]
  19. Plissonneau, C.; Hartmann, F.E.; Croll, D. Pangenome analyses of the wheat pathogen Zymoseptoria tritici reveal the structural basis of a highly plastic eukaryotic genome. BMC Biol. 2018, 16, 5. [Google Scholar] [CrossRef]
  20. Li, X.; Hou, S.; Feng, M.; Xia, R.; Li, J.; Tang, S.; Han, Y.; Gao, J.; Wang, X. MDSi: Multi-omics Database for Setaria italica. BMC Plant Biol. 2023, 23, 223. [Google Scholar] [CrossRef]
  21. He, Q.; Wang, C.; He, Q.; Zhang, J.; Liang, H.; Lu, Z.; Xie, K.; Tang, S.; Zhou, Y.; Liu, B.; et al. A complete reference genome assembly for foxtail millet and Setaria-db, a comprehensive database for Setaria. Mol. Plant 2024, 17, 219–222. [Google Scholar] [CrossRef] [PubMed]
  22. He, Q.; Tang, S.; Zhi, H.; Chen, J.; Zhang, J.; Liang, H.; Alam, O.; Li, H.; Zhang, H.; Xing, L.; et al. A graph-based genome and pan-genome variation of the model plant Setaria. Nat. Genet. 2023, 55, 1232–1242. [Google Scholar] [CrossRef]
  23. Finn, R.D.; Clements, J.; Eddy, S.R. HMMER web server: Interactive sequence similarity searching. Nucleic Acids Res. 2011, 39, W29–W37. [Google Scholar] [CrossRef] [PubMed]
  24. Katoh, K.; Standley, D.M. MAFFT multiple sequence alignment software version 7: Improvements in performance and usability. Mol. Biol. Evol. 2013, 30, 772–780. [Google Scholar] [CrossRef]
  25. Minh, B.Q.; Schmidt, H.A.; Chernomor, O.; Schrempf, D.; Woodhams, M.D.; von Haeseler, A.; Lanfear, R. IQ-TREE 2: New Models and Efficient Methods for Phylogenetic Inference in the Genomic Era. Mol. Biol. Evol. 2020, 37, 1530–1534. [Google Scholar] [CrossRef] [PubMed]
  26. Hoang, D.T.; Chernomor, O.; von Haeseler, A.; Minh, B.Q.; Vinh, L.S. UFBoot2: Improving the Ultrafast Bootstrap Approximation. Mol. Biol. Evol. 2018, 35, 518–522. [Google Scholar] [CrossRef]
  27. Anisimova, M.; Gil, M.; Dufayard, J.F.; Dessimoz, C.; Gascuel, O. Survey of branch support methods demonstrates accuracy, power, and robustness of fast likelihood-based approximation schemes. Syst. Biol. 2011, 60, 685–699. [Google Scholar] [CrossRef]
  28. Hao, Z.; Lv, D.; Ge, Y.; Shi, J.; Weijers, D.; Yu, G.; Chen, J. RIdeogram: Drawing SVG graphics to visualize and map genome-wide data on the idiograms. PeerJ Comput. Sci. 2020, 6, e251. [Google Scholar] [CrossRef]
  29. Price, M.N.; Dehal, P.S.; Arkin, A.P. FastTree 2–approximately maximum-likelihood trees for large alignments. PLoS ONE 2010, 5, e9490. [Google Scholar] [CrossRef]
  30. Lescot, M.; Dehais, P.; Thijs, G.; Marchal, K.; Moreau, Y.; Van de Peer, Y.; Rouze, P.; Rombauts, S. PlantCARE, a database of plant cis-acting regulatory elements and a portal to tools for in silico analysis of promoter sequences. Nucleic Acids Res. 2002, 30, 325–327. [Google Scholar] [CrossRef]
  31. Chen, C.; Chen, H.; Zhang, Y.; Thomas, H.R.; Frank, M.H.; He, Y.; Xia, R. TBtools: An Integrative Toolkit Developed for Interactive Analyses of Big Biological Data. Mol. Plant 2020, 13, 1194–1202. [Google Scholar] [CrossRef] [PubMed]
  32. Gu, Z. Complex heatmap visualization. Imeta 2022, 1, e43. [Google Scholar] [CrossRef]
  33. Bailey, T.L.; Boden, M.; Buske, F.A.; Frith, M.; Grant, C.E.; Clementi, L.; Ren, J.; Li, W.W.; Noble, W.S. MEME SUITE: Tools for motif discovery and searching. Nucleic Acids Res. 2009, 37, W202–W208. [Google Scholar] [CrossRef] [PubMed]
  34. Yang, M.; Derbyshire, M.K.; Yamashita, R.A.; Marchler-Bauer, A. NCBI’s conserved domain database and tools for protein domain analysis. Curr. Protoc. Bioinform. 2020, 69, e90. [Google Scholar] [CrossRef] [PubMed]
  35. Wang, Y.; Tang, H.; Debarry, J.D.; Tan, X.; Li, J.; Wang, X.; Lee, T.H.; Jin, H.; Marler, B.; Guo, H.; et al. MCScanX: A toolkit for detection and evolutionary analysis of gene synteny and collinearity. Nucleic Acids Res. 2012, 40, 49. [Google Scholar] [CrossRef]
  36. Zhang, Z. KaKs_Calculator 3.0: Calculating Selective Pressure on Coding and Non-coding Sequences. Genom. Proteom. Bioinform. 2022, 20, 536–540. [Google Scholar] [CrossRef]
  37. Kolde, R.; Kolde, M.R. Package ‘pheatmap’. R Package, Version 1. 2018. Available online: https://cran.r-project.org/web/packages/pheatmap/index.html (accessed on 1 March 2025).
  38. Langfelder, P.; Horvath, S. WGCNA: An R package for weighted correlation network analysis. BMC Bioinform. 2008, 9, 559. [Google Scholar] [CrossRef]
  39. Shannon, P.; Markiel, A.; Ozier, O.; Baliga, N.S.; Wang, J.T.; Ramage, D.; Amin, N.; Schwikowski, B.; Ideker, T. Cytoscape: A software environment for integrated models of biomolecular interaction networks. Genome Res. 2003, 13, 2498–2504. [Google Scholar] [CrossRef]
  40. Szklarczyk, D.; Kirsch, R.; Koutrouli, M.; Nastou, K.; Mehryary, F.; Hachilif, R.; Gable, A.L.; Fang, T.; Doncheva, N.T.; Pyysalo, S.; et al. The STRING database in 2023: Protein-protein association networks and functional enrichment analyses for any sequenced genome of interest. Nucleic Acids Res. 2023, 51, D638–D646. [Google Scholar] [CrossRef]
  41. Shang, L.; He, W.; Wang, T.; Yang, Y.; Xu, Q.; Zhao, X.; Yang, L.; Zhang, H.; Li, X.; Lv, Y.; et al. A complete assembly of the rice Nipponbare reference genome. Mol. Plant 2023, 16, 1232–1236. [Google Scholar] [CrossRef]
  42. Hou, X.; Wang, D.; Cheng, Z.; Wang, Y.; Jiao, Y. A near-complete assembly of an Arabidopsis thaliana genome. Mol. Plant 2022, 15, 1247–1250. [Google Scholar] [CrossRef] [PubMed]
  43. Wang, M.; Cheng, J.; Wu, J.; Chen, J.; Liu, D.; Wang, C.; Ma, S.; Guo, W.; Li, G.; Di, D.; et al. Variation in TaSPL6-D confers salinity tolerance in bread wheat by activating TaHKT1;5-D while preserving yield-related traits. Nat. Genet. 2024, 56, 1257–1269. [Google Scholar] [CrossRef]
  44. Gui, S.; Wei, W.; Jiang, C.; Luo, J.; Chen, L.; Wu, S.; Li, W.; Wang, Y.; Li, S.; Yang, N.; et al. A pan-Zea genome map for enhancing maize improvement. Genome Biol. 2022, 23, 178. [Google Scholar] [CrossRef] [PubMed]
  45. Wang, B.; Hou, M.; Shi, J.; Ku, L.; Song, W.; Li, C.; Ning, Q.; Li, X.; Li, C.; Zhao, B.; et al. De novo genome assembly and analyses of 12 founder inbred lines provide insights into maize heterosis. Nat. Genet. 2023, 55, 312–323. [Google Scholar] [CrossRef]
  46. Tao, Y.; Luo, H.; Xu, J.; Cruickshank, A.; Zhao, X.; Teng, F.; Hathorn, A.; Wu, X.; Liu, Y.; Shatte, T.; et al. Extensive variation within the pan-genome of cultivated and wild sorghum. Nat. Plants 2021, 7, 766–773. [Google Scholar] [CrossRef]
  47. Tong, C.; Jia, Y.; Hu, H.; Zeng, Z.; Chapman, B.; Li, C. Pangenome and pantranscriptome as the new reference for gene-family characterization: A case study of basic helix-loop-helix (bHLH) genes in barley. Plant Commun. 2025, 6, 101190. [Google Scholar] [CrossRef] [PubMed]
  48. Wang, H.; Pak, S.; Yang, J.; Wu, Y.; Li, W.; Feng, H.; Yang, J.; Wei, H.; Li, C. Two high hierarchical regulators, PuMYB40 and PuWRKY75, control the low phosphorus driven adventitious root formation in Populus ussuriensis. Plant Biotechnol. J. 2022, 20, 1561–1577. [Google Scholar] [CrossRef]
  49. Su, N.; Zhu, A.; Tao, X.; Ding, Z.J.; Chang, S.; Ye, F.; Zhang, Y.; Zhao, C.; Chen, Q.; Wang, J.; et al. Structures and mechanisms of the Arabidopsis auxin transporter PIN3. Nature 2022, 609, 616–621. [Google Scholar] [CrossRef]
  50. Kim, S.; Koh, J.; Ma, H.; Hu, Y.; Endress, P.K.; Hauser, B.A.; Buzgo, M.; Soltis, P.S.; Soltis, D.E. Sequence and Expression Studies of A-, B-, and E-Class MADS-Box Homologues inEupomatia(Eupomatiaceae): Support for the Bracteate Origin of the Calyptra. Int. J. Plant Sci. 2005, 166, 185–198. [Google Scholar] [CrossRef]
  51. Jang, S.; Lee, B.; Kim, C.; Kim, S.J.; Yim, J.; Han, J.J.; Lee, S.; Kim, S.R.; An, G. The OsFOR1 gene encodes a polygalacturonase-inhibiting protein (PGIP) that regulates floral organ number in rice. Plant Mol. Biol. 2003, 53, 357–369. [Google Scholar] [CrossRef]
  52. Rodrigues, O.; Shan, L. Stomata in a state of emergency: H2O2 is the target locked. Trends Plant Sci. 2022, 27, 274–286. [Google Scholar] [CrossRef] [PubMed]
  53. Miller, G.; Schlauch, K.; Tam, R.; Cortes, D.; Torres, M.A.; Shulaev, V.; Dangl, J.L.; Mittler, R. The plant NADPH oxidase RBOHD mediates rapid systemic signaling in response to diverse stimuli. Sci. Signal. 2009, 2, ra45. [Google Scholar] [CrossRef] [PubMed]
  54. Ma, L.; Zhang, H.; Sun, L.; Jiao, Y.; Zhang, G.; Miao, C.; Hao, F. NADPH oxidase AtrbohD and AtrbohF function in ROS-dependent regulation of Na+/K+ homeostasis in Arabidopsis under salt stress. J. Exp. Bot. 2012, 63, 305–317. [Google Scholar] [CrossRef] [PubMed]
Figure 1. Identification and distribution analysis of SiSRS gene members in the 112 accessions. (A) Phylogenetic tree of pan-genome accession SiSRSs; (B) proportion of gene members from cultivated, landrace, or wild varieties in each of the six branches relative to the total number of genes in the corresponding branch; (C) SRS member count in each accession; (D) chromosomal location and the relative position of pan-genome SRS members. The bold numbers below each chromosome indicate the chromosome numbers.
Plants 14 01257 g001
Figure 2. Phylogenetic analysis of the SRS family of xm and Yu1.
Plants 14 01257 g002
Figure 3. Evolutionary analysis of SiSRS members. (A) Synteny analysis of SiSRS members among reference species; (B) Ka/Ks analysis of recursive Synteny; (C) internal synteny analysis of the Yu1_SiSRSs.
Plants 14 01257 g003
Figure 4. Cis-regulatory elements in SiSRS promoters of xm and Yu1. The light gray square indicates 0.
Plants 14 01257 g004
Figure 5. Transcription levels of xm_SiSRSs (A) and corresponding correlation analyses (B). *, p < 0.05; **, p < 0.01; ***, p < 0.001.
Plants 14 01257 g005
Figure 6. Transcription level analysis of xm_SiSRS genes under drought and salt stress. TPM variation in leaf and root tissues at different sampling times using RNA-seq analysis in (A) drought and (B) salt stress. The consistent analysis of xm_SiSRS5 expression by RNA-Seq and RT-qPCR analysis in (C) drought-treated roots and (D) salt-treated leaves. The different letters above bars indicate statistically significant differences (p < 0.05). One-way ANOVA, n = 3.
Plants 14 01257 g006
Figure 7. Gene co-expression network based on xm RNA-seq. The Orange circles represent SiSRSs; purple diamonds represent known TF-encoding genes, while cyan circles represent other genes. (A) Drought stress, xm_SiSRS5; (B) drought stress, xm_SiSRS3; (C) salt stress, xm_SiSRS5; and (D) salt stress, xm_SiSRS3.
Plants 14 01257 g007
Disclaimer/Publisher’s Note: The statements, opinions and data contained in all publications are solely those of the individual author(s) and contributor(s) and not of MDPI and/or the editor(s). MDPI and/or the editor(s) disclaim responsibility for any injury to people or property resulting from any ideas, methods, instructions or products referred to in the content.

