Brief Report

Divergent Mechanisms of Internode Elongation in Response to Far-Red in Two Rose Genotypes

1
Institut Agro, University Angers, INRAE, IRHS, SFR QUASAV, 49000 Angers, France
2
Instituto de Biologia Molecular y Celular de Plantas (IBMCP), CSIC-Universidad Politécnica de Valencia, 46022 Valencia, Spain
3
University Angers, SFR QUASAV, 49000 Angers, France
*
Author to whom correspondence should be addressed.
Plants 2025, 14(7), 1115; https://doi.org/10.3390/plants14071115
Submission received: 21 February 2025 / Revised: 24 March 2025 / Accepted: 28 March 2025 / Published: 3 April 2025
(This article belongs to the Section Horticultural Science and Ornamental Plants)

Abstract

The quality of potted ornamental plants depends on their architecture, which should be compact and branched. Among the techniques for controlling this architecture, LED lighting, by manipulating light quality, offers an effective means of regulating elongation and branching. In rose, the addition of far-red (FR) light stimulated branching but induced excessive stem elongation, i.e., internode elongation. However, some varieties remained insensitive to this effect, demonstrating phenotypic stability. This study investigated the underlying mechanisms of internode elongation in response to FR in two rose cultivars, ‘The Fairy’ (TF) and Knock Out® Radrazz (KO), selected for their respective architectural plasticity and stability to FR. In TF, exposure to FR induced elongation of internodes, driven by cell division, with an increase in gibberellin A4 (GA4) level and a reduction in defense hormones (salicylic acid and jasmonic acid; JA). In contrast, in KO, exposure to FR did not induce internode elongation but caused cell elongation. This effect was accompanied by a reduction in cell number, modulated by hormonal changes (particularly GA4 and JA) and the inhibition of Block of cell proliferation 1, thereby limiting cell division. A deeper understanding of the mechanisms underlying architectural stability might lead to developing strategies to produce compact, branched plants, regardless of environmental conditions.

1. Introduction

The quality of potted ornamental plants is primarily determined by their shape, which must be both compact and well branched [1,2]. This shape results from the spatial arrangement of various organs according to species-specific rules. This complex architecture, particularly in ornamental shrubs such as rose and camellia, depends on genetic and environmental factors [3,4,5]. While architectural characteristics, such as the number of branches, are moderate to highly heritable, others, such as stem length and inclination, are more influenced by the environment [6,7,8,9,10,11].
Ornamental potted plants are typically grown in a greenhouse during the winter to be sold in the spring. These growing conditions, characterized by a high planting density, promote plant etiolation, which refers to excessive stem elongation accompanied by reduced branching, thus deviating from the desired quality standard: obtaining a compact and branched plant. Etiolation results from the plant’s shade-avoidance response, triggered via a modification in the light spectrum, i.e., a decrease in the red (R; 600–700 nm)/far-red (FR; 700–800 nm) ratio and the amount of blue light (B; 400–500 nm), perceived by the plant through various photoreceptors [12,13].
To promote branching and limit stem elongation, horticulturists have traditionally employed techniques such as “pinching” and chemical growth regulators. However, due to their economic cost and harmful environmental impacts, alternatives based on environmental control have been developed, including water restriction [7,14] and mechanical stimulation [15,16]. More recently, with the advancement of light-emitting diode (LED) technology, another approach focusing on manipulating light quality has also been explored [17]. In greenhouse-grown poinsettia, the use of LED lighting-emitting R and B was shown to increase the R/FR ratio and the amount of B, thereby reducing stem elongation [18]. In rose, this effect was enhanced by an increased proportion of B [19]. The decrease in the R/FR ratio, through the addition of FR, on the other hand, stimulated branching in chrysanthemum and rose grown in a controlled environment [20,21,22]. However, in rose, this addition of FR led to plant etiolation, thus affecting their quality. This excessive stem elongation might result from an improvement in the plant’s photosynthetic capabilities, increasing its carbon status, which is essential for growth [22]. In other species, such as Arabidopsis, sunflower, and lisianthus, this has been attributed to hormonal changes, particularly an increase in gibberellin (GA) concentrations, especially the biologically active forms, gibberellin A1 (GA1) and A4 (GA4), as well as auxins, which are hormones known to stimulate cell division and elongation [23,24,25,26,27,28,29]. Jasmonic acid (JA), another hormone known to activate the plant’s defense mechanisms, is also thought to be involved. Indeed, in Arabidopsis mutants deficient in JA synthesis and signaling, excessive hypocotyl elongation was observed under a low R/FR ratio [30]. Moreover, GAs and JA act antagonistically to regulate growth. Under FR exposure, GAs inhibit JA signaling [31]. As a result, the plant might reallocate its carbon resources, initially intended for defense, toward elongation.
However, in rose, as in chrysanthemum, a variety-specific response to light quality was observed, with certain varieties showing no response to the addition of FR [21,22,32]. This lack of response, i.e., this architectural stability, was correlated with an increase in the abscisic acid (ABA) concentration in the leaves, which might inhibit the stimulating effect of FR on photosynthesis and, consequently, on the carbon status required for stem elongation [22]. A better understanding of the physiological and molecular mechanisms underlying this architectural stability might pave the way for a new approach to obtaining plants with desired branching patterns and compactness, regardless of environmental conditions.
Therefore, this study aimed to explore the mechanisms underlying this stability in stem elongation, i.e., internode length, a crucial process for controlling compactness, in rose using a multidisciplinary approach: histological, biochemical (hormone concentrations), and molecular (transcriptomic analysis by RNA-seq), focusing on two varieties, ‘The Fairy’ (TF) and Knock Out® Radrazz (KO), chosen respectively for their architectural plasticity and stability to FR.

2. Results

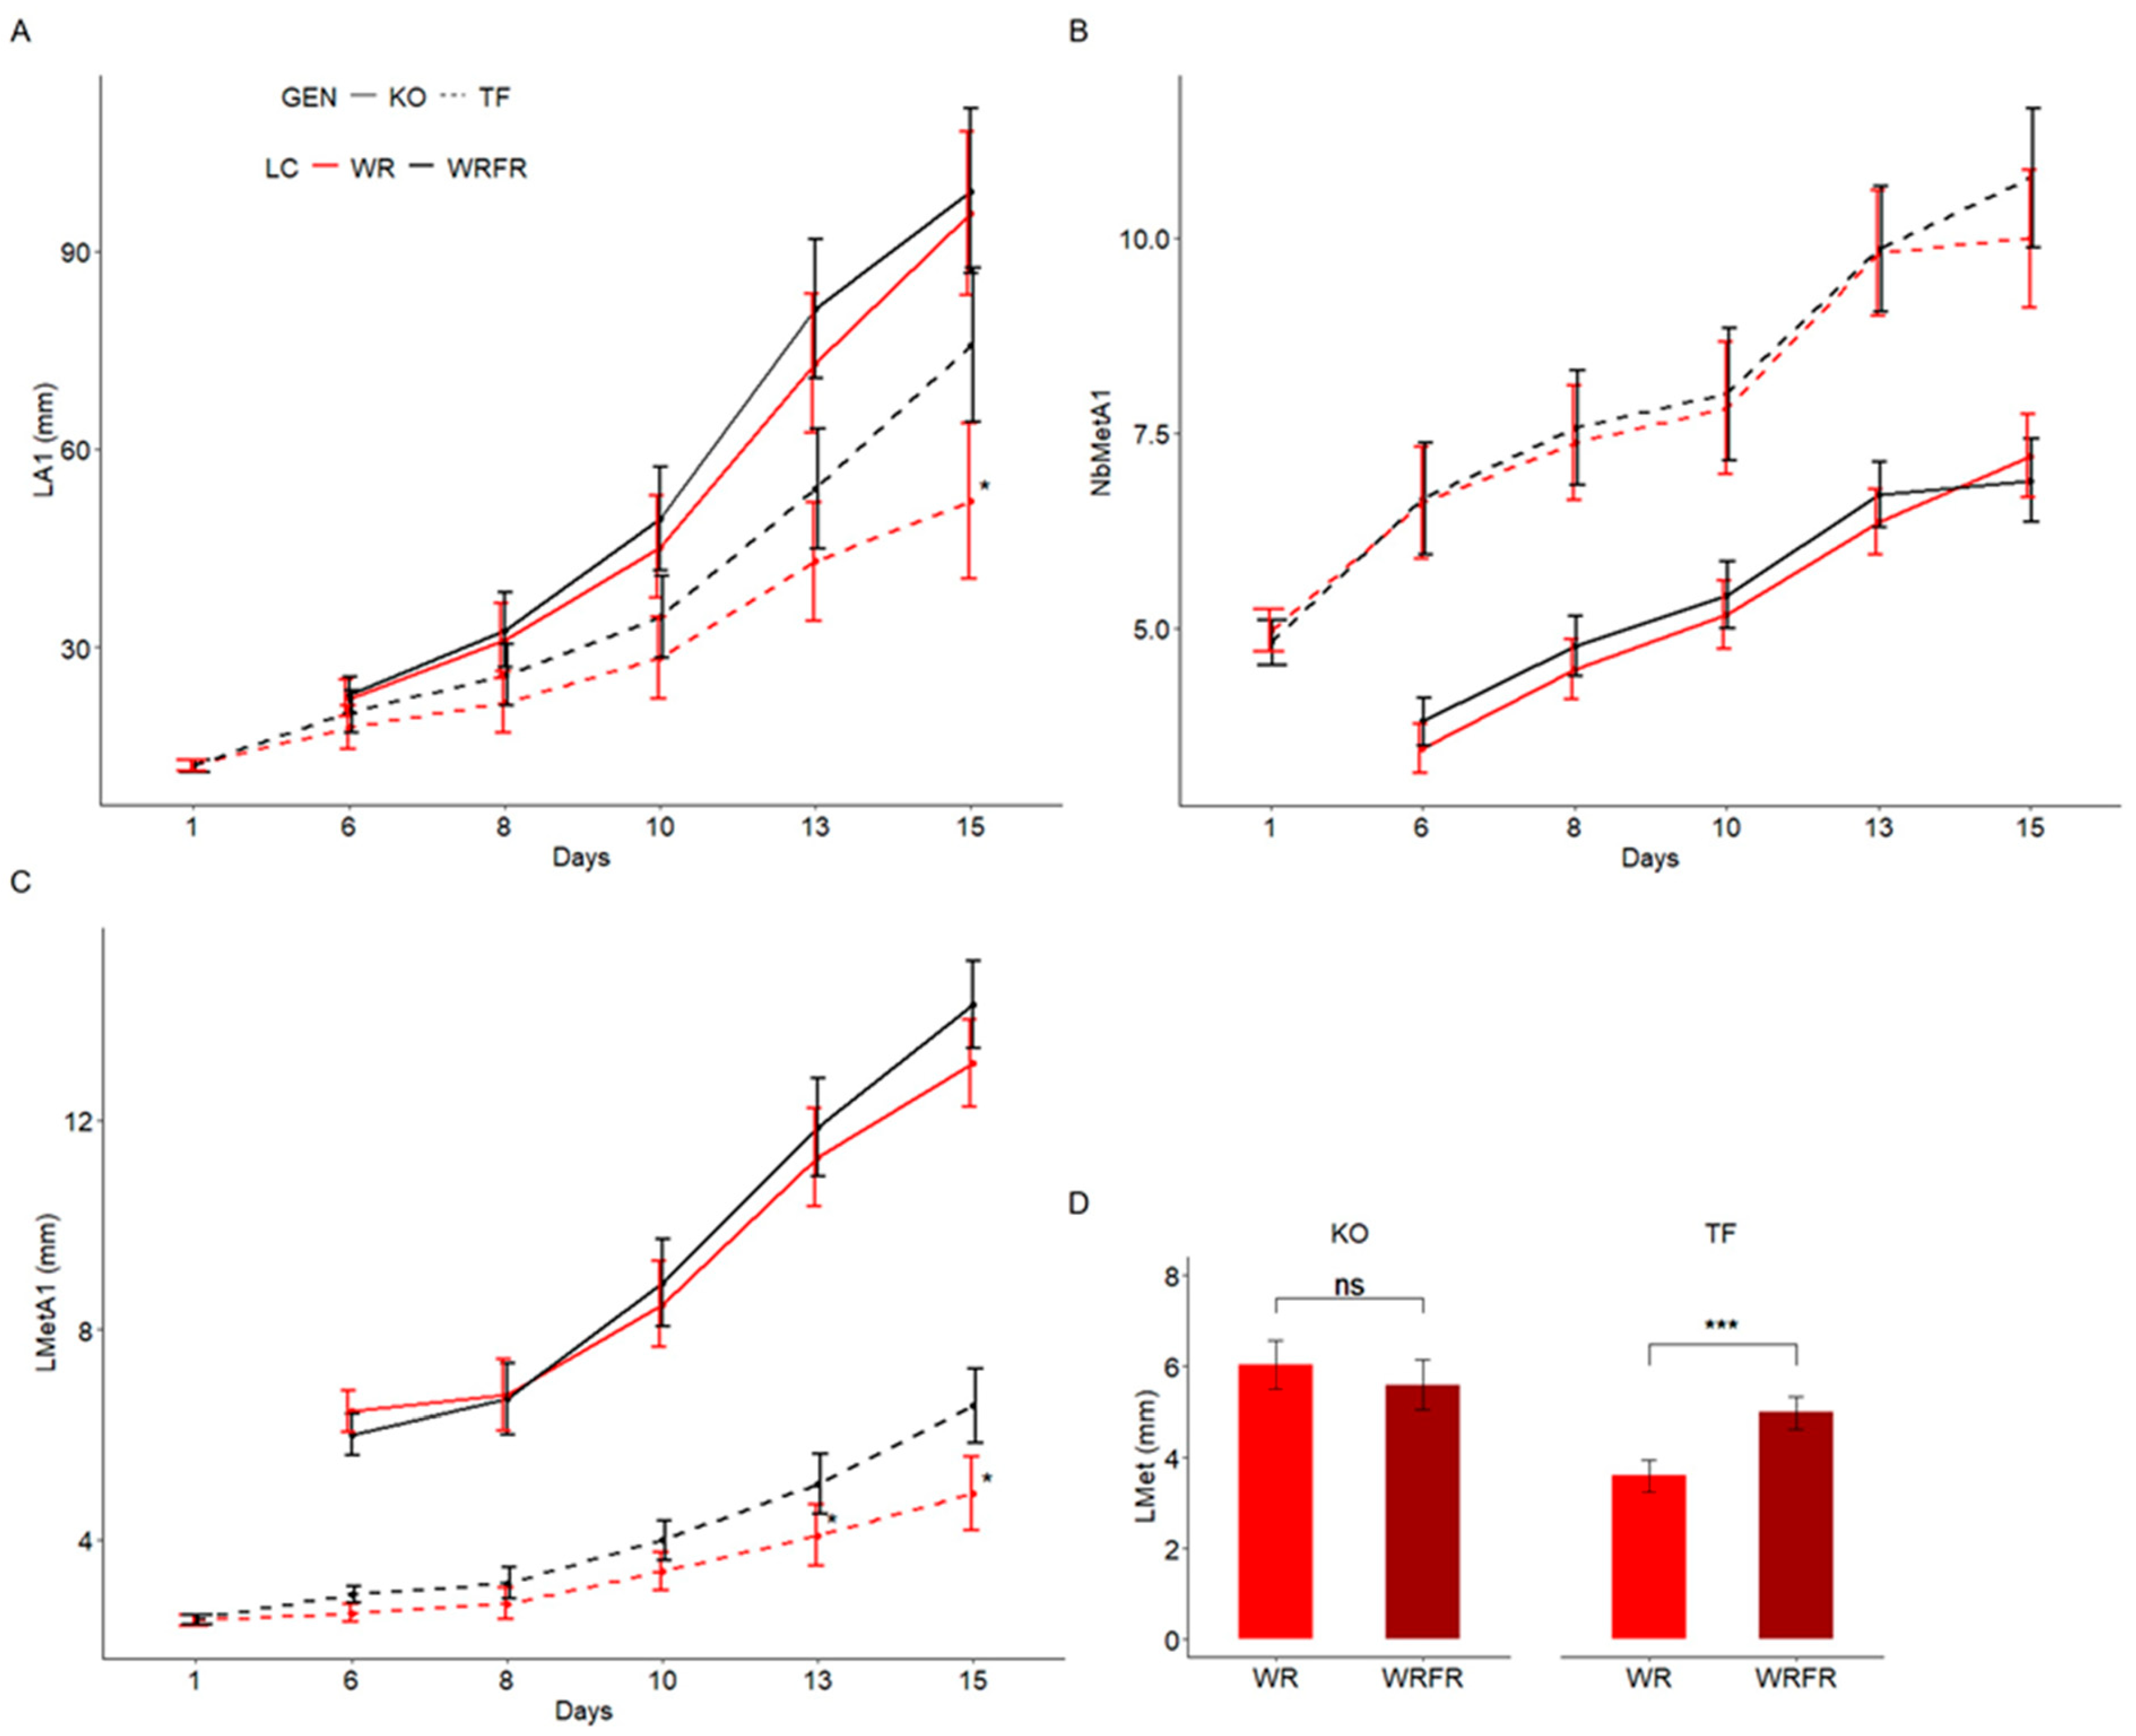
2.1. Effects of Far-Red (FR) on Internode Elongation in ‘The Fairy’ (TF) and Knock Out® Radrazz (KO)

As expected, in the presence of FR, TF exhibited etiolation, while KO remained unaffected. This etiolation effect was noticeable from (1) the 15th day of cultivation for the length of the order 1 axis (LA1), with a 45.3% increase (Figure 1A); and (2) from the 13th day of cultivation for the length of the metamer of the order 1 axis (LMetA1), with a 24.0% increase (Figure 1C). However, no effect was observed on the number of metamers of the order 1 axis (NbMetA1; Figure 1B). For biochemical and transcriptomic analyses, the internode located just below the apex was collected on the 13th day of cultivation. Under the effect of FR, its length increased by 38.2% in TF, whereas no difference was observed in KO (Figure 1D).
A histological analysis of longitudinal sections of the internodes was conducted to determine whether the internode elongation resulted from an increase in cell division, cell expansion, or a combination of both. In TF, no cell elongation was observed in response to FR (Table 1, Figure 2). Instead, internode elongation was solely driven by an increase in cell number (estimated at 34.7%; Table 1). In contrast, for KO, histological analysis revealed a 10.7% increase in cell length in response to FR (Table 1, Figure 2). However, this increase, coupled with a 16.6% decrease in cell number, resulted in the absence of internode elongation (Table 1).

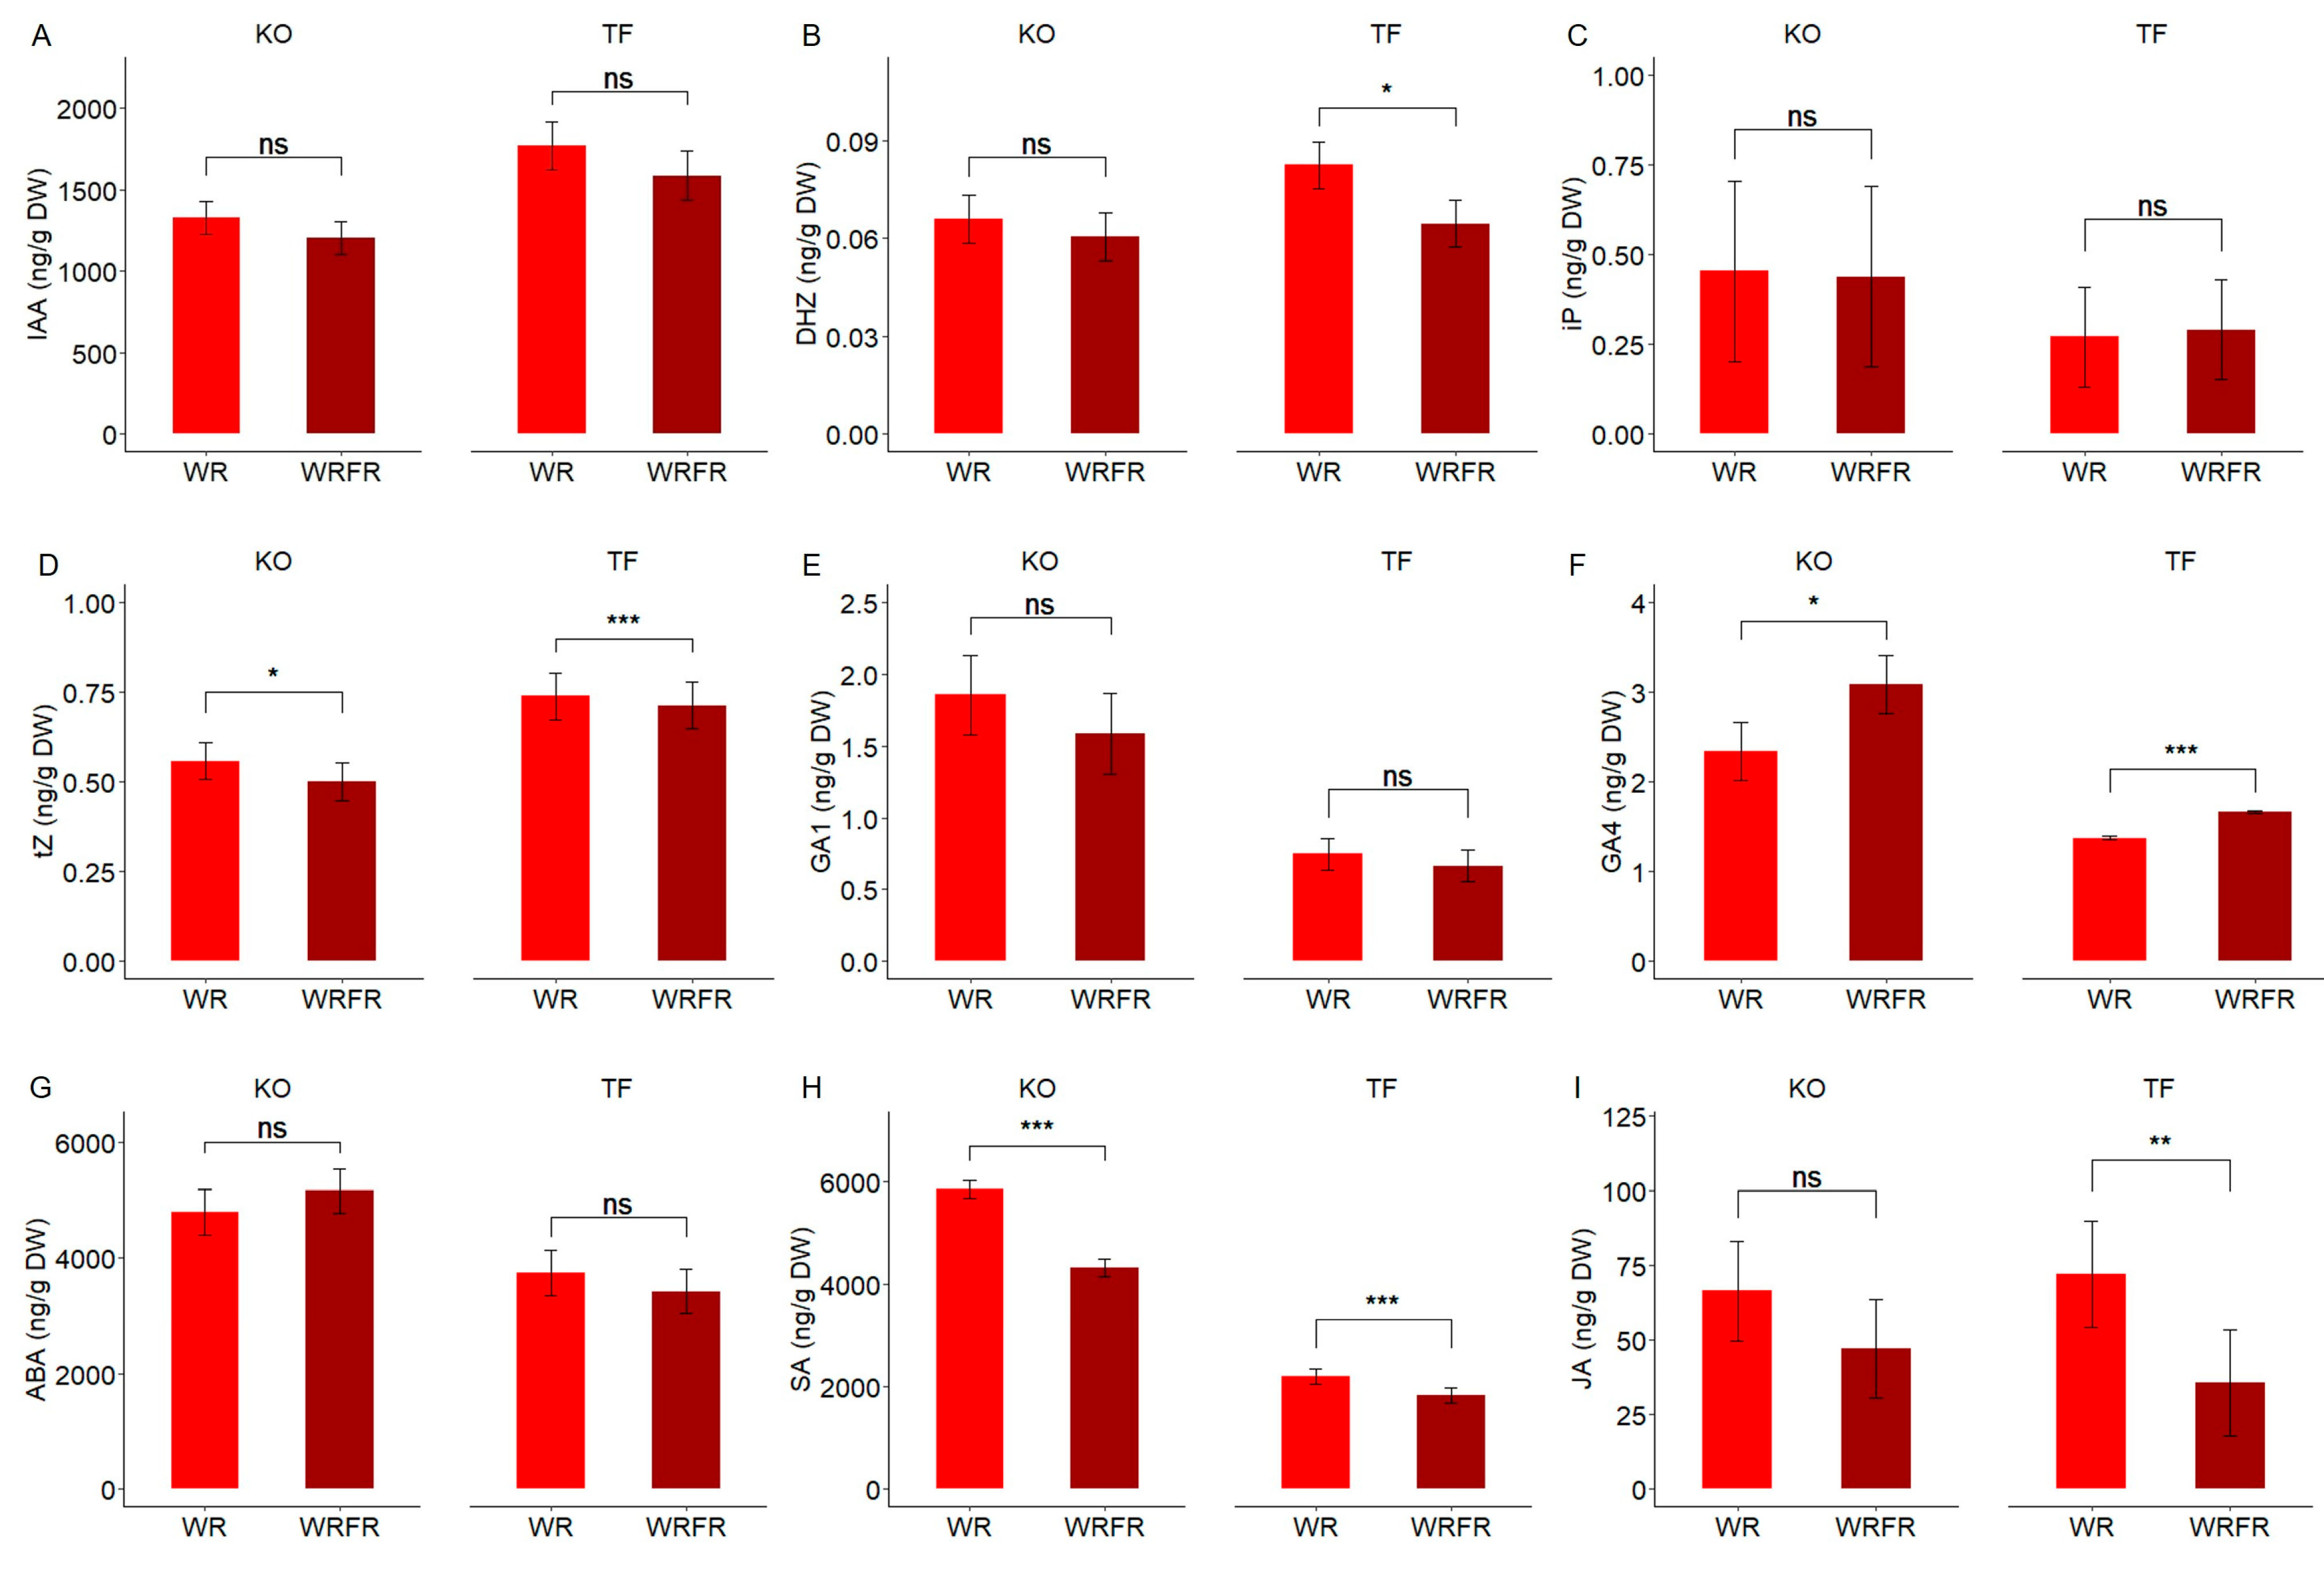
2.2. Hormonal Changes Associated with FR-Induced Internode Elongation in TF and KO

In TF, the elongation of internodes observed under the effect of FR was associated with an increase in gibberellin A4 concentration (GA4; +21.4%; Figure 3F) and a decrease in dihydrozeatin (DHZ) concentration (−21.8%; Figure 3B) in the internode. A slight reduction in the concentration of trans-zeatin (tZ) was also noted, although this was minimal (−3.4%; Figure 3D). Another group of hormones, salicylic acid (SA) and jasmonic acid (JA), was similarly affected. In response to FR, their concentration decreased by 16.4% and 50.6%, respectively (Figure 3H,I).
A similar trend was observed in KO, even though no internode elongation was noted under FR. The concentration of GA4 increased by 32.0% in the internode (Figure 3F), while concentrations of tZ and SA decreased by 10.4% and 26.2%, respectively (Figure 3D,H). A decrease in JA concentration was also observed (−28.9%, Figure 3I); however, this was not significant (Tukey test, p = 0.058).
For the other hormones, including indole-3-acetic acid (IAA), isopentenyladenine (iP), GA1, and abscisic acid (ABA), no effect of FR was observed on their concentration in the internode, regardless of the variety (Figure 3A,C,E,G).

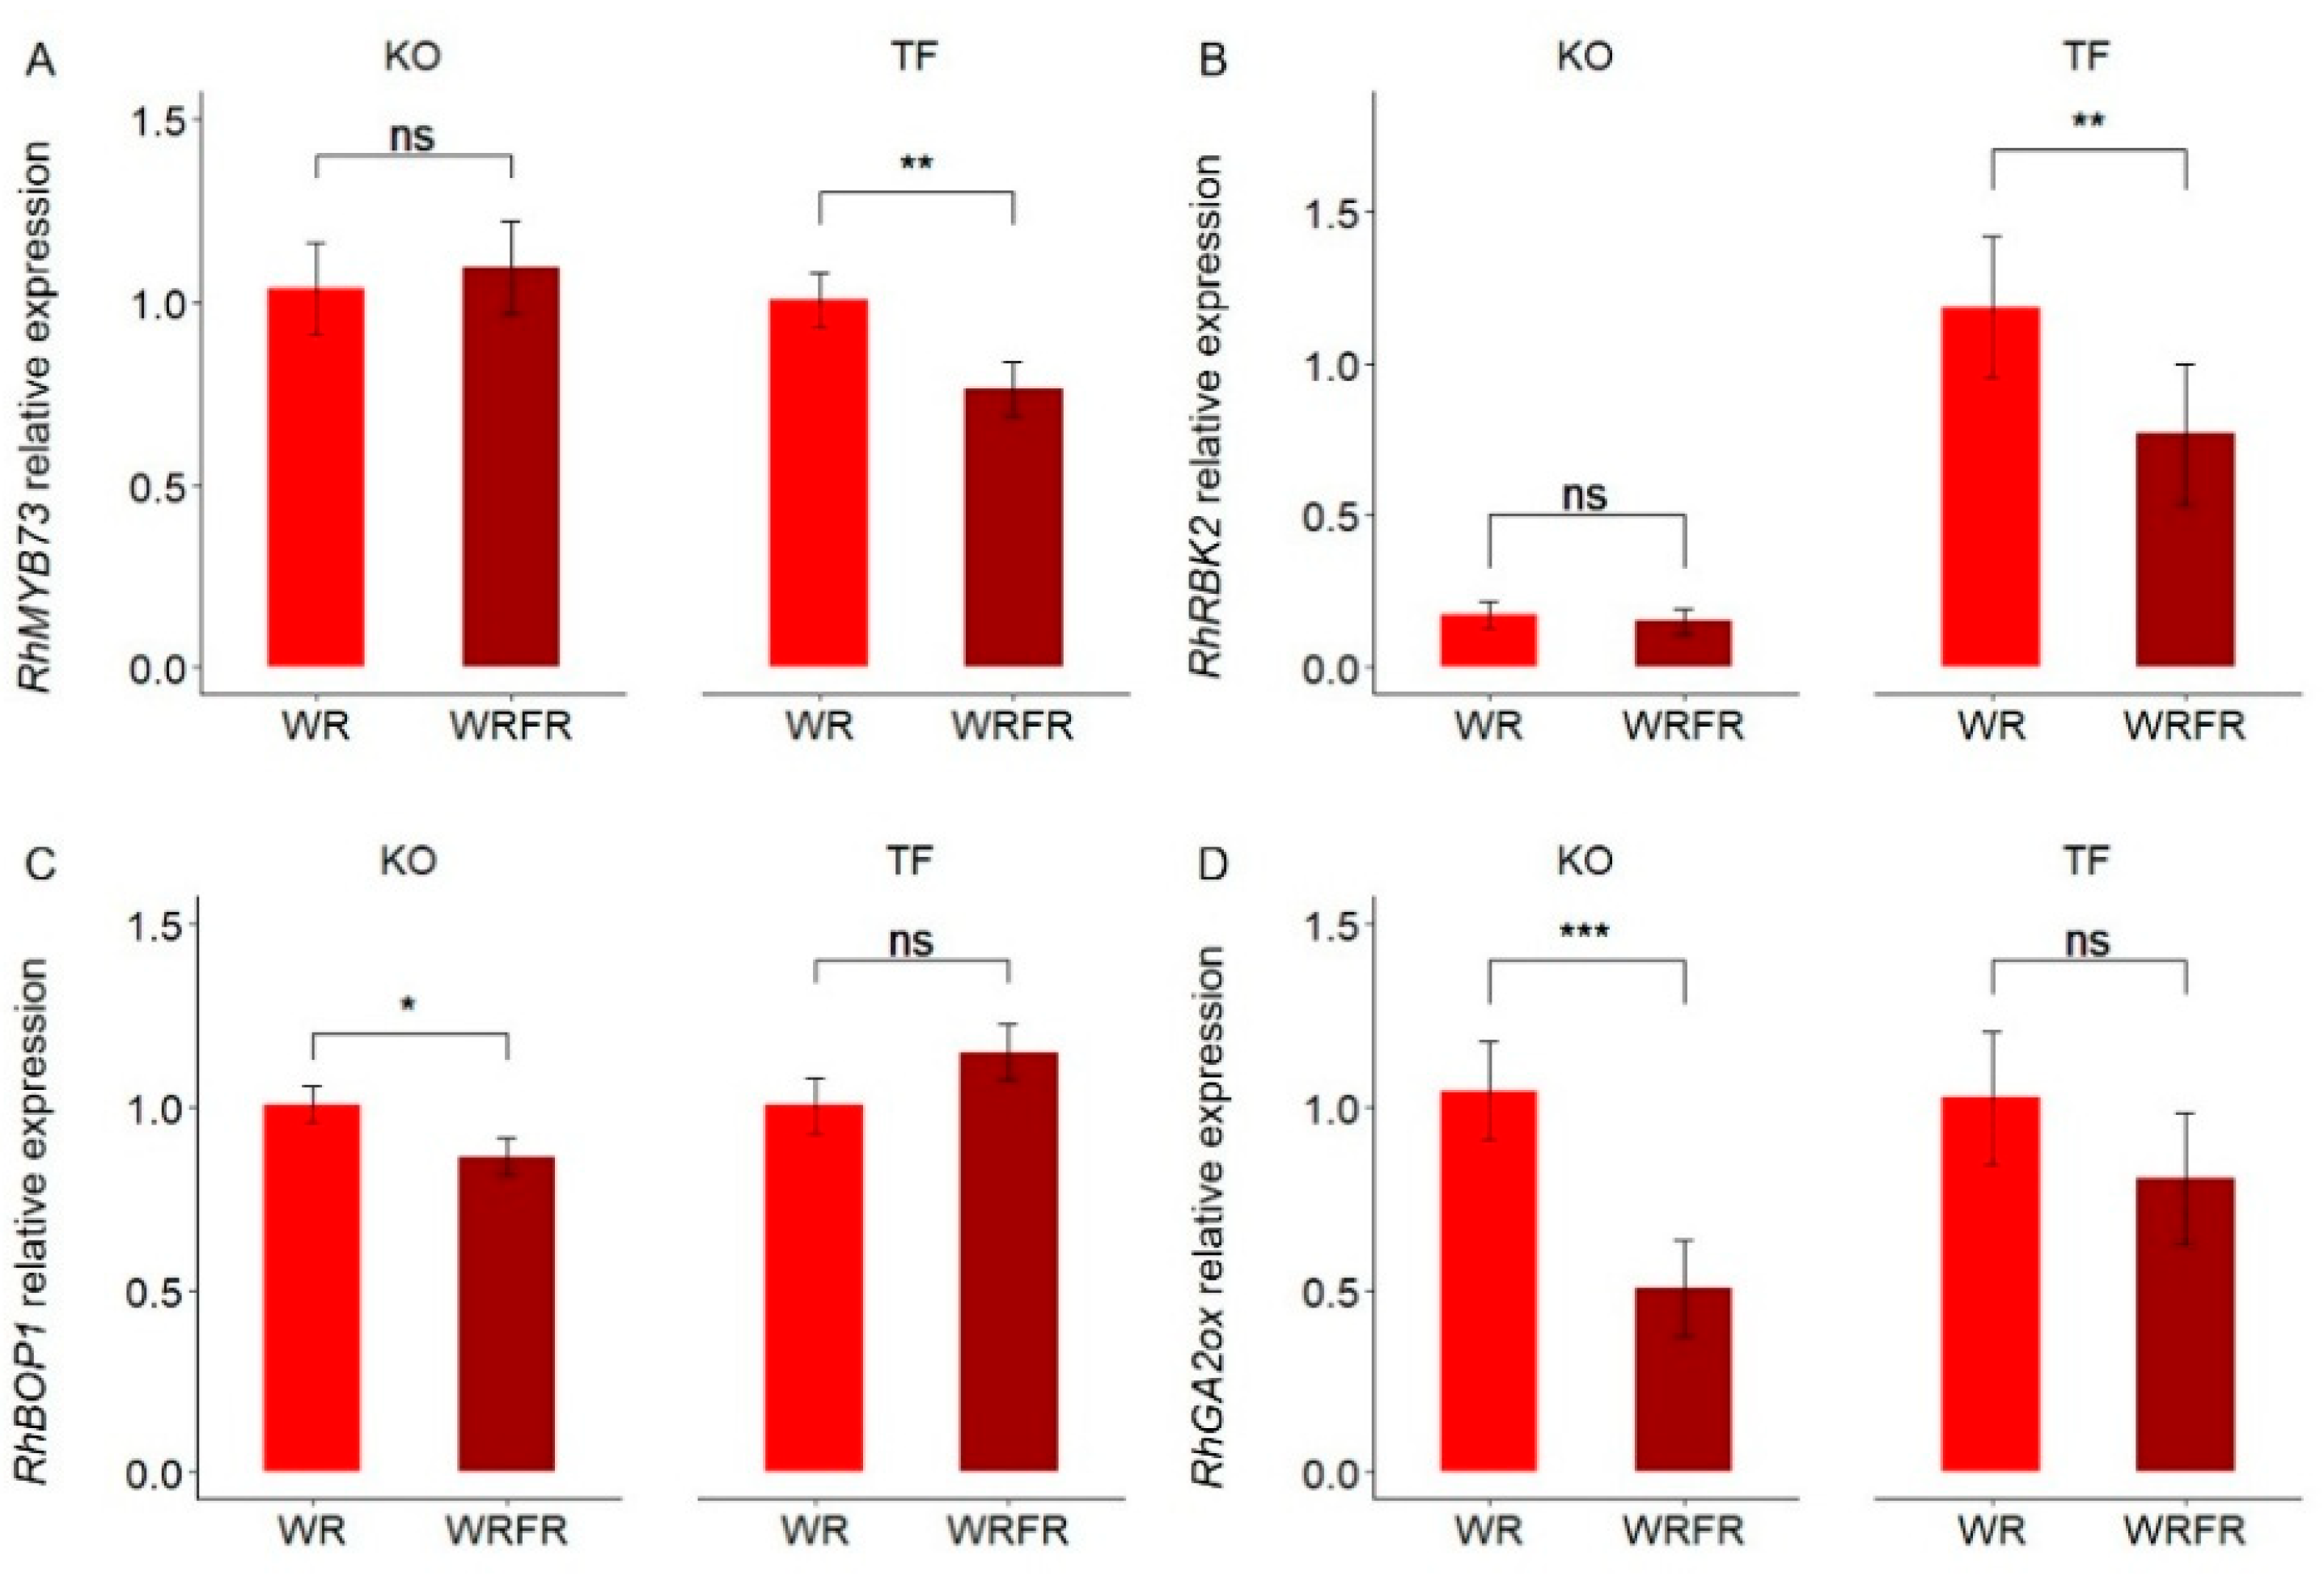
2.3. Gene Expression Changes in the Internode in Response to FR in TF and KO
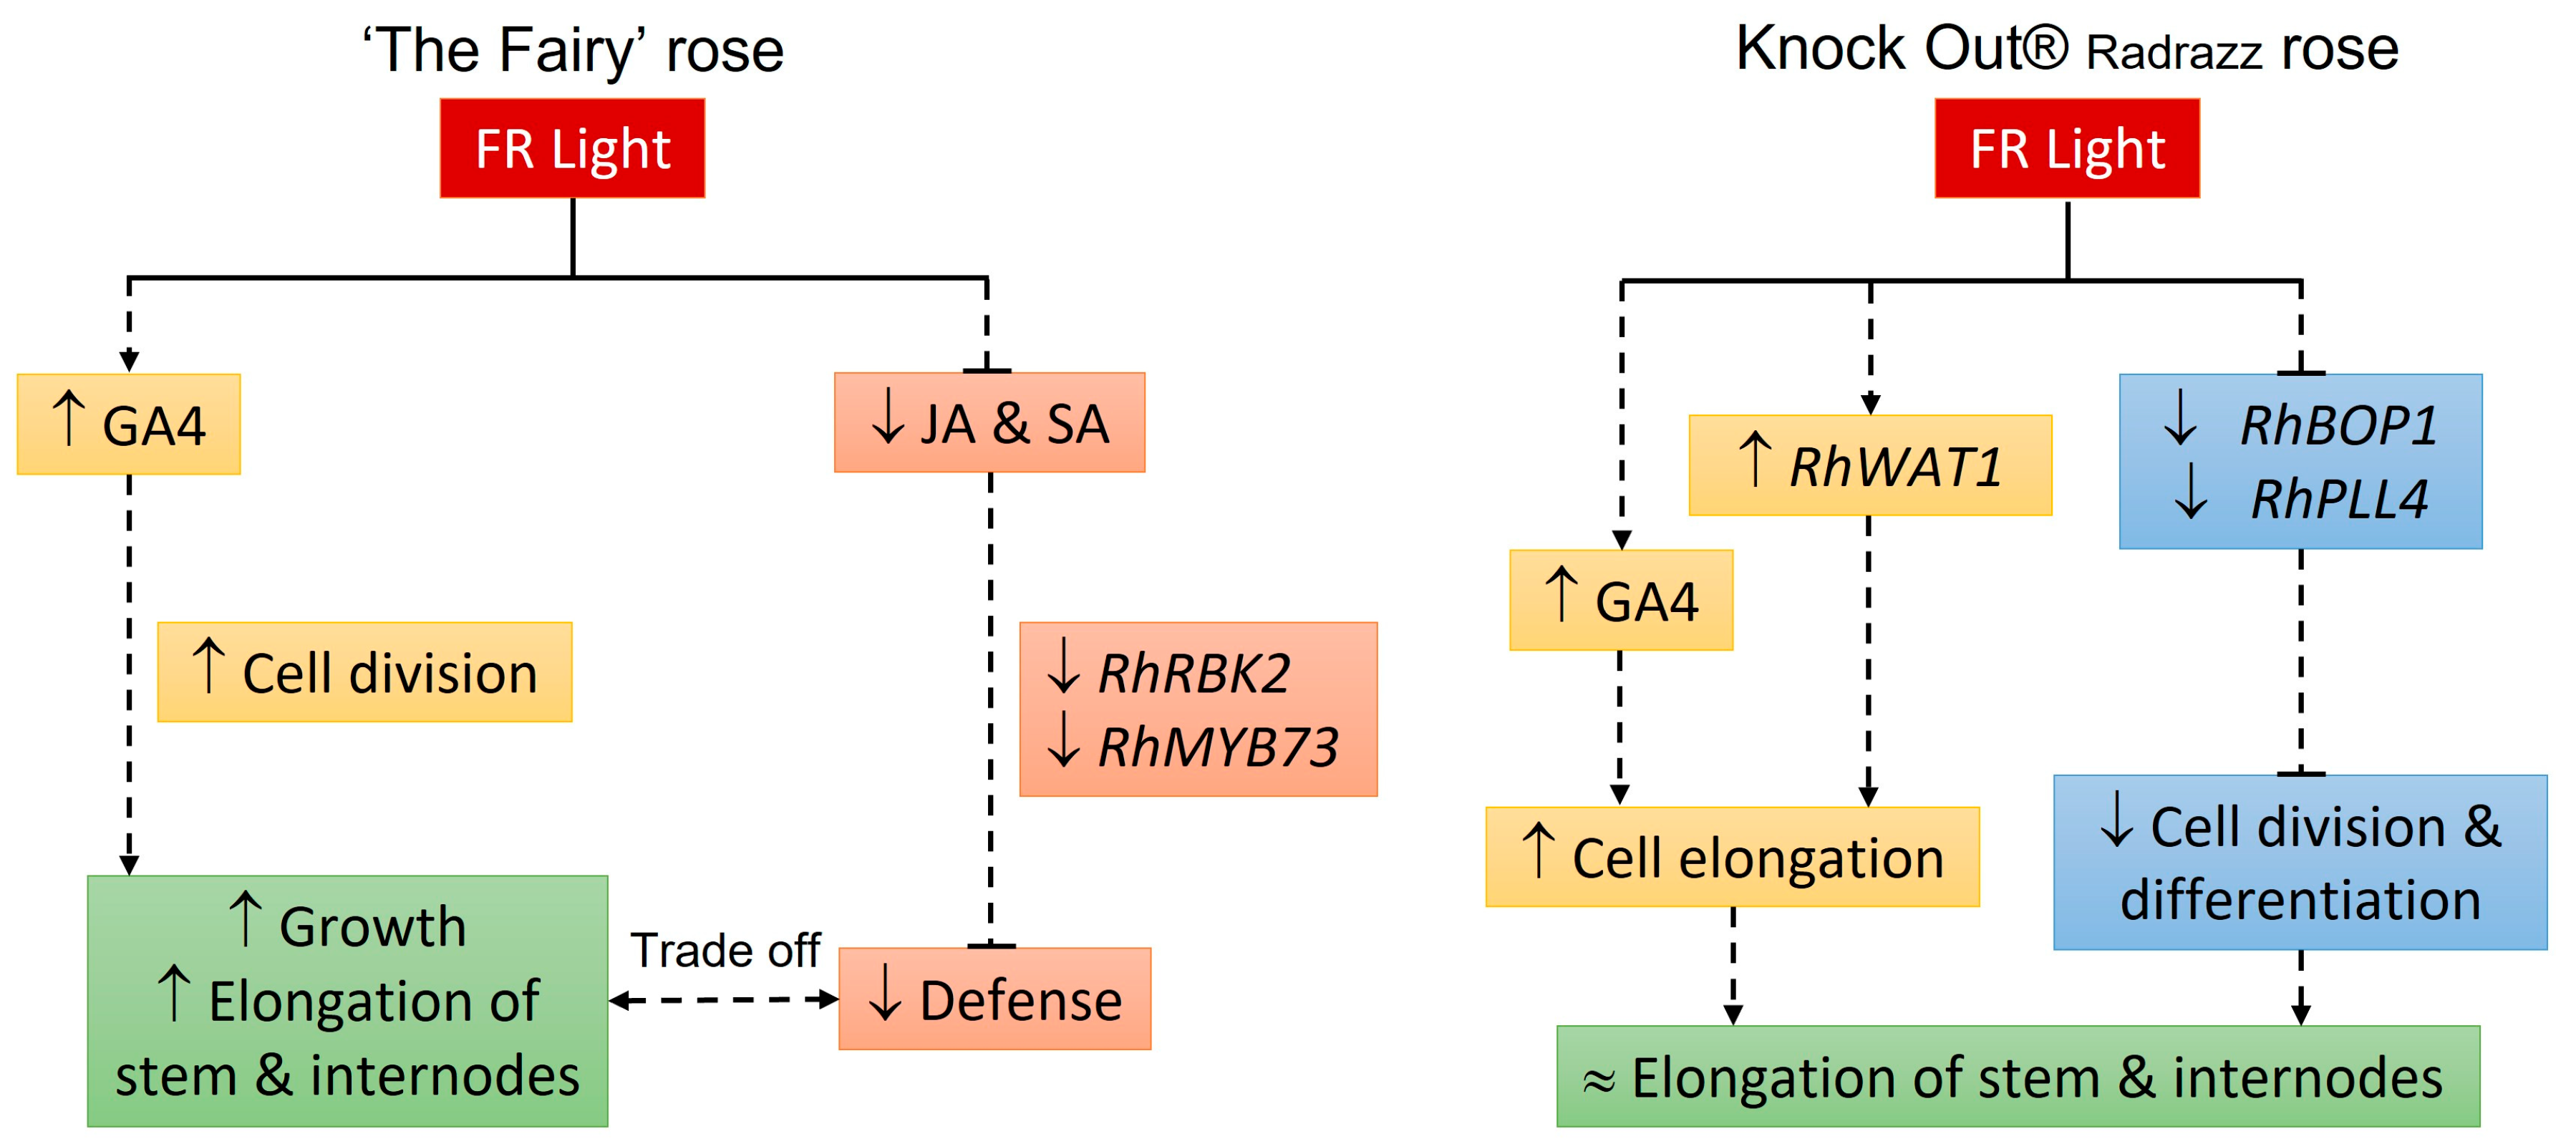
In TF, only the expression of four genes in the internode was affected by FR, with an adjusted p-value < 0.05 (Table 2). Among these genes, two are involved in the plant’s defense responses: the transcription factor MYB73 and the serine/threonine kinase receptor RBK2. Their expression was inhibited in the presence of FR, with log2 fold changes (FC) ranging from −1.2 to −1.0 (Table 2).
Similarly, only three genes were differentially expressed in KO under FR, with an adjusted p-value < 0.05 (Table 2). However, increasing the significance threshold to p < 0.1 identified four additional genes (Table 2). Among these seven genes, three are involved in various cellular processes, ranging from cell-cycle regulation (Block of Cell Proliferation 1; BOP1) to cell expansion (Walls Are Thin 1; WAT1) and cell differentiation (Poltergeist-like; PLL4). Two others are involved in gibberellin catabolism: Gibberellin 2-beta-dioxygenase 1 and 8 (GA2ox1 and GA2ox8). Except for RhWAT1, the expression of these genes was inhibited under FR, with log2 FC ranging from −1.0 to −1.8 (Table 2). In contrast, the expression of RhWAT1 was significantly increased (log2 FC = 2.5; Table 2).
To ensure the validity and reliability of the transcriptomic analysis results, the expression levels of four differentially expressed genes (RhMYB73, RhRBK2, RhBOP1, and RhGA2ox) in both TF and KO were verified via qRT-PCR. The same expression profiles were observed, showing a decrease in gene expression under the effect of FR (Figure 4).

3. Discussion

‘The Fairy’ (TF) and Knock Out® Radrazz (KO) responded differently to far-red (FR), highlighting specific regulatory mechanisms of internode elongation. For TF, the elongation of internodes might primarily result from a redirection of carbon resources initially allocated to defense mechanisms toward growth processes. In contrast, for KO, the inhibition of cell division and differentiation processes, coupled with the stimulation of cell elongation, might prevent or limit internode elongation.
In TF, as previously shown by [22], an elongation of the stem, specifically the internodes, was observed in response to FR, with an overall increase of 24.0%. Regarding the internode located just below the apex, this increase even reached 38.2%. This elongation might result, at least in part, from an increase in the number of cells, i.e., cell division, and may not involve cell elongation, contrary to what was initially reported in bean [23] and in lisianthus [28]. As observed in bean, sunflower, and Arabidopsis, elongation in TF was accompanied by an increase in gibberellin (GA) concentrations, especially the biologically active form, gibberellin A4 (GA4; 21.4%), which is a positive regulator of both cell division and elongation [23,26,27,33]. In parallel, a decrease in cytokinin (CK) concentrations, specifically the active form, dihydrozeatin (DHZ; −21.8%), was observed, as previously reported in sunflower [26]. In tomato, it was associated with a decrease in branching [34], as CKs are inducers of shoot branching [35]. However, [36] showed that an increase in DHZ concentration inhibited the elongation of pea stem segments cultured in vitro.
These hormonal modifications were also accompanied by a significant reduction in the concentrations of two defense hormones, salicylic acid (SA; −16.4%) and jasmonic acid (JA; −50.6%). This decrease, widely reported in the literature, leads to a decline in the plant’s defensive capacities [37,38]. In line with this, there was an inhibition of the expression of two genes, RhMYB73 and RhRBK2, involved in the plant’s defense mechanisms. MYB73 is a transcription factor belonging to the R2-R3-MYB subfamily, known to enhance resistance to Bipolaris oryzae in Arabidopsis and to Botryosphaeria dothidea in apple by increasing SA concentration [39,40]. RBK2 is a cytosolic kinase belonging to the RLCK-VIb receptor family in Arabidopsis, whose expression is associated with the hypersensitive response triggered by Phytophthora infestans and Botrytis cinerea [41]. It is, therefore, more likely that the overall immunity of TF was reduced in response to FR. In addition to their role in plant defenses, JA is also known to inhibit growth, particularly root and hypocotyl elongation in Arabidopsis and internode elongation in rice, by hindering cell division [30,31,38,42,43,44,45]. It is thought to interact with GAs in a coordinated but antagonistic manner to regulate growth. Under conditions of a low R/FR ratio, GAs may inhibit the JA signaling by promoting the degradation of DELLA proteins (GA signaling repressors) and enhancing the stability of JASMONATE ZIM DOMAIN (JAZ) proteins (JA signaling repressors), as well as their interaction with MYC2 (a transcription factor that mediates JA signaling), thereby rendering it inactive [31,46,47]. It is, therefore, more likely that the plant redirected the allocation of carbon resources initially intended for defense toward elongation. This redistribution, coupled with an increased photosynthetic capacity [22], might promote growth and, as a result, the elongation of TF internodes in response to FR.
In KO, although internode elongation was not observed, FR caused notable histological changes, particularly a 10.7% increase in cell length, accompanied by a reduction in cell number (−16.6%). This cell extension correlated with an increase in GA concentrations, especially in GA4 (+32.0%), consistent with [23] and [28] on bean and lisianthus, respectively. However, this correlation was not observed in the case of TF. Recent studies suggest that GA signaling might play a crucial role in low R/FR or shade-induced stem elongation, as demonstrated in Chinese red pine [29] and proposed for sorghum [48]. KO is expected to be more sensitive to GAs than TF, as observed between dwarf and conventional-height durum wheat varieties [49]. Exogenous GA application treatments could help confirm this and provide a deeper understanding of the genotype-specific response to FR. Furthermore, [22] observed that the concentration of sucrose and soluble sugars in KO stems was higher than in TF, thereby providing the necessary energy and carbon for cell growth.
In KO, the elevated level of GA was accompanied by the inhibition of the genes encoding two GA catabolizing enzymes (GA2ox1 and GA2ox8). Interestingly, the expression of Walls Are Thin 1 (WAT1), which is involved in auxin signaling and the formation of secondary cell walls in wood fibers, was stimulated [50]. As a result, inhibiting WAT1 limited cell elongation, leading to reduced stem length in Arabidopsis [50] and a dwarf phenotype characterized by short internodes in cotton [51]. While these factors could explain variations in cell length, others might also contribute to reducing cell number. Among the differentially expressed genes, two, Block of Cell Proliferation 1 (BOP1) and Poltergeist-like (PPL4), involved in cell division and differentiation processes, were downregulated in response to FR. BOP1 plays a crucial role in regulating these processes by controlling ribosome biogenesis, which is essential for cell proliferation [52,53,54,55]. Its impairment was associated with growth abnormalities in Arabidopsis, strawberry, and cotton, such as reduced root, hypocotyl elongation, and leaf deformities [53,54,55]. In Arabidopsis leaves, this inhibition limited cell expansion by limiting the cells’ ability to divide and elongate properly [53]. In both Arabidopsis and cotton, the inhibition of BOP1 was also accompanied by an increase in the expression of genes related to JA biosynthesis, as well as an increase in its concentration [53,55]. Similarly, in KO, although a non-significant decrease in JA level was observed, its concentration remained relatively high under the effect of FR. This, in combination with the inhibition of RhBOP1, might contribute to a reduction in cell division.
PLL4 belongs to a gene family involved in regulating meristem development, playing a key role in the proliferation and differentiation of stem cells and thereby ensuring the essential balance for continuous growth [56,57]. This gene family also acts outside the meristem and participates in regulating organ development. For instance, in Arabidopsis, the inhibition of PLL1 expression led to a reduction in pedicel elongation [58].
Taken together, these findings suggest that the lack of internode elongation, i.e., the architectural stability observed in KO in response to FR, might result from a decrease in cell division, compensated for by an increase in cell elongation.

4. Materials and Methods

This study was carried out in Angers, France, at the experimental facilities of the Institute of Research in Horticulture and Seeds (IRHS).

4.1. Plant Material

The plant material consisted of two rose varieties with contrasting characteristics: ‘The Fairy’ (TF; groundcover), selected for its architectural plasticity in response to far-red (FR), and Knock Out® Radrazz (KO; upright bush), chosen for its absence of response to FR [21,22].
The plants were propagated from cuttings taken from mother plants grown in pots within a greenhouse. Each cutting consisted of a single metamer collected from the middle section of the stems. The cuttings were rooted in plugs (35 mm in diameter and 40 mm in height) made from a non-woven fabric containing a mixture of fine peat and perlite. Rooting occurred in a greenhouse under a plastic tunnel, with an average temperature of 22 °C during the day and 18 °C at night, and relative humidity maintained at saturation using a fine misting system. After four weeks, the rooted cuttings were potted into 0.5 L pots containing a substrate composed of 50% peat, 40% perlite, and 10% coconut fibers and were acclimatized in the greenhouse for one week.

4.2. Experimental Conditions

Following the acclimation phase, the plants were grown in a climate chamber (with two shelves measuring 3.80 × 0.80 m). Mineral nutrition was supplied via fertigation, using sub-irrigation with a balanced liquid fertilizer (N-P2O5-K2O) 3-2-6, a pH of 6.5, and an average electrical conductivity of 1.2 mS·cm−1. The air temperature was maintained at 20 °C during the day and 18 °C at night, with relative humidity of 70%. The plants were exposed to a 16-h photoperiod, with an average photosynthetic photon flux density (PPFD; 400–700 nm) of 183.6 ± 12.8 µmol m−2 s−1 (equivalent to a daylight integral of 10.5 mol m−2 d−1), provided via an LED lighting system consisting of panels with 12 LED tubes emitting white, red, and far-red light (Cesbron, Saint Sylvain d’Anjou, France) according to the tested light conditions. The climate chamber was divided into two compartments, allowing the simultaneous testing of two light conditions with the following spectral characteristics: condition 1 (WR), consisting of three white LED tubes and six red LED tubes, provided 21.2 µmol·m−2 s−1 of blue (B; 11.5% of the PPFD; 400–500 nm), 30.4 µmol·m−2 s−1 of green (G; 16.5%; 500–600 nm), 132.8 µmol·m−2 s−1 of red (R; 72.0%; 600–700 nm), and 5.0 µmol·m−2 s−1 of far-red (FR; 700–800 nm), while condition 2 (WRFR), consisting of three white LED tubes, six red LED tubes, and three far-red LED tubes, provided an average of 20.4 µmol·m−2 s−1 of B (11.1%), 28.7 µmol·m−2 s−1 of G (15.7%), 133.7 µmol·m−2 s−1 of R (73.2%), and 22.0 µmol·m−2 s−1 of FR.
PPFD was measured using a LI-190 PAR meter/quantum meter (LI-COR, Lincoln, NE, USA), while the light spectrum was recorded using a Rainbow Light MR16 spectrophotometer (Rainbow Light Technology CO., Ltd., Taoyuan, Taiwan) positioned at the top of the pot. The spectral characteristics (PPFD, TPFD, YPFD, B/R, B/G, and R/FR) for each condition are detailed in Table 3. No significant differences were observed for PPFD, YPFD, B/R, and B/G between the two light conditions (Table 3).

4.3. Kinetics of Construction of the Order 1 Axis

Plant architecture is characterized by two components: the axis and the metamer. The metamer consists of an internode, a node, an axillary bud, and a leaf [59]. These components are topologically related to each other in succession. The kinetics of elongation of the order 1 axis, as well as the emission and elongation of its metamers, was studied by digitizing the order 1 axis using a MicroScribe 3D digitizer (Solution Technologies, Oella, MD, USA) every two to three days, starting from the 6th day of cultivation (1st, 6th, 8th, 10th, 13th, and 15th days of cultivation). The measurements were recorded in an Excel spreadsheet, allowing for the construction of an architectural database. From these data, and using a specially developed R script, the length of the order 1 axis (LA1) and the number of metamers (NbMetA1) were extracted. The average length of the metamers was then calculated by dividing the length of the order 1 axis (LA1) by its number of metamers (NbMetA1).
Measurements were taken on 10 to 12 plants per variety and light condition, sampled from the center of the shelf and monitored throughout the experiment. The experiment was carried out in triplicate.

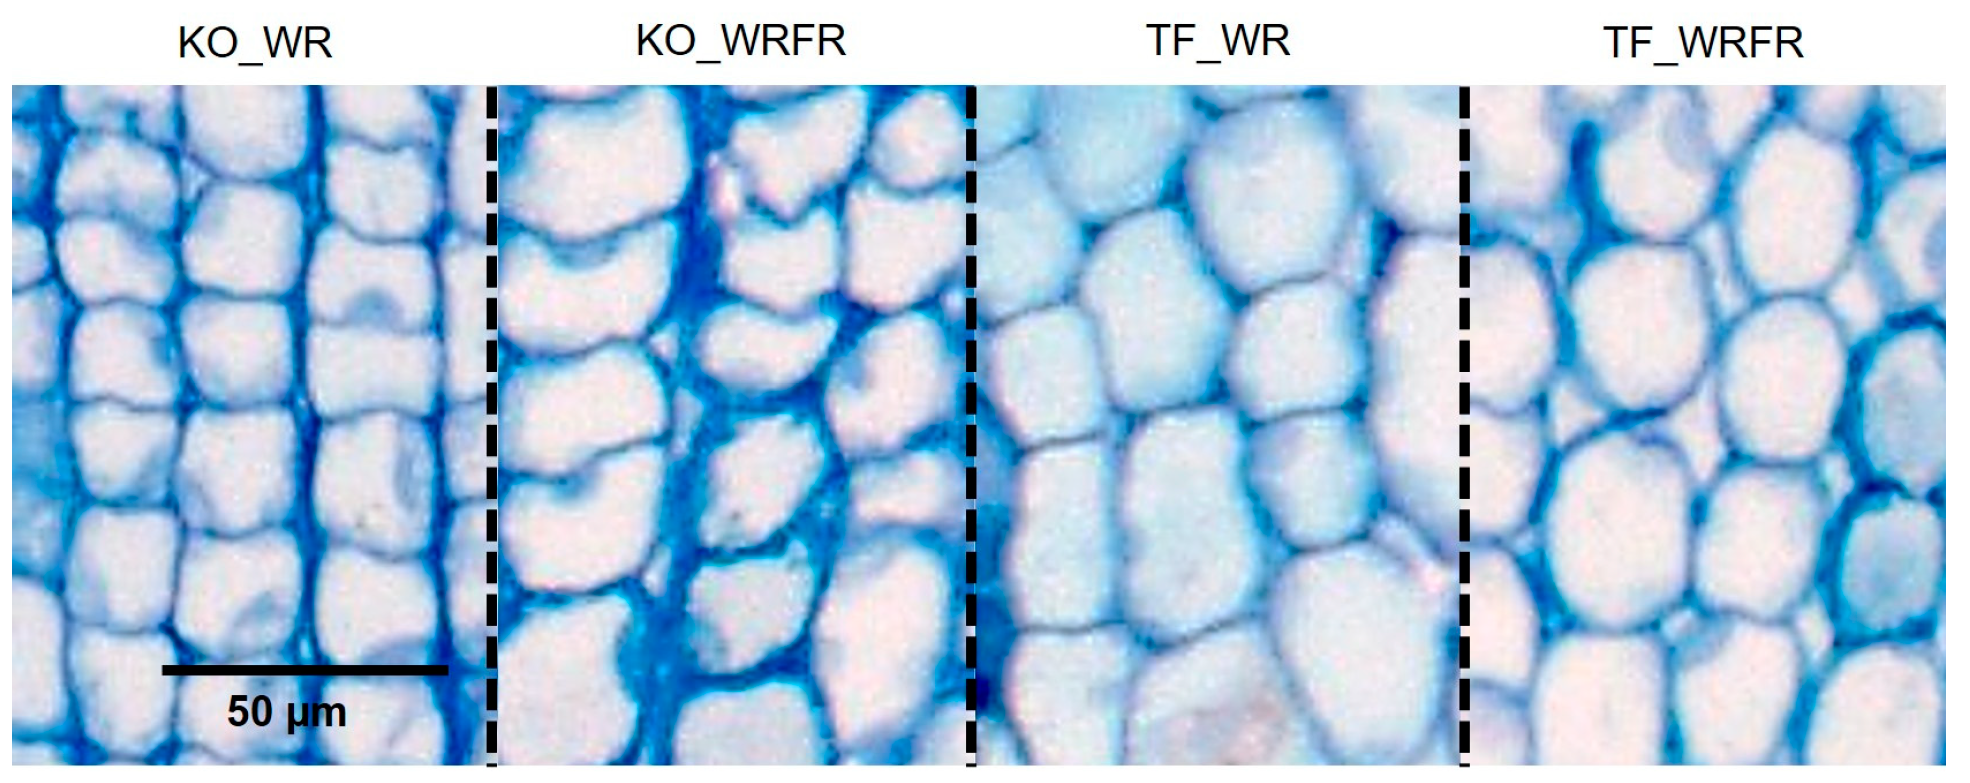
4.4. Measurement of the Length of Parenchyma Cells in the Fourth Internode Underlying the Apex of the Order 1 Axis

On the 14th day of cultivation, the fourth internode underlying the apex of the order 1 axis was collected from three plants for each variety and light condition. This growing internode was chosen instead of the one underlying the apex because it was longer and, therefore, easier to handle during the subsequent treatment steps:
Fixation at 4 °C: The samples were immersed in a 4% (v/v) glutaraldehyde solution mixed with a 0.2 mol L−1 phosphate buffer at pH 7.2. The volume of the solution was 50 times the volume of the sample. Each sample was placed under a vacuum to remove air for 5 h and 30 min. The vacuum was interrupted every 10 min for 2 h and then every 30 min for 3 h and 30 min. The 4% (v/v) glutaraldehyde solution was then renewed. The samples were kept at 4 °C for 12 h. Finally, the samples were rinsed twice with phosphate buffer at pH 7.2 and stored at 4 °C.
Dehydration at room temperature: The samples were rinsed three times with distilled water and successively immersed in 50% (v/v) alcohol for 10 min, 70% (v/v) alcohol for 10 min, 90% (v/v) alcohol for 10 min, and 100% alcohol for 15 min.
Pre-infiltration: The samples were transferred to a pre-infiltration solution (composed of 100% alcohol and Technovit® 7100 resin (Heraeus Kulzer GmbH, Wehrheim, Germany; v/v)) at 4 °C, under a vacuum for 2 h. They were then stored for 12 h at 4 °C.
Infiltration: The samples were transferred to the infiltration solution (composed of a packet of hardener I (Heraeus Kulzer GmbH, Wehrheim, Germany) dissolved in 100 mL of Technovit® 7100 resin) at 4 °C, under a vacuum for at least 20 min. They were then stored for 12 h at 4 °C.
Embedding: The samples were embedded with an embedding solution composed of 1 mL of hardener II (Heraeus Kulzer GmbH, Wehrheim, Germany) and 15 mL of the infiltration solution. After 2 h of polymerization, the samples were placed in an oven at 37 °C for 12 h and then stored at 37 °C.
Longitudinal sections of 3 µm thickness were made using a Leica RM2165 microtome (Leica Microsystems Nussloch GmbH, Nussloch, Germany). The sections were then stained with 1% toluidine blue and observed with an Axio Zoom V16 macroscope (Carl Zeiss Microscopy GmbH, Oberkochen, Germany) equipped with an Axiocam 305 color camera (Carl Zeiss Microscopy GmbH, Oberkochen, Germany) at 50× magnification. The length of the parenchyma cells was measured from photographs using the Adiposoft plugin developed for Fiji, the extended version of the free and open-source image processing and analysis software, ImageJ (v. 1.50i; National Institutes of Health, Bethesda, MD, USA). The estimated vertical cell number in the internode underlying the apex was calculated by dividing the internode length by the average parenchyma cell length.
The experiment was carried out in duplicate. For each experiment, between 662 and 971 cells were measured per variety and light condition.

4.5. Hormone Concentration Measurements in the Internode Underlying the Apex of the Order 1 Axis

On the 14th day of cultivation, the internode underlying the apex of the order 1 axis was collected from at least 22 plants for each variety and light condition. The hormone concentration measurements (indole-3-acetic acid (IAA), cytokinins (CKs), including dihydrozeatin (DHZ), isopentenyladenine (iP), and trans-zeatin (tZ), active gibberellins, gibberellin A1 and A4 (GA1 and GA4), abscisic acid (ABA), salicylic acid (SA) and jasmonic acid (JA)) were carried out at the Plant Hormone Quantification Service, IBMCP (Valencia, Spain).
For each sample, about 6 mg of dry weight of internode was suspended in 80% methanol-1% acetic acid. Internal standards (deuterium-labeled hormones for IAA, CKs, GAs, ABA, and SA; dhJA (dihydrojasmonic acid) for JA quantification) were added and mixed by shaking for 1 h at 4 °C. The extract was kept at −20 °C overnight, then centrifuged, and the supernatant dried in a vacuum evaporator. The dry residue was dissolved in 1% acetic acid and passed through a reverse phase column (Oasis HLB; Waters Cromatografía S.A., Barcelona, Spain), as described by [60].
For IAA, GAs, ABA, SA, and JA quantification, the dried eluate was dissolved in 5% acetonitrile-1% acetic acid, and the hormones were separated using an autosampler and reverse phase UHPLC chromatography (2.6 µm Accucore RP-MS column, 100 mm length × 2.1 mm i.d.; ThermoFisher Scientific Inc., Waltham, MA, USA) with a 5 to 50% acetonitrile gradient containing 0.05% acetic acid at 400 µL min−1 for 21 min.
For CKs, the extracts were additionally passed through a cation-exchange column (Oasis MCX; Waters Cromatografía S.A., Barcelona, Spain) and eluted with 60% methanol-5% NH4OH to obtain the basic fraction containing CKs. The final eluate was dried and dissolved in 5% acetonitrile–1% acetic acid, and the CKs were separated with a 5 to 50% acetonitrile gradient for 10 min.
The hormones were analyzed with a Q-Exactive mass spectrometer (Orbitrap detector; ThermoFisher Scientific Inc., Waltham, MA, USA) via targeted Selected Ion Monitoring (SIM). The hormone concentrations in the extracts were determined using embedded calibration curves and the Xcalibur 4.0 and TraceFinder 4.1 SP1 programs.
The experiment was carried out in triplicate.

4.6. RNA Extraction, Illumina Sequencing, and RNA-Seq Data Analysis

On the 13th day of cultivation, the internode underlying the apex of the order 1 axis was collected from at least 22 plants for each variety and light condition. Total internode RNA was extracted using the protocol developed by [61]. The quantity and quality of the RNA were checked using a Nanodrop One (Thermo Scientific, Waltham, MA, USA) and a 2100 Bioanalyzer (Agilent Technologies, Santa Clara, CA, USA), respectively. The RNA quality was good (RNA Integrity Number, RIN = 8.5–9.7; 28S/18S ratio = 1.2–1.8). The construction of the cDNA library, sequencing on the Illumina platform, and analysis of RNAseq data (except differential expression analysis) were carried out by Novogene Company Ltd. (Cambridge, UK) as follows.
Quality control: To obtain clean reads, raw data were filtered as follows. Reads with adapter contamination, with more than 10% uncertain nucleotides (N > 10%), and with low-quality nucleotides (base quality < 5) were removed.
Mapping to the rose reference genome: Paired-end clean reads were aligned to the rose reference genome [62] using HISAT2.
Quantification of gene expression: The number of reads mapped to each gene was counted. The level of gene expression was estimated using the FPKM method (fragments per kilobase of transcript sequence per million base pairs sequenced), which takes into account the effects of sequencing depth and gene length on fragment count [63].
Analysis of genes with differential expression levels: For each variety, differential expression analysis between light conditions was performed using EdgeR in Anadiff [64]. The p-values obtained were adjusted using the Benjamini and Hochberg approach to control the false discovery rate (FDR). Genes with an adjusted p-value < 0.05 or <0.1 and a log2 fold change (log2 FC) ≥ 1 or ≤−1 were considered differentially expressed.
The experiment was carried out in triplicate.

4.7. Real-Time Quantitative Polymerase Chain Reaction (qRTPCR)

Differential expression analysis was confirmed via quantitative real-time reverse transcription-PCR (qRT-PCR). Four differentially expressed genes (RhMYB73, RhRBK2, RhBOP1, and RhGA2ox) were selected. cDNAs were obtained through reverse transcription performed on 1 μg of RNA using SuperScript III Reverse Transcriptase (Invitrogen, Waltham, MA, USA). qRT-PCR was performed with SYBR Green Supermix (Bio-Rad, Hercules, CA, USA) using cDNA as a template, following the protocol from [65]. Relative gene expression was calculated using the 2−ΔΔCt method, with RhUBC as the internal control [66,67]. Each PCR reaction was carried out in triplicate (three biological and technical replicates).

4.8. Data Analysis

For each variety, the effect of FR was evaluated for all variables. A mixed linear model was used, with the replication of the experiment as a random factor, for a probability of p < 0.05.
The model was estimated using the maximum likelihood (ML) method. A post hoc comparison of means (Tukey’s test) was performed, using the adjusted means (least-square means), for a probability of p < 0.05. Statistical analyses were carried out using the lme4 and multcomp packages in R (R Foundation for Statistical Computing, Vienna, Austria).

5. Conclusions

This study highlighted significant differences in the regulatory mechanisms of internode elongation in rose in response to far-red (FR; Figure 5). For ‘The Fairy’ (TF), the elongation of internodes was primarily attributed to an increase in cell division, facilitated via elevated levels of gibberellins (GAs), particularly gibberellin A4 (GA4), and a decrease in jasmonic acid (JA) concentration. Additionally, the reduction in the plant’s defensive capabilities, resulting from decreased levels of JA and salicylic acid (SA), might promote growth by reallocating carbon resources toward elongation rather than defense mechanisms. This trade-off between growth and defense illustrates TF’s adaptability to its environment, as has been repeatedly observed [6,8,21,22]. In contrast, in Knock Out® Radrazz (KO), although the cell length increased, internode elongation was not observed due to a decrease in the cell number, which might be behind the architectural stability. This response was correlated with a high level of GA4, as well as the inhibition of Block of Cell Proliferation 1 (BOP1), a positive regulator of cell division. Thus, this study highlighted the complexity of the physiological responses in rose. Expanding it to include additional varieties could further enhance the understanding of the diversity of FR responses. By tapping into this diversity of responses, particularly phenotypic stability, it might be possible to develop an innovative approach to obtain plants with the desired architecture, regardless of environmental conditions.

Author Contributions

Conceptualization, L.C. and C.L.B.; methodology, C.L.B., B.D., M.-D.P.-G., A.R., E.C. and R.G.; Formal analysis, L.C. and C.L.B.; writing—original draft, L.C. and S.S.; writing—review, and editing, L.C. and S.S.; supervision, L.C. and S.S. All authors have read and agreed to the published version of the manuscript.

Funding

This work was supported by the French Ministry of Agriculture and Food (Compte d’Affectation Spéciale pour le Développement Agricole et Rural; CASDAR) within the framework of the IRRADIANCE project.

Data Availability Statement

The original contributions presented in this study are included in the article. Further inquiries can be directed to the corresponding author.

Acknowledgments

This research work has benefited from the support of the IBMCP, as well as IRHS’s PHENOTIC and IMAC platforms, with special thanks to Fabienne Simonneau for her technical assistance with histological preparation.

Conflicts of Interest

The authors declare no conflict of interest.

References

  1. Boumaza, R.; Demotes-Mainard, S.; Huché-Thélier, L.; Guérin, V. Visual characterization of the esthetic quality of the rosebush. J. Sens. Stud. 2009, 24, 774–796. [Google Scholar] [CrossRef]
  2. Garbez, M.; Galopin, G.; Sigogne, M.; Favre, P.; Demotes-Mainard, S.; Symoneaux, R. Assessing the visual aspect of rotating virtual rose bushes by a labeled sorting task. Food Qual. Prefer. 2015, 40, 287–295. [Google Scholar] [CrossRef]
  3. Morel, P.; Galopin, G.; Donès, N. Using architectural analysis to compare the shape of two hybrid tea rose genotypes. Sci. Hortic. 2009, 120, 391–398. [Google Scholar] [CrossRef]
  4. Galopin, G.; Morel, P.; Crespel, L.; Darmet, P.; Fillatre, J.; Mary, L.; Edelin, C. The influence of pruning on morphological and architectural characteristics of Camellia japonica L. in a tropical climate. Eur. J. Hortic. Sci. 2011, 76, 182–187. [Google Scholar] [CrossRef]
  5. Crespel, L.; Morel, P.; Galopin, G. Architectural and genetic characterization in Hydrangea aspera subsp. aspera Kawakami group, H. aspera subsp. sargentiana and their hybrids. Euphytica 2012, 184, 289–299. [Google Scholar] [CrossRef]
  6. Crespel, L.; Le Bras, C.; Relion, D.; Morel, P. Genotype x year interaction and broad-sense heritability of architectural characteristics in rose bush. Plant Breed. 2014, 133, 412–418. [Google Scholar] [CrossRef]
  7. Demotes-Mainard, S.; Huché-Thélier, L.; Morel, P.; Boumaza, R.; Guérin, V.; Sakr, S. Temporary water restriction or light intensity limitation promotes branching in rose bush. Sci. Hortic. 2013, 150, 432–440. [Google Scholar] [CrossRef]
  8. Li-Marchetti, C.; Le Bras, C.; Relion, D.; Citerne, S.; Huché-Thélier, L.; Sakr, S.; Morel, P.; Crespel, L. Genotypic differences in architectural and physiological responses to water restriction in rose bush. Front. Plant Sci. 2015, 6, 355. [Google Scholar] [CrossRef]
  9. Li-Marchetti, C.; Le Bras, C.; Chastellier, A.; Relion, D.; Morel, P.; Sakr, S.; Hibrand-Saint Oyant, L.; Crespel, L. 3D Phenotyping and QTL analysis of a complex character: Rose bush architecture. Tree Genet. Genomes 2017, 13, 112. [Google Scholar] [CrossRef]
  10. Ye, Y.J.; Wu, J.Y.; Feng, L.; Ju, Y.Q.; Cai, M.; Cheng, T.R.; Pan, H.T.; Zhang, Q.X. Heritability and gene effects for plant architecture traits of crape myrtle using major gene plus polygene inheritance analysis. Sci. Hortic. 2017, 225, 335–342. [Google Scholar] [CrossRef]
  11. Jiji Allen, J.; Kannan, M.; Thamaraiselvi, S.P.; Kumar, M. Genetic variability, heritability and correlation studies in Hibiscus rosa-sinensis. J. Pharmacog. Phytochem. 2019, 8, 1001–1004. [Google Scholar]
  12. Demotes-Mainard, S.; Péron, T.; Corot, A.; Bertheloot, J.; Le Gourrierec, J.; Pelleschi-Travier, S.; Crespel, L.; Morel, P.; Huché-Thélier, L.; Boumaza, R.; et al. Plant responses to red and far-red lights, applications in horticulture. Environ. Exp. Bot. 2016, 121, 4–21. [Google Scholar] [CrossRef]
  13. Huché-Thélier, L.; Crespel, L.; Le Gourrierec, J.; Morel, P.; Sakr, S.; Leduc, N. Light signaling and plant responses to blue and UV radiations-Perspectives for applications in horticulture. Environ. Exp. Bot. 2016, 121, 22–38. [Google Scholar] [CrossRef]
  14. Morel, P. Growth control of Hydrangea macrophylla through water restriction. Acta Hortic. 2001, 548, 51–58. [Google Scholar] [CrossRef]
  15. Morel, P.; Crespel, L.; Galopin, G. Effect of mechanical stimulation on the growth and branching of garden rose. Sci. Hortic. 2012, 135, 59–64. [Google Scholar] [CrossRef]
  16. Ley-Ngardigal, B.; Guérin, V.; Huché-Thélier, L.; Brouard, N.; Eveleens, T.; Roman, H.; Leduc, N. Impact of mechanical stimulation on Hydrangea macrophylla. Acta Hortic. 2023, 1372, 275–282. [Google Scholar] [CrossRef]
  17. Paradiso, R.; Proietti, S. Light quality manipulation to control plant growth and photomorphogenesis in greenhouse horticulture: The state of the art and the opportunities of modern LED systems. J. Plant Growth Reg. 2021, 41, 742–780. [Google Scholar] [CrossRef]
  18. Islam, M.A.; Kuwar, G.; Clarke, J.L.; Blystad, D.-R.; Gislerød, H.R.; Olsen, J.E.; Torre, S. Artificial light from light emitting diodes (LEDs) with a high portion of blue light results in shorter poinsettias compared to high pressure sodium (HPS) lamps. Sci. Hortic. 2012, 147, 136–143. [Google Scholar] [CrossRef]
  19. Ouzounis, T.; Fretté, X.; Rosenqvist, E.; Ottosen, C.O. Spectral effects of supplementary lighting on the secondary metabolites in roses, chrysanthemums, and campanulas. J. Plant Physiol. 2014, 171, 1491–1499. [Google Scholar] [CrossRef]
  20. Yuan, C.Q.; Ahmad, S.; Cheng, T.R.; Wang, J.; Pan, H.T.; Zhao, L.J.; Zhang, Q. Red to far-red light ratio modulates hormonal and genetic control of axillary bud outgrowth in chrysanthemum (Dendranthema grandiflorum ‘Jinba’). Int. J. Mol. Sci. 2018, 19, 1590. [Google Scholar] [CrossRef]
  21. Crespel, L.; Le Bras, C.; Amoroso, T.; Unda Ulloa, M.G.; Morel, P.; Sakr, S. Genotype × light quality interaction on rose architecture. Agronomy 2020, 10, 913. [Google Scholar] [CrossRef]
  22. Crespel, L.; Le Bras, C.; Amoroso, T.; Dubuc, B.; Citerne, S.; Perez-Garcia, M.D.; Sakr, S. Involvement of sugar and abscisic acid in the genotype-specific response of rose to far-red light. Front. Plant Sci. 2022, 13, 929029. [Google Scholar] [CrossRef] [PubMed]
  23. Beall, F.D.; Yeung, E.C.; Pharis, R.P. Far-red light stimulates internode elongation, cell division, cell elongation, and gibberellin levels in bean. Can. J. Bot. 1996, 74, 743–752. [Google Scholar] [CrossRef]
  24. Martinez-Garcia, J.F.; Santes, C.M.; Garcia-Martinez, J.L. The end-of-day far-red irradiation increases gibberellin A1 content in cowpea (Vigna sinensis) epicotyls by reducing inactivation. Physiol. Plant 2000, 108, 426–434. [Google Scholar] [CrossRef]
  25. Hisamatsu, T.; King, R.W.; Helliwell, C.A.; Koshioka, M. The involvement of gibberellin 20-oxidase genes in phytochrome-regulated petiole elongation of Arabidopsis. Plant Physiol. 2005, 138, 1106–1116. [Google Scholar] [CrossRef]
  26. Kurepin, L.V.; Emery, R.J.N.; Pharis, R.P.; Reid, D.M. Uncoupling light quality from light irradiance effects in Helianthus annuus shoots: Putative roles for plant hormones in leaf and internode growth. J. Exp. Bot. 2007, 58, 2145–2157. [Google Scholar] [CrossRef]
  27. Kurepin, L.V.; Walton, L.J.; Hayward, A.; Emery, R.J.N.; Pharis, R.P.; Reid, D.M. Interactions between plant hormones and light quality signaling in regulating the shoot growth of Arabidopsis thaliana seedlings. Botany 2012, 90, 237–246. [Google Scholar] [CrossRef]
  28. Takemura, Y.; Kuroki, K.; Katou, M.; Kishimoto, M.; Tsuji, W.; Nishihara, E.; Tamura, F. Gene expression changes triggered by end-of-day far-red light treatment on early developmental stages of Eustoma grandiflorum (Raf.) Shinn. Sci. Rep. 2015, 5, 17864. [Google Scholar] [CrossRef]
  29. Li, W.; Liu, S.W.; Ma, J.J.; Liu, H.M.; Han, F.X.; Li, Y.; Niu, S.H. Gibberellin signaling is required for far-red light-induced shoot elongation in Pinus tabuliformis seedlings. Plant Physiol. 2020, 182, 658–668. [Google Scholar] [CrossRef]
  30. Robson, F.; Okamoto, H.; Patrick, E.; Harris, S.R.; Wasternack, C.; Brearley, C.; Turner, J.G. Jasmonate and phytochrome A signaling in Arabidopsis wound and shade responses are integrated through JAZ1 stability. Plant Cell 2010, 22, 1143–1160. [Google Scholar] [CrossRef]
  31. Leone, M.; Keller, M.M.; Cerrudo, I.; Ballare, C.L. To grow or defend? Low red: Far-red ratios reduce jasmonate sensitivity in Arabidopsis seedlings by promoting DELLA degradation and increasing JAZ10 stability. New Phytol. 2014, 204, 355–367. [Google Scholar] [CrossRef] [PubMed]
  32. Dierck, R.; Dhooghe, E.; Van Huylenbroeck, J.; Van Der Straeten, D.; De Keyser, E. Light quality regulates plant architecture in different genotypes of Chrysanthemum morifolium Ramat. Sci. Hortic. 2017, 218, 177–186. [Google Scholar] [CrossRef]
  33. Colebrook, E.H.; Thomas, S.G.; Phillips, A.L.; Hedden, P. The role of gibberellin signaling in plant responses to abiotic stress. J. Exp. Biol. 2014, 217, 67–75. [Google Scholar] [CrossRef]
  34. Song, X.; Gu, X.; Chen, S.; Qi, Z.; Yu, J.; Zhou, Y.; Xia, X. Far-red light inhibits lateral bud growth mainly through enhancing apical dominance independently of strigolactone synthesis in tomato. Plant Cell Environ. 2024, 47, 429–441. [Google Scholar] [CrossRef]
  35. Doidy, J.; Wang, Y.; Gouaille, L.; Goma-Louamba, I.; Jiang, Z.; Pourtau, N.; Le Gourrierec, J.; Sakr, S. Sugar transport and signaling in shoot branching. Int. J. Mol. Sci. 2024, 25, 13214. [Google Scholar] [CrossRef]
  36. Matsubara, S.; Koshimizu, K.; Nakahira, R. Cytokinin activities of dihydrozeatin in several bioassays. Si. Rep. Kyoto Pref. Univ. 1968, 19, 19–24. [Google Scholar]
  37. Courbier, S.; Pierik, R. Canopy light quality modulates stress responses in plants. iScience 2019, 22, 441–452. [Google Scholar] [CrossRef]
  38. Pierik, R.; Ballaré, C.L. Control of plant growth and defense by photoreceptors: From mechanisms to opportunities in agriculture. Mol. Plant 2021, 14, 61–76. [Google Scholar] [CrossRef]
  39. Jia, J.; Xing, J.H.; Dong, J.G.; Han, J.M.; Liu, J.S. Functional analysis of MYB73 of Arabidopsis thaliana against Bipolaris oryzae. Agric. Sci. China 2011, 10, 721–727. [Google Scholar] [CrossRef]
  40. Gu, K.D.; Zhang, Q.Y.; Yu, J.Q.; Wang, J.H.; Zhang, F.J.; Wang, C.K.; Zhao, Y.W.; Sun, C.H.; You, C.X.; Hu, D.G.; et al. R2R3-MYB transcription factor MdMYB73 confers increased resistance to the fungal pathogen Botryosphaeria dothidea in apples via the salicylic acid pathway. J. Agric. Food Chem. 2020, 69, 447–458. [Google Scholar] [CrossRef]
  41. Molendijk, A.J.; Ruperti, B.; Singh, M.K.; Dovzhenko, A.; Ditengou, F.A.; Milia, M.; Westphal, L.; Rosahl, S.; Soellick, T.R.; Uhrig, J.; et al. A cysteine-rich receptor-like kinase NCRK and a pathogen-induced protein kinase RBK1 are Rop GTPase interactors. Plant J. 2008, 53, 909–923. [Google Scholar] [CrossRef] [PubMed]
  42. Chen, Q.; Sun, J.; Zhai, Q.; Zhou, W.; Qi, L.; Xu, L.; Wang, B.; Chen, R.; Jiang, H.; Qi, J.; et al. The basic helix-loop-helix transcription factor MYC2 directly represses PLETHORA expression during jasmonate-mediated modulation of the root stem cell niche in Arabidopsis. Plant Cell 2011, 23, 3335–3352. [Google Scholar] [CrossRef] [PubMed]
  43. Yang, D.L.; Yao, J.; Mei, C.S.; Tong, X.H.; Zeng, L.J.; Li, Q.; Xiao, L.T.; Sun, T.P.; Li, J.; Deng, X.W.; et al. Plant hormone jasmonate prioritizes defense over growth by interfering with gibberellin signaling cascade. Proc. Natl. Acad. Sci. USA 2012, 109, E1192–E1200. [Google Scholar] [CrossRef] [PubMed]
  44. Chen, H.J.; Chen, C.L.; Hsieh, H.L. Far-red light-mediated seedling development in Arabidopsis involves FAR-RED INSENSITIVE 219/JASMONATE RESISTANT 1-dependent and -independent pathways. PLoS ONE 2015, 10, e0132723. [Google Scholar] [CrossRef]
  45. Havko, N.; Major, I.; Jewell, J.; Attaran, E.; Howe, G. Control of carbon assimilation and partitioning by jasmonate: An accounting of growth–defense tradeoffs. Plants 2016, 5, 7. [Google Scholar] [CrossRef]
  46. Yang, J.; Duan, G.; Li, C.; Liu, L.; Han, G.; Zhang, Y.; Wang, C. The crosstalks between jasmonic acid and other plant hormone signaling highlight the involvement of jasmonic acid as a core component in plant response to biotic and abiotic stresses. Front. Plant Sci. 2019, 10, 1349. [Google Scholar] [CrossRef]
  47. Song, C.; Cao, Y.; Dai, J.; Li, G.; Manzoor, M.A.; Chen, C.; Deng, H. The multifaceted roles of MYC2 in plants: Toward transcriptional reprogramming and stress tolerance by jasmonate signaling. Front. Plant Sci. 2022, 13, 868874. [Google Scholar] [CrossRef]
  48. Yu, K.M.J.; McKinley, B.; Rooney, W.L.; Mullet, J.E. High planting density induces the expression of GA3-Oxidase in leaves and GA mediated stem elongation in bioenergy sorghum. Sci. Rep. 2021, 11, 46. [Google Scholar] [CrossRef]
  49. Pandey, M.; Singh, A.K.; DePauw, R.M.; Bokore, F.E.; Ellouze, W.; Knox, R.E.; Cuthbert, R.D. Coleoptile length, gibberellin sensitivity, and plant height variation of durum wheat in Canada. Can. J. Plant Sci. 2015, 95, 1259–1264. [Google Scholar] [CrossRef]
  50. Ranocha, P.; Denancé, N.; Vanholme, R.; Freydier, A.; Martinez, Y.; Hoffmann, L.; Köhler, L.; Pouzet, C.; Renou, J.P.; Sundberg, B.; et al. Walls are thin 1 (WAT1), an Arabidopsis homolog of Medicago truncatula NODULIN21, is a tonoplast-localized protein required for secondary wall formation in fibers. Plant J. 2010, 63, 469–483. [Google Scholar] [CrossRef]
  51. Ju, F.; Liu, S.; Zhang, S.; Ma, H.; Chen, J.; Ge, C.; Shen, Q.; Zhang, X.; Zhao, X.; Zhang, Y.; et al. Transcriptome analysis and identification of genes associated with fruiting branch internode elongation in upland cotton. BMC Plant Biol. 2019, 19, 415. [Google Scholar] [CrossRef]
  52. Cho, H.K.; Ahn, C.S.; Lee, H.S.; Kim, J.K.; Pai, H.S. Pescadillo plays an essential role in plant cell growth and survival by modulating ribosome biogenesis. Plant J. 2013, 76, 393–405. [Google Scholar] [CrossRef] [PubMed]
  53. Ahn, C.S.; Cho, H.K.; Lee, D.H.; Sim, H.J.; Kim, S.G.; Pai, H.S. Functional characterization of the ribosome biogenesis factors PES, BOP1, and WDR12 (PeBoW), and mechanisms of defective cell growth and proliferation caused by PeBoW deficiency in Arabidopsis. J. Exp. Bot. 2016, 67, 5217–5232. [Google Scholar] [CrossRef] [PubMed]
  54. Carvalho, S.D.; Chatterjee, M.; Coleman, L.; Clancy, M.A.; Folta, K.M. Analysis of Block of cell proliferation 1 (BOP1) activity in strawberry and Arabidopsis. Plant Sci. 2016, 245, 84–93. [Google Scholar] [CrossRef]
  55. Wang, Y.; Sun, Z.; Wang, L.; Chen, L.; Ma, L.; Lv, J.; Qiao, K.; Fan, S.; Ma, Q. GhBOP1 as a key factor of ribosomal biogenesis: Development of wrinkled leaves in upland cotton. Int. J. Mol. Sci. 2022, 23, 9942. [Google Scholar] [CrossRef]
  56. Song, S.K.; Lee, M.M.; Clark, S.E. POL and PLL1 phosphatases are CLAVATA1 signaling intermediates required for Arabidopsis shoot and floral stem cells. Development 2006, 133, 4691–4698. [Google Scholar] [CrossRef]
  57. Gagne, J.M.; Clark, S.E. The Arabidopsis stem cell factor POLTERGEIST is membrane localized and phospholipid stimulated. Plant Cell 2010, 22, 729–743. [Google Scholar] [CrossRef]
  58. Song, S.K.; Clark, S.E. POL and related phosphatases are dosage-sensitive regulators of meristem and organ development in Arabidopsis. Dev. Biol. 2005, 285, 272–284. [Google Scholar] [CrossRef]
  59. White, J. The plant as a metapopulation. Annu. Rev. Ecol. Evol. Syst. 1979, 10, 109–145. [Google Scholar] [CrossRef]
  60. Seo, M.; Jikumaru, Y.; Kamiya, Y. Profiling of hormones and related metabolites in seed dormancy and germination studies. In Seed Dormancy. Methods in Molecular Biology; Kermode, A.R., Ed.; Humana Press: Totowa, NJ, USA, 2011; Volume 773, pp. 99–111. [Google Scholar] [CrossRef]
  61. Cao, D.; Barbier, F.; Yoneyama, K.; Beveridge, C.A. A rapid method for quantifying RNA and phytohormones from a small amount of plant tissue. Front. Plant Sci. 2020, 11, 605069. [Google Scholar] [CrossRef]
  62. Hibrand Saint-Oyant, L.; Ruttink, T.; Hamama, L.; Kirov, I.; Lakhwani, D.; Zhou, N.N.; Bourke, P.M.; Daccord, N.; Leus, L.; Schulz, D.; et al. A high-quality genome sequence of Rosa chinensis to elucidate ornamental traits. Nat. Plants 2018, 4, 473–484. [Google Scholar] [CrossRef] [PubMed]
  63. Mortazavi, A.; Williams, B.A.; McCue, K.; Schaeffer, L.; Wold, B. Mapping and quantifying mammalian transcriptomes by RNA-Seq. Nat. Methods 2008, 5, 621–628. [Google Scholar] [CrossRef] [PubMed]
  64. Pelletier, S. AnaDiff: A tool for differential analysis of microarrays and RNAseq (v4.3). Zenodo. 2022. Available online: https://zenodo.org/records/6477918 (accessed on 20 February 2025).
  65. Barbier, F.; Péron, T.; Lecerf, M.; Perez-Garcia, M.D.; Barrière, Q.; Rolčík, J.; Boutet-Mercey, S.; Citerne, S.; Lemoine, R.; Porcheron, B.; et al. Sucrose is an early modulator of the key hormonal mechanisms controlling bud outgrowth in Rosa hybrida. J. Exp. Bot. 2015, 66, 2569–2582. [Google Scholar] [CrossRef]
  66. Jain, M.; Nijhawan, A.; Tyagi, A.K.; Khurana, J.P. Validation of housekeeping genes as internal control for studying gene expression in rice by quantitative real-time PCR. Biochem. Biophys. Res. Commun. 2006, 345, 646–651. [Google Scholar] [CrossRef]
  67. Chua, S.L.; Too, W.C.S.; Khoo, B.Y.; Few, L.L. UBC and YWHAZ as suitable reference genes for accurate normalisation of gene expression using MCF7, HCT116 and HepG2 cell lines. Cytotechnology 2011, 63, 645–654. [Google Scholar] [CrossRef]
Figure 1. Kinetics of construction of the order 1 axis for Knock Out® Radrazz (KO) and ‘The Fairy’ (TF) grown in a climate chamber under two light conditions: WR and WRFR. Kinetics of the elongation of the order 1 axis (LA1, length of the order 1 axis (A)). Kinetics of metamer emission by the order 1 axis (NbMetA1, number of metamers of the order 1 axis (B)). Kinetics of the elongation of metamers of the order 1 axis (LMetA1, length of metamers of the order 1 axis (C)). Least-square means (LS means) of the length of the metamer underlying the apex of the order 1 axis (LMet) on the 13th day of cultivation (D). Error bars represent SEMs (n = 30–36). For each genotype (GEN), asterisks indicate statistically significant differences between the light conditions (LC; Tukey’s test, *** p < 0.0001; ** p < 0.001; * p < 0.05; ns, non-significant).
Plants 14 01115 g001
Figure 2. Longitudinal section of the fourth internode underlying the apex of the order 1 axis for Knock Out® Radrazz (KO) and ‘The Fairy’ (TF) grown in a climate chamber for 14 days under two light conditions: WR and WRFR.
Plants 14 01115 g002
Figure 3. Least-square means (LS means) of hormone concentrations in the internode underlying the apex of the order 1 axis for Knock Out® Radrazz (KO) and ‘The Fairy’ (TF) grown in a climate chamber for 14 days under two light conditions: WR and WRFR. Indole-3-acetic acid (IAA; (A)). Dihydrozeatin (DHZ; (B)). Isopenteniladenine (iP; (C)). t-zeatin (tZ; (D)). Gibberellin A1 (GA1; (E)). Gibberellin A4 (GA4; (F)). Abscisic acid (ABA; (G)). Salicylic acid (SA; (H)). Jasmonic acid (JA; (I)). Error bars represent SEMs (n = 3). For each genotype, asterisks indicate statistically significant differences between the light conditions (Tukey’s test, *** p < 0.0001; ** p < 0.001; * p < 0.05; ns, non-significant).
Plants 14 01115 g003
Figure 4. qRT-PCR validation of RNA-seq data. Least-square means (LS means) of relative expression of RhMYB73 (A), RhRBK2 (B), RhBOP1 (C), and RhGA2ox (D) genes in the internode underlying the apex of the order 1 axis for Knock Out® Radrazz (KO) and ‘The Fairy’ (TF) grown in a climate chamber for 13 days under two light conditions: WR and WRFR. Error bars represent SEMs (n = 3). For each genotype, asterisks indicate statistically significant differences between the light conditions (Tukey’s test, *** p < 0.0001; ** p < 0.001; * p < 0.05; ns, non-significant).
Plants 14 01115 g004
Figure 5. Schematic diagram illustrating the mechanisms of internode elongation in response to far-red (FR) in ‘The Fairy’ (TF) and Knock Out® Radrazz (KO). In TF, FR induced an increase in the concentration of gibberellin A4 (GA4), which stimulated cell division, while the concentrations of jasmonic acid (JA) and salicylic acid (SA) decreased, thereby reducing the plant’s defensive capabilities in favor of growth, specifically internode elongation. In KO, FR promoted the increase in GA4 concentration, as well as the expression of the RhWAT1 gene, stimulating cell elongation. Meanwhile, the inhibition of RhBOP1 and RhPLL4 gene expression limited cell division and differentiation. This inhibition, combined with the increased cell elongation, prevented internode elongation. Regular arrow, positive effect; inverted T, negative effect.
Plants 14 01115 g005
Table 1. The least-square means (LS means) of parenchymal cell length in the fourth internode underlying the apex of the order 1 axis on the 14th day of cultivation and estimated vertical cell number in the internode underlying the apex of the order 1 axis on the 13th day of cultivation for Knock Out® Radrazz (KO) and ‘The Fairy’ (TF) grown in a climate chamber under two light conditions: WR and WRFR.
GenotypeFourth Internode Underlying the Apex on the 14th Day of CultivationInternode Underlying the Apex on the 13th Day of Cultivation
Cell Length (µm)Estimated Vertical Cell Number
WRWRFRWRWRFR
KO21.4 a23.7 b283.0236.0
TF20.9 a21.4 a173.0233.0
Means followed by the same lowercase letter in the same line are not significantly different (Tukey’s test, p < 0.05).
Table 2. Genes differentially expressed in the internode underlying the apex of the order 1 axis for Knock Out® Radrazz (KO) and ‘The Fairy’ (TF) grown in a climate chamber for 13 days under two light conditions: WR and WRFR.
DEGsGene IDDescriptionNameKO_WRFR vs. KO_WR
log2 Fold Changep-ValueAdjusted p-Value (FDR) 1
Down-regulatedRC7G0576300Block of cell proliferation 1BOP1−1.024.4 × 10−77.0 × 10⁻³
RC5G0246800Gibberellin 2-beta-dioxygenase 1GA2ox1−1.02.5 × 10−62.0 × 10⁻²
RC5G0037300Gibberellin 2-beta-dioxygenase 8GA2ox8−1.61.9 × 10−59.0 × 10⁻²
RC3G0259000Poltergeist-likePOL-like; PLL4−1.82.5 × 10−59.0 × 10⁻²
RC6G0422400S-adenosyl-L-methionine-dependent tRNA
4-demethylwyosine synthase
TYW1−2.52.1 × 10−59.0 × 10⁻²
Up-regulatednovel,2696Prolyl-tRNA synthetasePRORS12.57.5 × 10−78.0 × 10⁻³
RC0G0173400Walls are thin 1 related proteinWAT12.52.6 × 10−59.0 × 10⁻²
DEGsGene IDDescriptionNameTF_WRFR vs. TF_WR
log2 Fold Changep-ValueAdjusted p-Value (FDR)
Down-regulatedRC6G0094600Transcription factorMYB73−1.06.4 × 10−63.0 × 10⁻²
RC4G0261800Receptor-like cytosolic serine/
threonine-protein kinase
RBK2−1.29.4 × 10−64.0 × 10⁻²
RC6G0474700Uncharacterized proteinY1015−3.65.8 × 10−89.0 × 10⁻⁴
Up-regulatedRC6G0451600Nucleoid-associated proteinSTIC22.84.6 × 10−63.0 × 10⁻²
1 FDR stands for false discovery rate. Bold values indicate the significantly differentially expressed genes (DEG) at an adjusted p-value (FDR) < 0.05.
Table 3. Spectral characteristics of the two light conditions, WR and WRFR.
Light ConditionsPPFD
(µmol m−2 s−1)
TPFD
(µmol m−2 s−1)
YPFD
(µmol m−2 s−1)
B/RB/GR/FR
WR184.4 a 1189.4 a165.8 a0.2 a0.7 a26.6 b
WRFR182.8 a204.8 b166.5 a0.2 a0.7 a6.1 a
PPFD, photosynthetic photon flux density (400–700 nm); TPFD, total photon flux density (400–800 nm); YPFD, yield photon flux density, i.e., the product of TPFD and relative quantum efficiency; B/R, blue light (400–500 nm) over red light (600–700 nm) ratio; B/G, blue light (400–500 nm) over green light (500–600 nm) ratio; R/FR, red light (600–700 nm) over far-red light (700–800 nm) ratio. 1 Means followed by the same lowercase letter in the same column are not significantly different (Kruskall & Wallis test, p < 0.05).
Disclaimer/Publisher’s Note: The statements, opinions and data contained in all publications are solely those of the individual author(s) and contributor(s) and not of MDPI and/or the editor(s). MDPI and/or the editor(s) disclaim responsibility for any injury to people or property resulting from any ideas, methods, instructions or products referred to in the content.

