Article

Integrated Transcriptomics and Metabolomics Reveal Key Genes and Metabolic Pathway in Flower and Fruit Color Formation of Cerasus humilis (Bge.) Sok

by
Shuai Zhang
,
Tianyuan Li
,
Shan Liu
,
Xinliang Qi
,
Yu Yang
,
Jiancheng Zhang
,
Luting Jia
,
Pengfei Wang
and
Xiaopeng Mu
*
College of Horticulture, Shanxi Agricultural University, Jinzhong 030801, China
*
Author to whom correspondence should be addressed.
Plants 2025, 14(7), 1103; https://doi.org/10.3390/plants14071103
Submission received: 28 February 2025 / Revised: 29 March 2025 / Accepted: 31 March 2025 / Published: 2 April 2025
(This article belongs to the Section Plant Physiology and Metabolism)

Abstract

Anthocyanins play a pivotal role in determining the color diversity in the flowers and fruits of Cerasus humilis (Bge.) Sok. This study performed a metabolomic analysis of the flowers and fruits of two varieties differing in pigmentation phenotypes (‘Jinou 1’ and ‘Nongda 5’), and the results indicated that the cyanidin, pelargonidin, paeonidin, and delphinidin were the main substances serving as the primary pigments contributing to their striking chromatic divergence between two varieties. Transcriptome profiling revealed that several key structural genes (ChCHS1, ChDFR, ChF3H, and ChF3’H) in the anthocyanin biosynthesis pathway exhibited significantly elevated expression levels in ’Jinou 1’ compared to ’Nongda 5’. Further metabolomic and transcriptomic correlation analyses identified that ChMYB9 and ChMYB12 exhibited strong positive associations with anthocyanin pathway metabolites in both floral and fruit tissues. Notably, ChMYB9 displayed the strongest correlation with the metabolite profiles, suggesting it may serve as a core regulatory component of the anthocyanin biosynthesis. This research provides new insights into the regulatory mechanisms of anthocyanin biosynthesis in C. humilis.

1. Introduction

Cerasus humilis (Bge.) Sok., commercially known as “Calcium Fruit”, belongs to the subgenus Prunus of the Rosaceae family. It is characterized by easy flowering and early fruiting, and the fruit of C. humilis is rich in organic acids, calcium, vitamin C, and flavonoids [1]. The C. humilis germplasm exhibits remarkable color polymorphism in flowers and fruits. Varieties with pink flowers have higher ornamental value, while varieties with yellow fruits have better fresh-eating quality [2]. Therefore, to meet market demand, rapid screening of C. humilis varieties, particularly those with pink flowers and yellow fruits, is one of the most urgent breeding objectives.
Anthocyanins are secondary metabolites in plants classified within the flavonoid subclass of polyphenolic compounds, imparting rich colors to flowers, fruits, and leaves [3]. The biosynthetic pathway of anthocyanins is relatively conserved among plants and has been extensively studied in model plants [4]. The synthesis process can be divided into three stages, with key enzymes and genes well characterized throughout these stages [5,6]. The first stage involves the conversion of phenylalanine into 4-coumaroyl-CoA catalyzed by PAL, C4H, and 4CL. The second stage is the transformation of 4-coumaroyl-CoA into flavanones via CHS, CHI, and F3H. In the third stage, flavanones are converted into unstable anthocyanins by the action of DFR and ANS, while stable anthocyanin products are formed through modifications by UFGT [7].
The structural genes of the anthocyanin biosynthetic pathway primarily encode enzymes involved in the flavonoid synthetic process, such as PAL, CHS, CHI, F3H, F3’H, F3’5’H, DFR, ANS, and UFGT [8]. Studies have shown that the expression of CHS and CHI can enhance anthocyanin accumulation in Anthurium andraeanum and Muscari armeniacum [9,10]. Inhibition of the activities of MdF3H, MdDFR, MdANS, and MdUFGT can reduce anthocyanin content in apple fruits [11,12]. The activity of key enzyme genes in the anthocyanin biosynthetic process is transcriptionally regulated by interactions between transcription factors and their downstream structural genes [13]. Typically, MYB, bHLH, and WD transcription factors form a ternary complex (MBW) for transcriptional regulation [12]. Among these, MYB is the most crucial transcription factor in regulating anthocyanin synthesis, directly influencing its production [14]. For instance, the R2R3-MYB transcription factors PpMYB10.2 and PpMYB9 in peaches can activate the transcription of anthocyanin biosynthetic genes [15]. PyMYB10 and PyMYB114 regulate anthocyanin biosynthesis in pear fruits by forming MBW transcription complexes [16]. In studies on the color regulation mechanisms of roses, two MBW complexes (RcMYB1-RcBHLH42-RcTTG1; RcMYB1-RcEGL1-RcTTG1) were found to control anthocyanin accumulation [17]. Considering the phylogenetic position of C. humilis within Rosaceae, we hypothesize that the variations in floral and fruit pigmentation of C. humilis are determined by anthocyanin biosynthetic genes, whose transcription may be governed by a conserved MYB-bHLH-WD40 regulatory complex.
In earlier studies, our research team measured anthocyanin content in fruits of different colored varieties of C. humilis, finding that red fruited varieties contained higher anthocyanin levels in their fruits than yellow fruited varieties [18]. Analysis of structural genes in the anthocyanin pathway revealed that ChCHS, ChCHI, ChF3H, ChDFR, ChANS, and ChUFGT had significantly higher expression levels in red fruited varieties of C. humilis [19]. Therefore, variety ‘Jinou 1’ (red flowers, red fruits) and variety ‘Nongda 5’ (white flowers, yellow fruits) were selected as research materials to investigate variations in anthocyanin biosynthesis of C. humilis. Metabolomic and transcriptomic sequencing results indicated that the main substances responsible for the color differences in flowers and fruits of the two varieties were cyanidin, pelargonidin, paeonidin, and delphinidin, while ChCHS1, ChDFR, ChF3H, and ChF3’H were the key structural genes associated with the observed differences. Further metabolomic and transcriptomic analyses identified that ChMYB9, a transcription factor encoded gene, correlates significantly with the anthocyanin pathway metabolites in flowers and fruits of C. humilis. This study provides a basis for exploring key genes that regulate the coloring mechanisms of C. humilis flowers and fruits, and for elucidating the coloration mechanisms related to flower and fruit traits in C. humilis.

2. Results

2.1. Phenotypic Differences in Flowers and Fruits of ‘Jinou 1’ and ‘Nongda 5’

Observations were made on the flowers of ‘Jinou 1’ and ‘Nongda 5’ at different developmental stages, and it was found that ‘Jinou 1’ exhibited a stable pink pigmentation in both sepals and petals from the earliest bud stages, with this hue persisting through petal expansion to full anthesis, whereas the sepals and petals of ‘Nongda 5’ remained white across all developmental phases (Figure 1A–C). Colorimetric analysis further revealed that the values of lightness (L*), red-green chromaticity (a*), yellow-blue chromaticity (b*), chroma (C*), and hue (H*) of ‘Jinou 1’ were 77.54, 2.41, 4.65, 5.24, and 62.60, respectively, while those for ‘Nongda 5’ were 79.91, 0.86, 5.25, 5.32, and 80.70, respectively.
Moreover, chromatometric measurements revealed that mature fruit of ‘Jinou 1’ exhibited a deep red phenotype (Figure 1D), characterized by low lightness (L* = 32.84) and exceptionally high red chromaticity (a* = 26.02), with moderate yellow contribution (b* = 13.03). This combination produced a vivid color intensity (C* = 26.60) and distinct red hue angle (H* = 29.10). Conversely, mature fruit of ‘Nongda 5’ displayed a bright golden-yellow coloration (Figure 1E), demonstrating significantly higher brightness (L* = 51.23) and dominant yellow chromaticity (b* = 36.26), accompanied by minimal red pigmentation (a* = 9.17). Notably, ‘Nongda 5’ achieved remarkable color purity (C* = 75.81) with a hue angle (H* = 37.40) positioned in the yellow-green spectral range.

2.2. Metabolomic Analysis of Flowers and Fruits of ‘Jinou 1’ and ‘Nongda 5’

Metabolomic profiling was conducted to elucidate the anthocyanin profiles in floral tissues of ‘Jinou 1’ and ‘Nongda 5’. Based on the KEGG compound database coupled with multiple reaction monitoring (MRM)-based quantification, we identified a total of 49 color-associated metabolites, including eight cyanidin derivatives, eleven delphinidin derivatives, two malvidin derivatives, five pelargonidin derivatives, three paeonidin derivatives, seven petunidin derivatives, five proanthocyanidin derivatives and eight flavonoid derivatives. Comparative analysis revealed remarkable metabolic diversity between the two cultivars: ‘Jinou 1’ contained 47 detectable anthocyanins, while ‘Nongda 5’ presented 43. Notably, six anthocyanins were uniquely identified in ‘Jinou 1’ flowers, including cyanidin-3-O-rutinoside, cyanidin-3-O-glucoside, cyanidin-3-O-arabinoside, cyanidin-3,5-O-diglucoside, delphinidin-3-O-glucoside, and pelargonidin-3-O-glucoside. Conversely, delphinidin-3,5-O-diglucoside and paeonidin-3-(6-O-p-coumaroyl)-glucoside were exclusively detected in ‘Nongda 5’ (Supplementary Table S1).
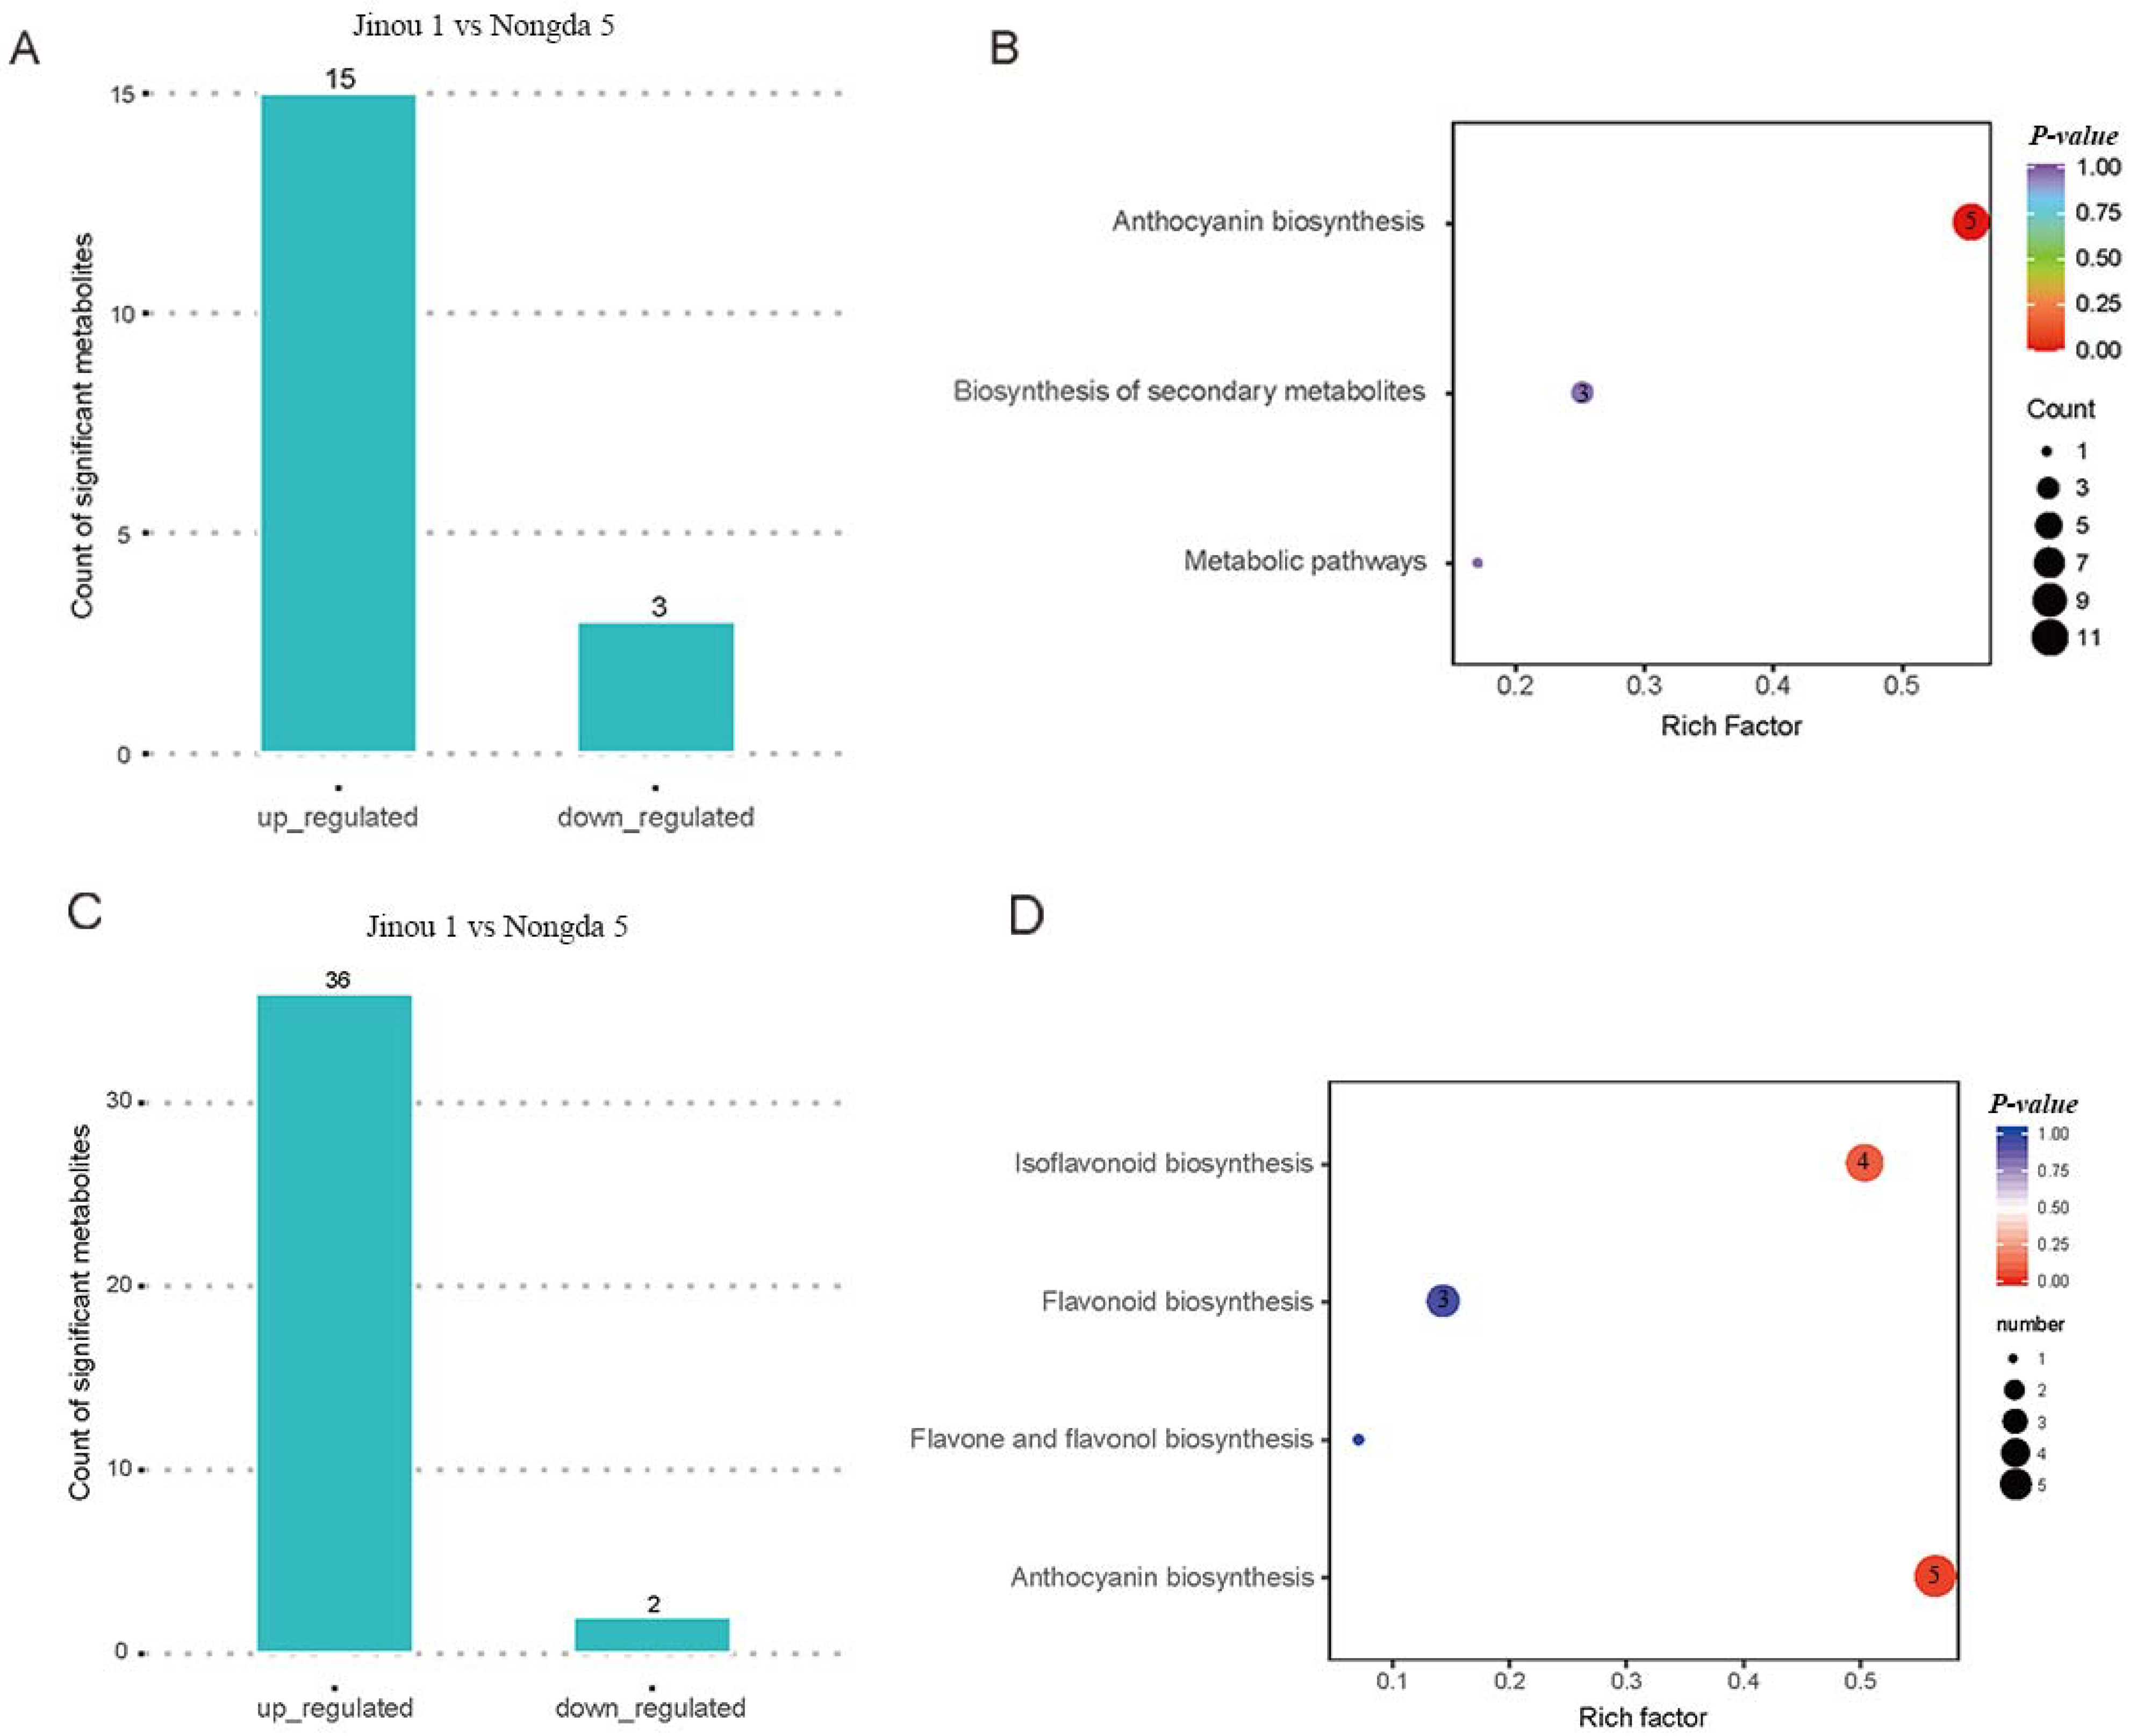
Applying rigorous selection criteria of fold change ≥2 and fold change ≤0.5, a total of 18 differential metabolites were identified, distinguishing ‘Jinou 1’ and ‘Nongda 5’. ‘Jinou 1’ displayed significantly elevated levels of 15 metabolites compared to ‘Nongda 5’, while three metabolites exhibited marked reduction (Figure 2A). Subsequent KEGG-based functional annotation of the 18 differential metabolites indicated that 11 metabolites were enriched in anthocyanin biosynthesis, three metabolites were mapped to the biosynthesis of secondary metabolites, and one metabolite was annotated in metabolic pathways. Notably, hierarchical clustering of pathway-specific metabolites highlighted profound compositional differences in anthocyanin biosynthesis between the two cultivars (Figure 2B).
Flavonoid profiles in the fruits of ‘Jinou 1’ and ‘Nongda 5’ were also characterized using metabolomic techniques, employing the same analytical pipeline as that in the floral metabolome study, this approach identified a total of 38 metabolites with significant differential abundance (≥2-fold change) (Figure 2C). KEGG functional annotation revealed that 12 metabolites were classified in the anthocyanin pathway, with five metabolites in anthocyanin biosynthesis, four metabolites in isoflavonoid biosynthesis, three metabolites in flavonoid biosynthesis, and one metabolite in flavone and flavonol biosynthesis (Figure 2D). Notably, eight anthocyanin-related metabolites including peonidin-O-hexoside, pelargonidin-3-O-malonylhexoside, cyanidin-3-O-glucoside, cyanidin-3,5-O-diglucoside, pelargonin, pelargonidin-3-O-beta-D-glucoside, peonidin-3-O-glucoside chloride, and malvidin-3-acetyl-5-diglucoside were uniquely detected in ‘Jinou 1’, while cyanidin-3-O-galactoside, cyanidin-O-syringic acid, cyanidin-3-O-rutinoside, and delphinidin-3-O-glucoside exclusively accumulated in ‘Nongda 5’ (Supplementary Table S2).
Principal component analysis (PCA) was conducted on the metabolomic datasets derived from flowers and fruits of ‘Jinou 1’ and ‘Nongda 5’ (Supplementary Figure S1). The PCA score plots revealed distinct clustering patterns between the two cultivars across both tissue types, with clear segregation along the primary principal components (PC1/PC2). This ordination pattern indicates profound metabolomic differences in floral and fruit metabolites between ‘Jinou 1’ and ‘Nongda 5’.

2.3. Transcriptomic Analysis of Flowers and Fruits of ‘Jinou 1’ and ‘Nongda 5’

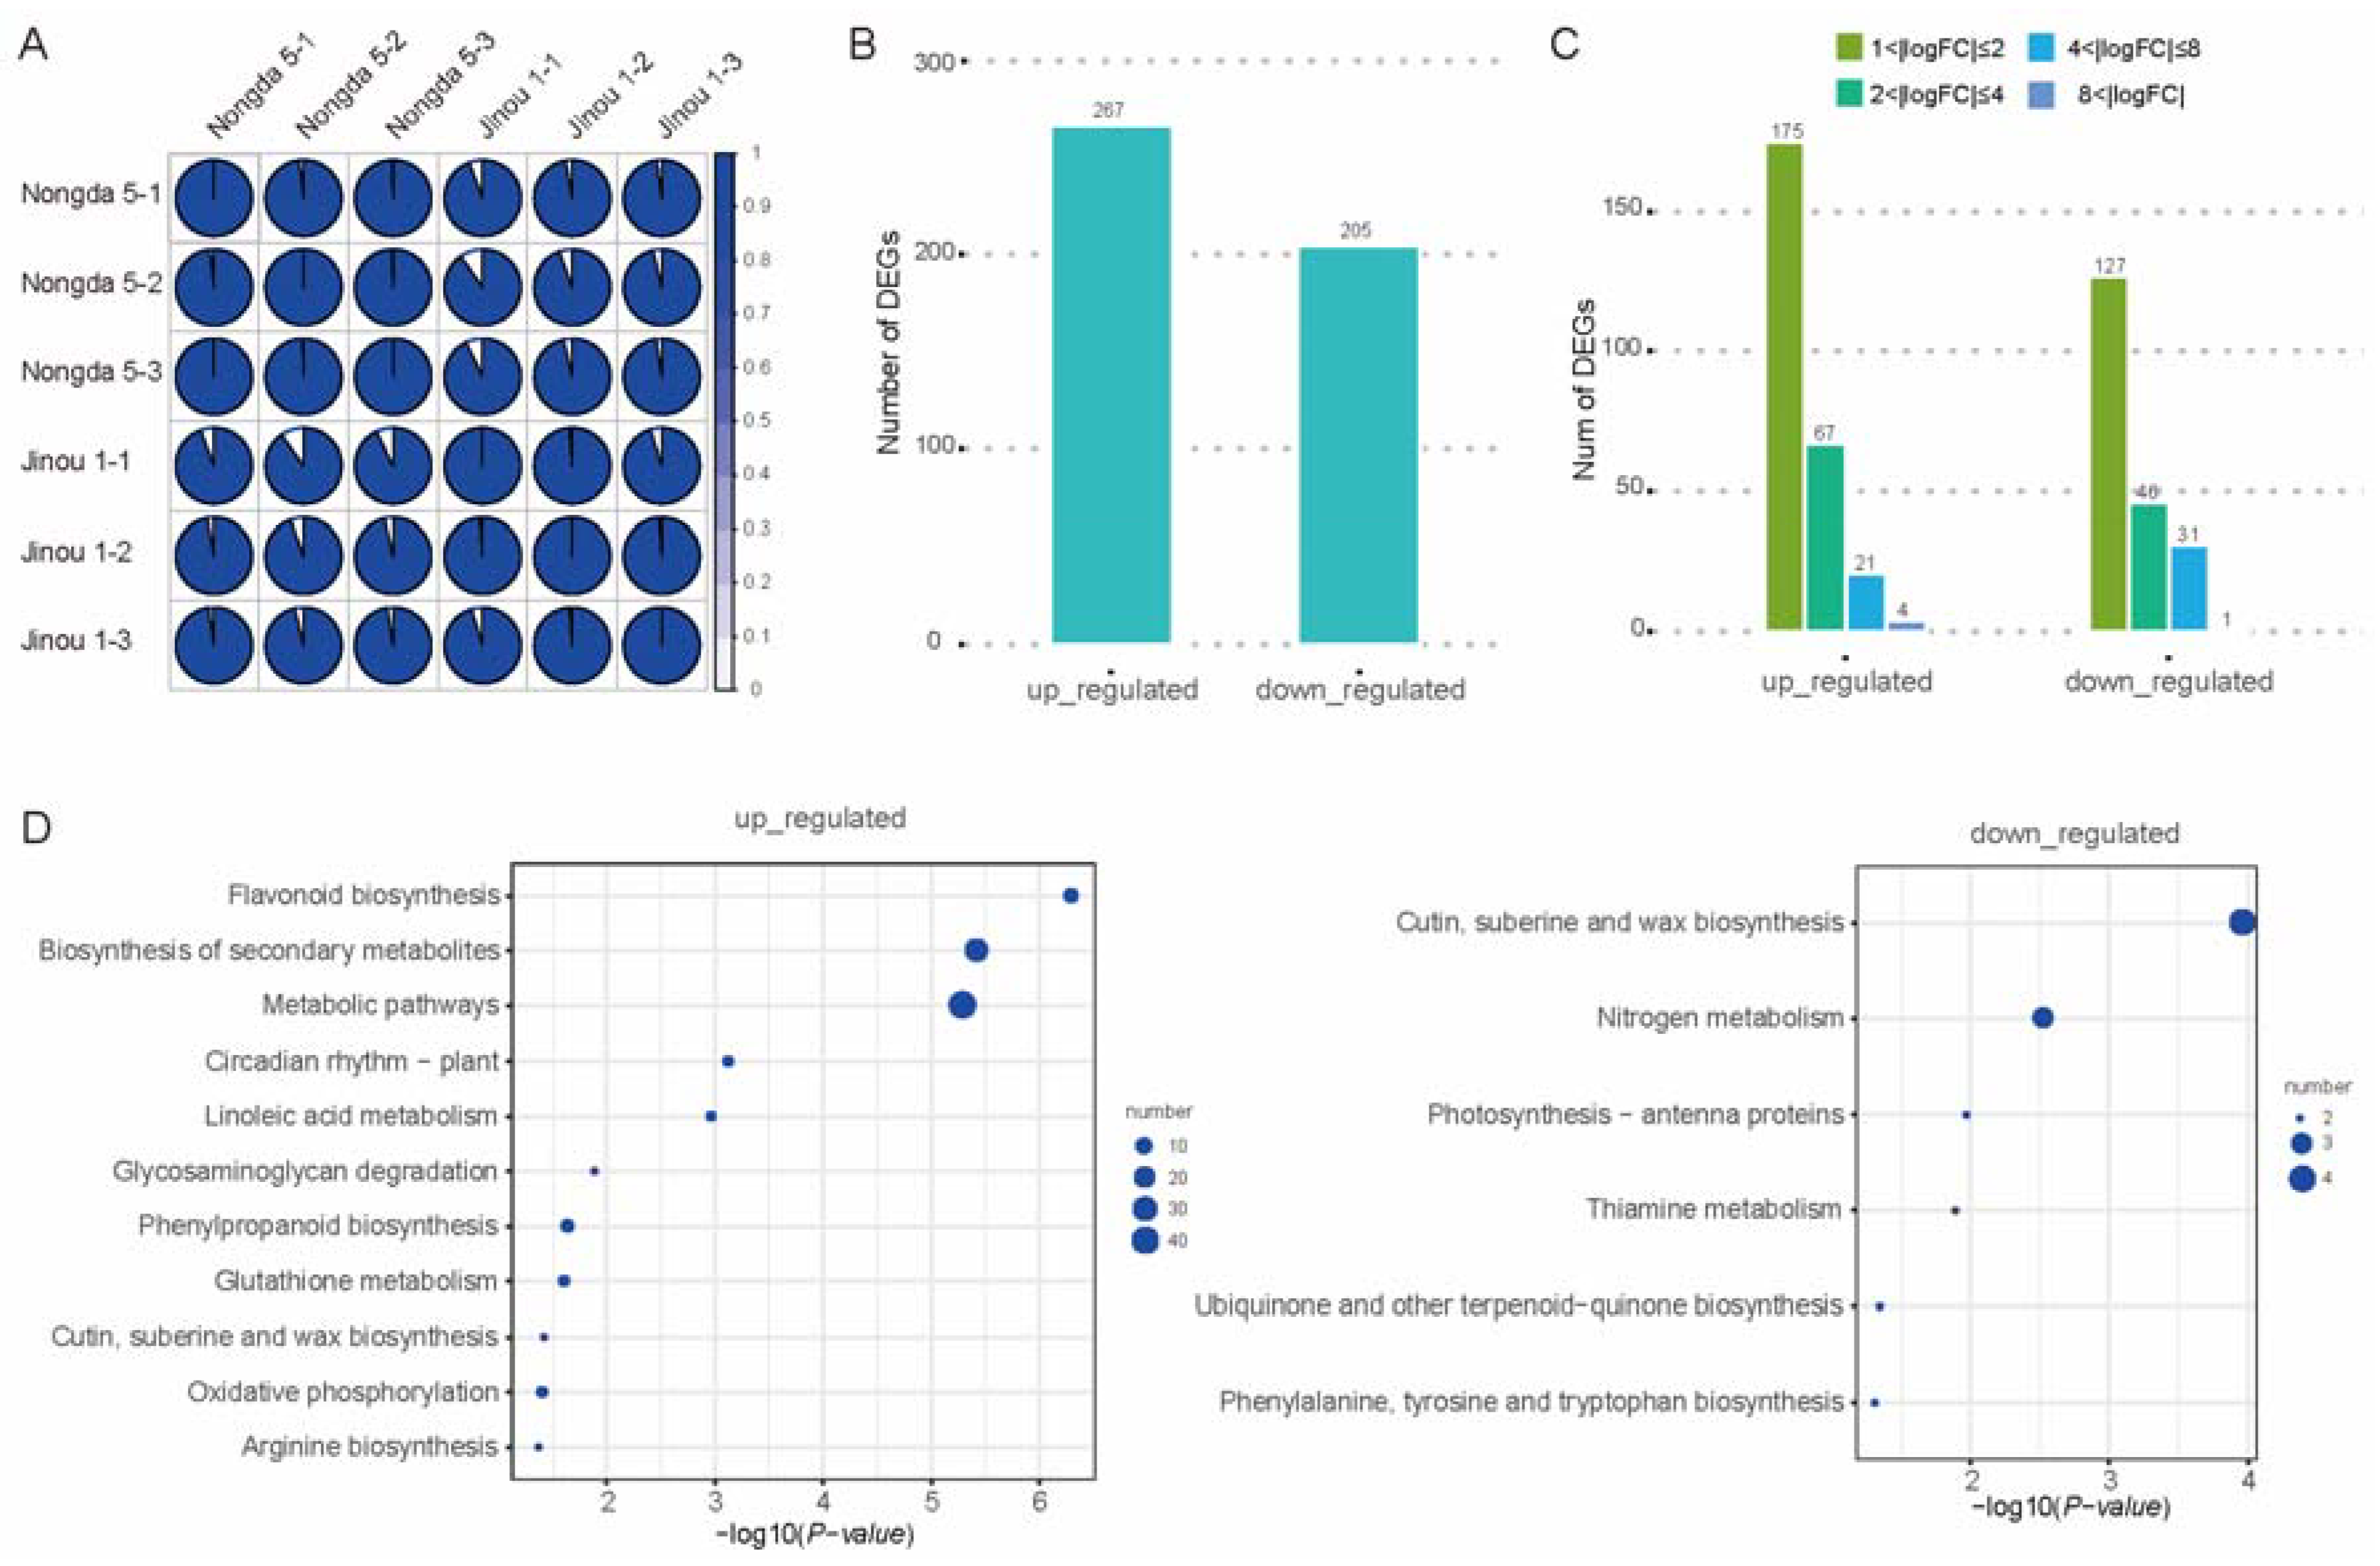
High-quality RNA extracted from fully bloomed petals of ‘Jinou 1’ and ‘Nongda 5’ was utilized to construct strand-specific cDNA libraries. Sequencing was performed on the NovaSeq 6000 platform, at Beijing Biomarker Bioinformatics Technology Co., Ltd. (Beijing, China), using paired-end 150 bp mode after rigorous quality control filtering (Figure 3A). Each biological replicate generated 20.7–27.9 million clean reads with Q30 scores exceeding 93.8%, ensuring robust data reliability. De novo transcriptome assembly using Trinity and all full-length transcripts were functionally annotated through homology searches against public databases. Differentially expressed genes (DEGs) were analyzed using the criteria |log2FC| > 1 and FDR < 0.05, and the results indicated that a total of 472 DEGs were identified between the two varieties. Specifically, 267 genes exhibited upregulated expression in ‘Jinou 1’ petals relative to ‘Nongda 5’, while 205 genes showed downregulation (Figure 3B,C). DEG enrichment analyses with standards p < 0.05 and p < 0.01 revealed that 118 genes were upregulated in ‘Jinou 1’, primarily distributed in metabolic pathways, biosynthesis of secondary metabolites, and flavonoid biosynthesis (Figure 3D).
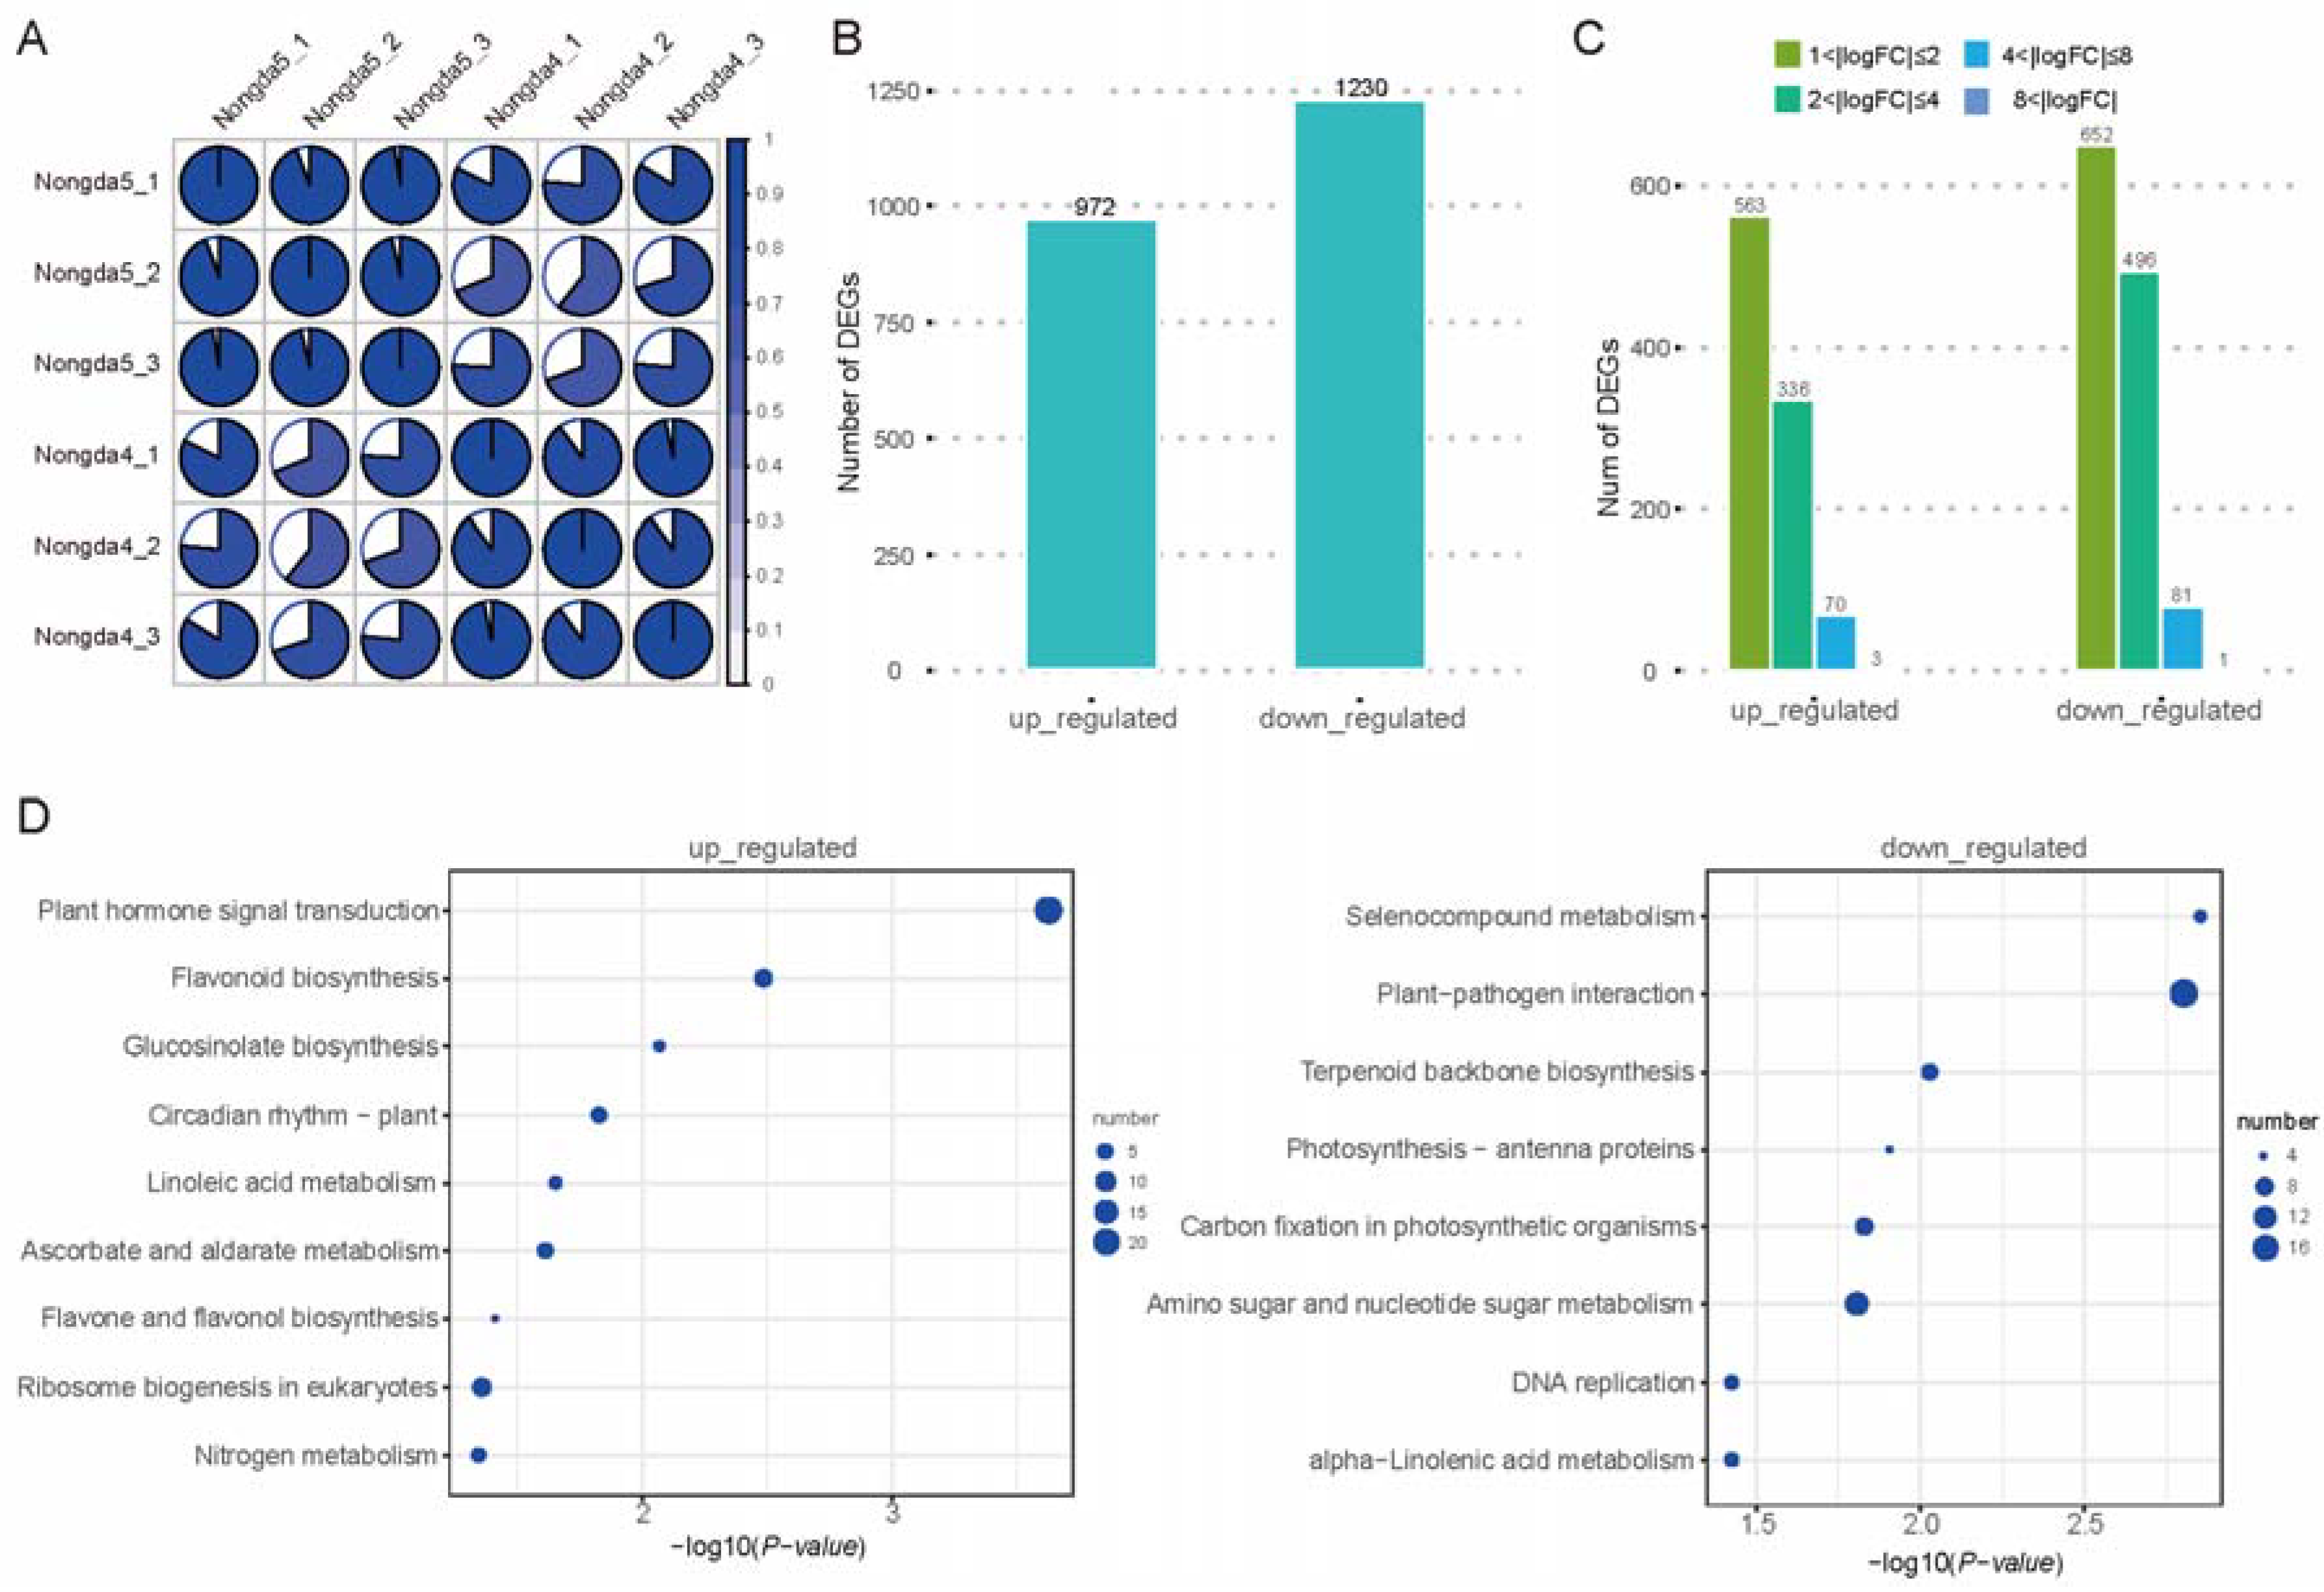
Mature fruits from ‘Jinou 1’ and ‘Nongda 5’ were subjected to high-throughput RNA sequencing, yielding a total of 40.55 Gb of high-quality data, with each sample achieving 6.08 Gb of clean data (Q30 > 93%) for further analysis (Figure 4A). Employing the same Trinity-based de novo assembly and differential expression analysis pipeline, we identified a total of 2202 DEGs between the two varieties. Compared to ‘Nongda 5’, ‘Jinou 1’ had 972 upregulated genes and 1230 downregulated genes (Figure 4B,C). KEGG analysis showed that 57 genes were upregulated in ‘Jinou 1’, primarily distributed in plant hormone signal transduction, ribosome biogenesis in eukaryotes, and flavonoid biosynthesis (Figure 4D).

2.4. Analysis of Anthocyanin Pathway Genes in Flowers and Fruits

Comparative transcriptomic analysis of anthocyanin biosynthesis pathways revealed genotype-specific expression patterns between ‘Jinou 1’ and ‘Nongda 5’. In floral tissues, six key structural genes (ChCHS1, ChCHS2, ChDFR, ChF3H, ChF3’H, and ChLAR) showed significantly higher expression in ‘Jinou 1’ compared to ‘Nongda 5’, while Ch4CL exhibited lower expression levels in ‘Jinou 1’ (Figure 5A). Fruit transcriptomes displayed more pronounced differential regulation, with all eight annotated anthocyanin pathway genes (ChPAL, Ch4CL, ChCHS1, ChDFR, ChF3H, ChF3’H, ChLDOX, ChLAR) showing significantly elevated expression in ‘Jinou 1’. Notably, Ch4CL was upregulated in ‘Jinou 1’ fruits, suggesting tissue-specific regulatory mechanisms (Figure 5A).
Comparative transcriptomic profiling also identified 19 transcription factors (TFs) associated with anthocyanin regulation, including 14 MYB, 3 WD40, and 2 bHLH family members. In the flower petals, five MYB encoding genes were annotated, with ChMYB5, ChMYB9, ChMYB10, and ChMYB12 showing significant upregulation in ‘Jinou 1’, while ChMYB8 displayed lower expression in ‘Jinou 1’. In the mature fruits, seven MYB genes, two WD genes, and one bHLH gene showed higher expression in ‘Jinou 1’, while three MYB genes, one WD gene, and one bHLH gene were upregulated in ‘Nongda 5’ (Figure 5B).

2.5. Correlation Analysis of Transcriptome and Metabolome of ‘Jinou 1’ and ‘Nongda 5’ Flowers and Fruits

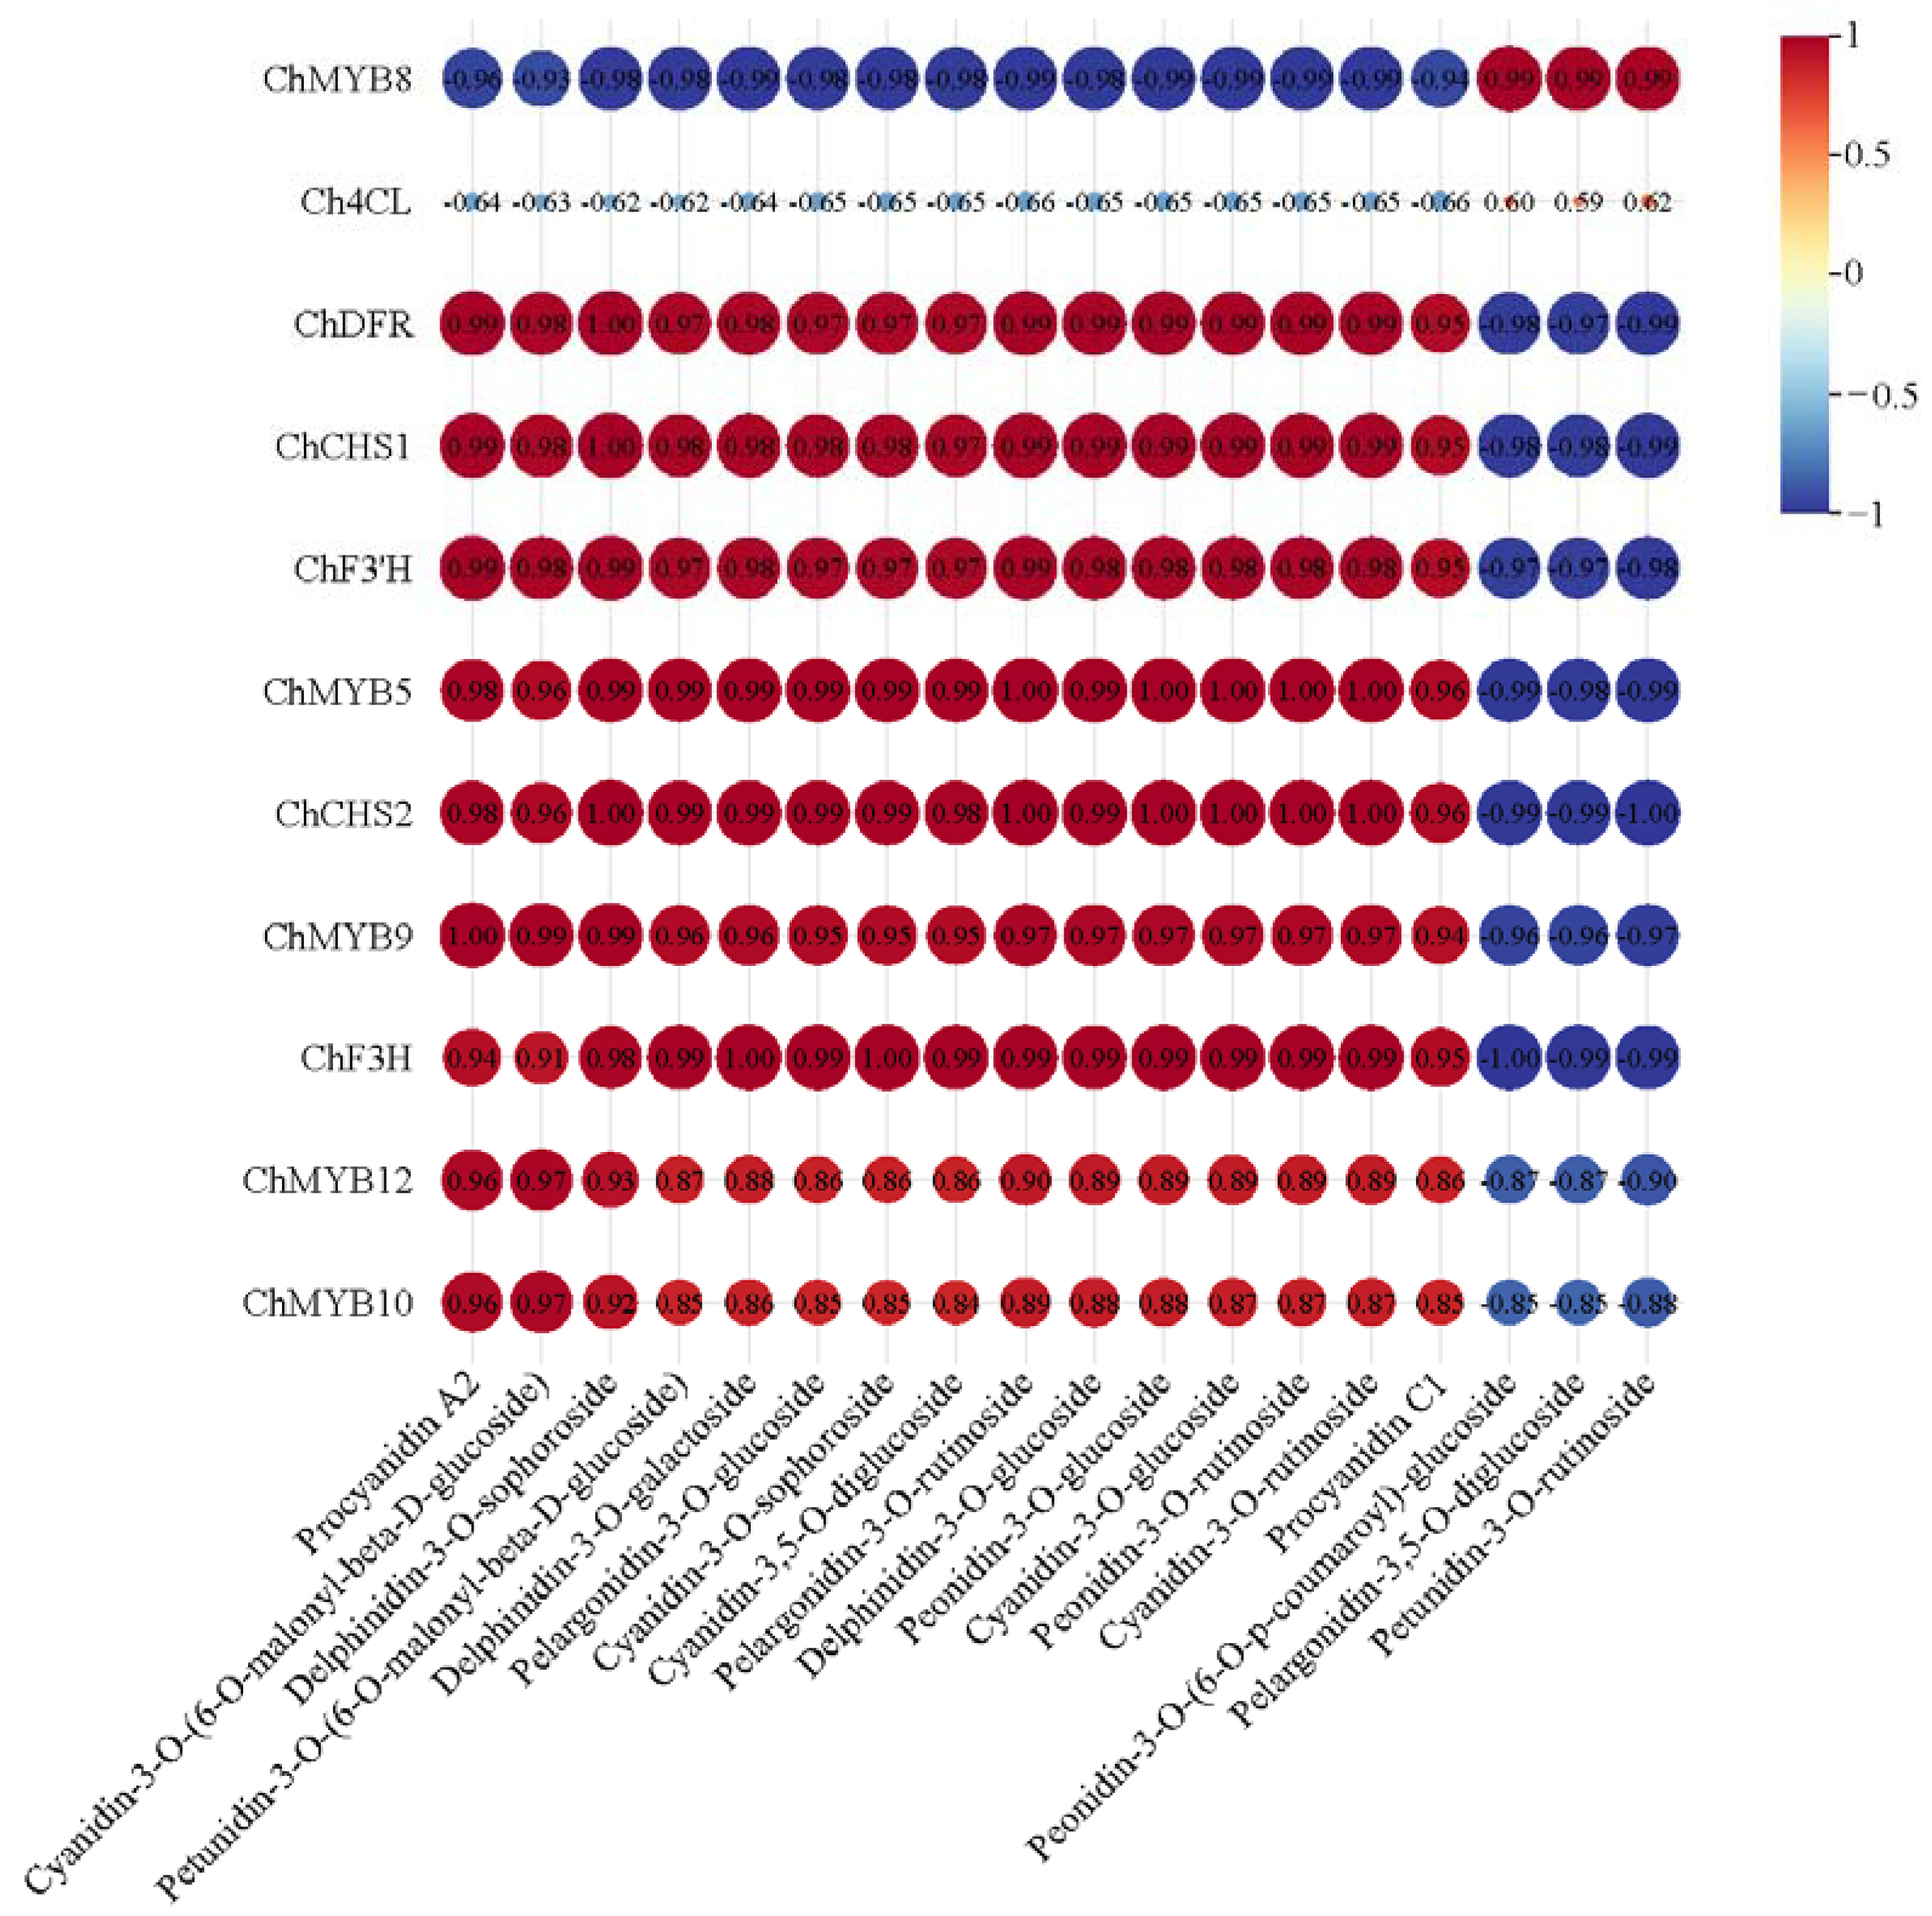
Integrated transcriptomic and metabolomic profiling of floral tissues from ‘Jinou 1’ and ‘Nongda 5’ revealed that three anthocyanin metabolites (peonidin-3-O-(6-O-p-coumaroyl)-glucoside, pelargonidin-3,5-O-diglucoside, and petunidin-3-O-rutinoside) were positively correlated with Ch4CL, but showing lower correlation with ChCHS1, ChCHS2, ChDFR, ChF3H, and ChF3’H. Additionally, these metabolites exhibited strong positive correlation with the MYB transcription factor encoding gene ChMYB8, yet displayed negative correlations with ChMYB5, ChMYB9, ChMYB10, and ChMYB12. The correlation relationships of the remaining 15 metabolites with structural genes of the anthocyanin pathway and MYB genes were the opposite (Figure 6).
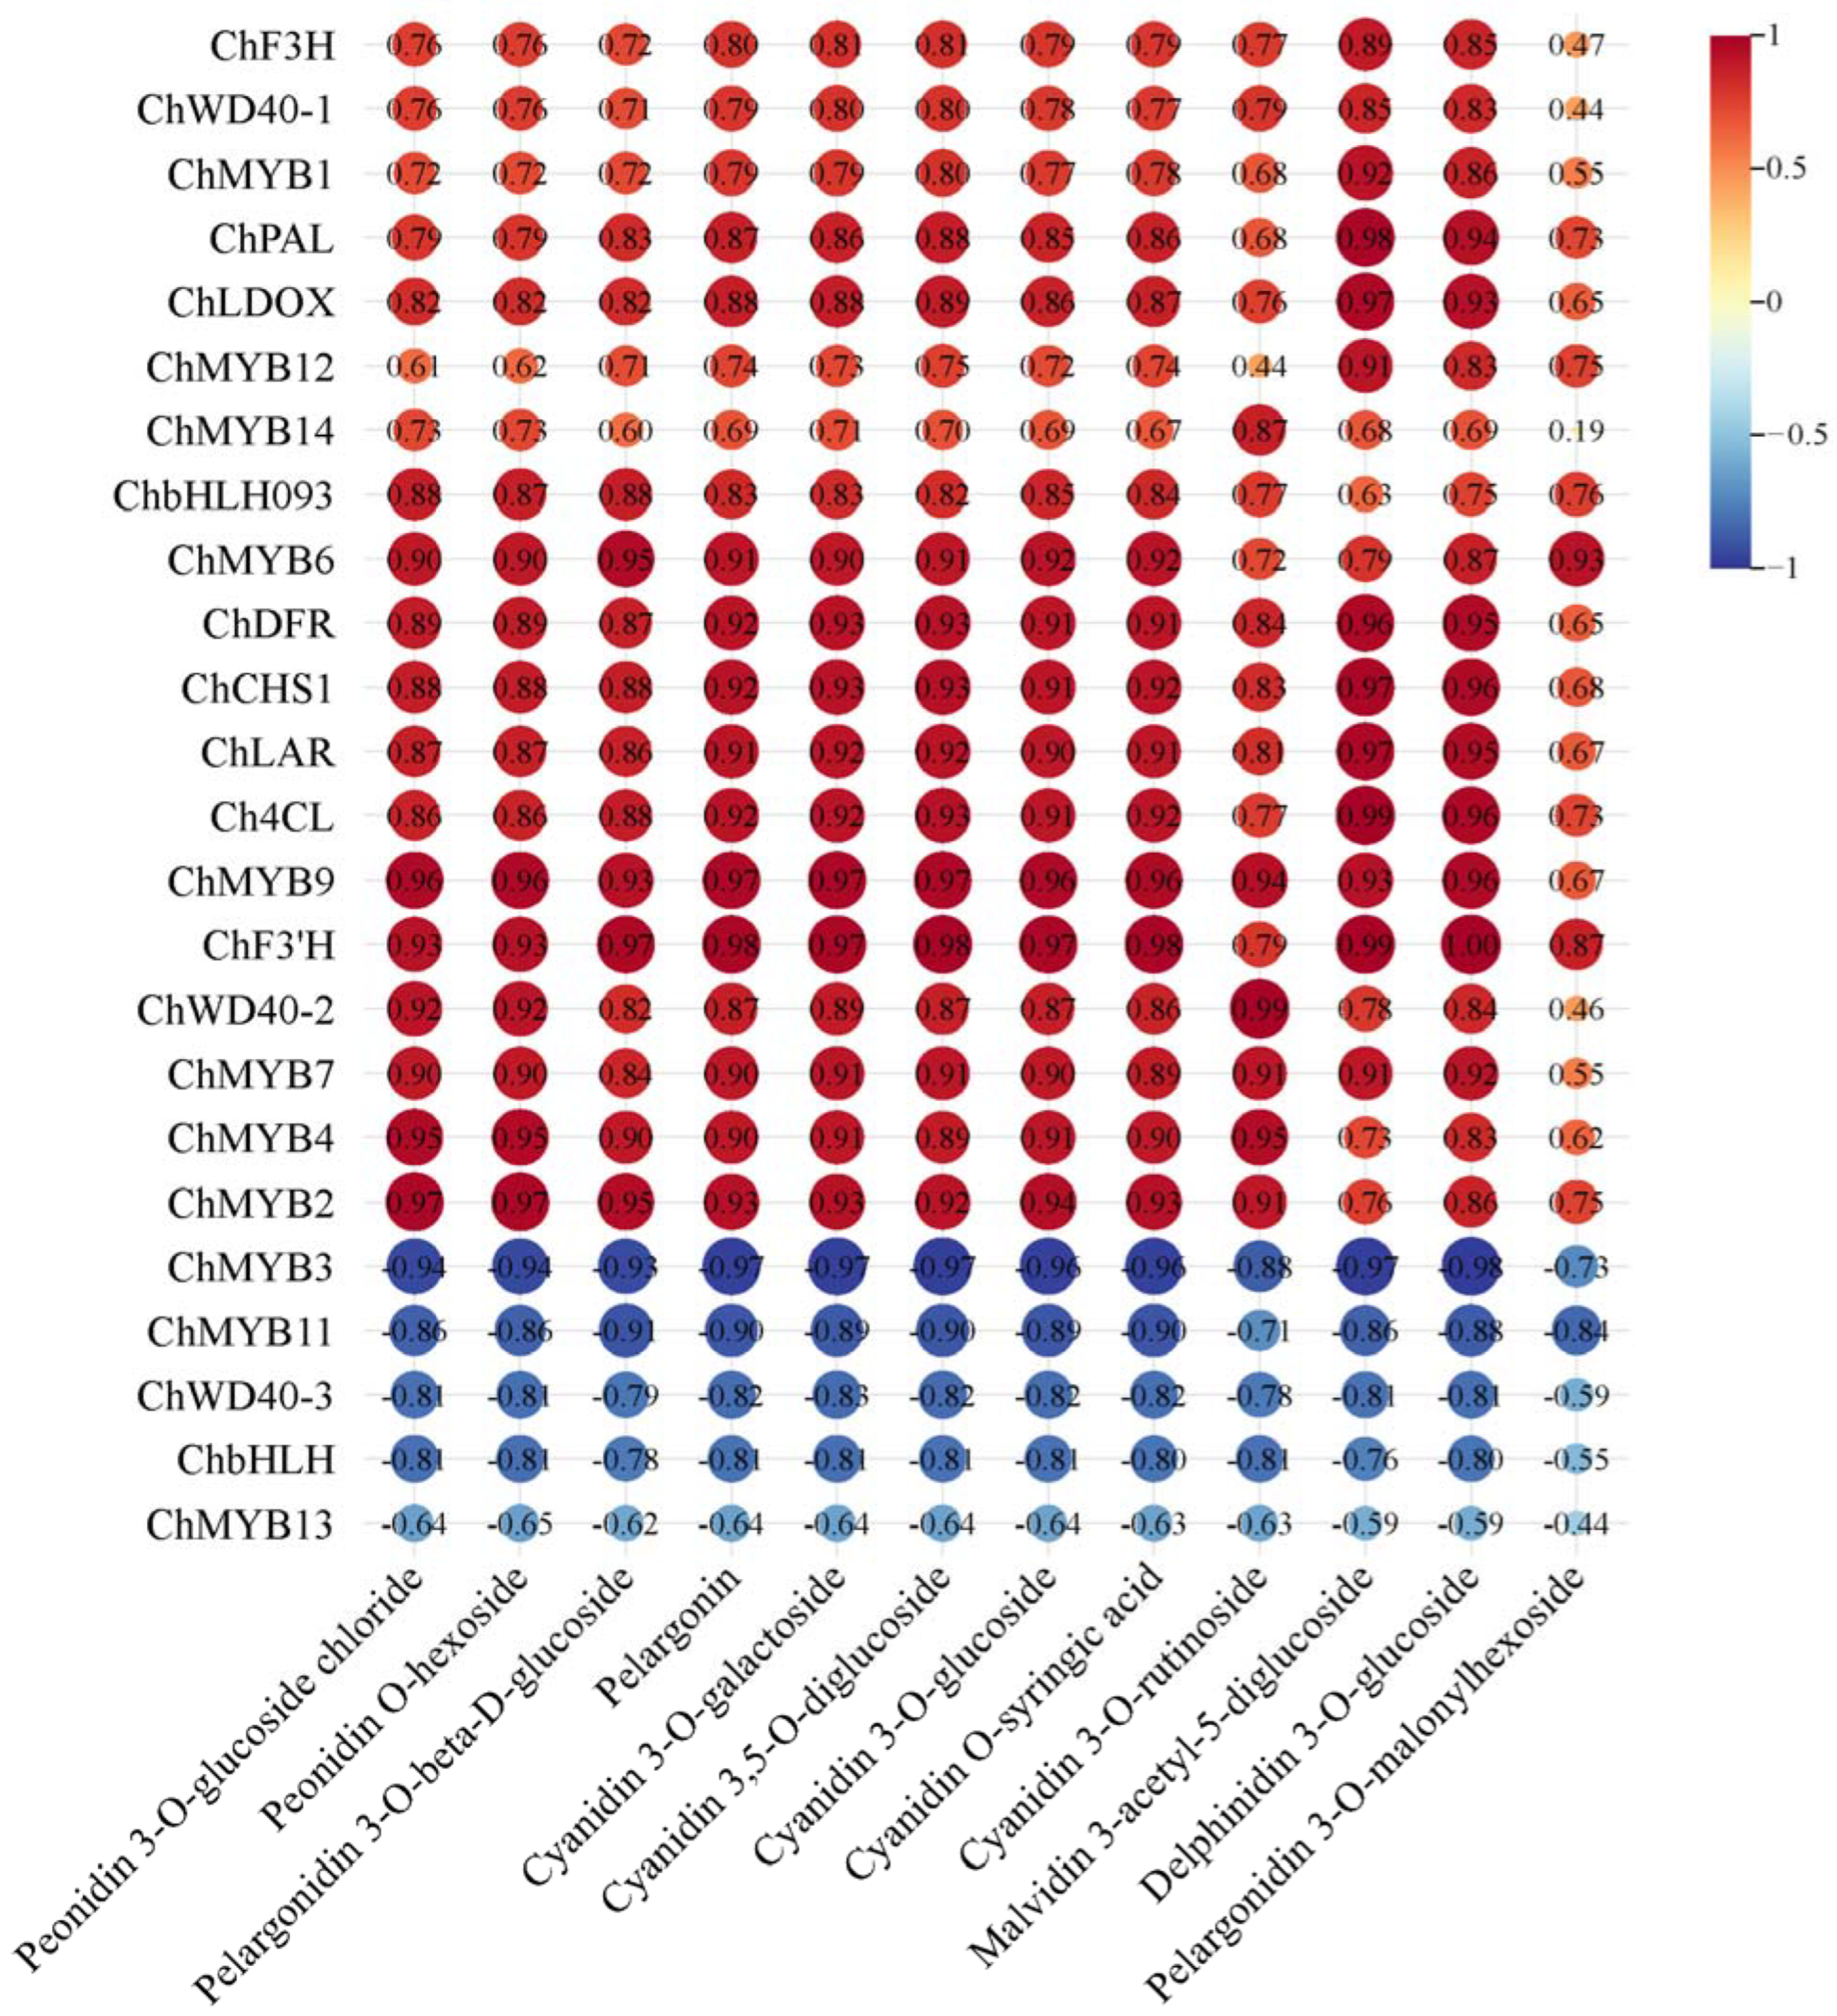
The combined analysis of the fruit transcriptome and metabolome from ‘Jinou 1’ and ‘Nongda 5’ indicated that among 12 detected anthocyanin metabolites, 11 metabolites showed significant positive correlations with eight structural genes (ChPAL, Ch4CL, ChCHS1, ChDFR, ChF3H, ChF3’H, ChLDOX, ChLAR). The exception was pelargonidin-3-O-malonylhexoside, which showed only weak positive association with these genes. Correlation network analysis between transcription factors and metabolites further elucidated that ChMYB3, ChMYB11, ChMYB13, ChWD40-3, and ChbHLH were negatively correlated with 12 metabolites, while the remaining 10 transcription factor encoding genes were positively correlated with the metabolites (Figure 7).

3. Discussion

Floral and fruit pigmentation represent critical traits that significantly influence ornamental and commercial value in horticultural plants [20,21]. In our previous study, the L* value and b* value of ‘Nongda 5’ were higher than those of ‘Jinou 1’, and the a* value of ‘Jinou 1’ was higher than that of ‘Nongda 5’ [18]. In this study, the color parameter differences observed in flowers and fruits of ‘Jinou 1’ and ‘Nongda 5’ indicated that the contrasting pigmentation phenotypes of C. humilis varieties ‘Jinou 1’ (pink flowers, red fruits) and ‘Nongda 5’ (white flowers, yellow fruits) provide an exceptional model system for dissecting color formation mechanisms.
Anthocyanins are widely distributed water-soluble pigments in plants, imparting various colors to plant organs and tissues [22]. Light-induced anthocyanin biosynthesis experiments demonstrated enhanced pigment accumulation correlating with intensified petal coloration in Lilium spp. and Chrysanthemum morifolium [23,24]. In Paeonia suffruticosa Andr., cyanidin-3,5-di-O-glucoside (Pn3G5G) was identified as the key pigment responsible for the formation of characteristic floral spots [25]. Similarly, Rhododendron rex petal pigmentation was attributed to a combination of four anthocyanins: pelargonidin, cyanidin-3,5-O-diglucoside, cyanidin-3-O-glucoside, and delphinidin [26]. Comparative metabolomics across Lagerstroemia indica cultivars revealed cyanidin, delphinidin, petunidin, and malvidin as the primary differentiators of flower color diversity [27]. This study performed targeted sequencing of the anthocyanin metabolome in the petals of two C. humilis varieties, ‘Jinou 1’ and ‘Nongda 5’, identifying 49 distinct anthocyanin metabolites, with eight differentially accumulated metabolites (Supplementary Figure S2). Among these, six uniquely accumulated metabolites in ‘Jinou 1’ belonged to cyanidin, delphinidin, and pelargonidin subclasses. Further analysis indicated that cyanidin-3-O-glucoside exhibited the highest concentration differential, suggesting that this compound is a major contributor to the flower color difference between ‘Jinou 1’ and ‘Nongda 5’.
In studies of substances responsible for fruit color differences, cyanidin has been identified as the primary anthocyanin modulating chromatic diversity across fruit species [28,29,30]. In this study, 12 different anthocyanin metabolites were detected in the petals of ‘Jinou 1’ and ‘Nongda 5’, including five cyanidins, three pelargonidins, two paeonidins, one malvidin, and one delphinidin. These could be the primary substances responsible for the distinct fruit color phenotypes of ‘Jinou 1’ and ‘Nongda 5’ (Supplementary Figure S3). Notably, cyanidin-3-O-glucoside emerged as the sole anthocyanin uniquely expressed in ‘Jinou 1’ fruits and differentially accumulated in petals between the two cultivars. Thus, we speculate that cyanidin-3-O-glucoside is a major contributor to the color differences in both the petals and fruits of ‘Jinou 1’ and ‘Nongda 5’.
The structural genes governing anthocyanin biosynthesis have been extensively characterized across plant species [31]. These genes are hierarchically organized into two functional modules based on their catalytic roles in the metabolic cascade: early biosynthetic genes (EBGs) encompassing CHS, CHI, F3H, and F3’H, and late biosynthetic genes (LBG) including F3’5’H, DFR, ANS, and UFGT [32]. EBGs are typically located upstream in the anthocyanin synthesis pathway; manipulating these genes can alter the flower or fruit color of plants. For instance, silencing the CHS gene in petunias can change the flower color from purple to white, while reducing CHS activity in tomatoes can lighten the fruit color [33,34]. LBGs, operating downstream, catalyze the formation of colored anthocyanins from their colorless precursors. For example, DFR is essential for producing leucoanthocyanidins (colorless delphinidin, pelargonidin, and cyanidin), and mutations in the ANS gene can block the conversion of leucoanthocyanidin to colored pigments [35,36,37]. Previous studies have found that the expression levels of ChCHS, ChF3H, and ChDFR genes were positively correlated with anthocyanin content, and the expression levels in ‘Jinou 1’ fruits were higher than those in ‘Nongda 5’ fruits [18]. In this study, the expression levels of ChCHS1, ChDFR, ChF3H, and ChF3’H were higher in the petals and fruits of ‘Jinou 1’ compared to ‘Nongda 5’. The combined results of transcriptome and metabolome analyses indicated that these four structural genes were positively correlated with anthocyanin metabolites, suggesting their significant roles in the accumulation pathway of anthocyanins in C. humilis flowers and fruits. Notably, tissue-specific expression divergence was also observed for other pathway genes. ChPAL, ChLDOX, and ChLAR exhibited differential expression patterns exclusively in fruits, while Ch4CL displayed reciprocal expression trends between flowers and fruits of the two varieties. These findings suggest complex regulatory networks underpin variety-specific anthocyanin profiles, with distinct gene sets controlling pigmentation in floral versus fruit tissues.
MYB, bHLH, and WD transcription factors promote or inhibit the biosynthesis of anthocyanins by recognizing and binding to specific promoter regions of structural genes. MYB11, MYB12, MYB111, and MYB75/PAP1 can regulate the expression of EBGs [38]. Recent studies have shown that MYB, bHLH, and WD can form MBW complexes that enhance or suppress the expression of structural genes involved in the anthocyanin biosynthetic pathway [39]. The R2R3-MYB forms a complex with bHLH and WD to promote the expression of DFR, ANS, and UFGT, leading to the accumulation of anthocyanins in plants [40,41]. In this study, 10 MYB genes, two WD genes, and one bHLH gene were positively correlated with anthocyanin pathway metabolites, suggesting that these genes may play significant roles in the formation of anthocyanins in flowers and fruits of C. humilis. ChMYB3 was negatively correlated with flower anthocyanin metabolites, while ChMYB8, ChMYB11, ChMYB13, ChWD40-3, and ChbHLH were negatively correlated with fruit anthocyanin metabolites, implying combinatorial control by multiple transcription factors across tissues.. The common MYB genes found in both flowers and fruits were ChMYB9 and ChMYB12, both of which were positively correlated with anthocyanin metabolites. Notably, ChMYB9 showed a highly significant positive correlation with anthocyanin metabolites. Therefore, we hypothesize that ChMYB9 may be a key MYB encoding gene in the anthocyanin biosynthetic pathway of C. humilis flowers and fruits.
While this study offers novel insights into the transcriptional regulation of anthocyanin biosynthesis in C. humilis, several limitations warrant consideration. Notably, the candidate genes associated with floral and fruit coloration were identified through correlation analyses, yet no functional validation of these genes was performed. To address these gaps, future research should prioritize functional characterization of ChMYB9. Specifically, homologous or heterologous overexpression and knockdown studies in model systems or C. humilis itself could verify whether ChMYB9 acts as a pleiotropic regulator of both floral and fruit coloration.

4. Materials and Methods

4.1. Materials

The C. humilis materials used in this experiment were collected from the C. humilis germplasm repository at Shanxi Agricultural University, located in Taigu District, Jinzhong City, Shanxi Province (37°26′ N, 112°32′ E). Mature flowers and fruits of ‘Jinou 1’ and ‘Nongda 5’ were collected. All materials were stored at −80 °C.
Color parameters (L*, a*, and b* values) of 20 flowers and fruits from each variety were measured using a CR8 colorimeter (3nh, Guangzhou, China). The hue angle H* is a comprehensive color metric calculated by H* = −arctan (b*/a*).

4.2. Metabolomic Analysis

The sample was freeze-dried, ground into powder (30 Hz, 1.5 min), and stored at −80 °C until needed. A 50 mg amount of powder was weighed and extracted with 0.5 mL methanol/water/hydrochloric acid (500:500:1, V/V/V). Then, the extract was vortexed for 5 min and ultrasound for 5 min and centrifuged at 12,000× g under 4 °C for 3 min. The residue was re-extracted by repeating the above steps again under the same conditions. The supernatants were collected and filtrated through a membrane filter (0.22 μm, Anpel) before LC-MS/MS analysis. Three replicates of each sample were analyzed.
Flavonoids and anthocyanins contents were detected by MetWare (http://www.metware.cn/) based on the AB Sciex QTRAP6500 LC-MS/MS platform was provided by Wuhan Metware Biotechnology Co., Ltd. (Wuhan, China). Principal component analysis (PCA) was performed as described by Yue et al., 2019 [42].

4.3. Transcriptome Analysis

Total RNA from flowers and fruits of the ‘Jinou 1’ and ‘Nongda 5’ varieties was extracted using the Trizol reagent as described previously [43]. Based on the sequencing by synthesis, Illumina sequencing was performed at Beijing Biomarker Bioinformatics Technology Co., Ltd. (Beijing, China).
The reads were mapped to the reference Prunus persica v2.1 [44] using HISAT2, and the aligned reads were then assembled into transcripts using StringTie [45]. According to the comparison results of HISAT2, the expression levels of all genes in each sample were calculated using the fragments per kilobase of transcript per million mapped reads (FPKM) value as the measurement index of gene expression level.

4.4. Differential Expression Analysis and Gene Annotation

DESeq2 v1.46.0 software was used to calculate the expression of 3 biological replicates, and DEGs were analyzed using the criteria |log2FC| > 1 and FDR < 0.05. The identified DEGs were compared using the Non-Redundant Protein Sequence, Nucleotide Sequence, Uniprot, Clusters of Orthologous Groups, Pfam, Gene Ontology, and KEGG databases to obtain gene annotation information [46].

4.5. Statistical Analysis

Data were analyzed in Microsoft Excel v. 2023. Pearson’s correlation analysis was also performed using SPSS Statistics 27. Tbtools v2.030 was used to draw figures. Heatmaps illustrating the expression patterns of genes were generated using TBtools [47].

5. Conclusions

In conclusion, anthocyanins emerge as the primary determinants of color divergence in floral and fruit tissues between C. humilis varieties. Specifically, cyanidin, pelargonidin, paeonidin, and delphinidin were characterized as the dominant pigments driving color polymorphisms in ‘Jinou 1’ and ‘Nongda 5’. Transcriptomic profiling revealed cultivar-specific expression patterns of core anthocyanin biosynthetic genes (ChCHS1, ChDFR, ChF3H, ChF3’H), with significantly elevated transcripts in ‘Jinou 1’ relative to ‘Nongda 5’, aligning with its deeper pigmentation phenotype. Critically, integrated metabolome–transcriptome association analyses pinpointed ChMYB9 as a key regulatory hub, exhibiting robust positive correlations with anthocyanin metabolites in both flowers and fruits. These findings advance our mechanistic understanding of floral and fruit color formation in this species and lay a foundation for trait-specific genetic engineering of C. humilis.

Supplementary Materials

The following supporting information can be downloaded at: https://www.mdpi.com/article/10.3390/plants14071103/s1, Figure S1: PCA scores of metabolites in flower (A) and fruit (B). Figure S2: Heatmap of differential metabolites in C. humilis flowers; Figure S3: Heatmap of differential metabolites in C. humilis fruits; Table S1: A list of metabolites identified in C. humilis flowers; Table S2: A list of metabolites identified in C. humilis fruits.

Author Contributions

Conceptualization, S.Z.; methodology, T.L. and S.L.; formal analysis, X.Q.; investigation, Y.Y.; resources, P.W.; writing—original draft preparation, S.Z.; writing—review and editing, S.Z., J.Z., L.J. and X.M.; supervision, S.Z.; project administration, X.M. All authors have read and agreed to the published version of the manuscript.

Funding

This work was supported by the Youth Scientific Research Project of Shanxi Province (Grant No. 20210302124149), the Shanxi Provincial Doctoral Graduates and Postdoctoral Researchers Working in Shanxi Reward Fund Research Project (Grant No. SXBYKY2021078), and the Shanxi Agricultural University 2019 Science and Technology Innovation Doctoral Research Start-up Fund Project (Grant No. 2018YJ06).

Data Availability Statement

The raw data were submitted to the China National GeneBank Database (PRJCA036726 and PRJCA036727).

Conflicts of Interest

The authors declare no conflicts of interest.

References

  1. Wang, P.; Mu, X.; Du, J.; Gao, Y.; Bai, D.; Jia, L.; Zhang, J.; Ren, H.; Xue, X. Flavonoid content and radical scavenging activity in fruits of Chinese dwarf cherry (Cerasus humilis) genotypes. J. For. Res. 2018, 29, 55–63. [Google Scholar] [CrossRef]
  2. Du, J.J. Prunus Humilis (Ouli), a Unique Forest Fruit Species Endemic to China; China Agricultural Science and Technology Press Co., Ltd.: Beijing, China, 2023. [Google Scholar]
  3. Koes, R.; Verweij, W.; Quattrocchio, F. Flavonoids: A colorful model for the regulation and evolution of biochemical pathways. Trends Plant Sci. 2005, 10, 236–242. [Google Scholar]
  4. Lee, S.H.; Kim, S.H.; Park, T.K.; Kim, Y.P.; Lee, J.W.; Kim, T.W. Transcription factors BZR1 and PAP1 cooperate to promote anthocyanin biosynthesis in Arabidopsis shoots. Plant Cell 2024, 36, 3654–3673. [Google Scholar]
  5. Shi, Q.; Du, J.; Zhu, D.; Li, X.; Li, X. Metabolomic and transcriptomic analyses of anthocyanin biosynthesis mechanisms in the color mutant Ziziphus jujuba cv. Tailihong. J. Agric. Food Chem. 2020, 68, 15186–15198. [Google Scholar]
  6. Yi, D.; Zhang, H.; Lai, B.; Liu, L.; Pan, X.; Ma, Z.; Wang, Y.; Xie, J.; Shi, S.; Wei, Y. Integrative analysis of the coloring mechanism of red Longan pericarp through metabolome and transcriptome analyses. J. Agric. Food Chem. 2021, 69, 1806–1815. [Google Scholar]
  7. Dixon, R.A.; Liu, C.; Jun, J.H. Metabolic engineering of anthocyanins and condensed tannins in plants. Curr. Opin. Biotechnol. 2013, 24, 329–335. [Google Scholar] [CrossRef] [PubMed]
  8. Li, C.; Qiu, J.; Yang, G.; Huang, S.; Yin, J. Isolation and characterization of a R2R3-MYB transcription factor gene related to anthocyanin biosynthesis in the spathes of Anthurium andraeanum (Hort.). Plant Cell Rep. 2016, 35, 2151–2165. [Google Scholar] [PubMed]
  9. Chen, K.; Liu, H.; Lou, Q.; Liu, Y. Ectopic expression of the grape hyacinth (Muscari armeniacum) R2R3-MYB transcription factor gene, MaAN2, induces anthocyanin accumulation in tobacco. Front. Plant Sci. 2017, 8, 1722–1723. [Google Scholar]
  10. Zhang, S.; Wang, H.; Wang, T.; Liu, W.; Zhang, J.; Fang, H.; Zhang, Z.; Peng, F.; Chen, X.; Wang, N. MdMYB305-MdbHLH33-MdMYB10 regulates sugar and anthocyanin balance in red-fleshed apple fruits. Plant J. 2023, 113, 1062–1079. [Google Scholar]
  11. Zhang, L.; Zhang, J.; Wei, B.; Li, Y.; Fang, X.; Zhong, Y.; Wang, L. Transcription factor MdNAC33 is involved in ALA-induced anthocyanin accumulation in apples. Plant Sci. 2024, 339, 111949. [Google Scholar] [CrossRef]
  12. Lepiniec, L.; Debeaujon, I.; Routaboul, J.M.; Baudry, A.; Pourcel, L.; Nesi, N.; Caboche, M. Genetics and biochemistry of seed flavonoids. Annu. Rev. Plant Biol. 2006, 57, 405–430. [Google Scholar] [CrossRef]
  13. Xu, W.; Dubos, C.; Lepiniec, L. Transcriptional control of flavonoid biosynthesis by MYB-bHLH-WDR complexes. Trends Plant Sci. 2015, 20, 176–185. [Google Scholar] [CrossRef] [PubMed]
  14. Gonzalez, A.; Zhao, M.; Leavitt, J.M.; Lloyd, A.M. Regulation of the anthocyanin biosynthetic pathway by the TTG1/b HLH/Myb transcriptional complex in Arabidopsis seedlings. Plant J. 2008, 53, 814–827. [Google Scholar] [CrossRef]
  15. Zhou, H.; Peng, Q.; Zhao, J.; Owiti, A.; Ren, F.; Liao, L.; Wang, L.; Deng, X.; Jiang, Q.; Han, Y. Multiple R2R3-MYB transcription factors involved in the regulation of anthocyanin accumulation in peach flower. Front. Plant Sci. 2016, 7, 1557. [Google Scholar] [CrossRef] [PubMed]
  16. Li, C.; Wu, J.; Hu, K.D.; Wei, S.W.; Sun, H.Y.; Hu, L.Y.; Han, Z.; Yao, G.F.; Zhang, H. PyWRKY26 and PybHLH3 cotargeted the PyMYB114 promoter to regulate anthocyanin biosynthesis and transport in red-skinned pears. Hortic. Res. 2020, 7, 37. [Google Scholar] [CrossRef] [PubMed]
  17. He, G.; Zhang, R.; Jiang, S.; Wang, H.; Ming, F. The MYB transcription factor RcMYB1 plays a central role in rose anthocyanin biosynthesis. Hortic. Res. 2023, 10, uhad080. [Google Scholar] [CrossRef]
  18. Yang, R.; Yang, Y.; Hu, Y.; Yin, L.; Qu, P.; Wang, P.; Mu, X.; Zhang, S.; Xie, P.; Cheng, C.; et al. Comparison of bioactive compounds and antioxidant activities in differentially pigmented Cerasus humilis fruits. Molecules 2023, 28, 6272. [Google Scholar] [CrossRef]
  19. Hu, Y.; Gong, Z.; Yan, Y.; Zhang, J.; Shao, A.; Li, H.; Wang, P.; Zhang, S.; Cheng, C.; Zhang, J. ChBBX6 and ChBBX18 are positive regulators of anthocyanins biosynthesis and carotenoids degradation in Cerasus humilis. Int. J. Biol. Macromol. 2024, 282, 137195. [Google Scholar] [CrossRef]
  20. Zhao, D.; Tao, J. Recent advances on the development and regulation of flower color in ornamental plants. Front Plant Sci. 2015, 6, 261. [Google Scholar] [CrossRef]
  21. Fu, J.; Wu, Q.; Wang, X.; Sun, J.; Liao, L.; Li, L.; Xu, Q. A novel histone methyltransferase gene CsSDG40 positively regulates carotenoid biosynthesis during citrus fruit ripening. J. Integr. Agric. 2024, 23, 2633–2648. [Google Scholar] [CrossRef]
  22. Cipollini, M.; Levey, D.J. Antifungal activity of Solanum fruit glycoalkaloids: Implications for frugivory and seed dispersal. Ecology 1997, 78, 799–809. [Google Scholar] [CrossRef]
  23. Gao, Z.; Sun, Y.; Zhu, Z.; Ni, N.; Sun, S.; Nie, M.; Du, W.; Irfan, M.; Chen, L.; Zhang, L. Transcription factors LvBBX24 and LvbZIP44 coordinated anthocyanin accumulation in response to light in lily. Hortic. Res. 2024, 11, uhae211. [Google Scholar] [CrossRef] [PubMed]
  24. Zhou, L.J.; Peng, J.; Chen, C.; Wang, Y.; Wang, Y.; Li, Y.; Song, A.; Jiang, J.; Chen, S.; Chen, F. CmBBX28-CmMYB9a module regulates petal anthocyanin accumulation in response to light in Chrysanthemum. Plant Cell Environ. 2025, early view. [Google Scholar] [CrossRef]
  25. Luan, Y.; Tang, Y.; Wang, X.; Xu, C.; Tao, J.; Zhao, D. Tree peony R2R3-MYB transcription factor PsMYB30 promotes petal blotch formation by activating the transcription of anthocyanin synthase gene. Plant Cell Physiol. 2022, 63, 1101–1116. [Google Scholar] [CrossRef] [PubMed]
  26. Wang, S.Q.; Zhou, X.L.; Lyu, Z.Y.; Zhang, R.; Yang, L.; Shen, S.K. Anthocyanin accumulation underlies petal blotch coloration in Rhododendron rex and its medicinal potential. Ind. Crops Prod. 2025, 224, 120335. [Google Scholar] [CrossRef]
  27. Lv, F.; Yang, R.; Wang, Q.; Gao, L.; Li, S.; Li, L.; Chen, M.; Jiang, S.; Liu, D.; Li, Y.; et al. Multi-omics analysis uncovers novel gene regulatory networks of flower coloration in Lagerstroemia indica. Ind. Crops Prod. 2024, 216, 118710. [Google Scholar] [CrossRef]
  28. Peng, Y.; Wang, K.; Cooney, J.M.; Wang, T.; Espley, R.V.; Allan, A.C. Differential regulation of the anthocyanin profile in purple kiwifruit (Actinidia species). Hortic. Res. 2019, 6, 3. [Google Scholar] [CrossRef]
  29. Liu, Z.; Wang, H.; Zhang, J.; Chen, Q.; He, W.; Zhang, Y.; Luo, Y.; Tang, H.; Wang, Y.; Wang, X. Comparative metabolomics profiling highlights unique color variation and bitter taste formation of Chinese cherry fruits. Food Chem. 2024, 439, 138072. [Google Scholar] [CrossRef]
  30. Zhang, C.; Yang, H.; Wu, Y.; Lyu, L.; Wu, W.; Li, W. Integrated transcriptomics and metabolomics analysis unveil flavonoid and anthocyanin metabolism in pink and blue blueberry cultivars. Sci. Hortic. 2024, 327, 112798. [Google Scholar] [CrossRef]
  31. Bai, S.; Tao, R.; Tang, Y.; Yin, L.; Ma, Y.; Ni, J.; Yan, X.; Yang, Q.; Wu, Z.; Zeng, Y.; et al. BBX16, a B-box protein, positively regulates light-induced anthocyanin accumulation by activating MYB10 in red pear. Plant Biotechnol. J. 2019, 17, 1985–1997. [Google Scholar] [CrossRef]
  32. Dubos, C.; Stracke, R.; Grotewold, E.; Weisshaar, B.; Martin, C.; Lepiniec, L. MYB transcription factors in Arabidopsis. Trends Plant Sci. 2010, 15, 573–581. [Google Scholar] [CrossRef]
  33. Heredia, A.; Heredia-Guerrero, J.; Domínguez, E. CHS silencing suggests a negative cross-talk between wax and flavonoid pathways in tomato fruit cuticle. Plant Signal Behav. 2015, 10, e1019979. [Google Scholar]
  34. Wang, Z.; Yu, Q.; Shen, W.; Mohtar, C.A.E.; Zhao, X.; Gmitter, F.G., Jr. Functional study of CHS gene family members in citrus revealed a novel CHS gene affecting the production of flavonoids. BMC Plant Biol. 2018, 18, 189. [Google Scholar]
  35. Tang, Q.; Tian, M.; An, G.; Zhang, W.; Chen, J.; Yan, C. Rapid identification of the purple stem (Ps) gene of Chinese kale (Brassica oleracea var. alboglabra) in a segregation distortion population by bulked segregant analysis and RNA sequencing. Mol. Breed. 2017, 37, 153. [Google Scholar]
  36. Li, J.; Liu, C.; Zhao, A.; Yu, M.; Liu, X.; Chen, X.; Li, Y. A MITE insertion in the promoter region of anthocyanidin synthase from Morus alba L. Plant Mol. Biol. Rep. 2018, 36, 188–194. [Google Scholar]
  37. Su, W.; Tao, R.; Liu, W.; Yu, C.; Yue, Z.; He, S.; Lavelle, D.; Zhang, W.; Zhang, L.; An, G.; et al. Characterization of four polymorphic genes controlling red leaf colour in lettuce that have undergone disruptive selection since domestication. Plant Biotechnol. J. 2020, 18, 479–490. [Google Scholar] [CrossRef]
  38. Liu, J.; Osbourn, A.; Ma, P. MYB transcription factors as regulators of phenylpropanoid metabolism in plants. Mol. Plant 2015, 8, 689–708. [Google Scholar] [PubMed]
  39. Shan, X.; Li, Y.; Yang, S.; Gao, R.; Zhou, L.; Bao, T.; Han, T.; Wang, S.; Gao, X.; Wang, L. A functional homologue of Arabidopsis TTG1 from Freesia interacts with bHLH proteins to regulate anthocyanin and proanthocyanidin biosynjournal in both Freesia hybrida and Arabidopsis thaliana. Plant Physiol. Biochem. 2019, 141, 60–72. [Google Scholar]
  40. Wang, L.; Tang, W.; Hu, Y.; Zhang, Y.; Sun, J.; Guo, X.; Lu, H.; Yang, Y.; Fang, C.; Niu, X.; et al. A MYB/bHLH complex regulates tissue specific anthocyanin biosynjournal in the inner pericarp of red-centered kiwifruit Actinidia chinensis cv. Hongyang. Plant J. 2019, 99, 359–378. [Google Scholar] [CrossRef]
  41. Chen, S.; Wang, S. GLABRA2, a common regulator for epidermal cell fate determination and anthocyanin biosynjournal in Arabidopsis. Int. J. Mol. Sci. 2019, 20, 4997. [Google Scholar]
  42. Yue, S.; Zhao, D.; Peng, C.; Tan, C.; Wang, Q.; Gong, J. Effects of theabrownin on serum metabolites and gut microbiome in rats with a high-sugar diet. Food Funct. 2019, 10, 7063–7080. [Google Scholar] [CrossRef] [PubMed]
  43. Guo, C.; Wang, P.; Zhang, J.; Guo, X.; Mu, X.; Du, J. Organic acid metabolism in Chinese dwarf cherry [Cerasus humilis (Bge.) Sok.] is controlled by a complex gene regulatory network. Front. Plant Sci. 2022, 13, 982112. [Google Scholar]
  44. Verde, I.; Jenkins, J.; Dondini, L.; Micali, S.; Pagliarani, G.; Vendramin, E.; Paris, R.; Aramini, V.; Gazza, L.; Rossini, L.; et al. The Peach v2.0 release: High-resolution linkage mapping and deep resequencing improve chromosome-scale assembly and contiguity. BMC Genom. 2017, 18, 225. [Google Scholar]
  45. Pertea, M.; Kim, D.; Pertea, G.; Leek, J.T.; Salzberg, S.L. Transcript-level expression analysis of RNA-seq experiments with HISAT, StringTie and Ballgown. Nat. Protoc. 2016, 11, 1650–1667. [Google Scholar]
  46. Michael, I.L.; Wolfgang, H.; Simon, A. Moderated estimation of fold change and dispersion for RNA-seq data with DESeq2. Genome Biol. 2014, 15, 550. [Google Scholar]
  47. Chen, C.; Chen, H.; Zhang, Y.; Thomas, H.R.; Frank, M.H.; He, Y.; Xia, R. TBtools: An integrative toolkit developed for interactive analyses of big biological data. Mol. Plant 2020, 13, 1194–1202. [Google Scholar] [CrossRef]
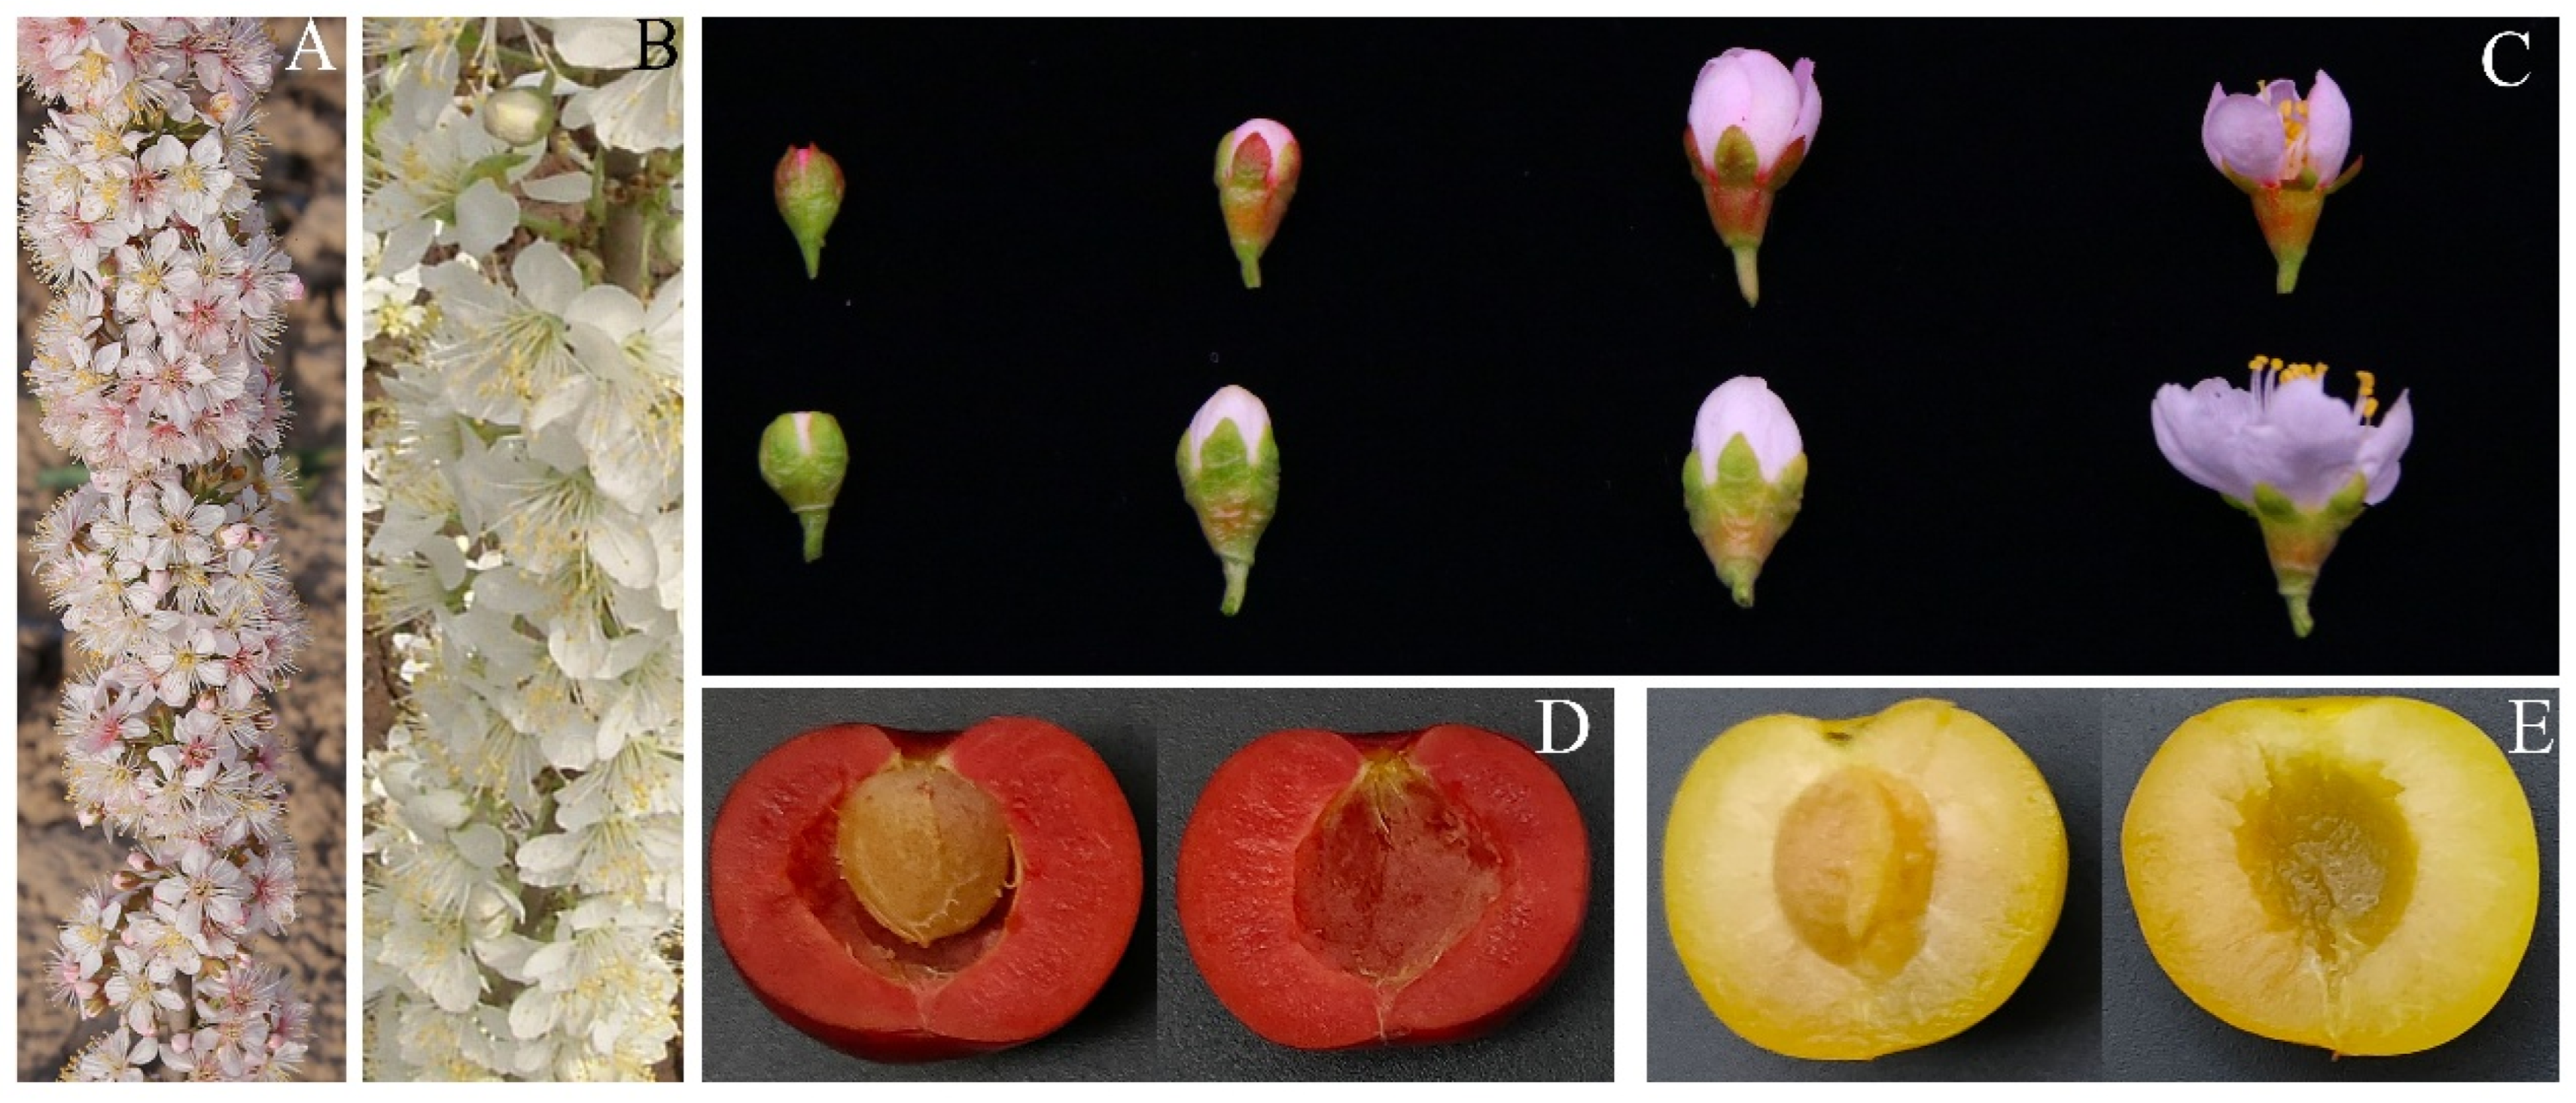
Figure 1. Phenotypes of ‘Jinou 1’ and ‘Nongda 5’. (A) ‘Jinou 1’ flowering period. (B) ‘Nongda 5’ flowering period. (C) Flower development in ‘Jinou 1’ (up) and ‘Nongda 5’(down). (D) Mature fruit of ‘Jinou 1’. (E) Mature fruit of ‘Nongda 5’.
Plants 14 01103 g001
Figure 2. Analysis of metabolomic data of C. humilis flowers and fruits. (A) Numbers of differential metabolites in ‘Jinou 1’ vs. ‘Nongda 5’ flowers. (B) KEGG pathway enrichment analysis of differential metabolites in ‘Jinou 1’ vs. ‘Nongda 5’ flowers. (C) Numbers of differential metabolites in ‘Jinou 1’ vs. ‘Nongda 5’ fruits. (D) KEGG pathway enrichment analysis of differential metabolites in ‘Jinou 1’ vs. ‘Nongda 5’ fruits.
Plants 14 01103 g002
Figure 3. Analysis of transcriptomic data of C. humilis flowers. (A) Correlation analysis between ‘Nongda 5’ and ‘Jinou 1’ flower transcriptomic data. (B) Numbers of DEGs in ‘Jinou 1’ vs. ‘Nongda 5’ flowers. (C) Distribution of FC values of DEGs. (D) KEGG pathway enrichment analysis of DEGs for ‘Jinou 1’ vs. ‘Nongda 5’ flowers.
Plants 14 01103 g003
Figure 4. Analysis of transcriptomic data of C. humilis fruits. (A) Correlation analysis between ‘Nongda 5’ and ‘Jinou 1’ fruit transcriptomic data. (B) Numbers of DEGs in ‘Jinou 1’ vs. ‘Nongda 5’ fruits. (C) Distribution of FC values of DEGs. (D) KEGG pathway enrichment analysis of DEGs for ‘Jinou 1’ vs. ‘Nongda 5’ fruits.
Plants 14 01103 g004
Figure 5. Heatmap of DEGs in C. humilis flowers (A) and fruits (B).
Plants 14 01103 g005
Figure 6. Correlation analysis between DEGs and differential metabolites in ‘Jinou 1’ vs. ‘Nongda 5’ flowers.
Plants 14 01103 g006
Figure 7. Correlation analysis between DEGs and differential metabolites in ‘Jinou 1’ vs. ‘Nongda 5’ fruits.
Plants 14 01103 g007
Disclaimer/Publisher’s Note: The statements, opinions and data contained in all publications are solely those of the individual author(s) and contributor(s) and not of MDPI and/or the editor(s). MDPI and/or the editor(s) disclaim responsibility for any injury to people or property resulting from any ideas, methods, instructions or products referred to in the content.