
Genetic Structure and Conservation Management of Endemic Salix kusanoi in Fragmented Habitats of Taiwan

 , , , and
Abstract
1. Introduction
2. Results
2.1. Genetic Diversity of Salix kusanoi Populations in Taiwan
2.2. Genetic Differentiation Among Salix kusanoi Populations
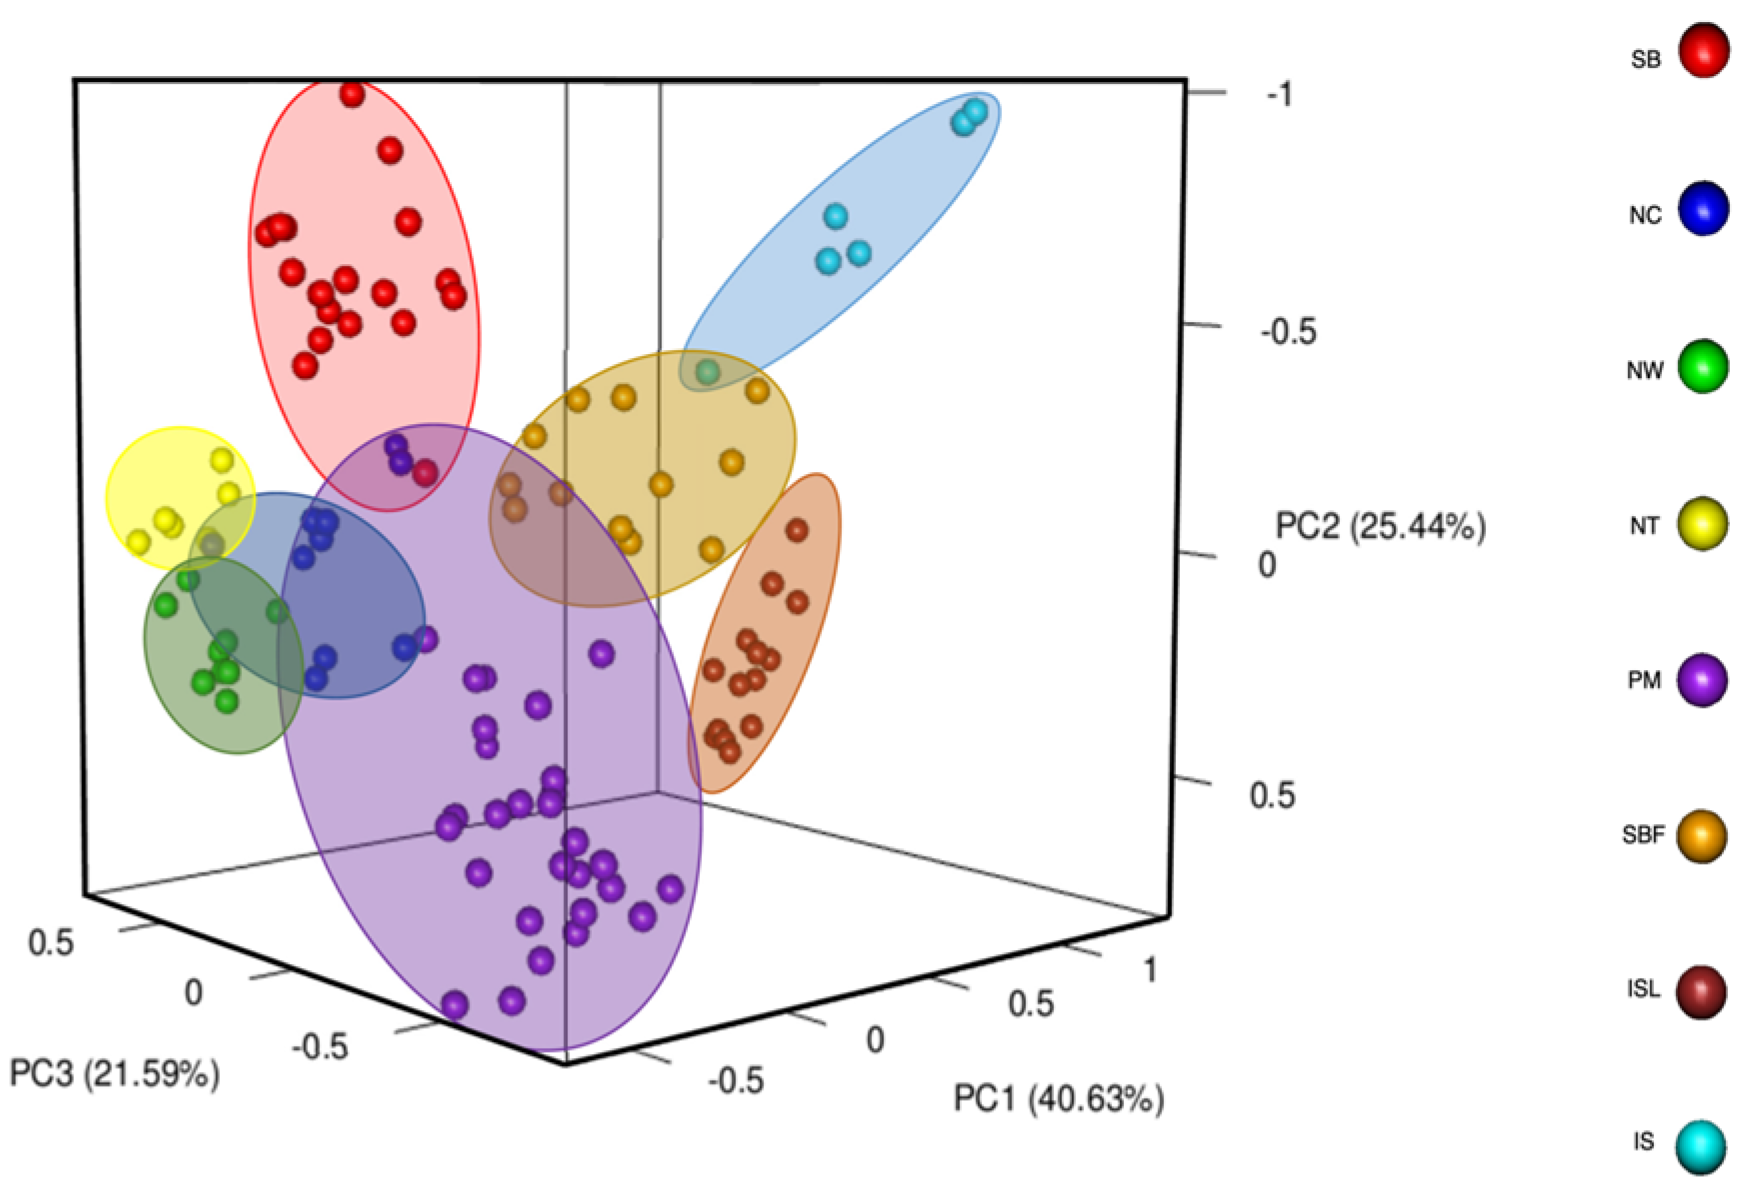
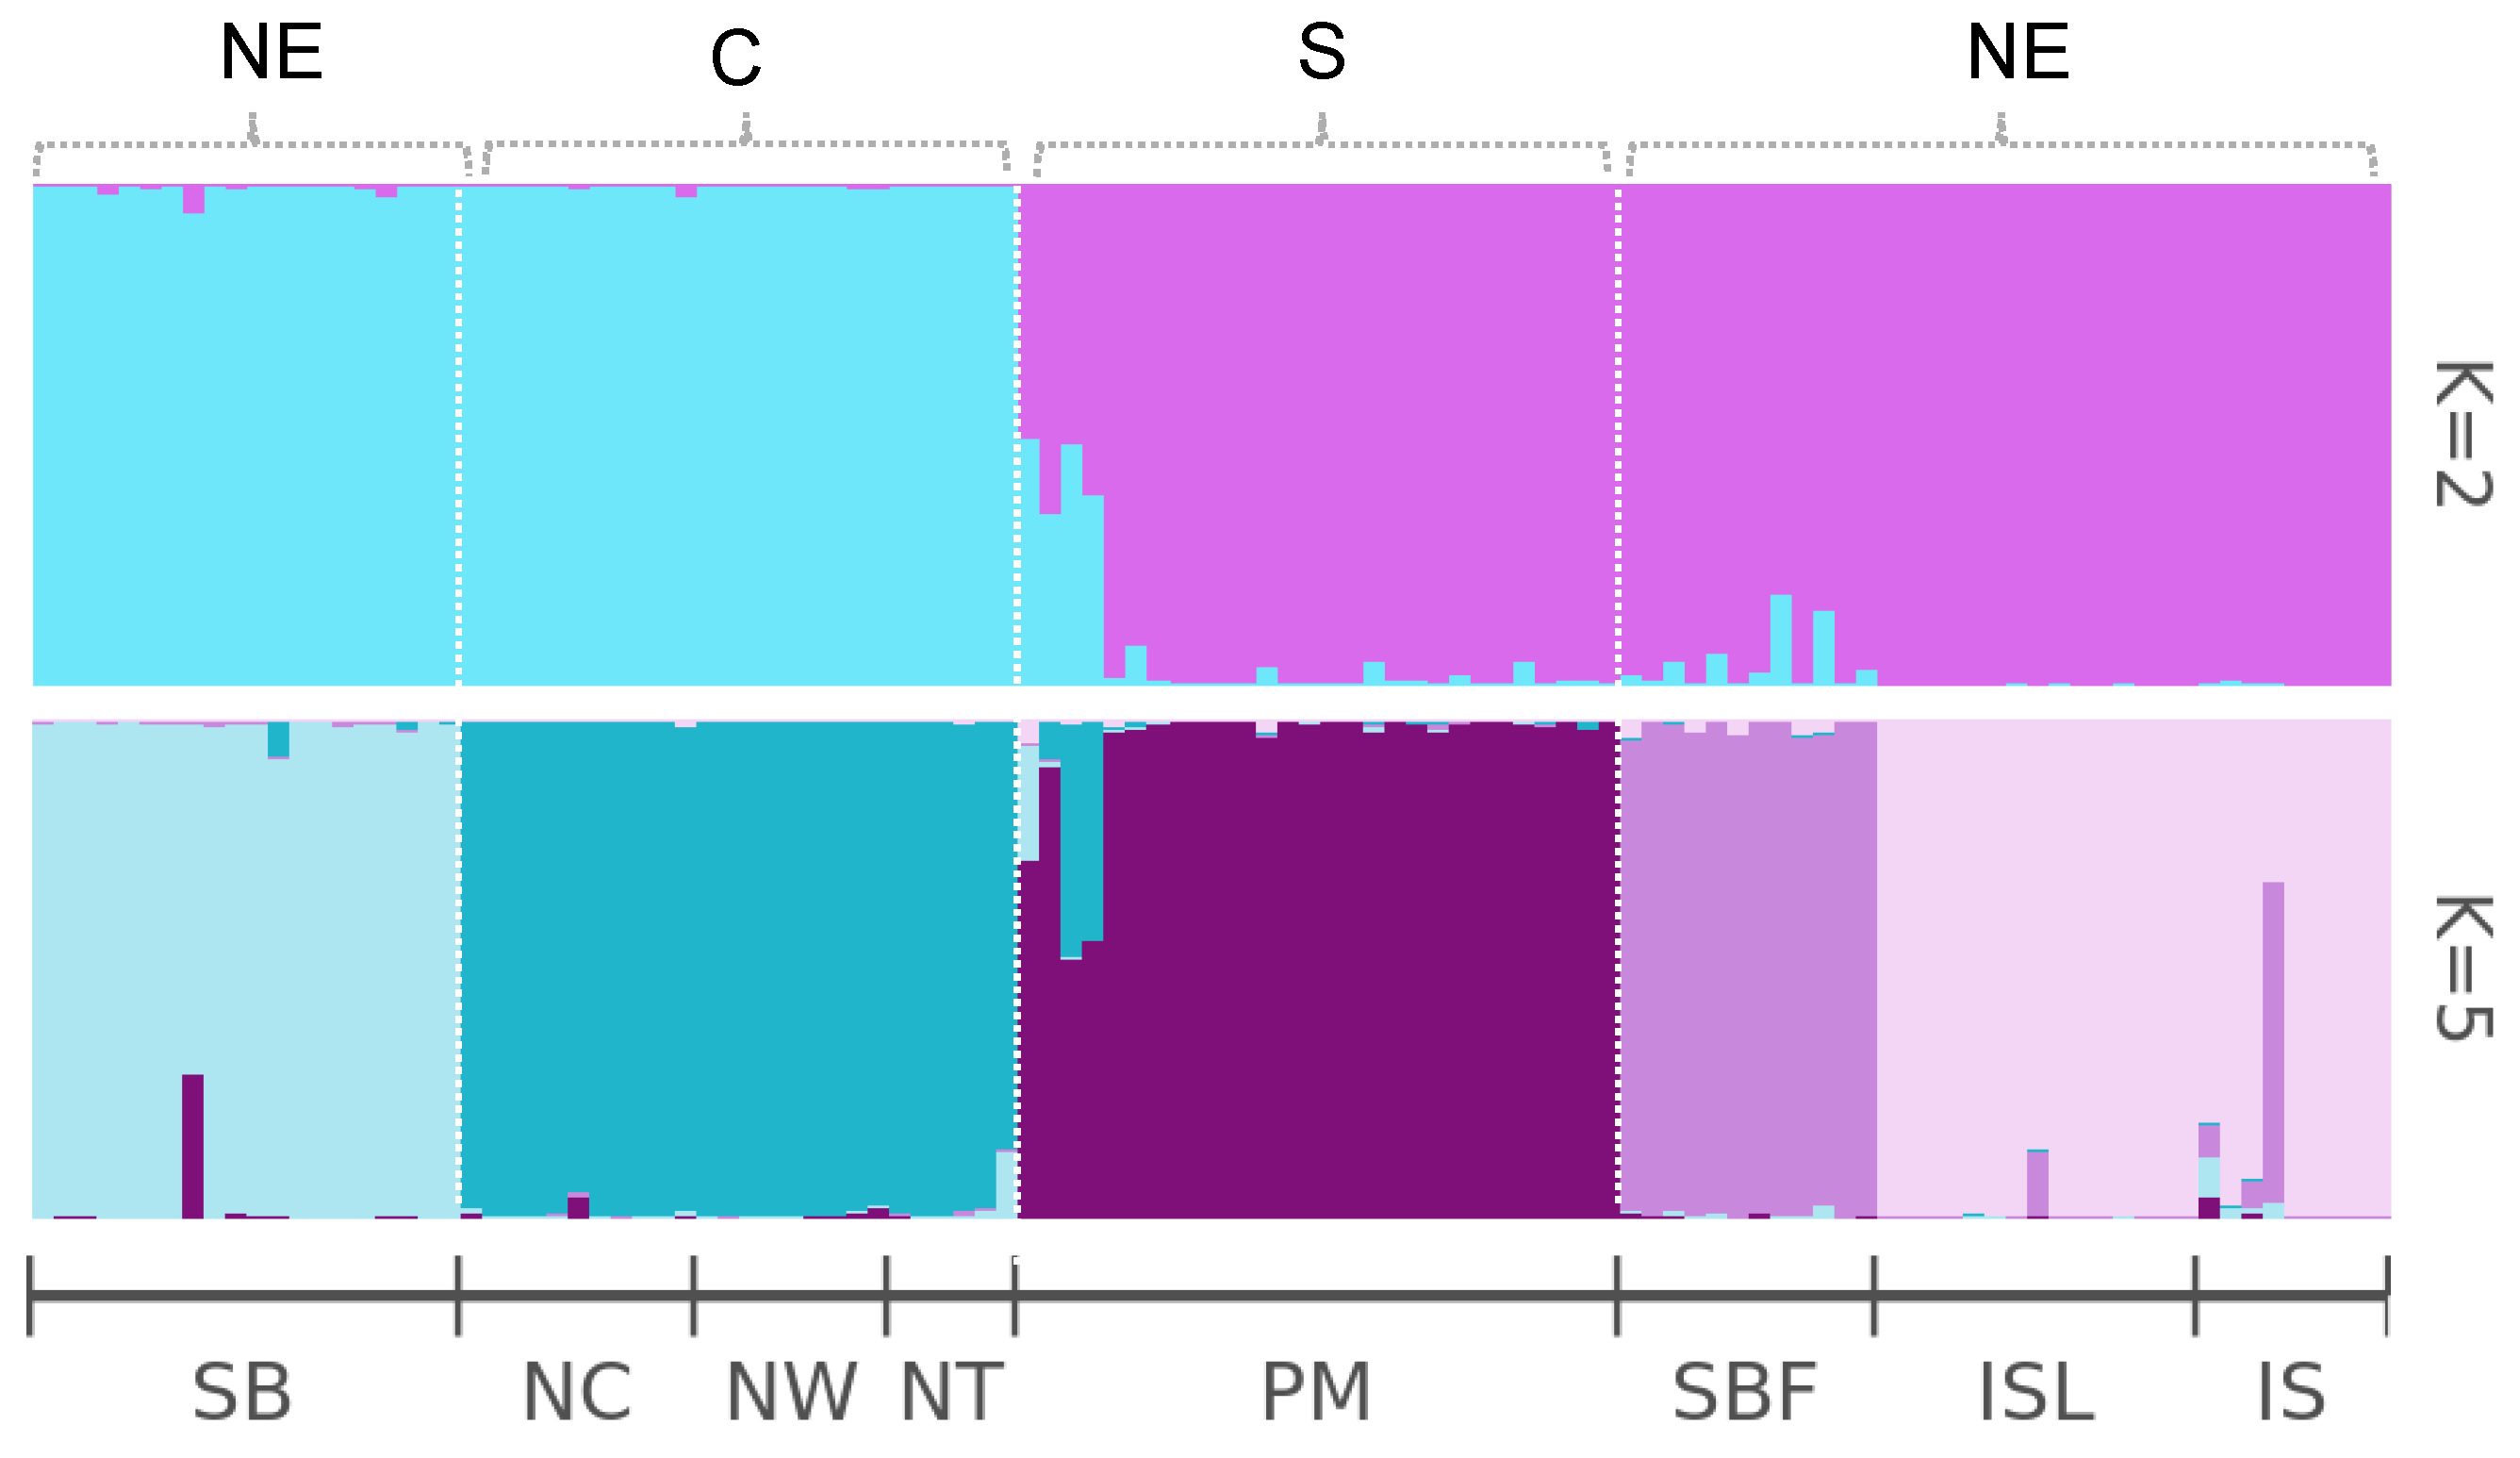
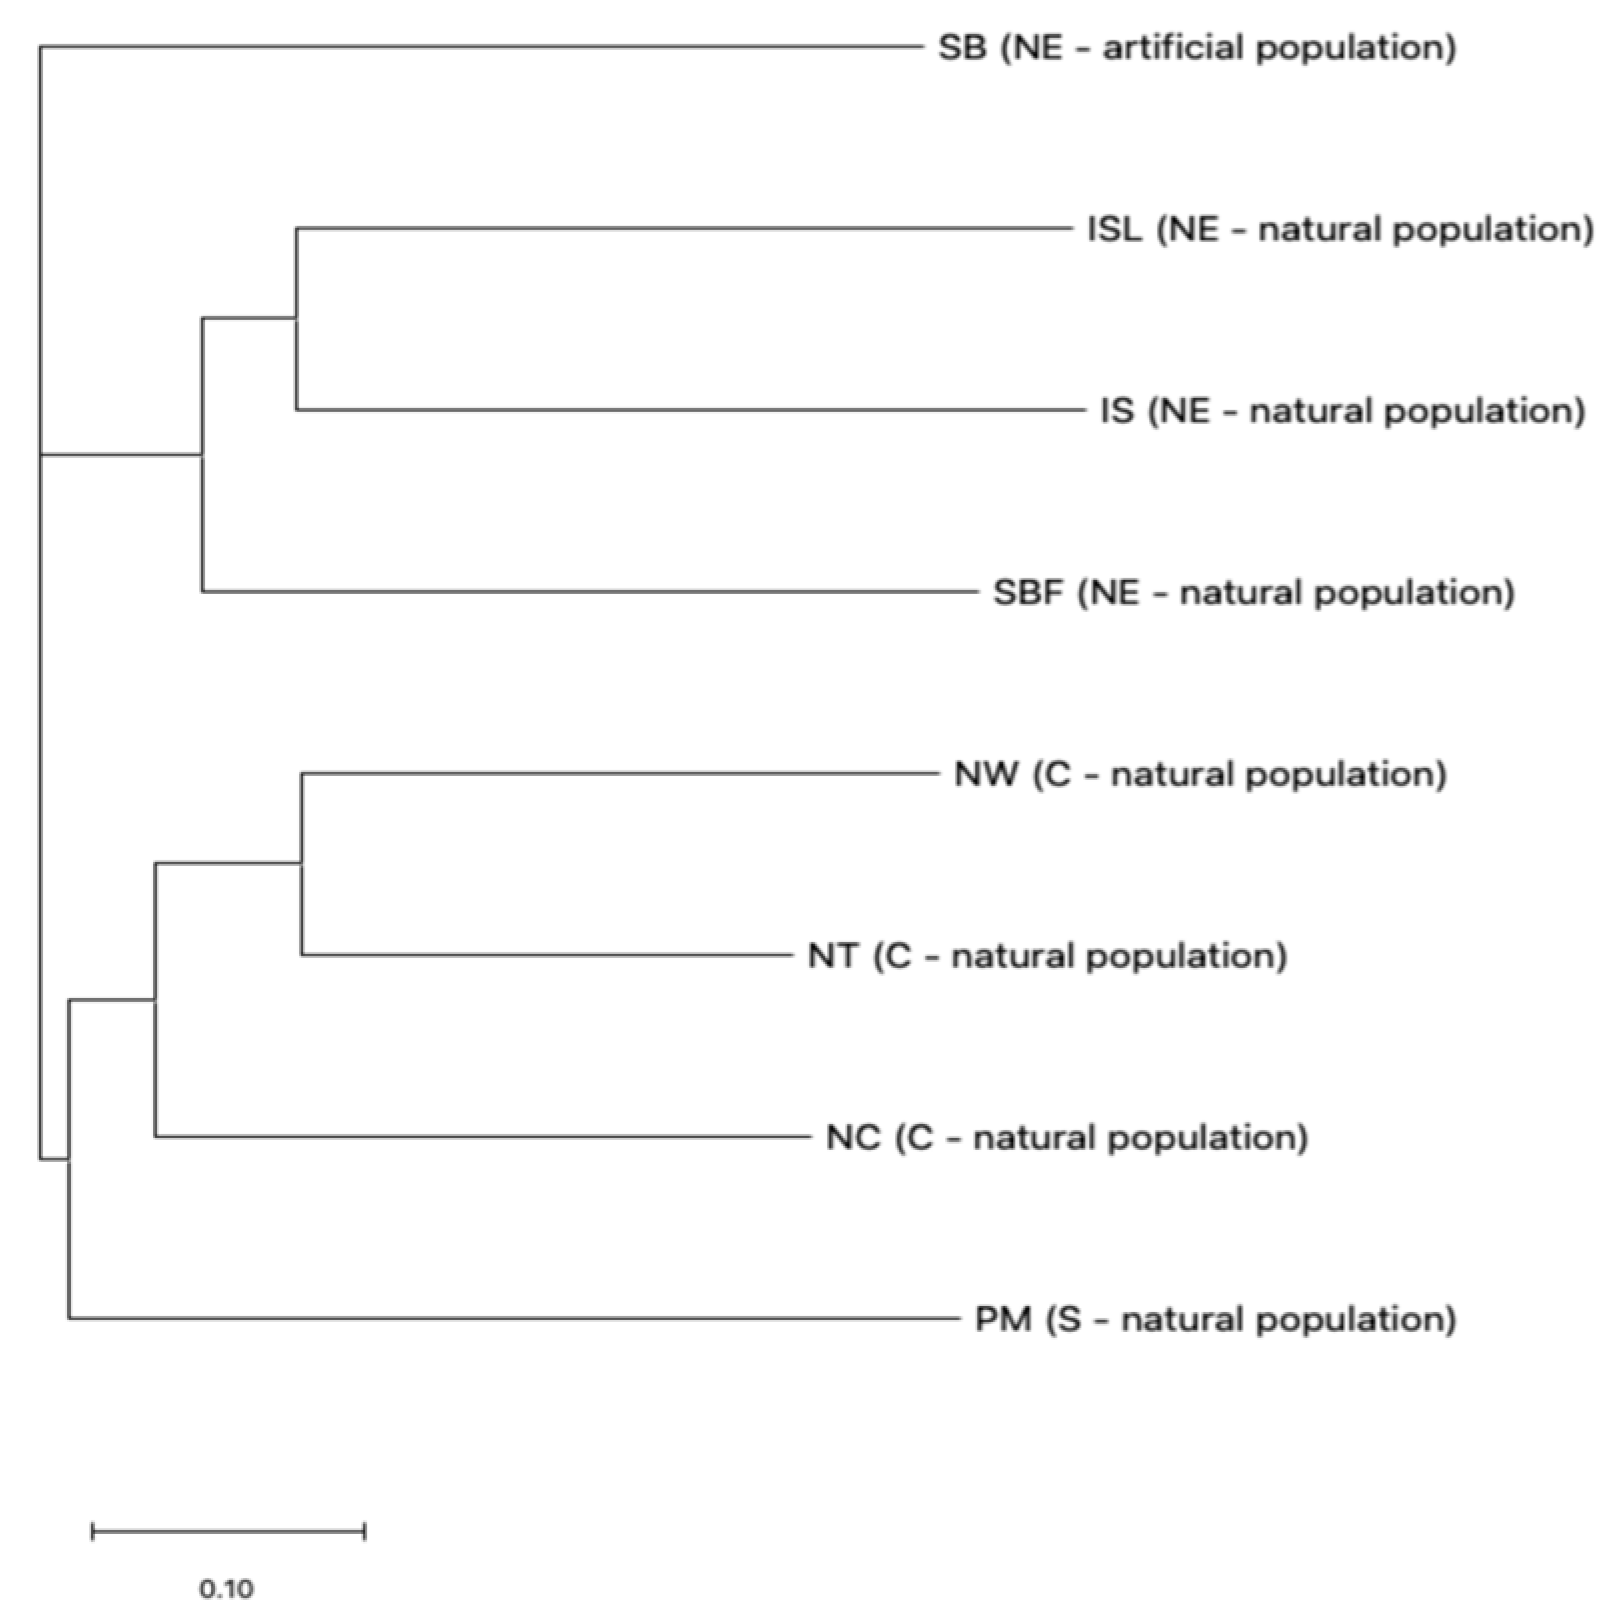
2.3. Population Genetic Structure of Salix kusanoi Across Eight Populations
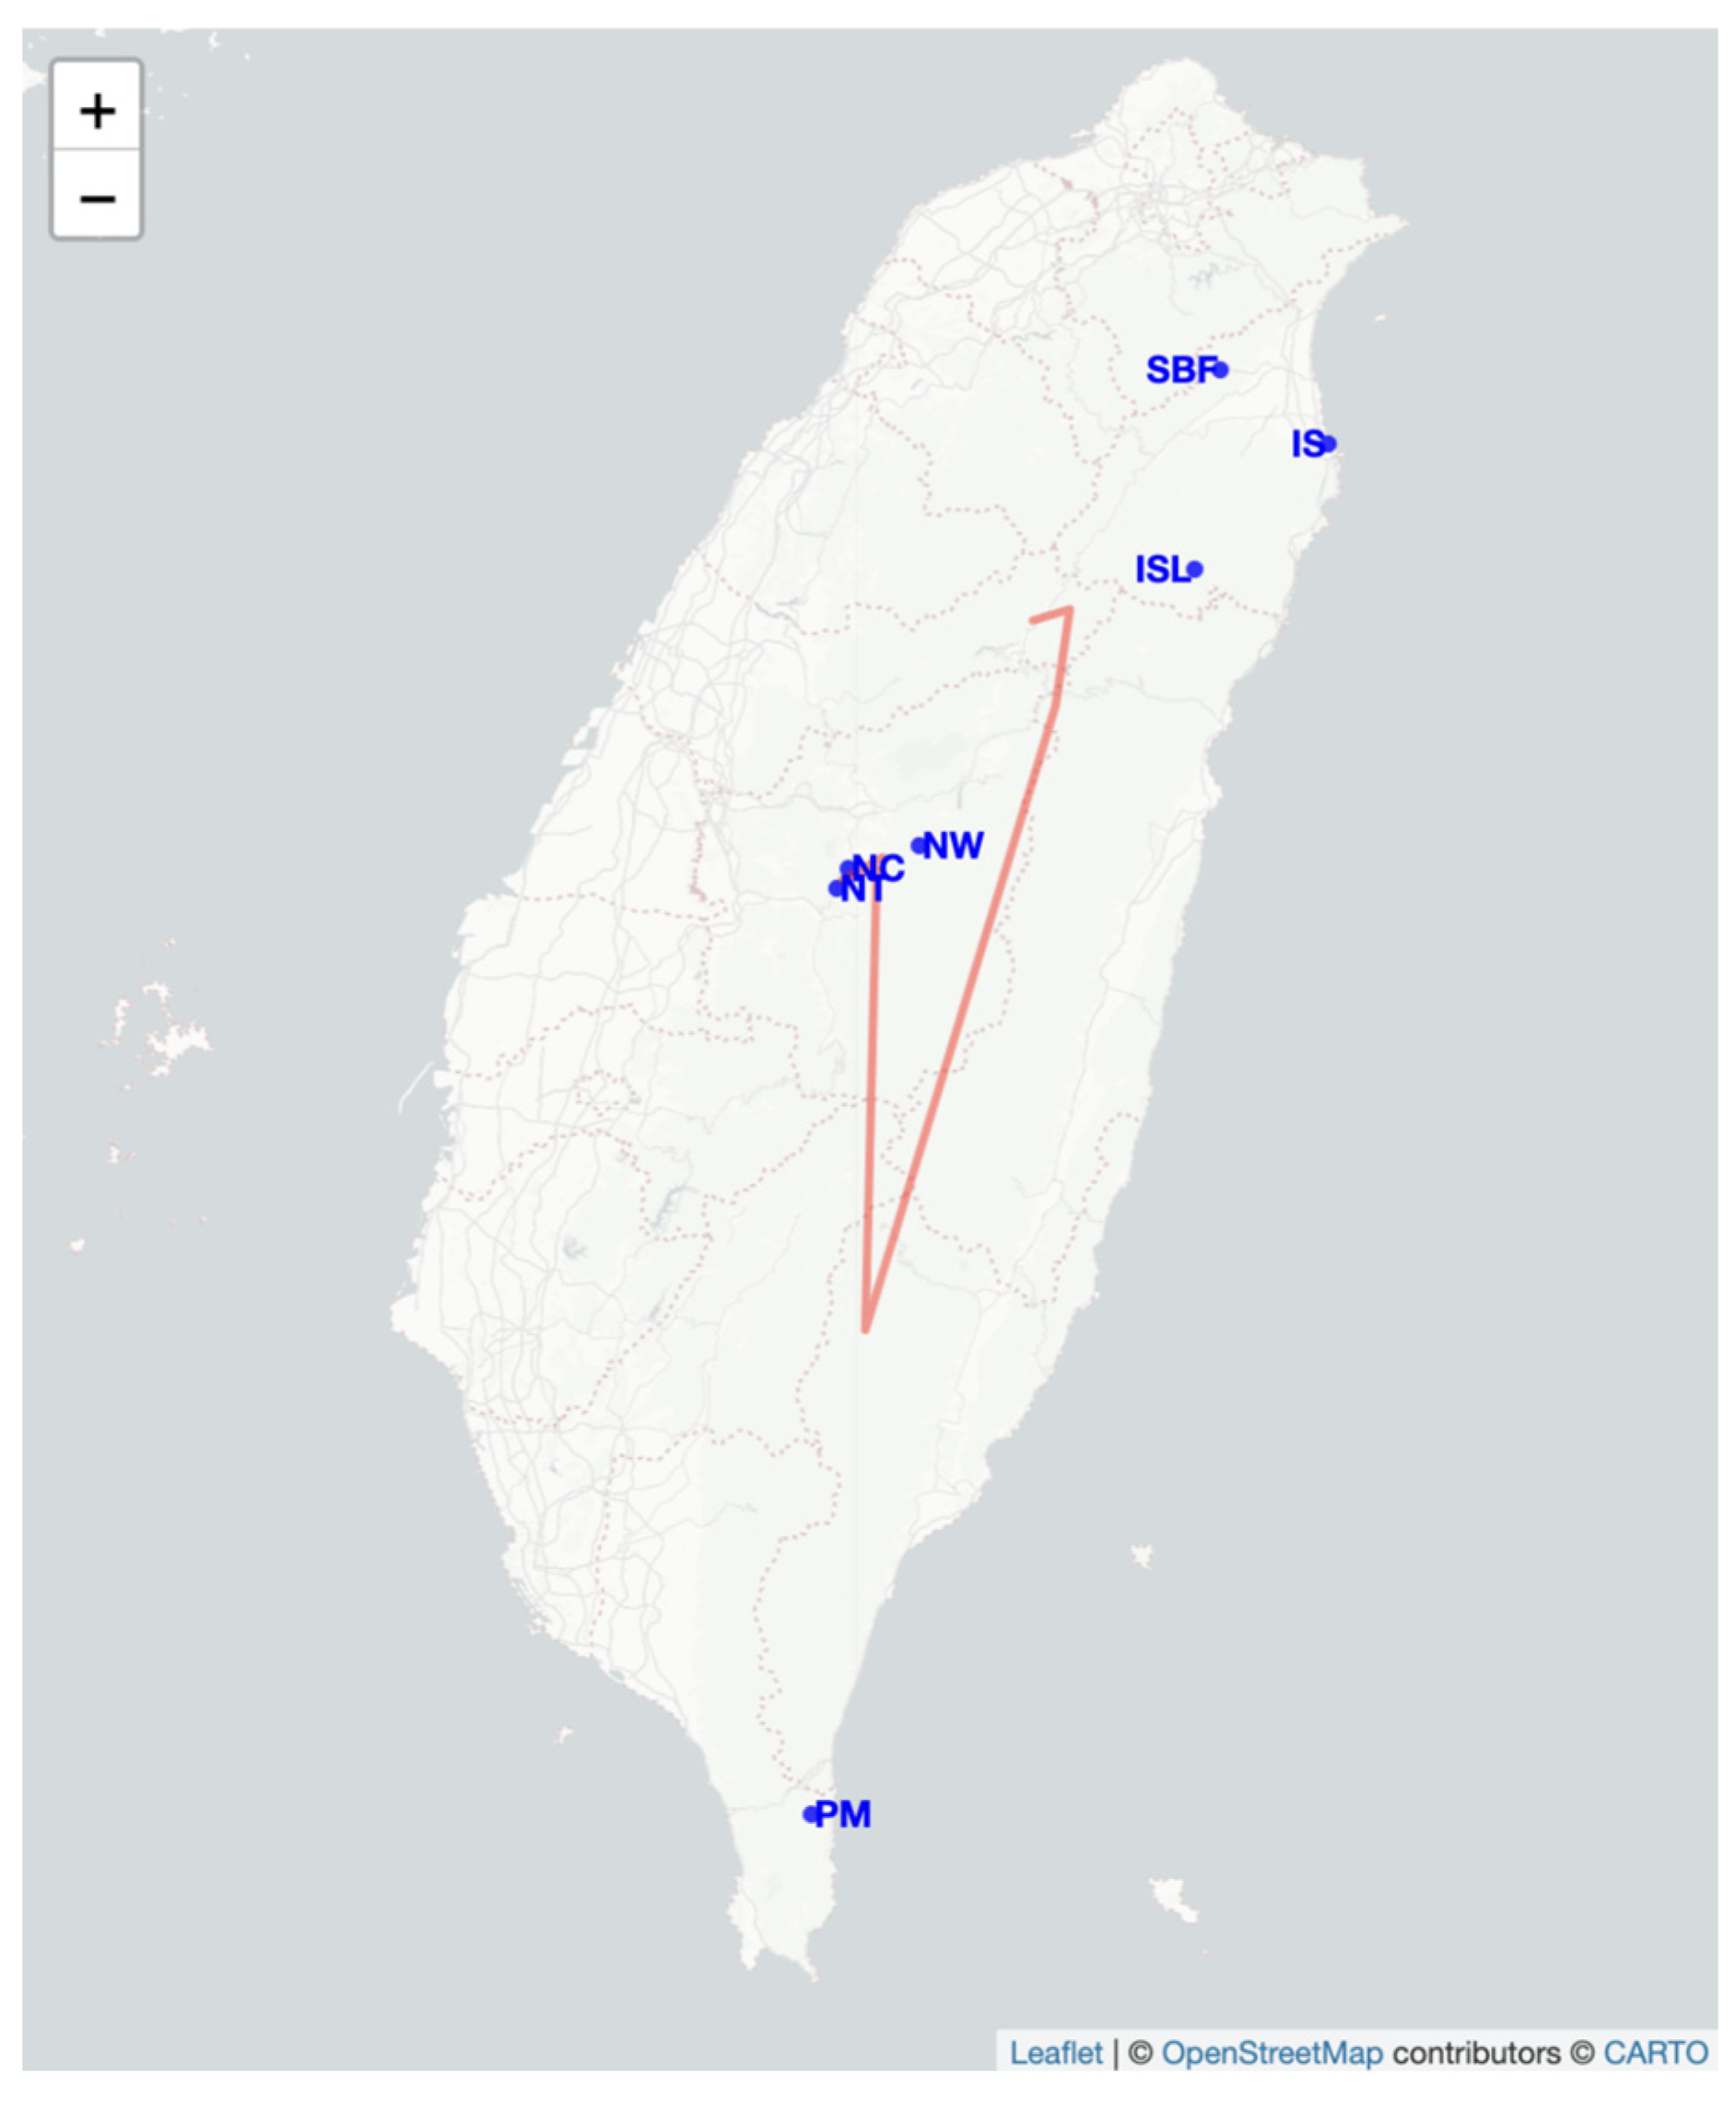
2.4. Genetic Barrier Analysis and Migration
3. Discussion
4. Materials and Methods
4.1. Sampling
4.2. DNA Extraction and Microsatellite Amplification
4.3. Genetic Diversity
4.4. Genetic Differentiation and Genetic Groups Analysis
4.5. Migration and Barrier Analysis
5. Conclusions
Supplementary Materials
Author Contributions
Funding
Data Availability Statement
Acknowledgments
Conflicts of Interest
References
- Nic Lughadha, E.; Bachman, S.P.; Leão, T.C.; Forest, F.; Halley, J.M.; Moat, J.; Acedo, C.; Bacon, K.L.; Brewer, R.F.; Gâteblé, G.; et al. Extinction Risk and Threats to Plants and Fungi. Plants People Planet 2020, 2, 389–408. [Google Scholar] [CrossRef]
- Arciszewski, M.; Pogorzelec, M.; Parzymies, M.; Bronowicka-Mielniczuk, U.; Mieczan, T. Do Endangered Glacial Relicts Have a Chance for Effective Conservation in the Age of Global Warming? A Case Study: Salix lapponum in Eastern Poland. Biology 2024, 14, 19. [Google Scholar] [CrossRef]
- Pimm, S.L.; Raven, P. Extinction by Numbers. Nature 2000, 403, 843–845. [Google Scholar] [CrossRef] [PubMed]
- Gramlich, S.; Sagmeister, P.; Dullinger, S.; Hadacek, F.; Hörandl, E. Evolution In Situ: Hybrid Origin and Establishment of Willows (Salix L.) on Alpine Glacier Forefields. Heredity 2016, 116, 531–541. [Google Scholar] [CrossRef]
- Mitsch, W.J.; Gosselink, J.G. The Value of Wetlands: Importance of Scale and Landscape Setting. Ecol. Econ. 2000, 35, 25–33. [Google Scholar] [CrossRef]
- Díaz-Alba, D.; Henry, A.L.; de Jalón, D.G.; del Tánago, M.G.; Martínez-Fernández, V. Salix Regeneration in Fluvial Landscapes: Empirical Findings Based on a Systematic Review. Ecol. Eng. 2023, 193, 107010. [Google Scholar] [CrossRef]
- Richardson, J.; Isebrands, J.G. Poplars and willows: Trees for society and the environment. In Proceedings of the 13th North American Agroforestry Conference, Charlottetown, PE, Canada, 19–21 June 2013. [Google Scholar]
- Grandstaff, G.; Kuzovkina, Y.A.; Legrand, A. Attraction of Bees to Native and Introduced Willows (Salix spp.). Forests 2023, 14, 959. [Google Scholar] [CrossRef]
- Huang, C.L.; Chang, C.T.; Huang, B.H.; Chung, J.D.; Chen, J.H.; Chiang, Y.C.; Hwang, S.Y. Genetic Relationships and Ecological Divergence in Salix Species and Populations in Taiwan. Tree Genet. Genomes 2015, 11, 39. [Google Scholar] [CrossRef]
- Yang, K.C.; Huang, T.C. Flora of Taiwan, 2nd ed.; Botany Department of Press, National Taiwan University: Taipei, Taiwan, 1996. [Google Scholar]
- Editorial Committee of the Red List of Vascular Plants of Taiwan. The Red List of Vascular Plants of Taiwan; Endemic Species Research Institute, Taiwan Forestry Bureau, and Taiwan Society of Plant Systematics: Nantou, Taiwan, 2017.
- Lu, S.Y.; Pan, F.J. Salix kusanoi. The IUCN Red List of Threatened Species. 1998. Available online: https://www.iucnredlist.org/species/31250/9619786 (accessed on 1 November 2024).
- Hughes, A.R.; Inouye, B.D.; Johnson, M.T.; Underwood, N.; Vellend, M. Ecological Consequences of Genetic Diversity. Ecol. Lett. 2008, 11, 609–623. [Google Scholar] [CrossRef]
- Bloju, O.; Ihos, S.C.; Rus, A.B.; Ciaparii, R.; Popescu, S. Comparative Analysis of Different Molecular Markers Used for Evaluation of Salix sp. Variability. J. Hortic. For. Biotechnol. 2017, 21, 131–136. [Google Scholar]
- Sharma, J.P.; Thakur, S.; Sharma, P.; Thakur, A. Genetic Structure and Gene Flow among Populations of Willow (Salix Species). Ecol. Genet. Genom. 2024, 32, 100283. [Google Scholar] [CrossRef]
- Chen, Y.; Wang, T.; Fang, L.; Li, X.; Yin, T. Confirmation of Single-Locus Sex Determination and Female Heterogamety in Willow Based on Linkage Analysis. PLoS ONE 2016, 11, e0147671. [Google Scholar] [CrossRef]
- Cortés, A.J.; Waeber, S.; Lexer, C.; Sedlacek, J.; Wheeler, J.A.; van Kleunen, M.; Boßdorf, O.; Hoch, G.; Rixen, C.; Wipf, S.; et al. Small-Scale Patterns in Snowmelt Timing Affect Gene Flow and the Distribution of Genetic Diversity in the Alpine Dwarf Shrub Salix herbacea. Heredity 2014, 113, 233–239. [Google Scholar] [CrossRef]
- He, X.; Zheng, J.; Zhou, J.; He, K.; Shi, S.; Wang, B. Characterization and Comparison of EST-SSRs in Salix, Populus, and Eucalyptus. Tree Genet. Genomes 2015, 11, 820. [Google Scholar] [CrossRef]
- Hernández-Leal, M.S.; Suárez-Atilano, M.; Piñero, D.; González-Rodríguez, A. Regional Patterns of Genetic Structure and Environmental Differentiation in Willow Populations (Salix humboldtiana Willd.) from Central Mexico. Ecol. Evol. 2019, 9, 9564–9579. [Google Scholar] [CrossRef]
- Hao, L.; Zhang, G.; Lu, D.; Hu, J.; Jia, H. Analysis of the Genetic Diversity and Population Structure of Salix psammophila Based on Phenotypic Traits and Simple Sequence Repeat Markers. PeerJ 2019, 7, e6419. [Google Scholar] [CrossRef]
- Hu, J.J.; Lv, J.H.; Lu, M.Z. Genetic Linkage Map of Willow (Salix leucopithecia × S. erioclada L.) Based on AFLP and SSR Markers. BMC Proc. 2011, 5 (Suppl. S7), 29. [Google Scholar] [CrossRef]
- Kim, Y.Y.; Kwon, S.H.; Jo, A.; Kim, Y.G.; Lee, J.W.; Kang, K.S. Single Nucleotide Polymorphism (SNP) Characterization of Drought-Responsive Genes to Estimate Genetic Variation of Populus tremula var. davidiana and Eight Other Populus Species. Can. J. For. Res. 2018, 48, 689–696. [Google Scholar] [CrossRef]
- Perdereau, A.C.; Kelleher, C.T.; Douglas, G.C.; Hodkinson, T.R. High Levels of Gene Flow and Genetic Diversity in Irish Populations of Salix caprea L. Inferred from Chloroplast and Nuclear SSR Markers. BMC Plant Biol. 2014, 14, 202. [Google Scholar] [CrossRef]
- Tsarouhas, V.; Gullberg, U.; Lagercrantz, U. An AFLP and RFLP Linkage Map and Quantitative Trait Locus (QTL) Analysis of Growth Traits in Salix. Theor. Appl. Genet. 2002, 105, 277–288. [Google Scholar] [CrossRef]
- Barker, J.H.A.; Pahlich, A.; Trybush, S.; Edwards, K.J.; Karp, A. Microsatellite Markers for Diverse Salix Species. Mol. Ecol. Notes 2003, 3, 4–6. [Google Scholar] [CrossRef]
- Bozzi, J.A.; Liepelt, S.; Ohneiser, S.; Gallo, L.A.; Marchelli, P.; Leyer, I.; Ziegenhagen, B.; Mengel, C. Characterization of 23 Polymorphic SSR Markers in Salix humboldtiana (Salicaceae) Using Next-Generation Sequencing and Cross-Amplification from Related Species. Appl. Plant Sci. 2015, 3, 1400120. [Google Scholar] [CrossRef]
- Carletti, G.; Cattivelli, L.; Vietto, L.; Nervo, G. Multiallelic and Multilocus Simple Sequence Repeats (SSRs) to Assess the Genetic Diversity of a Salix spp. Germplasm Collection. J. For. Res. 2021, 32, 263–271. [Google Scholar] [CrossRef]
- Değirmenci, F.Ö.; Çiftçi, A.; Acar, P.; Kaya, Z. Genetic Diversity and Population Structure of Salix alba Across River Systems in Turkey and Their Importance in Conservation Management. Plant Ecol. Divers. 2021, 14, 293–304. [Google Scholar] [CrossRef]
- Hanley, S.; Barker, J.; Van Ooijen, J.; Aldam, C.; Harris, S.; Åhman, I.; Larsson, S.; Karp, A. A Genetic Linkage Map of Willow (Salix viminalis) Based on AFLP and Microsatellite Markers. Theor. Appl. Genet. 2002, 105, 1087–1096. [Google Scholar] [CrossRef]
- Jia, H.; Yang, H.; Sun, P.; Li, J.; Zhang, J.; Guo, Y.; Han, X.; Zhang, G.; Lu, M.; Hu, J. De Novo Transcriptome Assembly, Development of EST-SSR Markers and Population Genetic Analyses for the Desert Biomass Willow, Salix psammophila. Sci. Rep. 2016, 6, 39591. [Google Scholar] [CrossRef]
- Nagamitsu, T.; Hoshikawa, T.; Kawahara, T.; Barkalov, V.Y.; Sabirov, R.N. Phylogeography and Genetic Structure of Disjunct Salix arbutifolia Populations in Japan. Popul. Ecol. 2014, 56, 539–549. [Google Scholar] [CrossRef]
- Reisch, C.; Schurm, S.; Poschlod, P. Spatial Genetic Structure and Clonal Diversity in an Alpine Population of Salix herbacea (Salicaceae). Ann. Bot. 2007, 99, 647–651. [Google Scholar] [CrossRef]
- Tokdemir, Y.; Değirmenci, F.Ö.; Uluğ, A.; Acar, P.; Kaya, Z. Genetic Diversity of Salix caprea L. Populations in Fragmented Habitats of Northeastern Türkiye. Biologia 2024, 79, 2013–2023. [Google Scholar] [CrossRef]
- Kikuchi, S.; Suzuki, W.; Sashimura, N. Gene Flow in an Endangered Willow Salix hukaoana (Salicaceae) in Natural and Fragmented Riparian Landscapes. Conserv. Genet. 2011, 12, 79–89. [Google Scholar] [CrossRef]
- Evanno, G.; Regnaut, S.; Goudet, J. Detecting the Number of Clusters of Individuals Using the Software STRUCTURE: A Simulation Study. Mol. Ecol. 2005, 14, 2611–2620. [Google Scholar] [CrossRef] [PubMed]
- Zhai, F.F.; Liu, J.X.; Li, Z.J.; Mao, J.M.; Qian, Y.Q.; Han, L.; Sun, Z.Y. Assessing Genetic Diversity and Population Structure of Salix viminalis Across Ergun and West Liao Basin. Silva Fenn. 2017, 51, 7001. [Google Scholar] [CrossRef]
- Lin, J.; Gibbs, J.P.; Smart, L.B. Population Genetic Structure of Native versus Naturalized Sympatric Shrub Willows (Salix; Salicaceae). Am. J. Bot. 2009, 96, 771–785. [Google Scholar] [CrossRef] [PubMed]
- Trybush, S.O.; Jahodová, Š.; Čížková, L.; Karp, A.; Hanley, S.J. High Levels of Genetic Diversity in Salix viminalis of the Czech Republic as Revealed by Microsatellite Markers. BioEnergy Res. 2012, 5, 969–977. [Google Scholar] [CrossRef]
- Stamati, K.; Hollingsworth, P.M.; Russell, J.J.P.S. Patterns of Clonal Diversity in Three Species of Sub-Arctic Willow (Salix lanata, Salix lapponum, and Salix herbacea). Plant Syst. Evol. 2007, 269, 75–88. [Google Scholar] [CrossRef]
- Sochor, M.; Vašut, R.J.; Bártová, E.; Majeský, Ľ.; Mráček, J. Can Gene Flow Among Populations Counteract the Habitat Loss of Extremely Fragile Biotopes? An Example from the Population Genetic Structure in Salix daphnoides. Tree Genet. Genomes 2013, 9, 1193–1205. [Google Scholar] [CrossRef]
- Castiglione, S.; Cicatelli, A.; Lupi, R.; Patrignani, G.; Fossati, T.; Brundu, G. Genetic Structure and Introgression in Riparian Populations of Populus alba L. Plant Biosyst. 2010, 144, 656–668. [Google Scholar] [CrossRef]
- Lee, K.M.; Kim, Y.Y.; Hyun, J.O. Genetic Variation in Populations of Populus davidiana Dode Based on Microsatellite Marker Analysis. Genes Genom. 2011, 33, 163–171. [Google Scholar] [CrossRef]
- Wright, S. Evolution and the Genetics of Populations. IV. Variability Within and Among Natural Populations; University of Chicago Press: Chicago, IL, USA, 1978. [Google Scholar]
- Smulders, M.J.M.; Cottrell, J.E.; Lefèvre, F.; Van der Schoot, J.; Arens, P.; Vosman, B.; Tabbener, H.E.; Grassi, F.; Fossati, T.; Castiglione, S.; et al. Structure of the Genetic Diversity in Black Poplar (Populus nigra L.) Populations Across European River Systems: Consequences for Conservation and Restoration. For. Ecol. Manag. 2008, 255, 1388–1399. [Google Scholar] [CrossRef]
- Callahan, C.M.; Rowe, C.A.; Ryel, R.J.; Shaw, J.D.; Madritch, M.D.; Mock, K.E. Continental-Scale Assessment of Genetic Diversity and Population Structure in Quaking Aspen (Populus tremuloides). J. Biogeogr. 2013, 40, 1780–1791. [Google Scholar] [CrossRef]
- Zhai, F.; Mao, J.; Liu, J.; Peng, X.; Han, L.; Sun, Z. Male and Female Subpopulations of Salix viminalis Present High Genetic Diversity and High Long-Term Migration Rates Between Them. Front. Plant Sci. 2016, 7, 330. [Google Scholar] [CrossRef]
- Manni, F.; Guérard, E.; Heyer, E. Geographic Patterns of (Genetic, Morphologic, Linguistic) Variation: How Barriers Can Be Detected by Using Monmonier’s Algorithm. Hum. Biol. 2004, 76, 173–190. [Google Scholar] [CrossRef] [PubMed]
- Patten, M.A.; Smith-Patten, B.D. Biogeographical Boundaries and Monmonier’s Algorithm: A Case Study in the Northern Neotropics. J. Biogeogr. 2008, 35, 407–416. [Google Scholar] [CrossRef]
- Li, C.; Yang, S.; Zhao, J.X.; Dosseto, A.; Bi, L.; Clark, T.R. The Time Scale of River Sediment Source-to-Sink Processes in East Asia. Chem. Geol. 2016, 446, 138–146. [Google Scholar] [CrossRef]
- Egelund, B.; Pertoldi, C.; Barfod, A.S. Isolation and Reduced Gene Flow Among Faroese Populations of Tea-Leaved Willow (Salix phylicifolia, Salicaceae). New J. Bot. 2012, 2, 9–15. [Google Scholar] [CrossRef]
- Ingvarsson, P.K. Restoration of Genetic Variation Lost—The Genetic Rescue Hypothesis. Trends Ecol. Evol. 2001, 16, 62–63. [Google Scholar] [CrossRef]
- Tallmon, D.A.; Luikart, G.; Waples, R.S. The Alluring Simplicity and Complex Reality of Genetic Rescue. Trends Ecol. Evol. 2004, 19, 489–496. [Google Scholar] [CrossRef]
- National Research Council. Managing Global Genetic Resources: Agricultural Crop Issues and Policies; The National Academies Press: Washington, DC, USA, 1993.
- Doyle, J.J.; Dickson, E.E. Preservation of Plant Samples for DNA Restriction Endonuclease Analysis. Taxon 1987, 36, 715–722. [Google Scholar] [CrossRef]
- Lu, H.Y.; Shih, H.C.; Ju, L.P.; Hwang, C.C.; Chiang, Y.C. Characterization of 39 Microsatellite Markers from Nuphar shimadai (Nymphaeaceae) and Cross-Amplification in Two Related Taxa. Appl. Plant Sci. 2018, 6, e1188. [Google Scholar] [CrossRef]
- Benson, G. Tandem Repeats Finder: A Program to Analyze DNA Sequences. Nucleic Acids Res. 1999, 27, 573–580. [Google Scholar] [CrossRef]
- Rozen, S.; Skaletsky, H. Primer3 on the WWW for General Users and for Biologist Programmers. In Bioinformatics Methods and Protocols; Humana: Totowa, NJ, USA, 1999; pp. 365–386. [Google Scholar]
- Mantiquilla, J.A.; Shiao, M.S.; Lu, H.Y.; Sridith, K.; Sidique, S.N.M.; Liyanage, W.K.; Chu, Y.L.; Shih, H.C.; Chiang, Y.C. Deep Structured Populations of Geographically Isolated Nipa (Nypa fruticans Wurmb.) in the Indo-West Pacific Revealed Using Microsatellite Markers. Front. Plant Sci. 2022, 13, 1038998. [Google Scholar] [CrossRef]
- Peakall, R.; Smouse, P.E. GenAlEx 6.5: Genetic Analysis in Excel. Population Genetic Software for Teaching and Research—An Update. Bioinformatics 2012, 28, 2537–2539. [Google Scholar] [CrossRef] [PubMed]
- Pritchard, J.K.; Wen, W.; Falush, D. Documentation for Structure Software, Version 2.3; University of Chicago: Chicago, IL, USA, 2010.
- Li, Y.L.; Liu, J.X. StructureSelector: A Web-Based Software to Select and Visualize the Optimal Number of Clusters Using Multiple Methods. Mol. Ecol. Resour. 2018, 18, 176–177. [Google Scholar] [CrossRef] [PubMed]
- Nei, M. Genetic Distance Between Populations. Am. Nat. 1972, 106, 283–292. [Google Scholar] [CrossRef]
- Paradis, E.; Schliep, K. ape 5.0: An Environment for Modern Phylogenetics and Evolutionary Analyses in R. Bioinformatics 2019, 35, 526–528. [Google Scholar] [CrossRef]
- Jombart, T. adegenet: An R Package for the Multivariate Analysis of Genetic Markers. Bioinformatics 2008, 24, 1403–1405. [Google Scholar] [CrossRef]
- Wilson, G.A.; Rannala, B. Bayesian Inference of Recent Migration Rates Using Multilocus Genotypes. Genetics 2003, 163, 1177–1191. [Google Scholar] [CrossRef]

| Source | d.f. | S.S. | Mean S.S. | Estimated Variance | % | Fixation Index |
|---|---|---|---|---|---|---|
| Across geographic regions | ||||||
| Among regions | 2 | 238.29 | 119.15 | 1.54 | 15 | FST = 0.15 * |
| Among populations | 107 | 1479.57 | 13.83 | 5.08 | 49 | FIS = 0.58 * |
| Within populations | 110 | 402.50 | 3.66 | 3.66 | 36 | FIT = 0.64 * |
| Total | 219 | 2120.36 | 10.29 | 100 |
| Populations | SBF | ISL | IS | SB | NC | NW | NT | PM |
|---|---|---|---|---|---|---|---|---|
| SBF | ------- | 0.5773 | 0.6442 | 0.6682 | 0.6435 | 0.6873 | 0.6238 | 0.6818 |
| ISL | 0.5773 | ------- | 0.5782 | 0.7509 | 0.6802 | 0.7013 | 0.6637 | 0.7047 |
| IS | 0.6442 | 0.5782 | ------- | 0.6783 | 0.6616 | 0.7399 | 0.6702 | 0.7315 |
| SB | 0.6682 | 0.7509 | 0.6783 | ------- | 0.6062 | 0.6656 | 0.5868 | 0.6714 |
| NC | 0.6435 | 0.6802 | 0.6616 | 0.6062 | ------- | 0.5336 | 0.4779 | 0.6014 |
| NW | 0.6873 | 0.7013 | 0.7399 | 0.6656 | 0.5336 | ------- | 0.4174 | 0.6342 |
| NT | 0.6238 | 0.6637 | 0.6702 | 0.5868 | 0.4779 | 0.4174 | ------- | 0.6161 |
| PM | 0.6818 | 0.7047 | 0.7315 | 0.6714 | 0.6014 | 0.6342 | 0.6161 | ------- |
| Populations | To NC | To NW | To NT | To PM | To SBF | To ISL | To IS |
|---|---|---|---|---|---|---|---|
| From NC | 0.8885 (0.0363) | 0.0187 (0.0177) | 0.0185 (0.0175) | 0.0179 (0.0170) | 0.0191 (0.0182) | 0.0180 (0.0168) | 0.0192 (0.0181) |
| From NW | 0.0382 (0.0268) | 0.8575 (0.0409) | 0.0207 (0.0194) | 0.0203 (0.0186) | 0.0208 (0.0197) | 0.0212 (0.0205) | 0.0213 (0.0198) |
| From NT | 0.0250 (0.0228) | 0.0260 (0.0239) | 0.8463 (0.0446) | 0.0256 (0.0235) | 0.0262 (0.0242) | 0.0259 (0.0240) | 0.0251 (0.0230) |
| From PM | 0.0097 (0.0093) | 0.0094 (0.0090) | 0.0094 (0.0094) | 0.9424 (0.0209) | 0.0098 (0.0095) | 0.0098 (0.0092) | 0.0095 (0.0094) |
| From SBF | 0.0174 (0.0162) | 0.0173 (0.0168) | 0.0174 (0.0164) | 0.0177 (0.0163) | 0.8951 (0.0346) | 0.0180 (0.0171) | 0.0171 (0.0162) |
| From ISL | 0.0151 (0.0141) | 0.0148 (0.0144) | 0.0151 (0.0143) | 0.0151 (0.0145) | 0.0152 (0.0145) | 0.9095 (0.0307) | 0.0152 (0.0145) |
| From IS | 0.0205 (0.0192) | 0.0213 (0.0203) | 0.0215 (0.0199) | 0.0212 (0.0202) | 0.0205 (0.0193) | 0.0207 (0.0193) | 0.8743 (0.0395) |
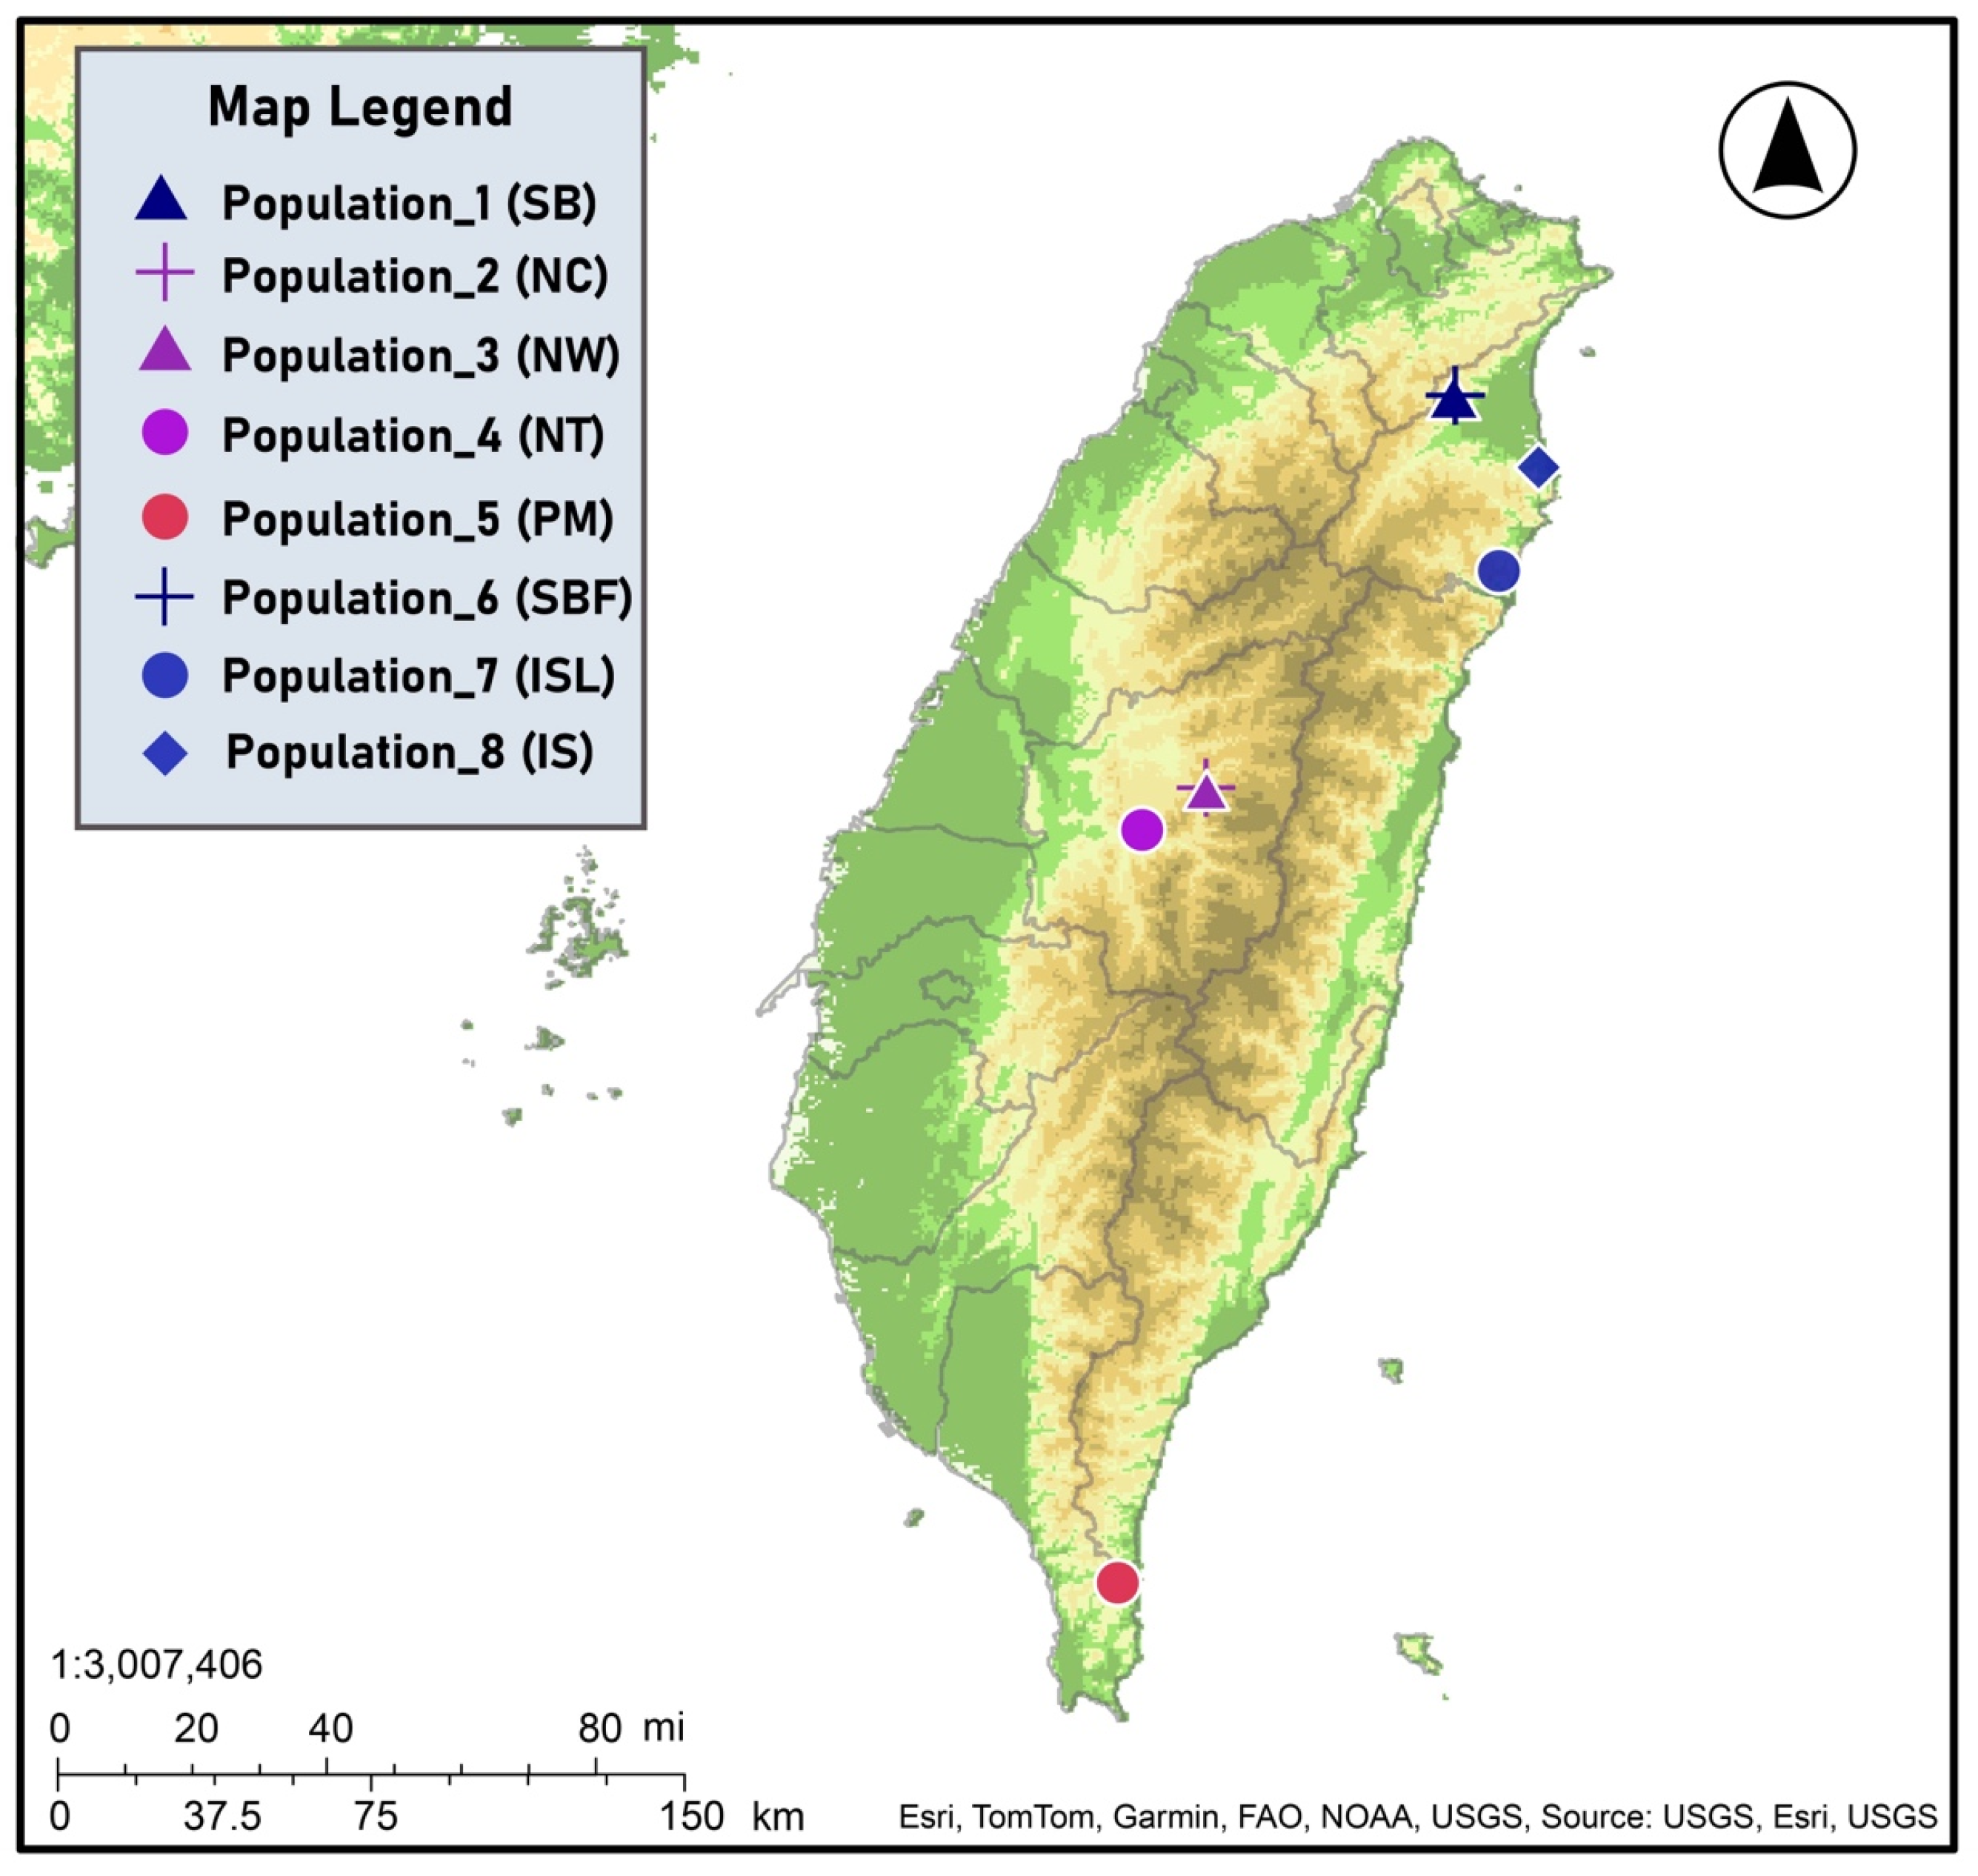
| Populations | Geographic Locations | Symbols | No. of Individuals |
|---|---|---|---|
| Yilan County (NE) | SB | 20 |
| Nantou County (C) | NC | 11 |
| Nantou County (C) | NW | 9 |
| Nantou County (C) | NT | 6 |
| Pingtung County (S) | PM | 28 |
| Yilan County (NE) | SBF | 12 |
| Yilan County (NE) | ISL | 15 |
| Yilan County (NE) | IS | 9 |
| Total | 110 |
Disclaimer/Publisher’s Note: The statements, opinions and data contained in all publications are solely those of the individual author(s) and contributor(s) and not of MDPI and/or the editor(s). MDPI and/or the editor(s) disclaim responsibility for any injury to people or property resulting from any ideas, methods, instructions or products referred to in the content. |
© 2025 by the authors. Licensee MDPI, Basel, Switzerland. This article is an open access article distributed under the terms and conditions of the Creative Commons Attribution (CC BY) license (https://creativecommons.org/licenses/by/4.0/).
Share and Cite
Palangasinghe, P.C.; Ko, Y.-Z.; Hsu, T.-W.; Wickramasinghe, M.P.; Shih, H.-C.; Shiao, M.-S.; Chiang, Y.-C. Genetic Structure and Conservation Management of Endemic Salix kusanoi in Fragmented Habitats of Taiwan. Plants 2025, 14, 1080. https://doi.org/10.3390/plants14071080
Palangasinghe PC, Ko Y-Z, Hsu T-W, Wickramasinghe MP, Shih H-C, Shiao M-S, Chiang Y-C. Genetic Structure and Conservation Management of Endemic Salix kusanoi in Fragmented Habitats of Taiwan. Plants. 2025; 14(7):1080. https://doi.org/10.3390/plants14071080
Chicago/Turabian StylePalangasinghe, Piumi Chathurika, Ya-Zhu Ko, Tsai-Wen Hsu, Manupa Pabasara Wickramasinghe, Huei-Chuan Shih, Meng-Shin Shiao, and Yu-Chung Chiang. 2025. "Genetic Structure and Conservation Management of Endemic Salix kusanoi in Fragmented Habitats of Taiwan" Plants 14, no. 7: 1080. https://doi.org/10.3390/plants14071080
APA StylePalangasinghe, P. C., Ko, Y.-Z., Hsu, T.-W., Wickramasinghe, M. P., Shih, H.-C., Shiao, M.-S., & Chiang, Y.-C. (2025). Genetic Structure and Conservation Management of Endemic Salix kusanoi in Fragmented Habitats of Taiwan. Plants, 14(7), 1080. https://doi.org/10.3390/plants14071080