Article

Multiple Dataset-Based Insights into the Phylogeny and Phylogeography of the Genus Exbucklandia (Hamamelidaceae): Additional Evidence on the Evolutionary History of Tropical Plants

1
State Key Laboratory of Biocontrol and Guangdong Provincial Key Laboratory of Plant Resources, School of Life Sciences, Sun Yat-sen University, Guangzhou 510275, China
2
Co-Innovation Center for Sustainable Forestry in Southern China, Key Laboratory of National Forestry and Grassland Administration on Subtropical Forest Biodiversity Conservation, College of Life Science, Nanjing Forestry University, Nanjing 210037, China
3
College of Forestry and Landscape Architecture, South China Agricultural University, Guangzhou 510642, China
4
Guangxi Key Laboratory of Quality and Safety Control for Subtropical Fruits, Guangxi Subtropical Crops Research Institute, Nanning 530001, China
5
College of Horticulture and Landscape Architecture, Zhongkai University of Agriculture and Engineering, Guangzhou 510250, China
6
Guangdong Geological Survey Institute, Guangzhou 510080, China
*
Authors to whom correspondence should be addressed.
Plants 2025, 14(7), 1061; https://doi.org/10.3390/plants14071061
Submission received: 24 January 2025 / Revised: 23 March 2025 / Accepted: 24 March 2025 / Published: 29 March 2025

Abstract

Southeast Asia’s biodiversity refugia, shaped by Neogene–Quaternary climatic shifts and the Tibetan Plateau uplift, preserve relict lineages like Exbucklandia (Hamamelidaceae). Once widespread across ancient continents, this genus now survives in Asian montane forests, offering insights into angiosperm diversification. Chloroplast haplotypes formed three clades—Clade I (E. tricuspis), Clade II (E. populnea), and Clade III (E. tonkinensis)—with E. longipetala haplotypes nested within II/III. Nuclear microsatellites (SSRs) identified two ancestral gene pools: E. populnea and E. tricuspis showed predominant ancestry in Pool A, while E. tonkinensis and E. longipetala were primarily assigned to Pool B. All taxa exhibited localized genetic admixture, particularly in sympatric zones. Divergence dating traced the genus’ origin to tropical Asia, with northward colonization of subtropical China ~7 Ma yielding E. populnea and E. tonkinensis. Quaternary Glacial Cycles triggered southward expansions, chloroplast capture, and localized hybridization. Morphological, nuclear, and plastid molecular evidence supports reclassifying E. longipetala as E. populnea × E. tonkinensis hybrids lacking genetic cohesion and E. tricuspis as a distinct species with a mixed nuclear composition. This study highlights how paleoclimate-driven gene flow shaped the phylogeography of relict taxa in Southeast Asia and the urgency of habitat restoration to conserve Exbucklandia.

1. Introduction

Neogene palaeogeographical changes and Quaternary climatic fluctuations have significantly influenced the genetic structure and divergent lineages of modern Southeast Asian plants [1,2,3,4]. During the Quaternary period, many plant species persisted in very limited locations or faced severe constraints, as population expansion and migration were strongly hindered by montane orogenesis and recurring glacial periods [5,6,7]. These enduring plant taxa, which survived extreme geological and climatic events, are referred to as “relict” taxa or “living fossils” (such as Ginkgo biloba Linnaeus and Cathaya argyrophylla Chun & Kuang). They are believed to be the sole surviving members of once-diverse taxa and provide valuable insights into species extinction and diversification, with their distribution patterns becoming ‘hotspots’ for biogeography and conservation biology [8,9,10,11,12,13]. The uplift of the Tibetan Plateau has facilitated the formation of the Asian monsoon climate, significantly impacting the climate of South China and influencing local plant distribution patterns [14,15,16,17,18,19]. The establishment of the East Asian monsoon system led to a transition from arid to humid conditions across most parts of South China, allowing paleotropical forests to expand from southern coastal areas into northern inland regions (i.e., from Malaysia–Indonesia region to Southeast China) [20,21,22,23]. Consequently, the plant communities in East and South China possess intricate historical origins and harbor a vast array of diverse plant species. This rich diversity makes the region an excellent subject for studying plant species diversity and historical population dynamics in the context of global climatic and geological changes.
Exbucklandia R. W. Brown (Hamamelidaceae) is a kind of relict trees currently found only in tropical–subtropical evergreen broadleaved forests (EBLFs) of East and South Asia, primarily at altitudes of 1000 m or higher [24,25,26,27]. Fossil records indicate that Exbucklandia was once widely distributed across the warm temperate zones of both the New World and the Old World, with its origins dating back to no later than the Tertiary period, specifically since the Late Cretaceous [28,29,30,31,32,33,34,35,36,37]. Additionally, Exbucklandioideae represents an early diverging lineage within Hamamelidaceae, consisting solely of the genus Exbucklandia. As an ancient and genetically unique monophyletic lineage, Exbucklandia holds significant importance for paleobotanists and modern botanists in exploring the origins and early evolution of angiosperms [24,38,39,40,41,42].
Exbucklandia comprises four recognized species according to Flora Reipublicae Popularis Sinicae [43] (Figure 1): Exbucklandia tonkinensis (Lecomte) H. T. Chang is distributed sporadically in the mountainous evergreen forests of southern and southwestern China, as well as northern Vietnam. It is representative of the typical flora found in the southern subtropical evergreen broad-leaved forests. Exbucklandia populnea (R. Br. ex Griff.) R. W. Brown has a wide distribution in the montane evergreen forests of Southwest China, as well as in India, Myanmar, and Thailand. Exbucklandia longipetala H. T. Chang, which is documented in the southern Guizhou and northern Guangxi regions of China, contributes to the diversity of the genus within its limited range. Exbucklandia tricuspis (Hall.) Chang was published by H. T. Chang in Acta Scientiarum Naturalium Universitatis Sunyatseni (1959, 1973) as a new combination of several specimens collected in the Malaysia–Indonesia region [44,45]. Even though E. tricuspis has not been listed in certain taxonomic databases, such as Tropicos [46] and the World Flora Online (WFO) Plant List [47], it is a validly published species under the International Code of Nomenclature (ICN) [48].
Taxonomic studies on Exbucklandia have primarily concentrated on morphological characters, leading to some controversy among botanists regarding the classification of certain species. For instance, in H. T. Chang’s study, E. tricuspis (Figure 1k,l) is distinguished by its small trilobed leaves, narrow stipules (up to 4 cm × 8 mm), and capitulate infructescences bearing 8–13 capsule features, which distinctly differentiate it from E. populnea, found in continental Asia. However, it has been taxonomically merged into E. populnea in other botanical works [38,49]. Additionally, E. longipetala was first described as a new species in 1959 due to its distinctly elongated petals [43,44,45] (Figure 1j), but this characteristic has also been observed in wild populations of both E. populnea and E. tonkinensis. In the study of fossil taxa, comparative analyses of morphology and distribution between E. acutifolia J. Huang et Z. K. Zhou sp. nov., a fossil foliage reported in Yunnan province, China, and the modern Exbucklandia species suggest that the distribution boundaries of Exbucklandia have shifted over time [37,42]. Specifically, there appears to be a trend of Sino-Himalayan expansion and Sino-Japanese recession in the distribution of these species.
Currently, there is a lack of genomic data for Exbucklandia species, and constructing a ddRAD-seq library has proven challenging due to the rapid degradation of its total DNA material. In this study, we sampled a total of 59 populations representing all four species in the genus Exbucklandia across southeastern Asia. Then, we conducted PCR amplification of 21 SSR markers across 50 populations (14–27 individuals of each) and of 4 cpDNA regions across 56 populations (8 individuals of each) to investigate their population genetics. In addition, we applied shallow-genome sequencing technology to one representative sample from each population to obtain plastid genomes. Using these data, we constructed plastid phylogenetic relationships and population genetic structure of nuclear genes (SSRs). Through these efforts, we aimed to achieve two main objectives: (1) clarifying the taxonomic boundaries of the four Exbucklandia species by integrating morphological and molecular data; (2) investigating how historical geological and climatic factors have influenced the current distribution patterns of Exbucklandia species.

2. Results

2.1. Haplotype Network of the Combined Chloroplast Regions

Four chloroplast fragments (trnSpsbZ, trnGtrnfMrps14, trnV, and rpl32) were successfully amplified in 56 of 59 populations (eight individuals of each population) of all four Exbucklandia species. After alignment and trimming, the combined-sequence length was 2345 bp without gaps. The combined dataset, incorporating outgroup sequences (Rhodoleia championii Hook. f.), was trimmed to 2401 bp and employed for haplotype network reconstruction. Each population was detected to have only one chloroplast haplotype, and a total of twenty-one haplotypes were detected, with 25 single-nucleotide variants (SNVs) (Tables S1 and S2). Haplotype network analysis (Figure 2a) showed that four haplotypes were detected in E. tricuspis forming Clade I, nine unique haplotypes in E. populnea forming Clade II, and six haplotypes in E. tonkinensis forming Clade III. For E. longipetal, three haplotypes were observed across the four populations sampled: one haplotype was grouped in Clade II and two in Clade III. The geographical distribution of these haplotypes (Figure 2b) indicated distinct patterns: Clade I was located in Southern Asia, Clade II was present in Southwest China, and Clade III was found in Southeast China. Notably, haplotype C1, which was positioned centrally in the haplotype network, was recorded in the four populations sampled from Vietnam.

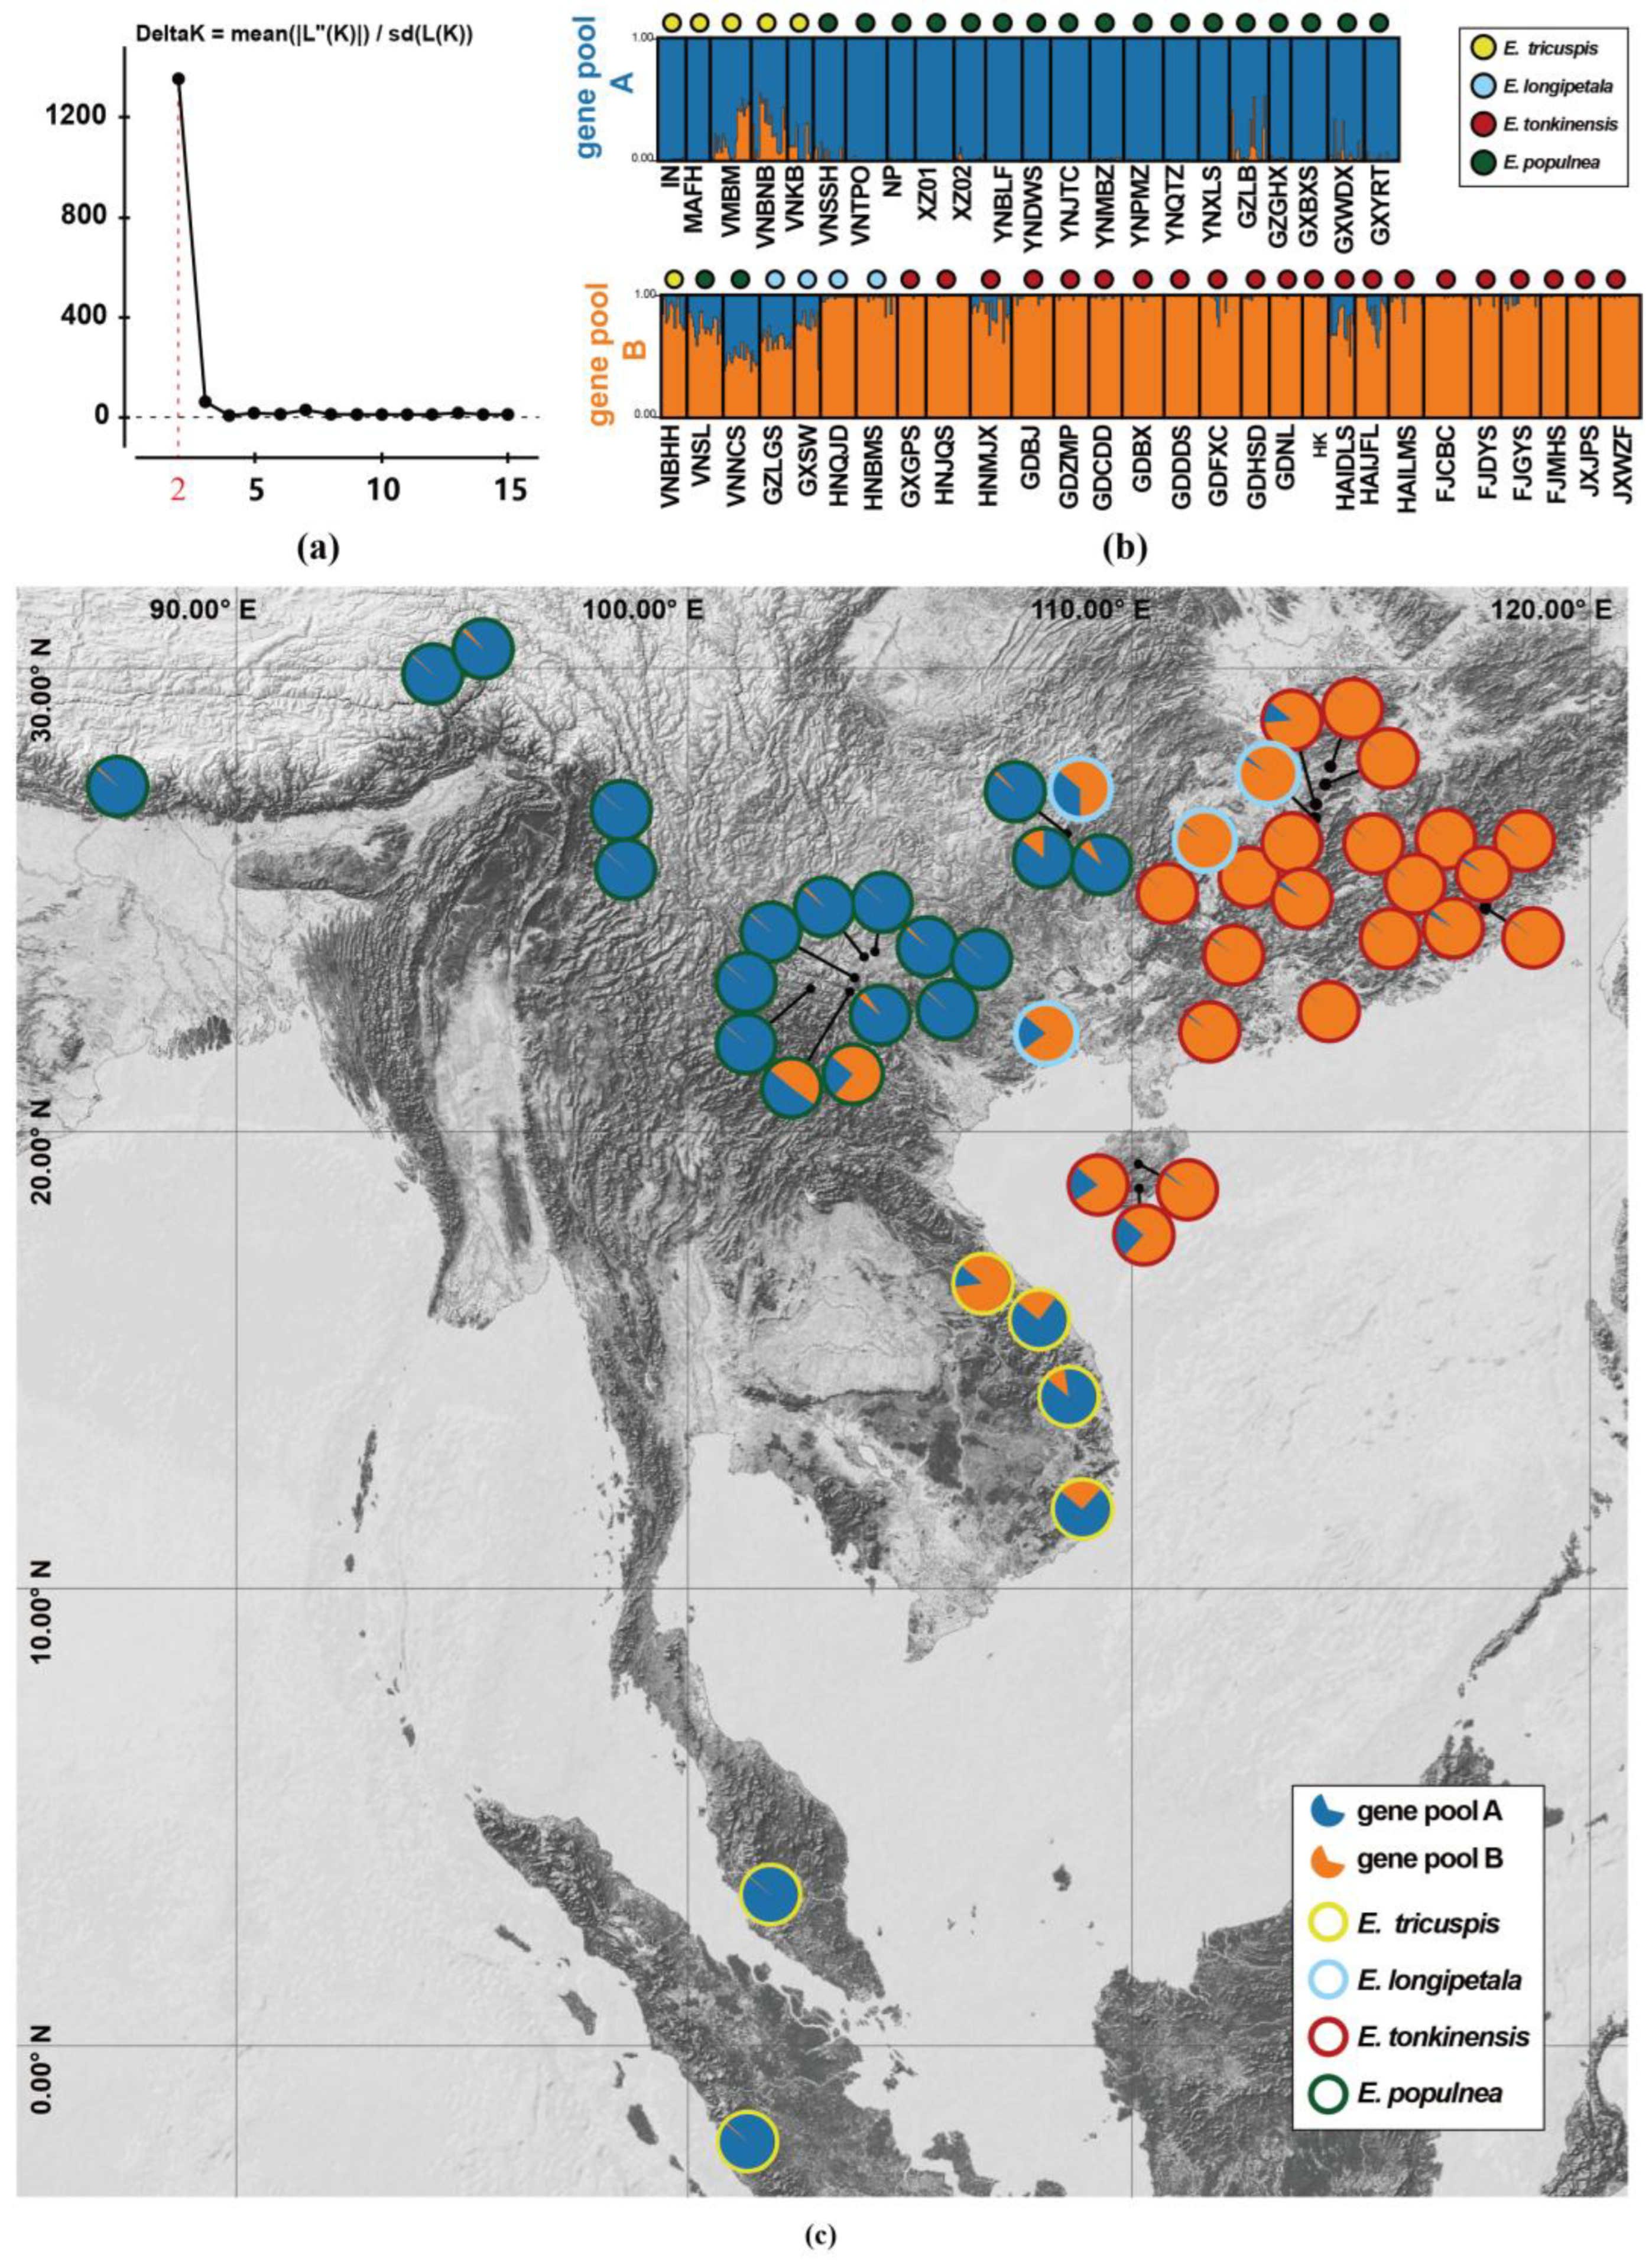
2.2. Population Genetics Based on SSR Loci

Of the 24 SSR loci analyzed, 21 loci showed consistent amplification across more than 90% of populations, while 3 loci were excluded from further analysis due to PCR amplification efficiencies below 50%. For these 21 SSR loci, a total of 244 alleles were detected across the 50 populations (14–27 individuals of each), with 6–18 alleles at each locus (Table S3). These alleles showed similar allele size ranges compared to previous research on the development of these SSR markers [50], supporting the reliability of these markers used in this study. Among these 50 populations, Shannon’s Diversity Index (I) ranged from 0.16 to 1.22 (mean 0.649 ± 0.242); the observed heterozygosity (HO) ranged from 0.072 to 0.481 (mean 0.296 ± 0.107), the expected heterozygosity (HE) ranged from 0.198 to 0.547 (mean 0.372 ± 0.092), and the fixation index (F) ranged from −0.158 to 0.422 (mean 0.152 ± 0.141) (Table 1).
The F-statistics of the 21 SSR loci, performed to analyze the genetic diversity of the whole genus and of the different groups of samples, are revealed in Table 2 (the statistical results of each locus are shown in Table S4). Genetic differentiation (FST) ranged from 0.432 (±0.023) in E. tonkinensis to 0.557 (±0.04) in E. populnea, with moderate-to-high divergence (mean FST = 0.507–0.536). Inbreeding coefficients (FIS) were highest in E. tricuspis (0.283 ± 0.07) and lowest in E. longipetala (0.116 ± 0.063). Gene flow (NM) was notably higher in E. tonkinensis (0.367 ± 0.037) compared to other species. Notably, the overall fixation index (FIT) consistently exceeded FST and FIS values in all taxa, highlighting substantial genetic structure both within and among populations.
The structure analysis conducted on the 50 populations of Exbucklandia revealed that the optimal ΔK value was two (Figure 3a). The populations were divided into two distinct genetic pools (Figure 3b,c): E. populnea was derived mostly from gene pool A, while E. tonkinensis harbored mostly gene pool B. In areas bordering the distribution of these species, such as in Northern Vietnam and Southern China, populations exhibited an admixture of these two gene pools. For the four populations of E. longipetala, the two located near E. populnea (GZLGS and GXSW) showed an admixture of the two gene pools, while the other two populations near E. tonkinensis in Hunan province were derived mostly from pool B, as were most of the E. tonkinensis populations. For E. tricuspis, the two populations in Malaysia–Indonesia region were predominantly assigned to pool A components; all four populations in Vietnam exhibited an admixture of pools A and B, with three dominated by pool A and one showing a higher proportion derived from pool B.

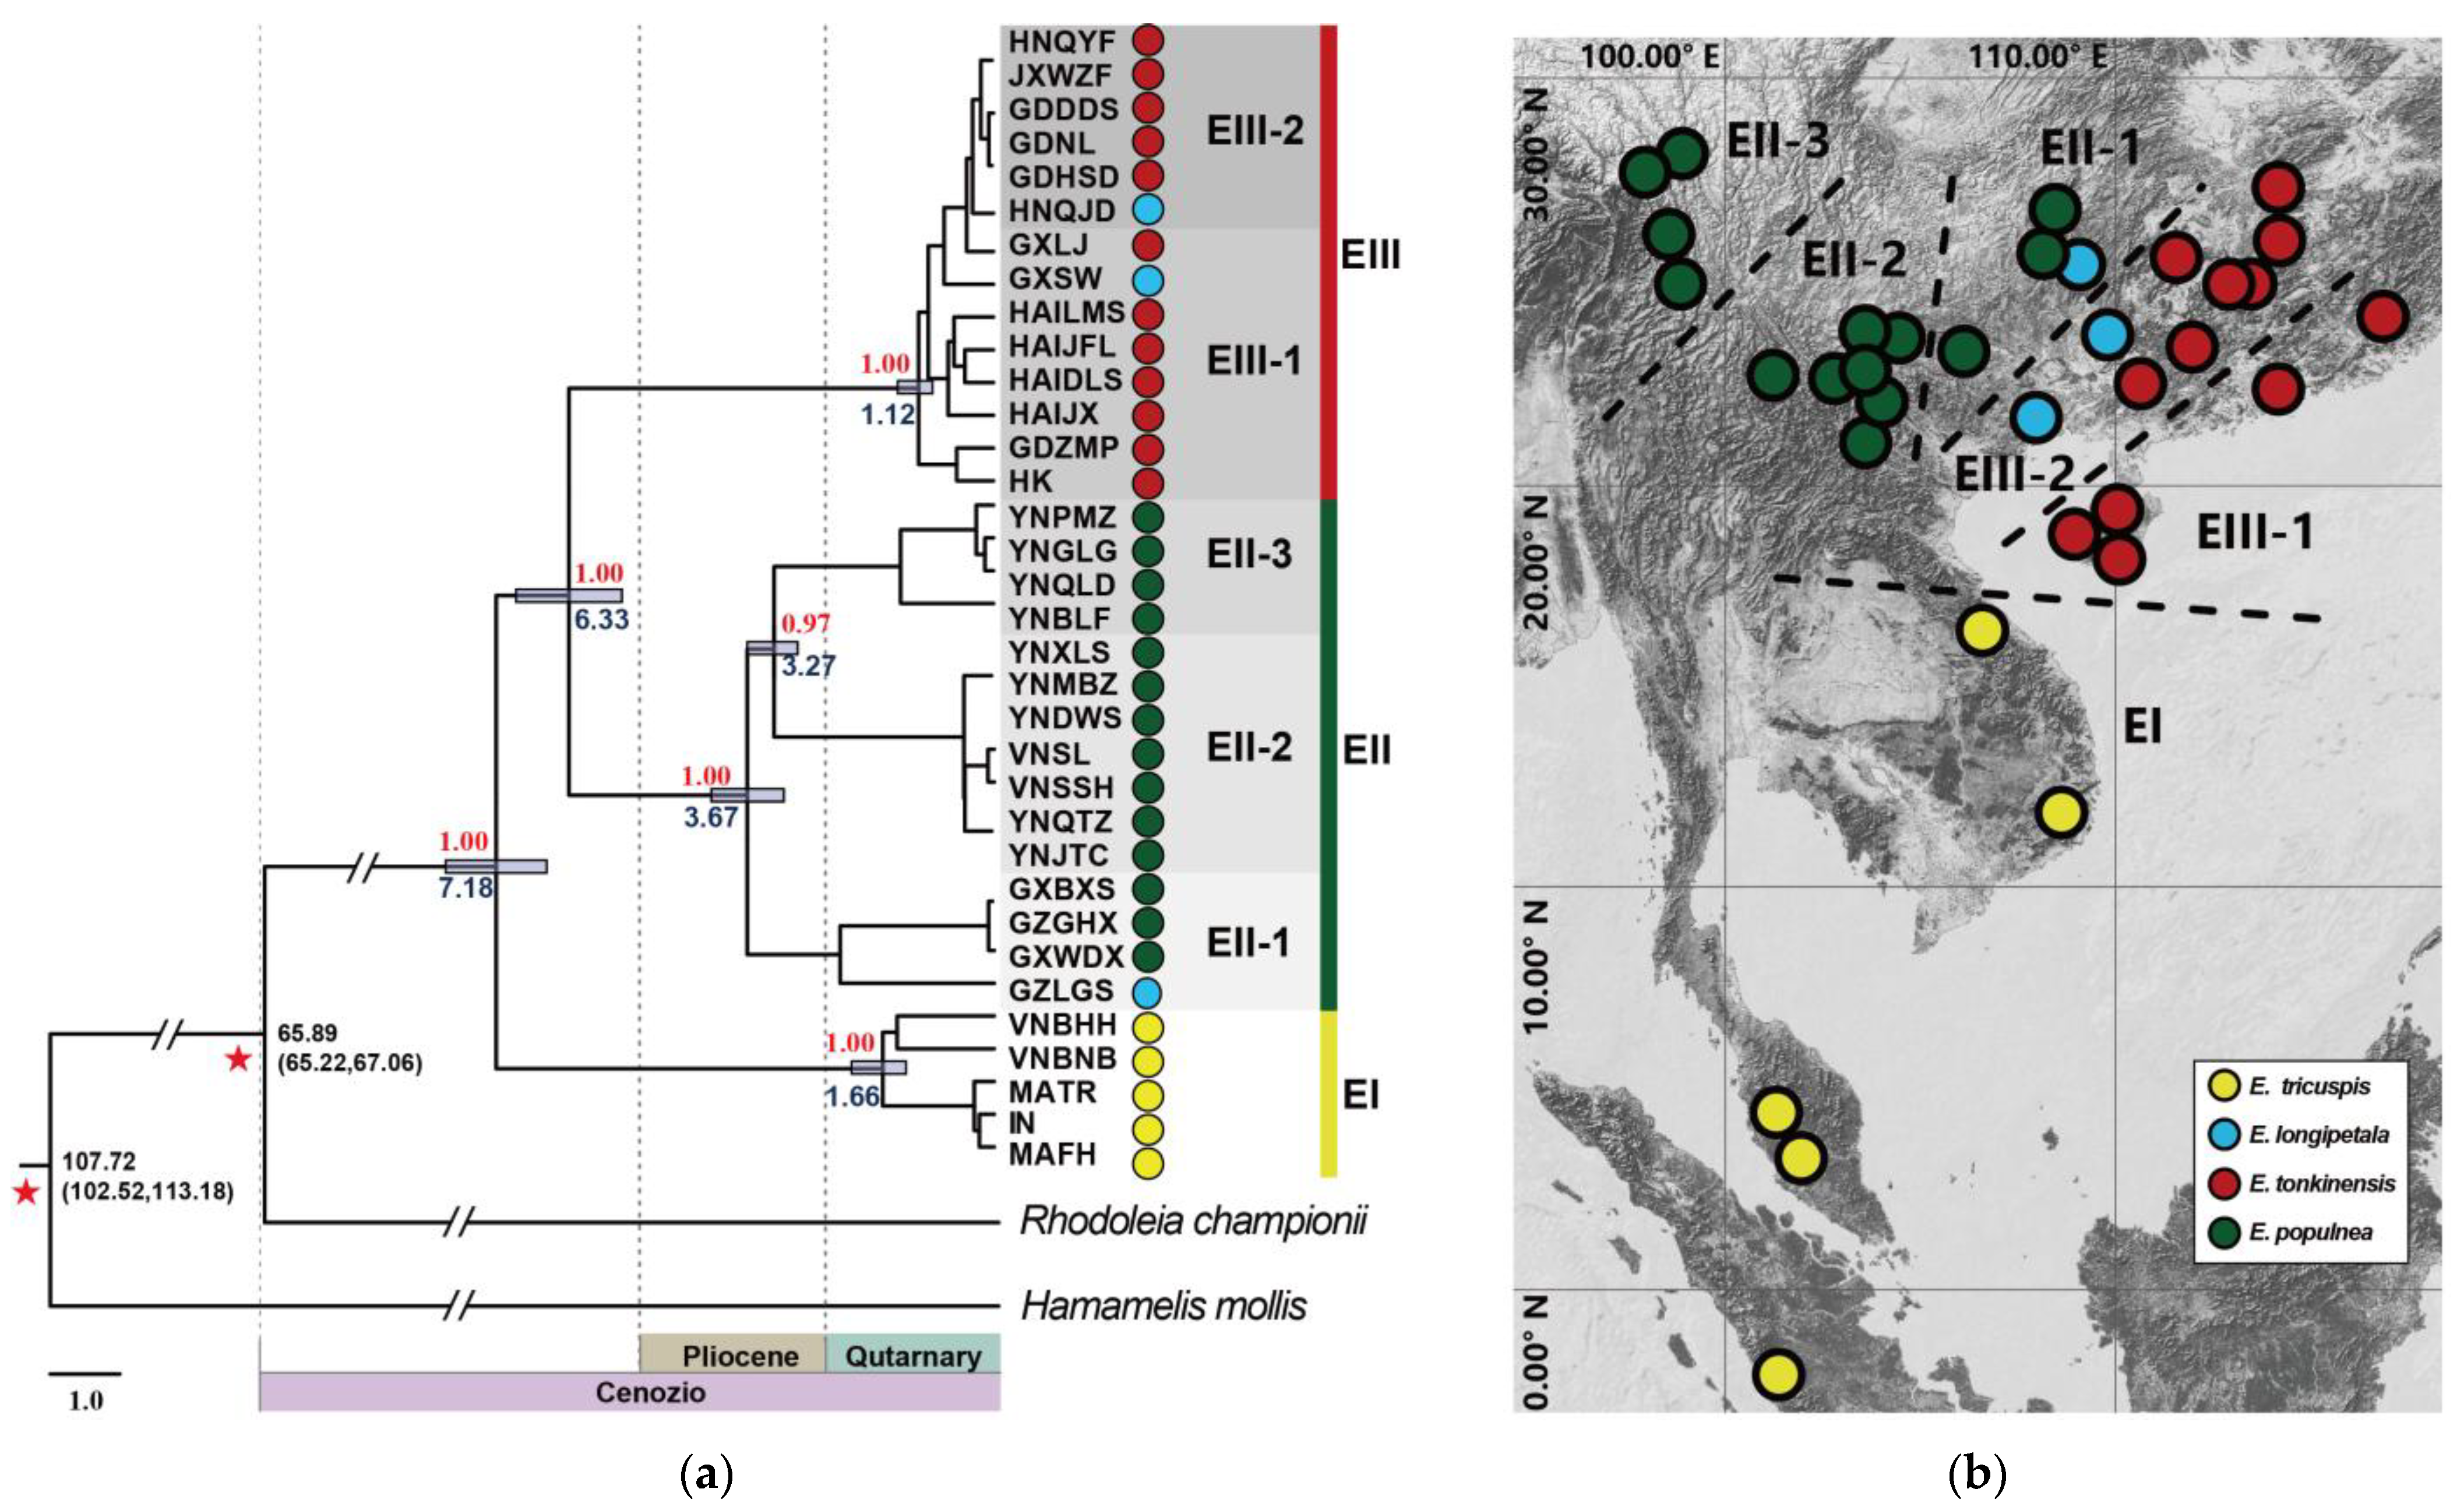
2.3. Phylogenetic Trees and Divergence Time Estimation

Finally, the total DNA extracts from 34 representative individuals (out of the 59 individuals total) met the requirements for high-throughput sequencing. Approximately 6 Gb of raw data was obtained from each of the 34 Exbucklandia individuals, and plastid genomes were successfully assembled for all of them (GenBank accession numbers: PV132455–PV132488, Table S5). These plastid genomes exhibited a typical quadripartite structure, with lengths ranging from 160,554 to 160,905 bp (Table S5). No significant structural differences were observed among individuals from different taxa or geographical distributions.
Phylogenetic reconstruction and divergence time estimation were conducted using Rhodoleia championii Hook. f. and Hamamelis mollis Oliv. as outgroups, revealing that the most recent common ancestor (TMRCA) of extant Exbucklandia species diverged approximately 7.18 million years ago (MA) (Figure 4a). A Bayesian inference (BI) tree constructed with 34 Exbucklandia individuals and multiple outgroups confirmed that Exbucklandia and Rhodoleia together form a basal lineage of Hamamelidaceae (Figure S1). Subsequent BI and maximum likelihood (ML) analyses of these Exbucklandia individuals, with R. championii as the outgroup, demonstrated topological congruence with the time-calibrated phylogeny (Figures S2 and S3). The time of the most recent common ancestor (TMRCA) of all the extant Exbucklandia was estimated to be 7.18 MA. The samples of E. tricuspis, E. tonkinensis, and E. populnea formed three distinct monophyletic groups, designated as clades EI, EII, and EIII, with their respective TMRCA estimated at 1.66 MA, 3.67 MA, and 1.12 MA. Clades EII (E. populnea) and EIII (E. tonkinensis) exhibited a sister relationship, diverging at ~6.33 MA, and subsequently clustered with clade EI (E. tricuspis). The three samples of E. longipetala did not form a monophyletic group: one clustered within clade EII, and two within clade EIII. Clade EII can be further divided into three subclades (EII-1, EII-2, and EII-3), which were sampled from the eastern, central, and western distribution areas of E. populnea (Figure 4b). Clade EIII was further divided into two subclades: EIII-1 and EIII-2. The six samples in subclade EIII-1 were sampled from Hainan and coastal areas of Guangdong, while samples in subclade EIII-2 were collected from inland areas of Guangdong and neighboring provinces (Figure 4b).

3. Discussion

3.1. The Origin and Dispersal History of Exbucklandia by Seed Dispersal

Our phylogenetic dating using plastid genomes estimates the divergence of the Exbucklandia-Rhodoleia clade from other Hamamelidaceae lineages at 107.72 MA (95% HPD: 102.5234, 113.1766 MA), consistent with prior divergence estimates (about 85–110 MA) [42,51,52]. However, the TMRCA of Exbucklandia and Rhodoleia exhibits notable discrepancies across studies: the result of this study was estimated at 65.89 MA (95% HPD: 65.22–67.06 MA), in contrast to earlier estimates of about 80 MA [51], 55 MA [42], and 37 MA [52]. These variations likely arise from differential molecular dataset selection (nuclear vs. plastid gene evolutionary rate heterogeneity), molecular clock model (strict vs. relaxed), or taxon sampling strategies affecting node calibration. Crucially, the Late Cretaceous (>65 MA) fossil records of both Exbucklandia and Rhodoleia strongly conflict with the younger estimates of 55 MA and 37 MA. Regarding extant Exbucklandia species, the TMRCA was inferred to be 7 Ma—substantially younger than previous estimates of about 14–15 MA [42,51]. This disparity primarily reflects sampling scale differences that earlier studies employed limited Exbucklandia representatives (1–2 samples) alongside cross-genus and family data for joint calibration, whereas our analysis incorporated 34 complete plastid genomes for genus-specific temporal reconstruction. The narrower confidence intervals (55–70 MA vs. broader ranges in prior studies) and median estimate position further support the robustness of our dating framework.
Fossil records of lamina, flowers, and fruits of Exbucklandia have been extensively documented in East Asia and North America, dating from the Oligocene to the Pliocene [28,29,30,31,32,33,34,35,36,37], which indicates that there was once a broader global distribution of this genus during the Cenozoic. Currently, only four extant species of Exbucklandia are restricted to East Asia, with their TMRCA estimated to be 7.18 MA. This evidence supports the hypothesis that global cooling during the Late Tertiary contributed to the extinction of all Exbucklandia species in North America and most species in East Asia [25,35,37].
Mature capsules of Exbucklandia exhibit rapid curling and eject seeds ballistically over short distances during dehiscence under mechanical pressure. This dispersal mechanism with limited seed dispersal distance provides a slow seed dispersal (compared to pollen dispersal) in many tree populations, as observed in Juglans [53], Populus [54], and Quercus [55]. Consequently, the plastid lineage mediated directly by seed dispersal could provide valuable insights into the origin and dispersal of Exbucklandia. Plastid network analysis revealed that haplotype C1 occupies a central position, connecting Clade I, Clade II, and Clade III, as well as the outgroup, suggesting that it may represent the most ancient haplotype. By integrating the geographical distribution of these haplotypes with divergence time estimates, we propose that the extant Exbucklandia species originated from E. tricuspis in tropical Vietnam, where haplotype C1 occurred. Subsequently, this species spread northward to subtropical China approximately 7 MA, leading to the formation of E. populnea in the western region and E. tonkinensis in the eastern region. Within E. populnea, the plastid tree indicates that subclade EII-1 diverged from its sister subclades EII-2 and EII-3 approximately 3.67 MA (Figure 4a). Geographically, subclades EII-1, EII-2, and EII-3 are distributed in the eastern, central, and western regions of the species’ range, respectively (Figure 4b). These findings support the hypothesis that E. populnea originated in the eastern provinces of Guizhou and Guangxi, subsequently spreading to the western province of Yunnan around 3–4 MA. Within E. tonkinensis, subclade EIII-1 includes four samples collected from coastal areas of Southeast China, whereas subclade EIII-2 comprises samples from inland areas. This phylogeographic pattern suggests that E. tonkinensis originated in Hainan and the coastal areas of Guangdong, later spreading northward into inland regions. For E. tricuspis, the plastid network reveals that haplotypes C2–C4 are derived from C1, indicating that E. tricuspis spread from Vietnam to southern Malaysia. In summary, the extant Exbucklandia originated from Vietnam, with E. tricuspis represents the most ancestral lineage. It migrated northward to subtropical China ~7 MA, where it diverged into two species: E. populnea, which spread further northward to Guangxi and Guizhou provinces, and E. tonkinensis, which spread eastward to Hainan and coastal Guangdong. In addition, E. populnea expanded westward to Yunnan, diverging into subclades EII-1, EII-2, and EII-3. By approximately 1 MA, E. tonkinensis had spread northward to the inland areas of Guangdong and neighboring regions, while E. tricuspis moved southward to Malaysia. The northward migration of Exbucklandia from tropical Vietnam to subtropical China, estimated to occur ~7 MA, coincides with the intensification of the East Asian monsoon (EAM) during the 7–99 MA period [56]. This supports the hypothesis that the establishment and intensification of the EAM significantly altered the climate of subtropical China, creating conditions conducive to the habitation of various plant species [14,57,58].

3.2. The Southward Expansion of E. populnea and E. tonkinensis Through Pollen Dispersal

The analysis of genetic structure based on 21 SSR loci revealed that all 50 populations originated from two gene pools: E. populnea predominantly possessed gene pool A, while E. tonkinensis harbored gene pool B. These data indicate a lack of clear structure within E. tonkinensis and E. populnea, suggesting that Exbucklandia has a strong capacity for long-distance pollen dispersal while fruits fall in the vicinity of maternal trees, with a very small proportion successfully dispersed over long distances. The pronounced asymmetry in pollen versus seed dispersal is common in tree plants [53,54,59] as we have mentioned above.
Further observations showed that E. tricuspis exhibited two scenarios: populations in South Vietnam demonstrated a mixture of gene pools A and B, while those in Malaysia were primarily composed of gene pool A. Notably, E. tricuspis possesses its own plastid clade I. Based on these data, it is hypothesized that both E. populnea and E. tonkinensis spread southward into Vietnam, capturing the local plastid genome. The data also suggest that E. populnea appeared in Vietnam earlier than E. tonkinensis, allowing it to further expand into Malaysia without significant admixture from gene pool B. Plastid capture is a phenomenon frequently observed in other plant species, such as Fagales [60], Heuchera [61], Hieracium [62], Mitella [63], and Nothofagus [64]. Divergence time estimation indicated that E. tricuspis migrated from Vietnam to Malaysia at ~1 MA, suggesting that the southward dispersal of E. populnea and E. tonkinensis occurred less than 1 MA. During this period, a decrease in temperature during the ice age may drive the southward migration of E. populnea and E. tonkinensis, a biogeographic pattern shared by other subtropical taxa, such as Eriobotrya [65] and Ilex [66].

3.3. Taxonomic Implication of Exbucklandia Species

Chloroplast genetic and nuclear SSR-based structure analyses consistently resolved E. populnea and E. tonkinensis as two monophyletic lineages (Figure 2a, Figure 3b,c, and Figure 4a). Their distinct morphological traits and allopatric distributions further support their recognition as distinct species. Integrative evidence from chloroplast phylogenomics, divergence dating, and dispersal modeling indicated that late Tertiary climatic cooling triggered the European extinction of Exbucklandia, with surviving lineages persisting in Asian tropical region. Following East Asian monsoon intensification, ancestral populations diverged into subtropical niches: E. tonkinensis radiated within the Sino-Japanese Floristic Region under temperate monsoonal regimes, while E. populnea colonized the Sino-Himalayan zone. Notably, E. tonkinensis exhibits consistently rhombic leaves (Figure 1f,g) with entire margins in mature individuals, contrasting sharply with the cordate–palmate leaves of E. populnea (Figure 1c), and the rhombic leaves progressively reduce in size along the vertical canopy gradient, which minimizes self-shading through optimized light interception. Furthermore, E. tonkinensis produces larger, nutrient-rich fruits and seeds, which help enhance seedling survival in low-light understories—strategies critical for competing with co-occurring evergreen broadleaved taxa [67,68].
E. longipetala populations present non-monophyletic in the plastid haplotype network and phylogenetic tree, interspersing with those of E. tonkinensis and E. populnea. Additionally, in SSR-based structure analyses, these populations predominantly share the gene pool E. tonkinensis (gene pool B), with a minor admixture from E. populnea (gene pool A), coupling with the absence of distinct genetic clustering. Considering their occurrences along the contact zones between the two parental species and occasionally the long-petaled trait appearing in both parental species, it is supported that these populations are hybrid offspring. In sum, E. longipetala populations present a morphotype rather than a natural taxon, as its circumscription relies on convergent morphological traits (long petal) without phylogenetic cohesion. Thus, E. longipetala should not be recognized as a distinct species, and the long petal is not a reliable trait in morphological classification in Exbucklandia.
E. tricuspis possesses a unique ancient plastid genome and morphological features (Figure 1k,l, such as tri-acuminate leaf apex in mature individuals and elongated stipules. The transient tri-acuminate leaf morphology in juvenile E. populnea and E. tonkinensis—a likely ancestral trait retained from tropical progenitors—further corroborates this scenario. However, SSR-based structure analyses reveal that E. tricuspis lacks a distinct nuclear (SSR) genotype; its nuclear genetic structure is characterized by an admixture between E. populnea and E. tonkinensis in Vietnam or shared with E. populnea in Malaysia–Indonesia region. The genetic admixture suggests ancient plastid capture by E. populnea during southward expansion from subtropical China, followed by E. tonkinensis’s subsequent hybridization with resident populations in Vietnam. This cytonuclear discordance—where plastid genomes remain distinct but nuclear genes show introgression—aligns with patterns observed in other plants [69], with a prolonged interspecific gene flow yet maintained species boundaries. Thus, we recommend recognizing E. tricuspis as a distinct species.
To sum up, we suggest the genus Exbucklandia comprises three distinct species: E. tricuspis, E. populnea, and E. tonkinensis. During Quaternary Glacial Cycles, E. populnea and E. tonkinensis dispersed southward into tropical Asia and hybridized with resident E. tricuspis, thereby replacing the nuclear gene pool of E. tricuspis. In addition, E. populnea and E. tonkinensis maintained a distribution overlap in Guangxi and Guizhou, China, where hybrid individuals were produced but a monophyletic taxon did not yet present.

3.4. The Genetic Diversity and Conservation of Exbucklandia Species

By comparing the expected heterozygosity (HE) and Shannon’s information index (I) among different populations, we conclude that the populations in Vietnam and Hainan exhibit the highest genetic diversity within their corresponding species. For example, populations such as VNSSH (HE = 0.613, I = 1.220), HAIDLS (HE = 0.600, I = 1.106) and VMBM (HE = 0.588, I = 1.118) significantly exceed the average genetic diversity (HE = 0.372 ± 0.118), reflecting robust allelic richness (I > 1.0) and balanced allele frequencies. However, genetic structure analysis reveals that the genetic diversity of these populations is primarily a result of gene flow with related species rather than in situ variation. Therefore, we recommend conservation efforts for these populations, coupled with further studies should be conducted to assess their qualification as ‘core’ germplasm populations. Currently, we recommend in addition equally selecting ‘core’ germplasm populations from non-marginal distribution areas with highest genetic diversity, such as YNBLF (HE = 0.383, I = 0.649) in Yunnan, China, and GDBX (HE = 0.543, I = 1.017) in Guangdong, China.
Previous studies demonstrated that the FST values of Hamamelidaceae plants based on various molecular markers range from approximately 0.171 to 0.833 [70,71,72,73,74,75]. In this study, the FST value for the genus Exbucklandia is 0.536 ± 0.022, indicating that the genetic diversity of this genus is at an intermediate level. This value is relatively close to that of Disanthus cercidifolius subsp. longipes (Hamamelidaceae) (FST = 0.403), another relict tree [71].
The F-statistics analysis indicates that the FST value for E. tonkinensis (0.432) is lower than that of others, namely E. populnea (0.557) and E. tricuspis (0.507). This discrepancy may be attributed to the impact of human activities, as the distribution area of E. tonkinensis is highly populated. During our field investigations in Fujian and Guangdong, we observed that numerous populations comprised fewer than 50 mature individuals. Over recent decades, local communities in these areas extensively logged E. tonkinensis for mountain land reclamation. As the population declines and gene flow between individuals decreases, these populations face elevated risks of inbreeding depression and potential genetic collapse. Additionally, the loss of genetic variation through random genetic drift will further diminish their evolutionary potential. Therefore, habitat restoration and population augmentation should be prioritized through urgent conservation interventions in these regions. Additionally, with high genetic differentiation (FST > 0.5), E. populnea requires prioritized conservation through establishing seed banks or living gene banks to preserve their unique genetic diversity.

4. Materials and Methods

4.1. Sample Collection and DNA Extraction

Across the natural distribution of Exbucklandia, we collected fresh leaf samples from 23 populations of E. populnea and 25 populations of E. tonkinensis in Southern China and Vietnam, 7 populations of E. tricuspis in Vietnam, Malaysia, and Indonesia, and 4 populations of E. longipetala in Guangxi and Yunnan provinces, China (Table S6).
Fresh leaves were then dried and deposited in sealed bags with silica gel. The geographical information of the populations was recorded using a Garmin GPSMAP 62sc unit (Garmin, Shanghai, China). Voucher specimens were deposited at the Herbarium of Sun Yat-sen University (SYS). A total of 1048 individuals were sampled and selectively used in different genetic analyses. Genomic DNA of every sample was isolated from dried leaves by using the modified cetyltrimethylammonium bromide (CTAB) method [76] and purified by MicroElute DNA Clean-Up Kit D6296 (Omega Bio-Tek, Norcross, GA, USA).
Individuals from each population were used in three different molecular experiments. Due to the difficulty in extracting high-quality total DNA from fresh leaves of Exbucklandia, it could not be guaranteed that data from all three molecular experiments would be successfully obtained for each sample.
Based on pre-experiments, we identified two characteristics of Exbucklandia: (1) the extracted total DNA exhibited low purity with rapid degradation, likely due to elevated polysaccharide/protein concentrations in leaf tissue; (2) there were monomorphic chloroplast haplotypes in all sampled populations.
To balance cost efficiency, experimental feasibility, and data representativeness, we implemented the following strategies:
  • To construct a plastid tree with high support, 1 representative individual per population was selected for plastid genome sequencing, so that we could assemble complete chloroplast genome sequences to construct a plastid tree.
  • To construct a plastid haplotype network, we amplified four cpDNA fragments in 8 individuals per population, and the results showed that most populations harbored only one haplotype, suggesting that 8 individuals per population were sufficient.
  • For obtaining nuclear data, we selected populations containing ≥10 individuals to amplify with SSR primers to ensure the reliability of genetic diversity and population structure analyses.
Eventually, we successfully assembled chloroplast genomes from 34 representative individuals, amplified 4 chloroplast fragments across 56 populations (8 individuals per population), and genotyped 21 SSR loci in 50 populations (14–27 individuals per population). See Table 3 for details.
All three datasets, (1) chloroplast genomes, (2) chloroplast fragments, and (3) SSR markers, encompassed representative populations of all Exbucklandia species (E. populnea, E. tonkinensis, E. tricuspis, and E. longipetala). The integration of these multilocus data provides a robust framework for reconstructing the genus’ evolutionary trajectories and disentangling historical demographics from contemporary gene flow patterns.

4.2. Plastid Region Amplification and Haplotype Network Construction

For each population of the four Exbucklandia species, we randomly selected 8 individuals for PCR amplifications with primer pairs of the four chloroplast fragments (trnS-psbZ, trnG-trnfM-rps14, trnV, rpl32) (Tables S7 and S8). PCR amplification was performed with 2 × SanTaq PCR Mix (B8532061, Sangon Biotech Co., Ltd., Shanghai, China) following the manual instructions. PCR products were then purified and sequenced using Sanger sequencing analysis by TianYi HuiYuan Biotechnology Co., Ltd. (Wuhan, China). All the sequences were then assembled, aligned, and edited by using DNASTAR Lasergene v11.0 [77]. Haplotype network analysis of combined cpDNAs was performed with DnaSP v5.0 [78]

4.3. SSR Amplification, Inspection, and Diversity Analysis

Previously, we developed 24 pairs of polymorphic SSR primers for Exbucklandia species [50]. In this study, 21 of 24 were amplified across the 50 populations (more than 10 individuals) of the four Exbucklandia species (Table S9), while the remaining 3 primer pairs were excluded due to the amplification success rate (<50%). PCR amplification was performed according to the protocol described in Section 4.2. The Fragment Analyzer Automated CE System (Advanced Analytical Technologies [AATI], Ames, IA, USA) was used to inspect SSR fragments with Quant-i PicoGree dsDNA kit (1–500 bp; Invitrogen, Carlsbad, CA, USA), and PROSize v3.0 (AATI, https://www.agilent.com/en/product/automated-electrophoresis/fragment-analyzer-systems/fragment-analyzer-systems-software, access date: 16 September 2020) was used to analyze allele size. After a manual inspection and adjustment of allele size, GenAlEx v6.501 [79] was employed to calculate a range of genetic diversity indicators, including the number of observed alleles (NT), effective alleles (NE), observed heterozygosity (HO), expected heterozygosity (HE), fixation index (F), Shannon’s information index (I), and F-statistics analysis (FIS, FIT, FST, Nm). The genetic structure of the germplasm was analyzed using STRUCTURE software v2.3.4 [80].

4.4. Shallow Plastid Genome Sequencing and Assembly

For plastid genome sequencing, one sample was randomly selected for each of the 59 populations of the four Exbucklandia species, and high-quality total DNA material was successfully obtained for 34 samples and sent to JieRui BioScience Co., Ltd. (Guangzhou, China) for high-throughput sequencing on Hiseq X Ten (Illumina Inc.; San Diego, CA, USA) following the standard Illumina sequencing protocol with paired-end 150 bp reads, achieving a sequencing depth of 10 × coverage. The raw data were pre-processed through the program fastp with default parameters [81]. After filtering, chloroplast genomes were de novo assembled from clean reads by NOVOPlasty v2.7.2 following the manual instructions [82], selecting the cpDNA genome of Chunia bucklandioides (Hamamelidaceae) (NCBI: NC_041163) as a reference.

4.5. Phylogenetic Tree Construction and Divergence Time Estimation

For the construction of the phylogenetic tree, plastid genomes of Rhodoleia championii Hook. f. and Hamamelis mollis Oliv. were downloaded from the NCBI (National Center for Biotechnology Information) website (https://www.ncbi.nlm.nih.gov, access date: 13 July 2021) and set as an outgroup. These plastid genome sequences were aligned by MAFFT 7.475 [83], and poorly aligned positions were trimmed by TrimAl v1.1 [84] with the gappyout option. Bayesian inference (BI) and maximum likelihood (ML) methods were used to reconstruct phylogenetic trees. The BI analyses were conducted under the following conditions: starting with a random tree, 20 million generations with sampling every 1000 generations, four chains (one cold chain and three hot chains), and a burn-in of 25% trees when ASDFs (average standard deviation of split frequencies) < 0.01. For the ML analyses, IQ-TREE [85] was run using the best-fit model for each gene partition as previously selected, along with 20,000 ultrafast bootstrap replicates. FigTree v1.4.3 http://tree.bio.ed.ac.uk/software/figtree, access date: 4 October 2016) was used to visualize tree files.
The accurate application of fossil records constitutes an important step in divergence time estimation, as the selection and treatment of fossil calibration points can significantly influence the outcomes of molecular clock analyses [86]. Previous phylogenetic studies demonstrated that Subfam. Rhodoleioideae is the sister group of Subfam. Exbucklandioideae, and together, they constitute the earliest-diverging lineage within Hamamelidaceae, while the genus Hamamelis, in contrast, is representative of a late-diverging lineage within Hamamelidaceae [39,40,41,42]. Furthermore, both Rhodoleia and Hamamelis exhibit abundant fossil records with well-documented temporal constraints. Therefore, based on fossil evidence and previous studies [42,51,52,87,88], we set the following fossil calibration points in BEAST: the crown age of the ExbucklandiaRhodoleia clade was set as 65 MA, while the age of this clade relative to Hamamelis was set as 100 Ma. For phylogenetic divergence time estimation, a speciation model following a Yule process was selected as the tree prior, with running for 2 million generations and sampling parameters every 1000 generations. The adequacy of sampling was assessed with Tracer v1.4 [89]. Post-run analysis’ log files indicated parameter convergence and adequate sampling (ESS values > 200). TreeAnnotator v1.4.2 [89] was used to build the maximum clade credibility tree.

5. Conclusions

The genus Exbucklandia is the sole genus within the Hamamelidaceae subfamily Exbucklandioideae and currently only comprises three species. Our results indicate that E. longipetala is not a distinct species due to the absence of diagnostic morphological traits and genetic monophyly. E. tricuspis is the earliest extant species among the current members of Exbucklandia and possesses its own chloroplast genome. During the Quaternary glacial period, the nuclear gene pool of E. tricuspis was lost due to the southward expansion of E. populnea and E. tonkinensis. Given its unique morphological characteristics and basal monophyletic position in the phylogenetic tree, we propose that E. tricuspis should be considered as a distinct species. Furthermore, due to habitat destruction, the genetic diversity of E. tonkinensis is lower than that of other species. Therefore, we recommend that conservation efforts for E. tonkinensis be implemented as soon as possible.

Supplementary Materials

The following supporting information can be downloaded at https://www.mdpi.com/article/10.3390/plants14071061/s1, Table S1. Twenty-one haplotypes of combined chloroplast fragments in 56 Exbucklandia populations; Table S2. Variable sites of the aligned sequences (5′-3′) in 21 haplotypes of Exbucklandia (2345 bp without outgroup); Table S3. Genetic diversity at the 21 microsatellite loci of Exbucklandia; Table S4. Result of F-statistic on locus; Table S5. Length for each partition in chloroplast genomes of 34 Exbucklandia individuals; Figure S1. Phylogenetic tree of 34 Exbucklandia individuals with 29 outgroups based on BI; Figure S2. Phylogenetic tree of 34 Exbucklandia individuals with Rhodoleia championii on BI; Figure S3. Phylogenetic tree of 34 Exbucklandia individuals with Rhodoleia championii on ML; Table S6. Voucher information of 59 Exbucklandia populations in this study; Table S7. Development of chloroplast primers; Table S8. Chloroplast primers used in this study; Table S9. Characteristics of 21 SSR loci used in this research.

Author Contributions

C.H.: Conceptualization; data curation; formal analysis; investigation; methodology; resources; software; validation; visualization; writing—original draft. Q.F.: investigation; resources; project administration. K.X.: writing—review and editing. S.S.: investigation; resources. K.M.: formal analysis. H.D.: formal analysis. J.J.: formal analysis. W.G.: project administration. H.L.: resources; supervision. S.C.: supervision; project administration; writing—review and editing. W.L.: supervision; project administration. All authors have read and agreed to the published version of the manuscript.

Funding

This work was supported by the Science and Technology Projects in Guangzhou (2023B03J1264), the National Natural Science Foundation of China (31800175), the Guangdong Special Fund for Natural Resources Management and Ecological Forestry Construction (2021GJGY001), and the 2024 Guangdong Province Ecological Quality Index (EQI) Monitoring Project (GPCGD241115FG155F).

Data Availability Statement

All data are publicly available in the article and Supplementary Materials.

Acknowledgments

The authors thank Qianyi Yin, Yirong Liu, Fan ye, and Wanyi Zhao (Life Science Schools, SYSU) for assistance in investigation and resources.

Conflicts of Interest

The authors declare no conflicts of interest.

References

  1. Verstappen, H.T. Quaternary climatic changes and natural environment in SE Asia. GeoJournal 1980, 4, 45–54. [Google Scholar] [CrossRef]
  2. Hewitt, G. The genetic legacy of the Quaternary ice ages. Nature 2000, 405, 907–913. [Google Scholar] [CrossRef] [PubMed]
  3. Qiu, Y.-X.; Fu, C.-X.; Comes, H.P. Plant molecular phylogeography in China and adjacent regions: Tracing the genetic imprints of Quaternary climate and environmental change in the world’s most diverse temperate flora. Mol. Phylogenetics Evol. 2011, 59, 225–244. [Google Scholar] [CrossRef] [PubMed]
  4. Quan, C.; Liu, Z.; Utescher, T.; Jin, J.; Shu, J.; Li, Y.; Liu, Y.-S.C. Revisiting the Paleogene climate pattern of East Asia: A synthetic review. Earth-Sci. Rev. 2014, 139, 213–230. [Google Scholar] [CrossRef]
  5. Davis, M.B.; Shaw, R.G. Range shifts and adaptive responses to Quaternary climate change. Science 2001, 292, 673–679. [Google Scholar] [CrossRef]
  6. Carstens, B.C.; Knowles, L.L. Shifting distributions and speciation: Species divergence during rapid climate change. Mol. Ecol. 2007, 16, 619–627. [Google Scholar] [CrossRef]
  7. Gibbard, P.L.; Head, M.J. The quaternary period. In Geologic Time Scale 2020; Elsevier: Amsterdam, The Netherlands, 2020; pp. 1217–1255. [Google Scholar]
  8. Avise, J. Phylogeography: The History and Formation of Species; Harvard University Press: Cambridge, MA, USA, 2000. [Google Scholar]
  9. Soltis, D.E.; Soltis, P.S.; Albert, V.A.; Oppenheimer, D.G.; DePamphilis, C.W.; Ma, H.; Frohlich, M.W.; Theißen, G. Missing links: The genetic architecture of flower and floral diversification. Trends Plant Sci. 2002, 7, 22–31. [Google Scholar] [CrossRef]
  10. Futuyma, D.J. Progress on the origin of species. PLoS Biol. 2005, 3, e62. [Google Scholar] [CrossRef]
  11. Lomolino, M.V.; Sax, D.F.; Riddle, B.R.; Brown, J.H. The island rule and a research agenda for studying ecogeographical patterns. J. Biogeogr. 2006, 33, 1503–1510. [Google Scholar] [CrossRef]
  12. Friedman, W.E.; Ryerson, K.C. Reconstructing the ancestral female gametophyte of angiosperms: Insights from Amborella and other ancient lineages of flowering plants. Am. J. Bot. 2009, 96, 129–143. [Google Scholar] [CrossRef]
  13. Hickerson, M.J.; Carstens, B.C.; Cavender-Bares, J.; Crandall, K.A.; Graham, C.H.; Johnson, J.B.; Rissler, L.; Victoriano, P.F.; Yoder, A.D. Phylogeography’s past, present, and future: 10 years after. Mol. Phylogenetics Evol. 2010, 54, 291–301. [Google Scholar]
  14. Sun, X.; Wang, P. How old is the Asian monsoon system?—Palaeobotanical records from China. Palaeogeogr. Palaeoclimatol. Palaeoecol. 2005, 222, 181–222. [Google Scholar]
  15. Guo, Z.T.; Sun, B.; Zhang, Z.S.; Peng, S.Z.; Xiao, G.Q.; Ge, J.Y.; Hao, Q.Z.; Qiao, Y.S.; Liang, M.Y.; Liu, J.F. A major reorganization of Asian climate by the early Miocene. Clim. Past 2008, 4, 153–174. [Google Scholar] [CrossRef]
  16. Abe, M.; Hori, M.; Yasunari, T.; Kitoh, A. Effects of the Tibetan Plateau on the onsetof the summer monsoon in South Asia: The role of the air-sea interaction. J. Geophys. Res. Atmos. 2013, 118, 1760–1776. [Google Scholar]
  17. Chen, Y.S.; Deng, T.; Zhou, Z.; Sun, H. Is the East Asian flora ancient or not? Natl. Sci. Rev. 2018, 5, 920–932. [Google Scholar]
  18. Lu, L.M.; Mao, L.F.; Yang, T.; Ye, J.F.; Liu, B.; Li, H.L.; Sun, M.; Miller, J.T.; Mathews, S.; Hu, H.H.; et al. Evolutionary history of the angiosperm flora of China. Nature 2018, 554, 234–238. [Google Scholar] [CrossRef]
  19. Li, S.F.; Valdes, P.J.; Farnsworth, A.; Davies-Barnard, T.; Su, T.; Lunt, D.J.; Spicer, R.A.; Liu, J.; Deng, W.Y.D.; Huang, J. Orographic evolution of northern Tibet shaped vegetation and plant diversity in eastern Asia. Sci. Adv. 2021, 7, eabc7741. [Google Scholar]
  20. Qian, H.; Ricklefs, R.E. Large-scale processes and the Asian bias in species diversity of temperate plants. Nature 2000, 407, 180–182. [Google Scholar] [CrossRef]
  21. Harrison, S.P.; Yu, G.; Takahara, H.; Prentice, I.C. Diversity of temperate plants in east Asia. Nature 2001, 413, 129–130. [Google Scholar] [CrossRef]
  22. Manchester, S.R.; Chen, Z.D.; Lu, A.M.; Uemura, K. Eastern Asian endemic seed plant genera and their paleogeographic history throughout the Northern Hemisphere. J. Syst. Evol. 2009, 47, 1–42. [Google Scholar]
  23. Ye, J.W.; Tian, B.; Li, D.Z. Monsoon intensification in East Asia triggered the evolution of its flora. Front. Plant Sci. 2022, 13, 1046538. [Google Scholar]
  24. Endress, P.K. Hamamelidaceae. In Flowering Plants·Dicotyledons: Magnoliid, Hamamelid and Caryophyllid Families; Springer: Berlin/Heidelberg, Germany, 1993; pp. 322–331. [Google Scholar]
  25. Zhang, Z.-Y.; Lu, A.-M. Hamamelidaceae: Geographic distribution, fossil history and origin. J. Syst. Evol. 1995, 33, 313–339. [Google Scholar]
  26. Bailey, C.D. Plant Systematics: A Phylogenetic Approach. Cladistics-Int. J. Willi Hennig Soc. 2010, 24, 848–850. [Google Scholar]
  27. Group, A.P.; Chase, M.W.; Christenhusz, M.J.M.; Fay, M.F.; Byng, J.W.; Judd, W.S.; Soltis, D.E.; Mabberley, D.J.; Sennikov, A.N.; Soltis, P.S. An update of the Angiosperm Phylogeny Group classification for the orders and families of flowering plants: APG IV. Bot. J. Linn. Soc. 2016, 181, 1–20. [Google Scholar]
  28. Brown, R.W. Alterations in some fossil and living floras. J. Wash. Acad. Sci. 1946, 36, 344–355. [Google Scholar]
  29. Lakhanpal, R.N. The Rujada flora of west central Oregon. In University of California Publications in Geological Sciences; University of California Pres: Berkeley, CA, USA, 1958; Volume 35, pp. 1–65. [Google Scholar]
  30. Meyer, H. The Oligocene Lyons flora of northwestern Oregon. Ore Bin 1973, 35, 37–51. [Google Scholar]
  31. Baghai, N.L.; Jorstad, R.B. Paleontology, paleoclimatology and paleoecology of the late Middle Miocene Musselshell Creek flora, Clearwater County Idaho. A preliminary study of a new fossil flora. Palaios 1995, 10, 424–436. [Google Scholar]
  32. Manchester, S.R. Biogeographical relationships of North American tertiary floras. Ann. Mo. Bot. Gard. 1999, 86, 472–522. [Google Scholar]
  33. Zhou, Z.K.; Crepet, W.L.; Nixon, K.C. The earliest fossil evidence of the Hamamelidaceae: Late Cretaceous (Turonian) inflorescences and fruits of Altingioideae. Am. J. Bot. 2001, 88, 753–766. [Google Scholar]
  34. Pigg, K.B.; Wehr, W.C. Tertiary flowers, fruits, and seeds of Washington State and adjacent areas-Part III. Wash. Geol. 2002, 30, 3–16. [Google Scholar]
  35. Wu, J.; Sun, B.; Liu, Y.-S.C.; Xie, S.; Lin, Z. A new species of Exbucklandia (Hamamelidaceae) from the Pliocene of China and its paleoclimatic significance. Rev. Palaeobot. Palynol. 2009, 155, 32–41. [Google Scholar] [CrossRef]
  36. Shi, G.L. Fossil Plants from the Oligocene Ningming Formation of Guangxi, and a Preliminary Palaeoclimatic Reconstruction of the Flora. Ph.D. Thesis, Nanjing Institute of Geology and Palaeontology, Nanjing, China, 2010. (Chinese with English Abstract). [Google Scholar]
  37. Huang, J.; Shi, G.L.; Su, T.; Zhou, Z.K. Miocene Exbucklandia (Hamamelidaceae) from Yunnan, China and its biogeographic and palaeoecologic implications. Rev. Palaeobot. Palynol. 2017, 244, 96–106. [Google Scholar] [CrossRef]
  38. Vink, W. Hamamelidaceae. In Flora Malesiana-Series 1, Spermatophyta; Noordhoff-Kolff: Djakarta, Indonesia, 1955; Volume 5, pp. 363–379. [Google Scholar]
  39. Qiu, Y.L.; Chase, M.W.; Hoot, S.B.; Conti, E. Phylogenetics of the Hamamelidae and their allies: Parsimony analyses of nucleotide sequences of the plastid gene rbcL. Int. J. Plant Sci. 1998, 159, 891–905. [Google Scholar] [CrossRef]
  40. Li, J.; Bogle, A.L.; Klein, A.S. Phylogenetic relationships of the Hamamelidaceae inferred from sequences of internal transcribed spacers (ITS) of nuclear ribosomal DNA. Am. J. Bot. 1999, 86, 1027–1037. [Google Scholar] [CrossRef]
  41. Maslova, N.P.; Herman, A.B. New finds of fossil hamamelids and data on the phylogenetic relationships between the Platanaceae and Hamamelidaceae. Paleontol. J. 2004, 38, 563–575. [Google Scholar]
  42. Jia, L.; Wang, S.; Hu, J.; Miao, K.; Huang, Y.; Ji, Y. Plastid phylogenomics and fossil evidence provide new insights into the evolutionary complexity of the ‘woody clade’ in Saxifragales. BMC Plant Biol. 2024, 24, 277. [Google Scholar] [CrossRef]
  43. Chang, H.T. Flora Reipublicae Popularis Sinicae; Science Press: Beijing, China, 1979; Volume 35. [Google Scholar]
  44. Chang, H.T. A Revision of the Hamamelidaceous Flora of China. Acta Sci. Nat. Univ. Sunyatseni 1973, 1, 58–75. [Google Scholar]
  45. Chang, H.T. Notulae Plantarum Austro-Sinicarum. Acta Sci. Nat. Univ. Sunyatseni 1959, 4, 19–48. [Google Scholar]
  46. Garden, M.B. Tropicos.org. Available online: https://tropicos.org (accessed on 31 December 2024).
  47. WFO. The WFO Plant List. Available online: https://www.worldfloraonline.org/ (accessed on 31 December 2024).
  48. Turland, N.J.; Wiersema, J.H.; Barrie, F.R.; Greuter, W.; Hawksworth, D.L.; Herendeen, P.S.; Knapp, S.; Kusber, W.-H.; Li, D.-Z.; Marhold, K. International Code of Nomenclature for Algae, Fungi, and Plants (Shenzhen Code), Proceedings of the Nineteenth International Botanical Congress Shenzhen, China, 23–29 July 2017; Koeltz Botanical Books: Oberreifenberg, Germany, 2018. [Google Scholar]
  49. Lecompte, O.; Tardieu-Blot, M.L.; Cuong, V.V. Saxifragaceae, Crypteroniaceae, Droseraceae, Hamamelidaceae, Haloragaceae, Rhizophoraceae, Sonneratiaceae, Punicaceae; National Museum of Natural History: Paris, France, 1965; Volume 4. [Google Scholar]
  50. Huang, C.; Yin, Q.; Khadka, D.; Meng, K.; Fan, Q.; Chen, S.; Liao, W. Identification and development of microsatellite (SSRs) makers of Exbucklandia (HAMAMELIDACEAE) by high-throughput sequencing. Mol. Biol. Rep. 2019, 46, 3381–3386. [Google Scholar] [CrossRef]
  51. Xiang, X.; Xiang, K.; Ortiz, R.D.C.; Jabbour, F.; Wang, W. Integrating palaeontological and molecular data uncovers multiple ancient and recent dispersals in the pantropical Hamamelidaceae. J. Biogeogr. 2019, 46, 2622–2631. [Google Scholar] [CrossRef]
  52. Tarullo, C.; Rose, J.; Sytsma, K.; Drew, B.T. Using a supermatrix approach to explore phylogenetic relationships, divergence times, and historical biogeography of Saxifragales. Turk. J. Bot. 2021, 45, 440–456. [Google Scholar]
  53. Xu, L.L.; Yu, R.M.; Lin, X.R.; Zhang, B.W.; Li, N.; Lin, K.; Zhang, D.Y.; Bai, W.N. Different rates of pollen and seed gene flow cause branch-length and geographic cytonuclear discordance within Asian butternuts. New Phytol. 2021, 232, 388–403. [Google Scholar] [PubMed]
  54. Huang, D.I.; Hefer, C.A.; Kolosova, N.; Douglas, C.J.; Cronk, Q.C.B. Whole plastome sequencing reveals deep plastid divergence and cytonuclear discordance between closely related balsam poplars, Populus balsamifera and P. trichocarpa (Salicaceae). New Phytol. 2014, 204, 693–703. [Google Scholar] [CrossRef] [PubMed]
  55. Ennos, R. Estimating the relative rates of pollen and seed migration among plant populations. Heredity 1994, 72, 250–259. [Google Scholar] [CrossRef]
  56. Lu, H.Y.; Guo, Z.T. Evolution of the monsoon and dry climate in East Asia during late Cenozoic: A review. Sci. China Earth Sci. 2014, 57, 70–79. [Google Scholar] [CrossRef]
  57. Zachos, J.; Pagani, M.; Sloan, L.; Thomas, E.; Billups, K. Trends, rhythms, and aberrations in global climate 65 Ma to present. Science 2001, 292, 686–693. [Google Scholar]
  58. Zachos, J.C.; Shackleton, N.J.; Revenaugh, J.S.; Pälike, H.; Flower, B.P. Climate response to orbital forcing across the Oligocene-Miocene boundary. Science 2001, 292, 274–278. [Google Scholar]
  59. Irwin, D.E. Phylogeographic breaks without geographic barriers to gene flow. Evolution 2002, 56, 2383–2394. [Google Scholar]
  60. Yang, Y.Y.; Qu, X.J.; Zhang, R.; Stull, G.W.; Yi, T.S. Plastid phylogenomic analyses of Fagales reveal signatures of conflict and ancient chloroplast capture. Mol. Phylogenetics Evol. 2021, 163, 107232. [Google Scholar]
  61. Liu, L.X.; Du, Y.X.; Folk, R.A.; Wang, S.Y.; Li, P. Plastome Evolution in Saxifragaceae and Multiple Plastid Capture Events Involving Heuchera and Tiarella. Front. Plant Sci. 2020, 11, 361. [Google Scholar] [CrossRef]
  62. Fehrer, J.; Gemeinholzer, B.; Chrtek, J.; Bräutigam, S. Incongruent plastid and nuclear DNA phylogenies reveal ancient intergeneric hybridization in Pilosella hawkweeds (Hieracium, Cichorieae, Asteraceae). Mol. Phylogenetics Evol. 2007, 42, 347–361. [Google Scholar]
  63. Yudai, O.; Noriyuki, F.; Michio, W.; Atsushi, K.; Manabu, I.; Mikio, W.; Noriaki, M.; Makoto, K. Nonuniform concerted evolution and chloroplast capture: Heterogeneity of observed introgression patterns in three molecular data partition phylogenies of Asian Mitella (saxifragaceae). Mol. Biol. Evol. 2005, 22, 285–296. [Google Scholar]
  64. Acosta, M.C.; Premoli, A.C. Evidence of chloroplast capture in South American Nothofagus (subgenus Nothofagus, Nothofagaceae). Mol. Phylogenetics Evol. 2010, 54, 235–242. [Google Scholar]
  65. Chen, S.; Milne, R.; Zhou, R.; Meng, K.; Yin, Q.; Guo, W.; Ma, Y.; Mao, K.; Xu, K.; Kim, Y.D.; et al. When tropical and subtropical congeners met: Multiple ancient hybridization events within Eriobotrya in the Yunnan-Guizhou Plateau, a tropical-subtropical transition area in China. Mol. Ecol. 2022, 31, 1543–1561. [Google Scholar] [CrossRef]
  66. Lin, C.; Zhao, W.; Chen, Z.; Fan, Q.; Xu, K. Ilex danxiaensis (Aquifoliaceae), a Distinct New Tree Species Endemic to Danxia Mountain in Guangdong Province, China, Based on Molecular and Morphological Evidence. Forests 2023, 14, 583. [Google Scholar] [CrossRef]
  67. Westoby, M.; Leishman, M.; Lord, J. Comparative ecology of seed size and dispersal. Philos. Trans. R. Soc. Lond. Ser. B Biol. Sci. 1996, 351, 1309–1318. [Google Scholar]
  68. Moles, A.T.; Ackerly, D.D.; Webb, C.O.; Tweddle, J.C.; Dickie, J.B.; Westoby, M. A brief history of seed size. Science 2005, 307, 576–580. [Google Scholar]
  69. De La Torre, A.R.; Roberts, D.R.; Aitken, S.N. Genome-wide admixture and ecological niche modelling reveal the maintenance of species boundaries despite long history of interspecific gene flow. Mol. Ecol. 2014, 23, 2046–2059. [Google Scholar]
  70. An, X.Y.; Ping, H.E.; Hong, L.X. The flowering phenology and reproductive features of the endangered plant Disanthus cercidifolius var. longipes H. T. Chang (Hamamelidaceae). Acta Ecol. Sin. 2004, 24, 14–21. [Google Scholar]
  71. Yu, Y.; Fan, Q.; Shen, R.; Guo, W.; Jin, J.; Cui, D.; Liao, W. Genetic Variability and Population Structure of Disanthus cercidifolius subsp. longipes (Hamamelidaceae) Based on AFLP Analysis. PLoS ONE 2014, 9, e107769. [Google Scholar]
  72. Li, B.J.; Wang, J.Y.; Liu, Z.J.; Zhuang, X.Y.; Huang, J.X. Genetic diversity and ex situ conservation of Loropetalum subcordatum, an endangered species endemic to China. BMC Genet. 2018, 19, 12. [Google Scholar] [CrossRef] [PubMed]
  73. Yu, N.; Yuan, J.; Yin, G.; Yang, J.; Zou, W. Genetic diversity and structure among natural populations of Mytilaria laosensis (Hamamelidaceae) revealed by microsatellite markers. Silvae Genet. 2018, 67, 93–98. [Google Scholar] [CrossRef]
  74. Zhang, Y.; Zhang, M.; Hu, Y.; Zhuang, X.; Xu, W.; Li, P.; Wang, Z. Mining and characterization of novel EST-SSR markers of Parrotia subaequalis (Hamamelidaceae) from the first Illumina-based transcriptome datasets. PLoS ONE 2019, 14, e0215874. [Google Scholar]
  75. Yu, N.; Li, R.S.; Dong, M.; Yang, J.C. Genetic diversity and paternity analysis of Mytilaria laosensis hybrids using microsatellite markers provide insight into the breeding system. Ind. Crops Prod. 2023, 191, 115974. [Google Scholar]
  76. Clarke, J.D. Cetyltrimethyl ammonium bromide (CTAB) DNA miniprep for plant DNA isolation. Cold Spring Harb. Protoc. 2009, 2009, pdb.prot5177. [Google Scholar]
  77. Burland, T.G. DNASTAR’s Lasergene sequence analysis software. Bioinform. Methods Protoc. 1999, 132, 71–91. [Google Scholar]
  78. Librado, P.; Rozas, J. DnaSP v5: A software for comprehensive analysis of DNA polymorphism data. Bioinformatics 2009, 25, 1451–1452. [Google Scholar]
  79. Smouse, R.P.P.; Peakall, R. GenAlEx 6.5: Genetic analysis in Excel. Population genetic software for teaching and research—An update. Bioinformatics 2012, 28, 2537–2539. [Google Scholar]
  80. Pritchard, J.K.; Stephens, M.; Donnelly, P. Inference of population structure using multilocus genotype data. Genetics 2000, 155, 945–959. [Google Scholar]
  81. Chen, S.; Zhou, Y.; Chen, Y.; Gu, J. fastp: An ultra-fast all-in-one FASTQ preprocessor. Bioinformatics 2018, 34, i884–i890. [Google Scholar]
  82. Dierckxsens, N.; Mardulyn, P.; Smits, G. NOVOPlasty: De novo assembly of organelle genomes from whole genome data. Nucleic Acids Res. 2017, 45, e18. [Google Scholar] [PubMed]
  83. Rozewicki, J.; Li, S.; Amada, K.M.; Standley, D.M.; Katoh, K. MAFFT-DASH: Integrated protein sequence and structural alignment. Nucleic Acids Res. 2019, 47, W5–W10. [Google Scholar] [CrossRef] [PubMed]
  84. Capella-Gutiérrez, S.; Silla-Martínez, J.M.; Gabaldón, T. trimAl: A tool for automated alignment trimming in large-scale phylogenetic analyses. Bioinformatics 2009, 25, 1972–1973. [Google Scholar] [CrossRef] [PubMed]
  85. Chernomor, O.; Von Haeseler, A.; Minh, B.Q. Terrace aware data structure for phylogenomic inference from supermatrices. Syst. Biol. 2016, 65, 997–1008. [Google Scholar] [CrossRef]
  86. Hug, L.A.; Roger, A.J. The impact of fossils and taxon sampling on ancient molecular dating analyses. Mol. Biol. Evol. 2007, 24, 1889–1897. [Google Scholar] [CrossRef]
  87. Endress, P.K.; Friis, E.M. Archamamelis, hamamelidalean flowers from the Upper Cretaceous of Sweden. Plant Syst. Evol. 1991, 175, 101–114. [Google Scholar] [CrossRef]
  88. Mai, D.H. The fossils of Rhodoleia champion (Hamamelidaceae) in Europe. Acta Palaeobot. 2001, 41, 161–176. [Google Scholar]
  89. Drummond, A.J.; Rambaut, A. BEAST: Bayesian evolutionary analysis by sampling trees. BMC Ecol. Evol. 2007, 7, 214. [Google Scholar] [CrossRef]
Figure 1. Distributions and morphological diversity of genus Exbucklandia. (a) Map of distributions based on the global specimens’ records; (be) E. populnea; (fi) E. tonkinensis; (j) E. longipetala; (k,l) E. tricuspis.
Plants 14 01061 g001
Figure 2. Results of haplotype network analysis based on four chloroplast fragments of 56 populations. (a) Network of 21 haplotypes of Exbucklandia cpDNA fragments. Circle size represents the number of populations that share specific chloroplast haplotypes; different colors represent the proportions of different species. The numbers assigned to the circles are arbitrary haplotype numbers. White squares in the network indicate missing intermediate haplotypes that were not found in the samples analyzed. (b) The geographical distribution of the 56 populations, along with the distributions of the 21 cpDNA haplotypes. Different colors of dots represent different species.
Plants 14 01061 g002
Figure 3. Genetic structure analysis using STRUCTURE HARVESTER. (a) ∆K values obtained using STRUCTURE HARVESTER based on combinations of 21 SSR markers. ∆K = 2 was the most likely value, suggesting the presence of two gene pools for all 4 Exbucklandia species (50 populations). (b) Classification of 50 populations into two gene pools, where the x-axis shows accessions and the y-axis shows the probability (from 0 to 1). The membership of the accessions is indicated by different colors (pool A, blue; pool B, orange). Species that accessions belong to are labeled above accessions with dots of different colors, and population names are labeled under accessions. (c) Geographical distribution of two gene pools’ frequencies in different populations. The colors in the pie chart represent different gene pool components, and the border colors of pies represent different species.
Plants 14 01061 g003
Figure 4. (a) BEAST-derived chronograms of the 34 Exbucklandia repetitive individuals based on cpDNA genomes with two calibration points (red pentastar). Mean divergence dates for major nodes are labeled with blue bars indicating 95% HPD clade credibility intervals for nodes of particular interest with ages under the bar (in MA). Bayesian posterior probabilities are sequentially labeled above nodes. (b) Geographic distribution of 34 repetitive individuals and clades we divided by BEAST-derived chronograms. Colors of dots represent different species.
Plants 14 01061 g004
Table 1. Genetic variability for the 21 SSR loci among the 50 populations of Exbucklandia.
SpeciesPop IDNTIHOHEF
E. tricuspisIN330.3340.2110.2180.034
MAFH250.1680.1050.1060.054
VMBM981.1180.3600.5880.347
VNBHH400.3790.2440.2380.044
VNBNB981.0560.2970.5240.387
VNKB800.8970.2890.4640.422
E. populneaNP380.4280.2770.271−0.031
XZ01230.2000.1150.121−0.010
XZ02340.3930.2220.2410.051
YNBLF530.6490.3470.3830.105
YNDWS480.5610.3100.3400.029
YNJTC570.6160.3600.3670.017
YNMBZ460.5560.2760.3430.149
YNPMZ470.5360.2800.3210.098
YNQTZ450.5940.3140.3860.201
YNXLS540.5900.2670.3330.190
GZLB660.7770.3570.4410.192
GZGHX460.4790.2730.2900.025
GXBXS490.5920.2900.3620.157
GXWDX610.6630.2540.3820.326
GXYRT370.3190.2210.201−0.087
VNSL470.4090.2070.2250.064
VNNCS410.3800.2260.220−0.017
VNSSH1061.2200.3860.6130.371
VNTPO900.9200.3000.4820.355
E. longipetalaGZLGS390.4290.3240.278−0.158
GXSW500.6870.3750.4360.147
HNQJD500.5420.2020.3260.344
HNBMS690.7790.3150.4340.266
E. tonkinensisGXGPS600.6840.3210.3930.265
HNJQS620.6750.3920.3870.063
HNMJX780.9460.3690.5220.339
GDBJ500.5810.3150.3550.072
GDZMP840.9400.3380.5000.344
GDCDD580.6180.3830.358−0.096
GDBX901.0170.4760.5430.129
GDDDS450.4920.2550.3000.192
GDFXC670.7400.2640.4130.324
GDHSD730.9040.3420.5130.337
GDNL560.7750.4240.4750.131
HK570.7170.3870.4210.072
HAIDLS871.1060.3970.6000.307
HAIJFL790.9710.4190.5260.233
HAILMS670.7890.4100.4480.089
FJCBC350.3560.1640.2350.246
FJDYS470.4270.1930.2500.229
FJGYS640.6520.2960.3540.128
FJMHS410.4450.2670.2770.024
JXJPS460.5860.3410.3670.060
JXWZF610.7630.4270.4550.081
Total 0.649±0.303±0.372±0.152±
0.2420.0790.1180.141
NT: No. of different alleles; I: Shannon’s information index = −1 × Sum (pi × Ln (pi)); Ho = observed heterozygosity = No. of HETS/N; HE = expected heterozygosity = 1 − Sum pi2; F: fixation index = (HEHo)/HE = 1 − (Ho/HE).
Table 2. Genetic diversity determined by F-statistics analysis on 21 SSR loci.
FISFITFSTNM
E. populnea0.126 ± 0.0260.609 ± 0.0410.557 ± 0.040.248 ± 0.035
E. tonkinensis0.18 ± 0.0380.533 ± 0.0310.432 ± 0.0230.367 ± 0.037
E. tricuspis0.283 ± 0.070.643 ± 0.0450.507 ± 0.0320.283 ± 0.036
E. longipetala0.116 ± 0.0630.584 ± 0.0350.503 ± 0.0420.321 ± 0.048
Genus Exbucklandia0.189 ± 0.0330.621 ± 0.0270.536 ± 0.0220.232 ± 0.02
FIS (fixation index total): intraspecific inbreeding coefficient; FIT (fixation index total): population inbreeding coefficient; FST (fixation index of subpopulations relative to the total population): fixed coefficient; NM (number of migrants per generation): gene flow.
Table 3. Fifty-nine Exbucklandia populations collected and used for molecular experiments in this study.
Pop IDCountryResearch Contents
(Number of Individuals)
Pop IDCountryResearch Contents
(Number of Individuals)
A *B **C ***A *B **C ***
E. tonkinensisE. populnea
FJMHSChina ★(8)●(15)XZ01China ★(8)●(22)
FJGYSChina ★(8)●(23)XZ02China ★(8)●(18)
FJCBCChina ★(8)●(27)YNQTZChina▲(1)★(8)●(20)
FJDYSChina ★(8)●(17)YNXLSChina▲(1)★(8)●(18)
GDBJChina ★(8)●(24)YNDWSChina▲(1)★(8)●(16)
GDHSDChina▲(1)★(8)●(16)YNMBZChina▲(1)★(8)●(19)
GDDDSChina▲(1)★(8)●(20)YNJTCChina▲(1)★(8)●(23)
GDWZSChina ★(8) YNQLDChina▲(1)★(8)
GDNLChina▲(1)★(8)●(19)YNGLGChina▲(1)★(8)
GDCDDChina ★(8)●(19)YNYFSChina ★(8)
GDZMPChina▲(1)★(8)●(20)YNPMZChina▲(1)★(8)●(23)
GDFXCChina ★(8)●(24)YNHQZChina ★(8)
GDBXChina ★(8)●(24)YNBLFChina▲(1)★(8)●(21)
GXLJChina▲(1) NPNepal ★(8)●(16)
GXGPSChina ●(16)VNTPOVietnam ★(8)●(24)
HAIJFLChina▲(1)★(8)●(19)VNNCSVietnam ★(8)●(20)
HAIJXChina▲(1)★(8) VNSSHVietnam ▲(1)★(8)●(19)
HAILMSChina▲(1)★(8)●(21)VNSLVietnam ▲(1)★(8)●(20)
HAIDLSChina▲(1)★(8)●(15)E. tricuspis
HKChina▲(1)★(8)●(15)INIndonesia▲(1)★(8)●(16)
HNMJXChina ★(8)●(24)MATRMalaysia ▲(1)★(8)
HNQYFChina▲(1) MAFHMalaysia ▲(1)★(8)●(14)
HNJQSChina ★(8)●(25)VNKBVietnam ★(8)●(16)
JXWZFChina▲(1)★(8)●(20)VNBNBVietnam ▲(1)★(8)●(21)
JXJPSChina ★(8)●(19)VNBHHVietnam ▲(1)★(8)●(15)
E. populneaVMBMVietnam ★(8)●(25)
GXYRTChina ★(8)●(20)E. longipetala
GXBXSChina▲(1)★(8)●(20)GXSWChina▲(1)★(8)●(20)
GXWDXChina▲(1)★(8)●(21)GZLGSChina▲(1)★(8)●(20)
GZLBChina ★(8)●(22)HNQJDChina▲(1)★(8)●(20)
GZGHXChina▲(1)★(8)●(15)HNBMSChina ★(8)●(24)
* Genome skimming: Assembled chloroplast genomes and ribosomal cistrons from 1 individual per population for phylogenetic reconstruction. ** Sanger sequencing: Analyzed 4 cpDNA fragments across 8 individuals per population to construct haplotype networks. *** SSR polymorphism analysis: Investigated population structure using 21 loci.
Disclaimer/Publisher’s Note: The statements, opinions and data contained in all publications are solely those of the individual author(s) and contributor(s) and not of MDPI and/or the editor(s). MDPI and/or the editor(s) disclaim responsibility for any injury to people or property resulting from any ideas, methods, instructions or products referred to in the content.

