Article

Heavy Metal Health Risk Assessment in Picea abies L. Forests Along an Altitudinal Gradient in Southern Romania

by
Constantin Nechita
1,*,
Andreea Maria Iordache
2,*,
Carmen Roba
3,
Claudia Sandru
2,
Ramona Zgavarogea
2 and
J. Julio Camarero
4
1
Department of Biometry, National Institute for Research and Development in Forestry “Marin Drăcea”, Calea Bucovinei, 73 bis, 725100 Câmpulung Moldovenesc, Romania
2
National Research and Development Institute for Cryogenics and Isotopic Technologies—ICSI Rm. Valcea, 4 Uzinei Street, 240050 Valcea, Romania
3
Faculty of Environmental Science and Engineering, Babes-Bolyai University, 30 Fântânele Street, 400294 Cluj-Napoca, Romania
4
Instituto Pirenaico de Ecología (IPE-CSIC), Avda. Montañana 1005, 50080 Zaragoza, Spain
*
Authors to whom correspondence should be addressed.
Plants 2025, 14(6), 968; https://doi.org/10.3390/plants14060968
Submission received: 17 February 2025 / Revised: 13 March 2025 / Accepted: 18 March 2025 / Published: 19 March 2025

Abstract

:
Heavy metals (HMs) from industrial pollution are bioaccumulated in plant tissues, but we lack information on their spatial variability in forest ecosystems. Picea abies L. needles, bark, and litter were collected at 17 sites along a 1000-m-wide altitudinal gradient in southern Romania to measure concentrations of mineral nutrients, non-toxic metals, and toxic metals. Isotopic ratios (206/207Pb, 87/86Sr) were used to infer contamination origins. We found significant differences in needle versus bark and litter elements’ concentrations, indicating that needles are sensitive biomarkers in tracking air pollution. We found high Fe, Mn, Zn, and Cu concentrations, which can be involved in the low Na, Mg, and P content in needles. The mole ratios indicate a negative relationship with As concentrations in needles. Several environmental health and ecological risk assessment indices document that Cd levels can represent a moderate risk for most sites. Our study shows that P. abies presented an elevated bioaccumulation potential for Fe, Zn, Cu, Ni, and Cr, respectively, and it only absorbed Na, Sr, Cd, and Li. The methodology and results presented herein may serve as a reference for future studies and provide a foundation to develop management strategies to mitigate heavy metal pollution in forest ecosystems.

1. Introduction

Atmospheric pollution is a significant environmental concern with far-reaching consequences in highly industrialized areas, urban settlements, and terrestrial ecosystems [1,2,3]. The UN Environment Programme (UNEP) estimated that unhealthy environments account for 12.6 million deaths yearly, with other findings indicating that 8.34 million deaths are solely due to fine particulate and ozone air pollution [4]. Most environmental research has focused on assessing pollution sources and various assimilation patterns in urban or industrial regions, evaluating multiple matrices such as soil, water, and vegetation and their transfer to the food chain [3,5,6,7]. In forest ecosystems, rising air pollution is less studied, even though it is not negligible; it has been documented that heavy metals (HMs) negatively affect forest productivity and tree growth, leading to dieback [5,8,9]. It is commonly assumed that forests are less affected than urban locations and that toxic levels remain below the detection limit, which is not always accurate, as significant contaminant enrichments have been discovered in numerous ecosystems worldwide [10,11,12]. Even so, the interaction between HM and the plant community under rising temperatures and drought is attracting attention due to the complex, interrelated processes involved [1,2].
Climate change also influences large-scale atmospheric deposition of contaminants through very high-pressure air masses responsible for long-way transboundary HM transport and deposition [3,4,5,6]. Intercontinental air masses can be vectors for transporting large amounts of hazardous dust particles charged with metallic ions from highly industrialized countries to remote areas [7,8,9,10]. However, the dissemination paths of contamination are not always well understood, particularly in forested areas where pollution levels are restricted to local sites. Previous reports have identified the origins of detected contaminants, which include deposits from industrial extraction and tailing dumps, activities related to ore processing, emissions from engines, combustion of fossil fuels, disposal of waste, and facilities used for waste incineration that contribute to atmospheric contamination [11,12,13,14]. The most common tool for tracing origins of metal pollution and its transfer function from the environment to the plant is 206/207Pb and 87/86Sr isotopic ratios [15,16,17]. Environmental pollution is mainly focused on toxic metals and metalloids such as cadmium (Ca), arsenic (As), chromium (Cr), and nickel (Ni), having densities below 5 g/cm3 and various properties such as persistence, potential for non-degradation, and waste, leading to risks for both humans and the environment [18].
Along with toxic elements, atmospheric pollution carries macro- and micronutrients such as K, Mg, Ca, and Na, which are essential in small amounts for the structure and functioning of prokaryotic cells but can be harmful in broad concentrations [19,20]. Despite this, the definition of plant nutrients has evolved, primarily encompassing two key components: structural and physiological significance [21,22]. Some authors separate essential nutrients from functional elements [23]. Mineral elements, such as sodium (Na), are often overlooked as essential for plant growth and development, even though Marschner’s classification, also adopted by European Union regulation, recognizes their importance [24]. Assessing mineral concentration in soil and plants involves evaluating mole ratios between different elements as a metric for estimating the nutritional quality of plant species [25]. Mineral ratios in dry matter are indicators of homeostasis in plants, which can illustrate hidden deficiency and an excess of one or a suite of elements [25,26,27]. A negative correlation of K/P, Ca/P, and Mg/P ratios with Cd content in soil and plant tissues was used to document the activation of the antioxidant system capable of reducing proline accumulation and inducing deficiency in the nutrient mole ratio [28]. Nutrient ratios can vary substantially under different transfer conditions from soil to plant biomass depending on growing season environmental conditions and phenological plant phases [29].
In the study area, forests are dominated by Norway spruce (Picea abies L.), a major European conifer. We chose this location to assess (i) whether there is significant contamination threatening environmental health and (ii) whether there are possible imbalanced nutrient mole ratios reflecting forest dieback in the region. To fulfill these aims, we evaluated essential nutrients (Ca, Mg, Na, K, P), d-block transition metals (Mn, Fe, Zn, Cu), and toxic metals (Cd, As, Li, Cr, Ni, Sr) in litter and Norway spruce needles and bark. Two isotopic ratios (206/207Pb, 87/86Sr) were used to investigate the possible origins of metals in tree organs and litter. The mole ratios Ca/P, Mg/P, Ca/Mg, K/Mg, Ca/Na, Ca/P, Mg/P, Ca/K, Na/Mg, K/Na, Li/Ca, and Li/Na were calculated and used as proxies for trees’ physiological alterations. Finally, we performed an ecosystem health risk assessment to document possible issues on trees and deliver information on ecological integrity and ecosystem service demand in the study area.

2. Results

2.1. Elemental Chemical Composition in Needles, Bark and Litter

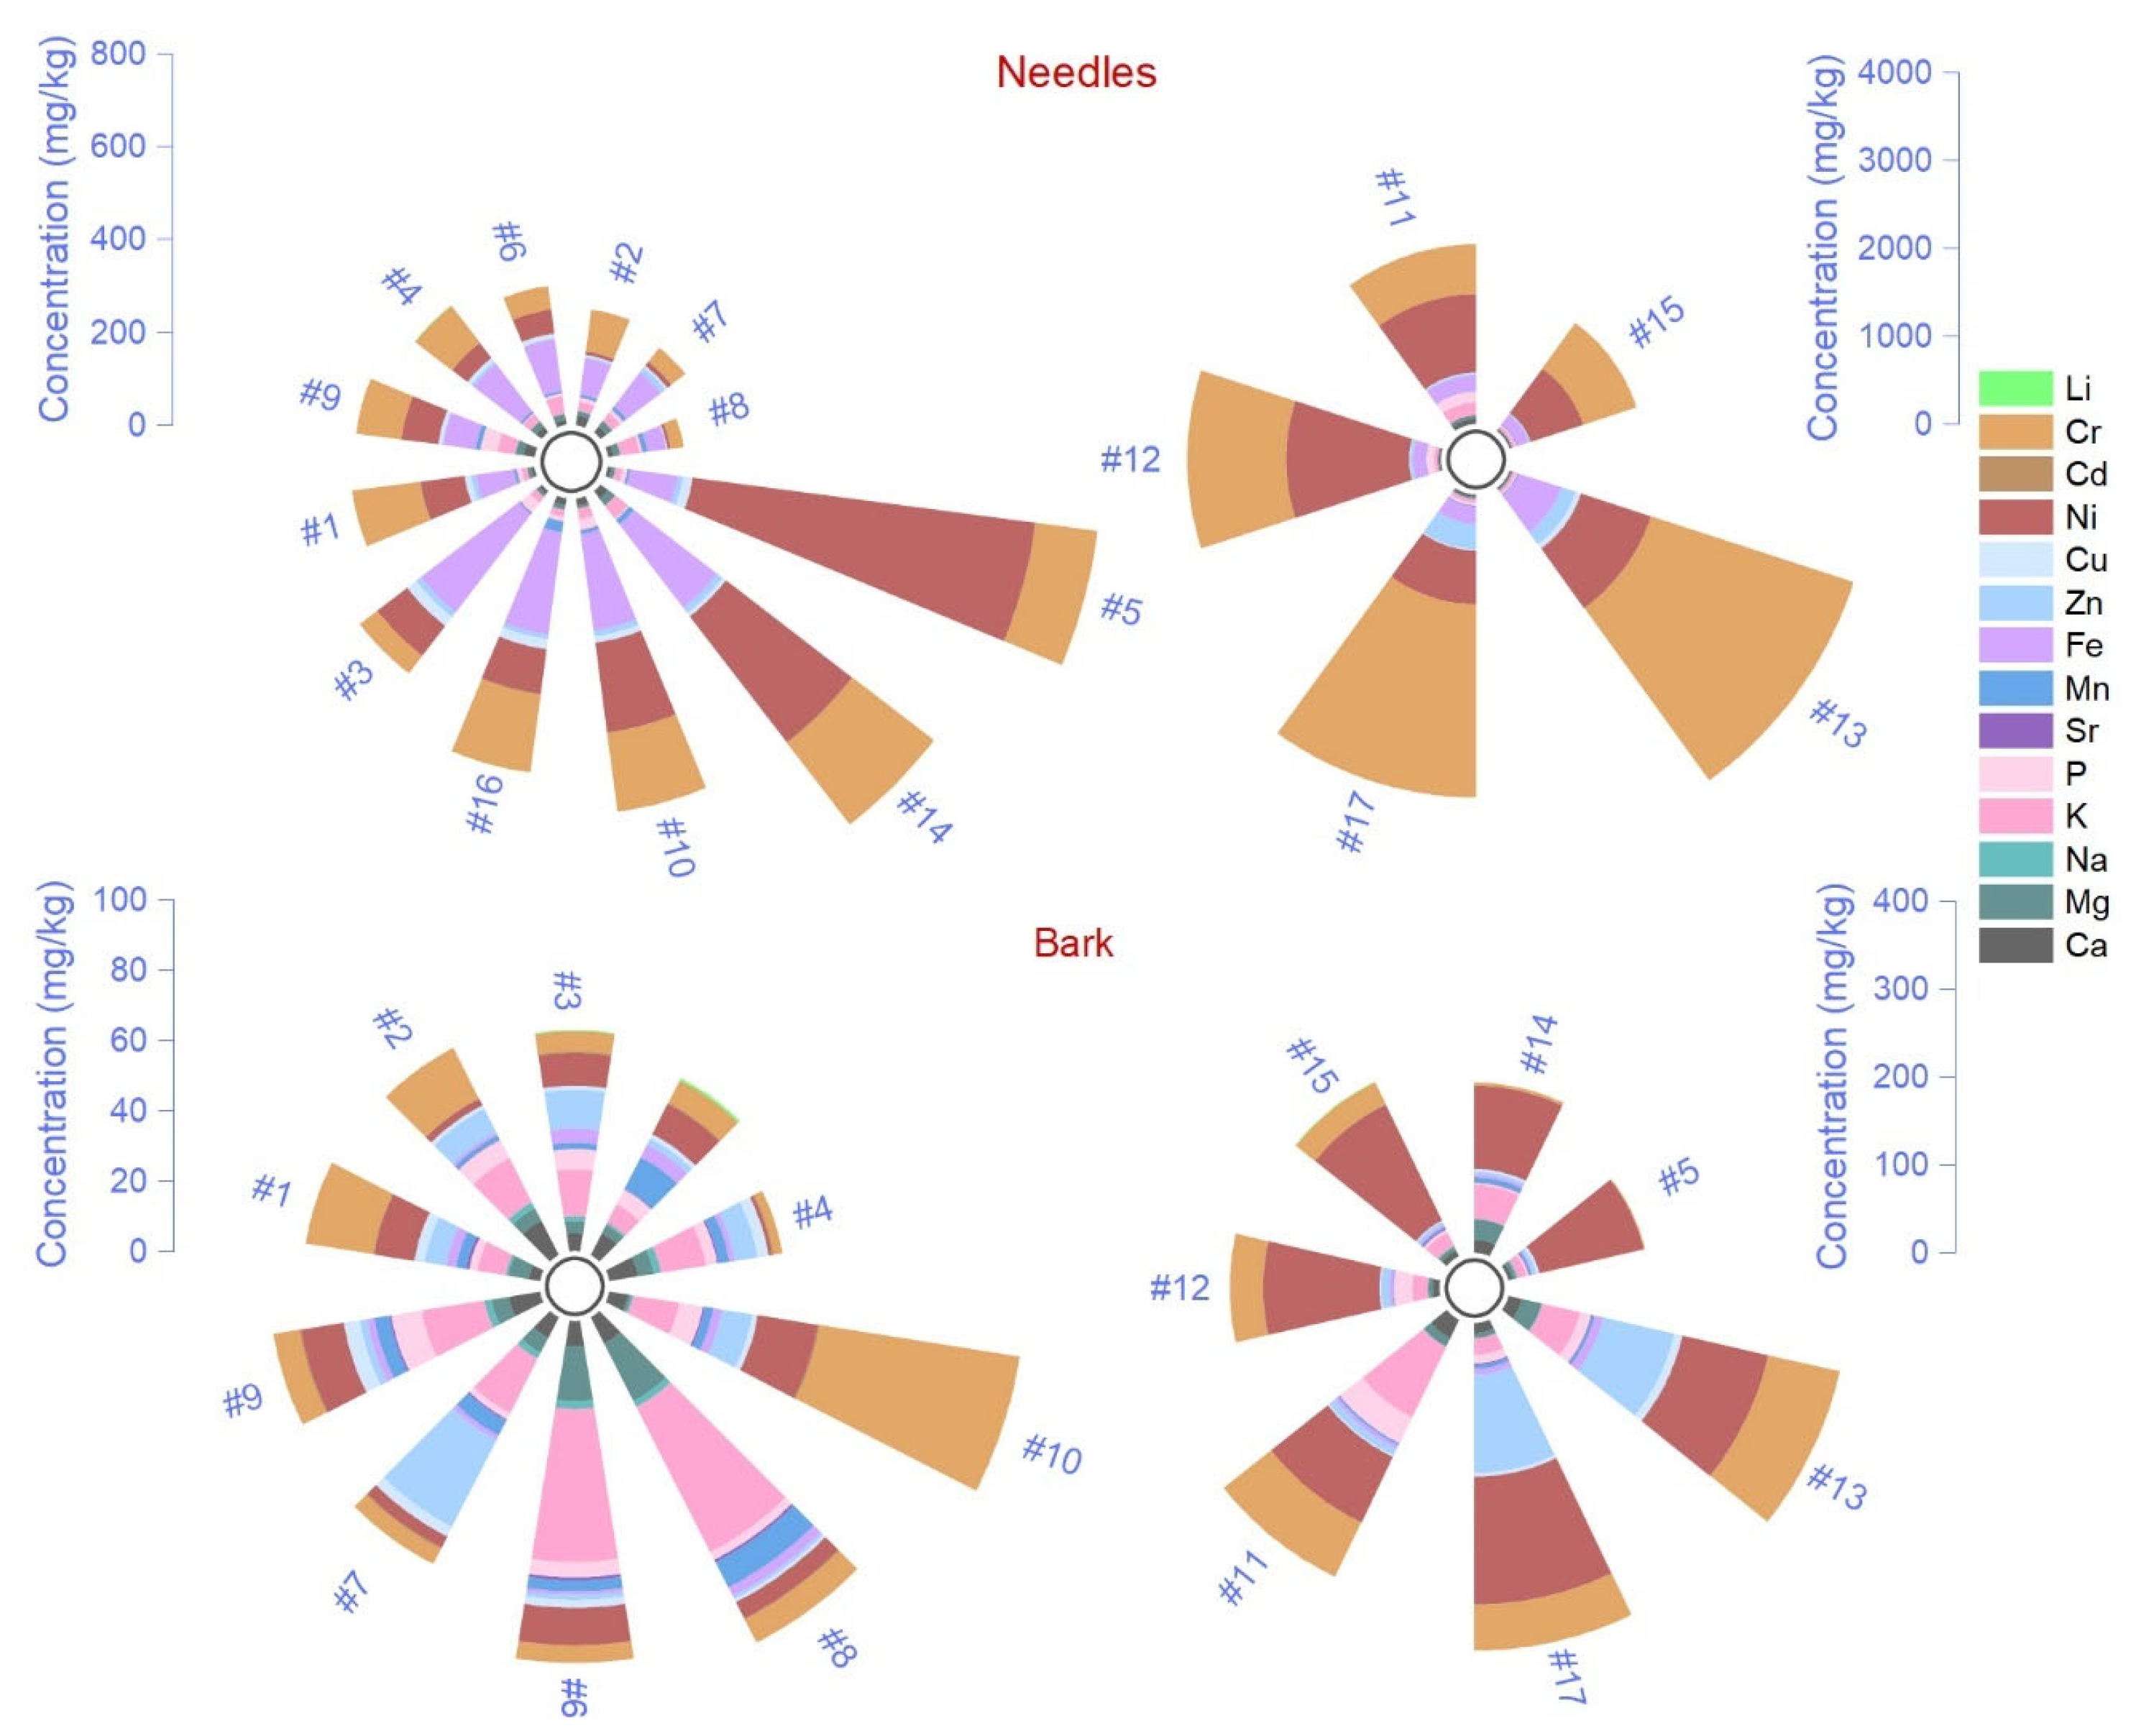
There were no significant differences in the average elemental chemical concentration between control sites and the evaluated altitudinal transect, highlighting the widespread pollution caused by the atmospheric deposition range. Therefore, all sites were analyzed collectively, and the findings were compared to other reference studies. Between matrices, the concentrations decreased in this order: needles > bark > litter (Figure 1). However, Sr, Cd, and Li concentrations were higher in litter than in needles and bark, and Na concentration decreased from bark to litter and needles. An exception was As, which had above-detection-limit content only in needles. The elemental concentration differed statistically between needles, bark, and litter (Bonferroni test, test sign) only in the case of Ca, Mg, K, and Sr (Table 1). Except for Na, Sr, and Cd, all elements’ concentrations significantly varied between litter and needles. High variance (Levene’s test) was found for most elements, such as Ca, Mg, K, P, Fe, Zn, Cu, Ni, As, Cr, and Li. This result indicated that metals are randomly deposited in different quantities depending on environmental conditions, metal weight, transport distance, weather, and forest vegetation from the pollution source. The RMSE showed lower performance for the regressor model in almost all cases, which suggests that the variability is too high to be predicted with accuracy.
The altitudinal trends of each chemical element showed different patterns between matrices (Figures S1 and S2). For instance, Ca, Mg, K, and P had an up-and-down trend until 900 m, and Na progressively increased upwards. Around 1000–1100 m, in needles, the concentrations were high and relatively stable, which was opposite to bark. The mineral composition of litter decreased until 1200 m, followed by an increase in concentration, except for Mg and Na concentrations, which peaked at 1036 m (Figure S1). Non-toxic metals illustrate comparable trends between needles, bark, and litter, showing a high variability before 800 m, followed by a reduced concentration and slowly decreasing to the top of the mountain (Figure S2). An exception was Fe and Cu concentrations in needles, where values were higher, and the trends showed similar peaks at 1500 m, whereas Zn increased after 1300 m. The different altitudinal trends can indicate origins other than those from litter. The toxic elements disclosed more variability of trends with less synchronicity between matrices (Figure S3). Alkali metals such as Li and Cr peaked around 1100 m in needles, which was not found in litter and bark; however, their trend decreased with altitude in litter. We observed a peak in bark Li concentrations at 1300–1500 m. A clear decreasing trend of As concentrations was found as altitude increased.

2.2. Isotopic Signature and Mole Ratios of Ca, K, Na, Mg, P, and Li

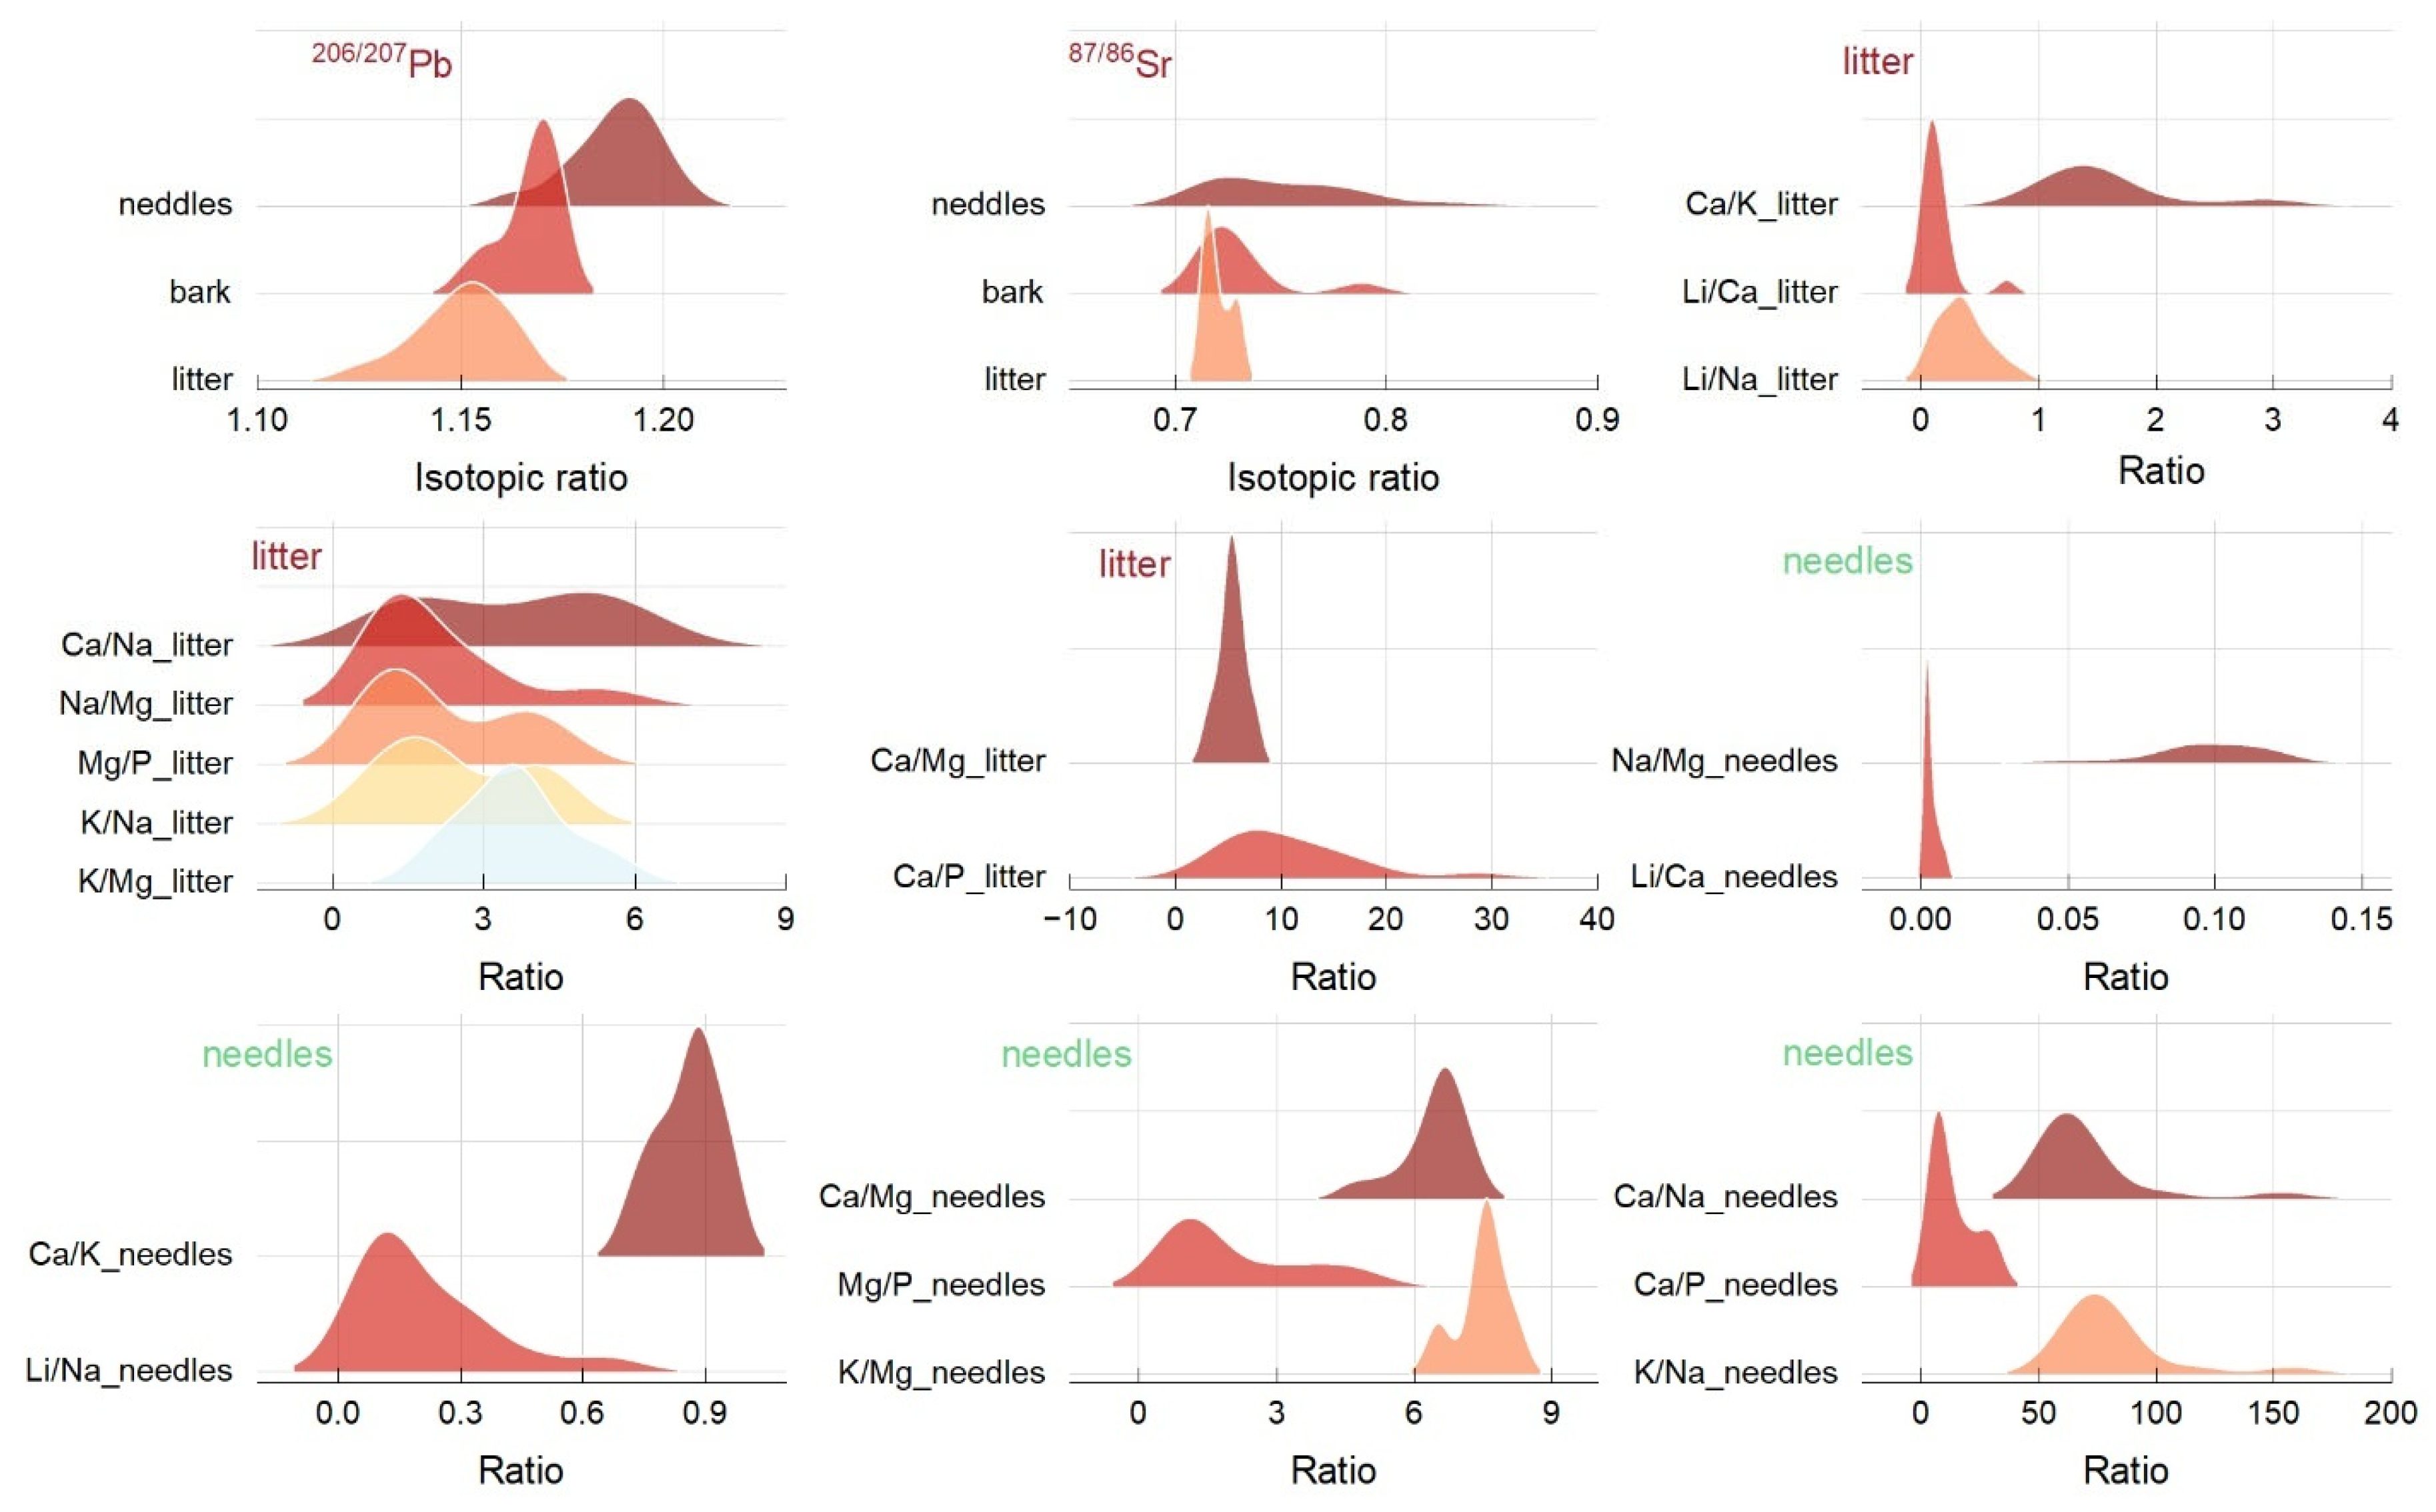
The 206/207Pb values had a range interval of 1.16–1.20 (needles), 1.15–1.17 (bark), and 1.24–1.16 (litter), respectively, with mean values of 1.18 ± 0.01; 1.16 ± 0.00; 1.14 ± 0.01 (Figure 2). The altitudinal trend reflects an up-dawn trend until 900 m and a relatively stable trend until 1300 m, followed by a peak at 1500 m. The 87/86Sr values varied between 0.71–0.83 (needles), 0.71–0.78 (bark), and 0.71–0.73 (litter), and the averages were 0.75 ± 0.34; 0.73 ± 0.02; 0.71 ± 0.00. As the altitude increased, the trend of 87/86Sr was comparable to that of 206/207Pb, but only in the case of Norway spruce needles. The bark value was extremely low until 1200 m and peaked at 1330 and 1500 m in the litter, whereas Sr showed less variability between 1000 and 1300 m.
Except for Ca/P and Mg/P ratios, which did not significantly differ between litter and needles, the ratios showed broad distributions (Figure 2 and Table 2). The Ca/Mg and K/Mg ratios had a quasilinear trend between 850 and 1300 m in litter, and extremely low values were found at 650 and 1036 m. The Ca concentration contributes to higher Ca/Na ratio values in needles than in litter. Two Ca/Na peaks were observed in needles at 1160 and 1554 m. This ratio reflected different patterns since peaks were found at 654, 850, and 1180 m in needles and only at 1160 m in litter. There was a small Ca/K ratio in litter and needles. Still, the ratio documented a sustained accumulation of K in the litter, even though the needle metal concentrations were below the recommended limits. Peaks in the Ca/K ratio in litter were found at 850, 907, and 1110 m with a decreasing altitudinal trend. Similar results were found for the Na/Mg and K/Na ratios in the litter, which were relatively low and stable with altitude. In contrast, the Mg and K in needles induced a higher mean ratio with an increasing trend and peaks at 1110, 1160, 1310, and 1554 m. Li/Ca and Li/Na ratios were higher in litter than in needles.

2.3. Correlation and Multivariate Analysis

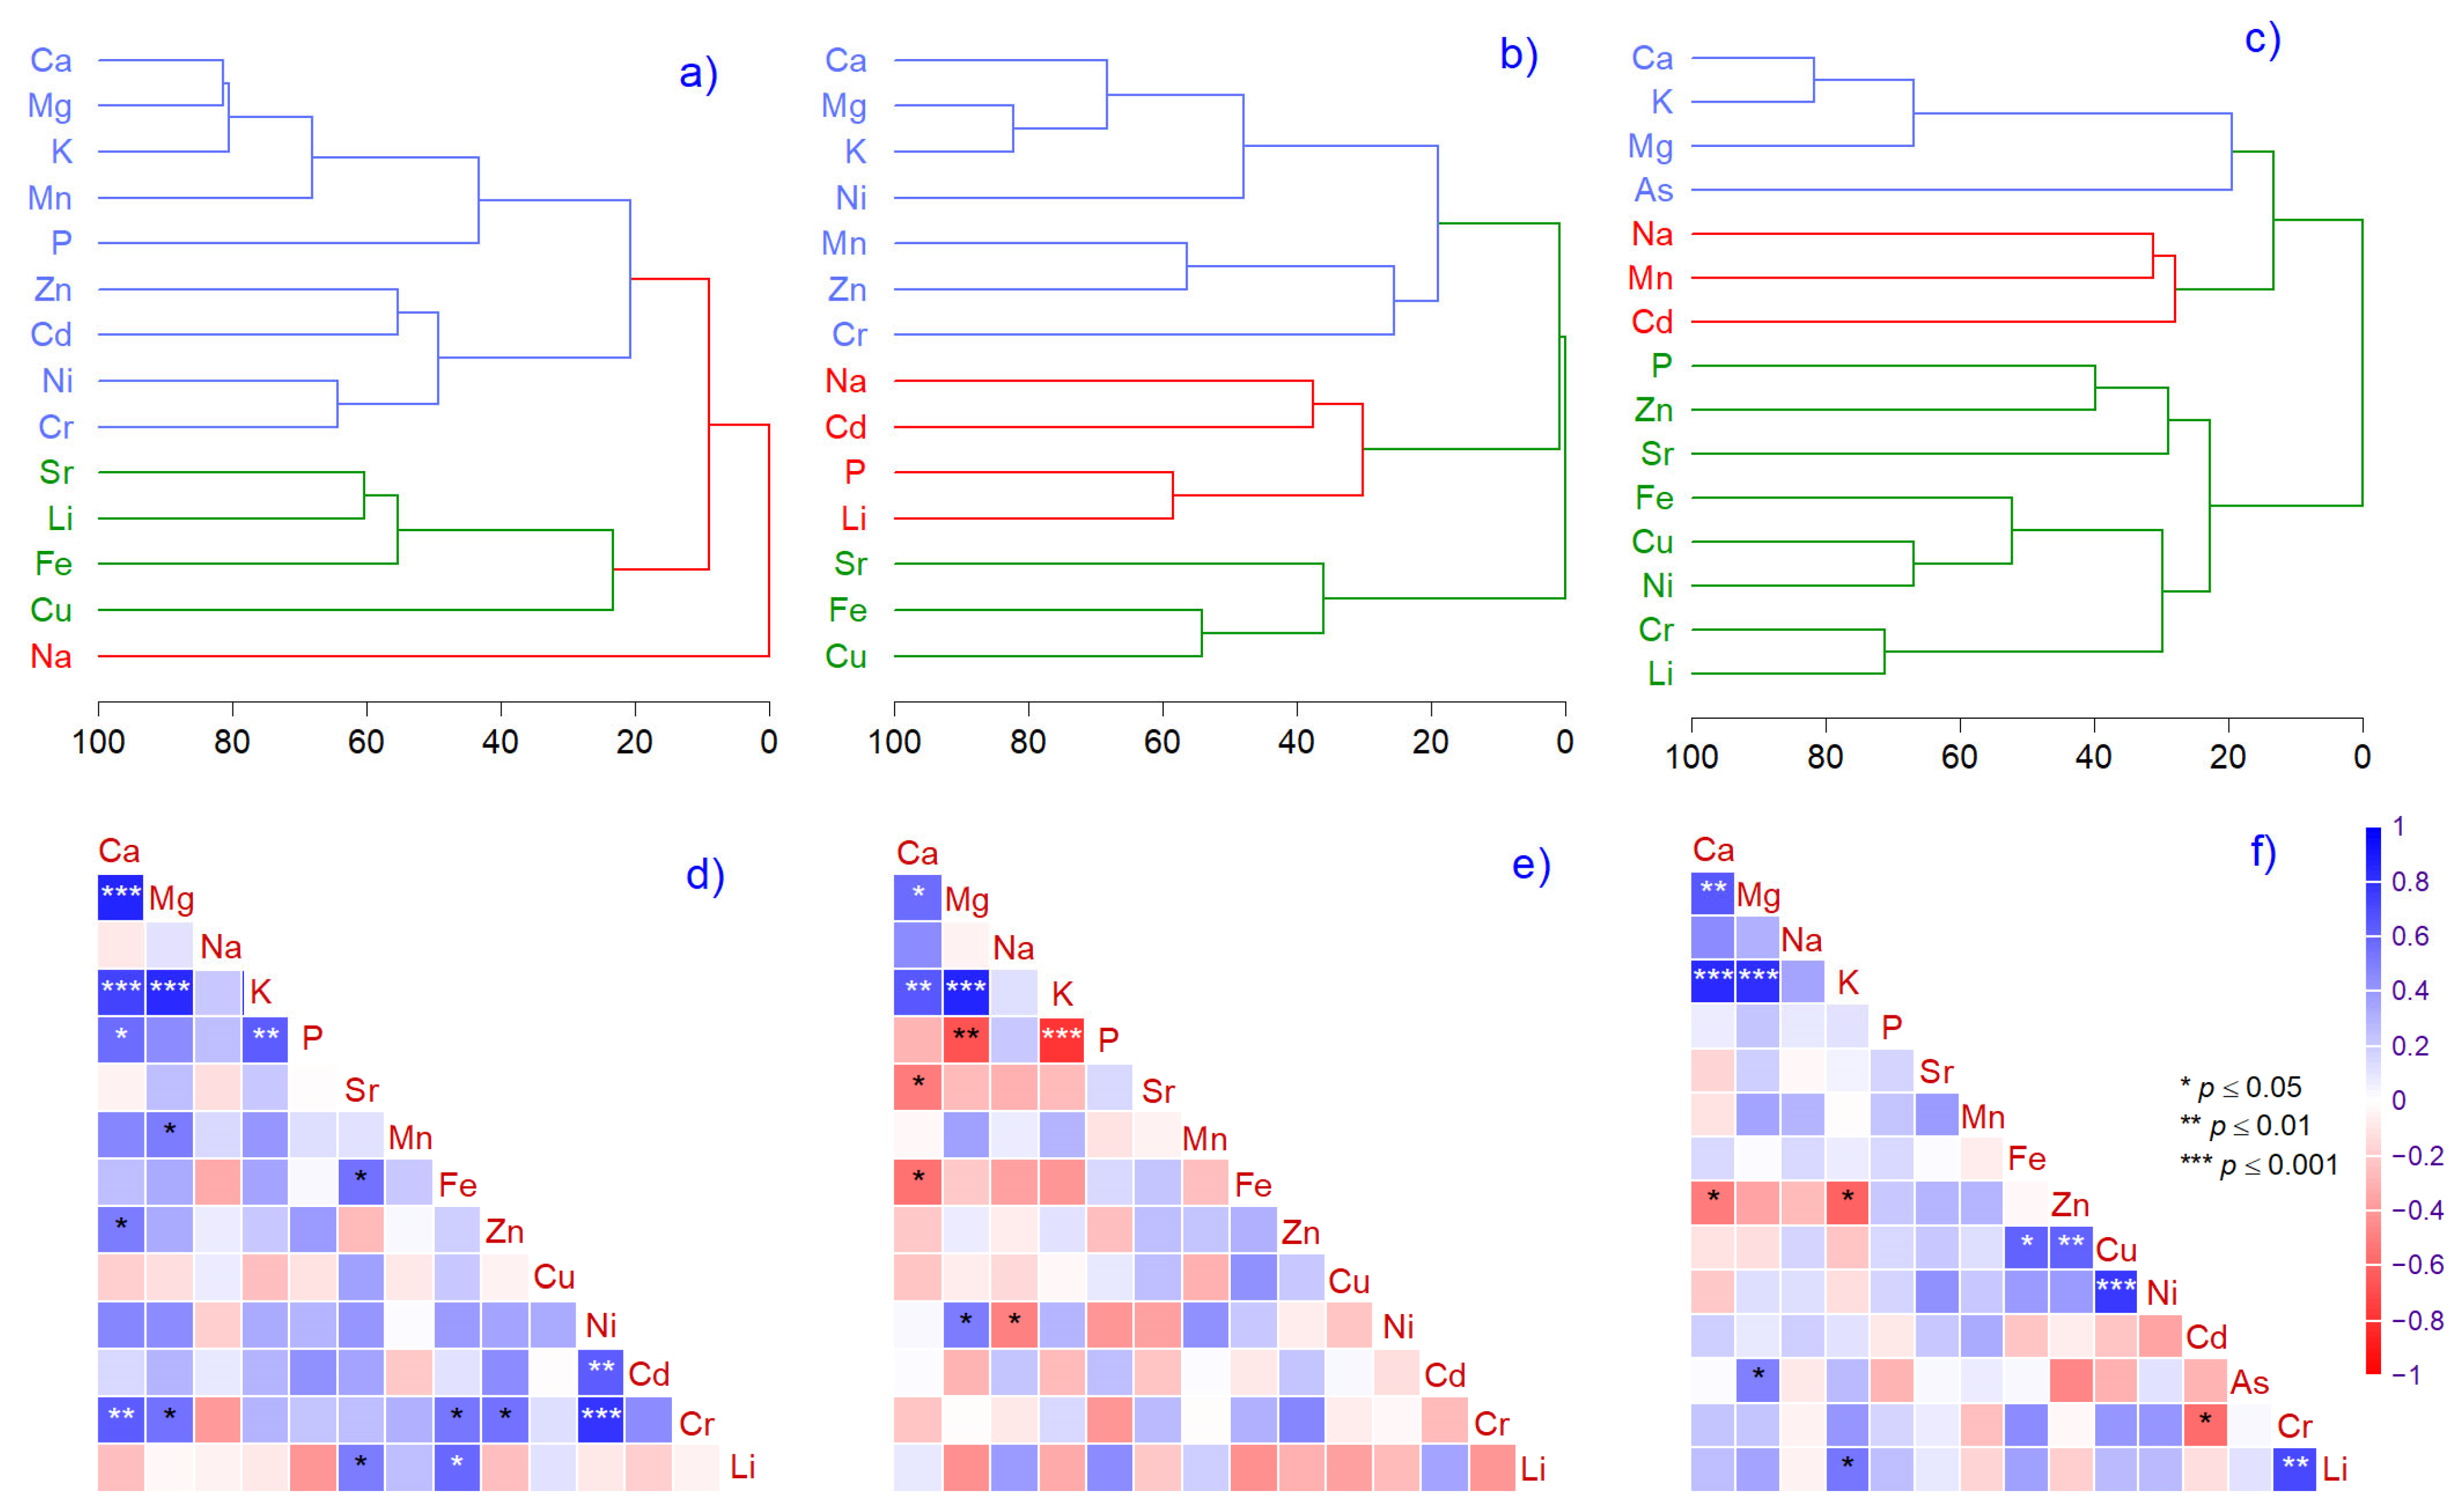
The multivariate analysis illustrates that the three most representative elements changed from litter (Ca, Li, Na) to bark (K, Li, Cu), and to needles (K, Na, Cu) (Figure 3a–c). Even so, the metals related to litter samples were not found in similar associations with bark or needles (Figure 3d–f). Exceptions were K vs. Mg and Ca, which had strong positive relationships across all matrices.
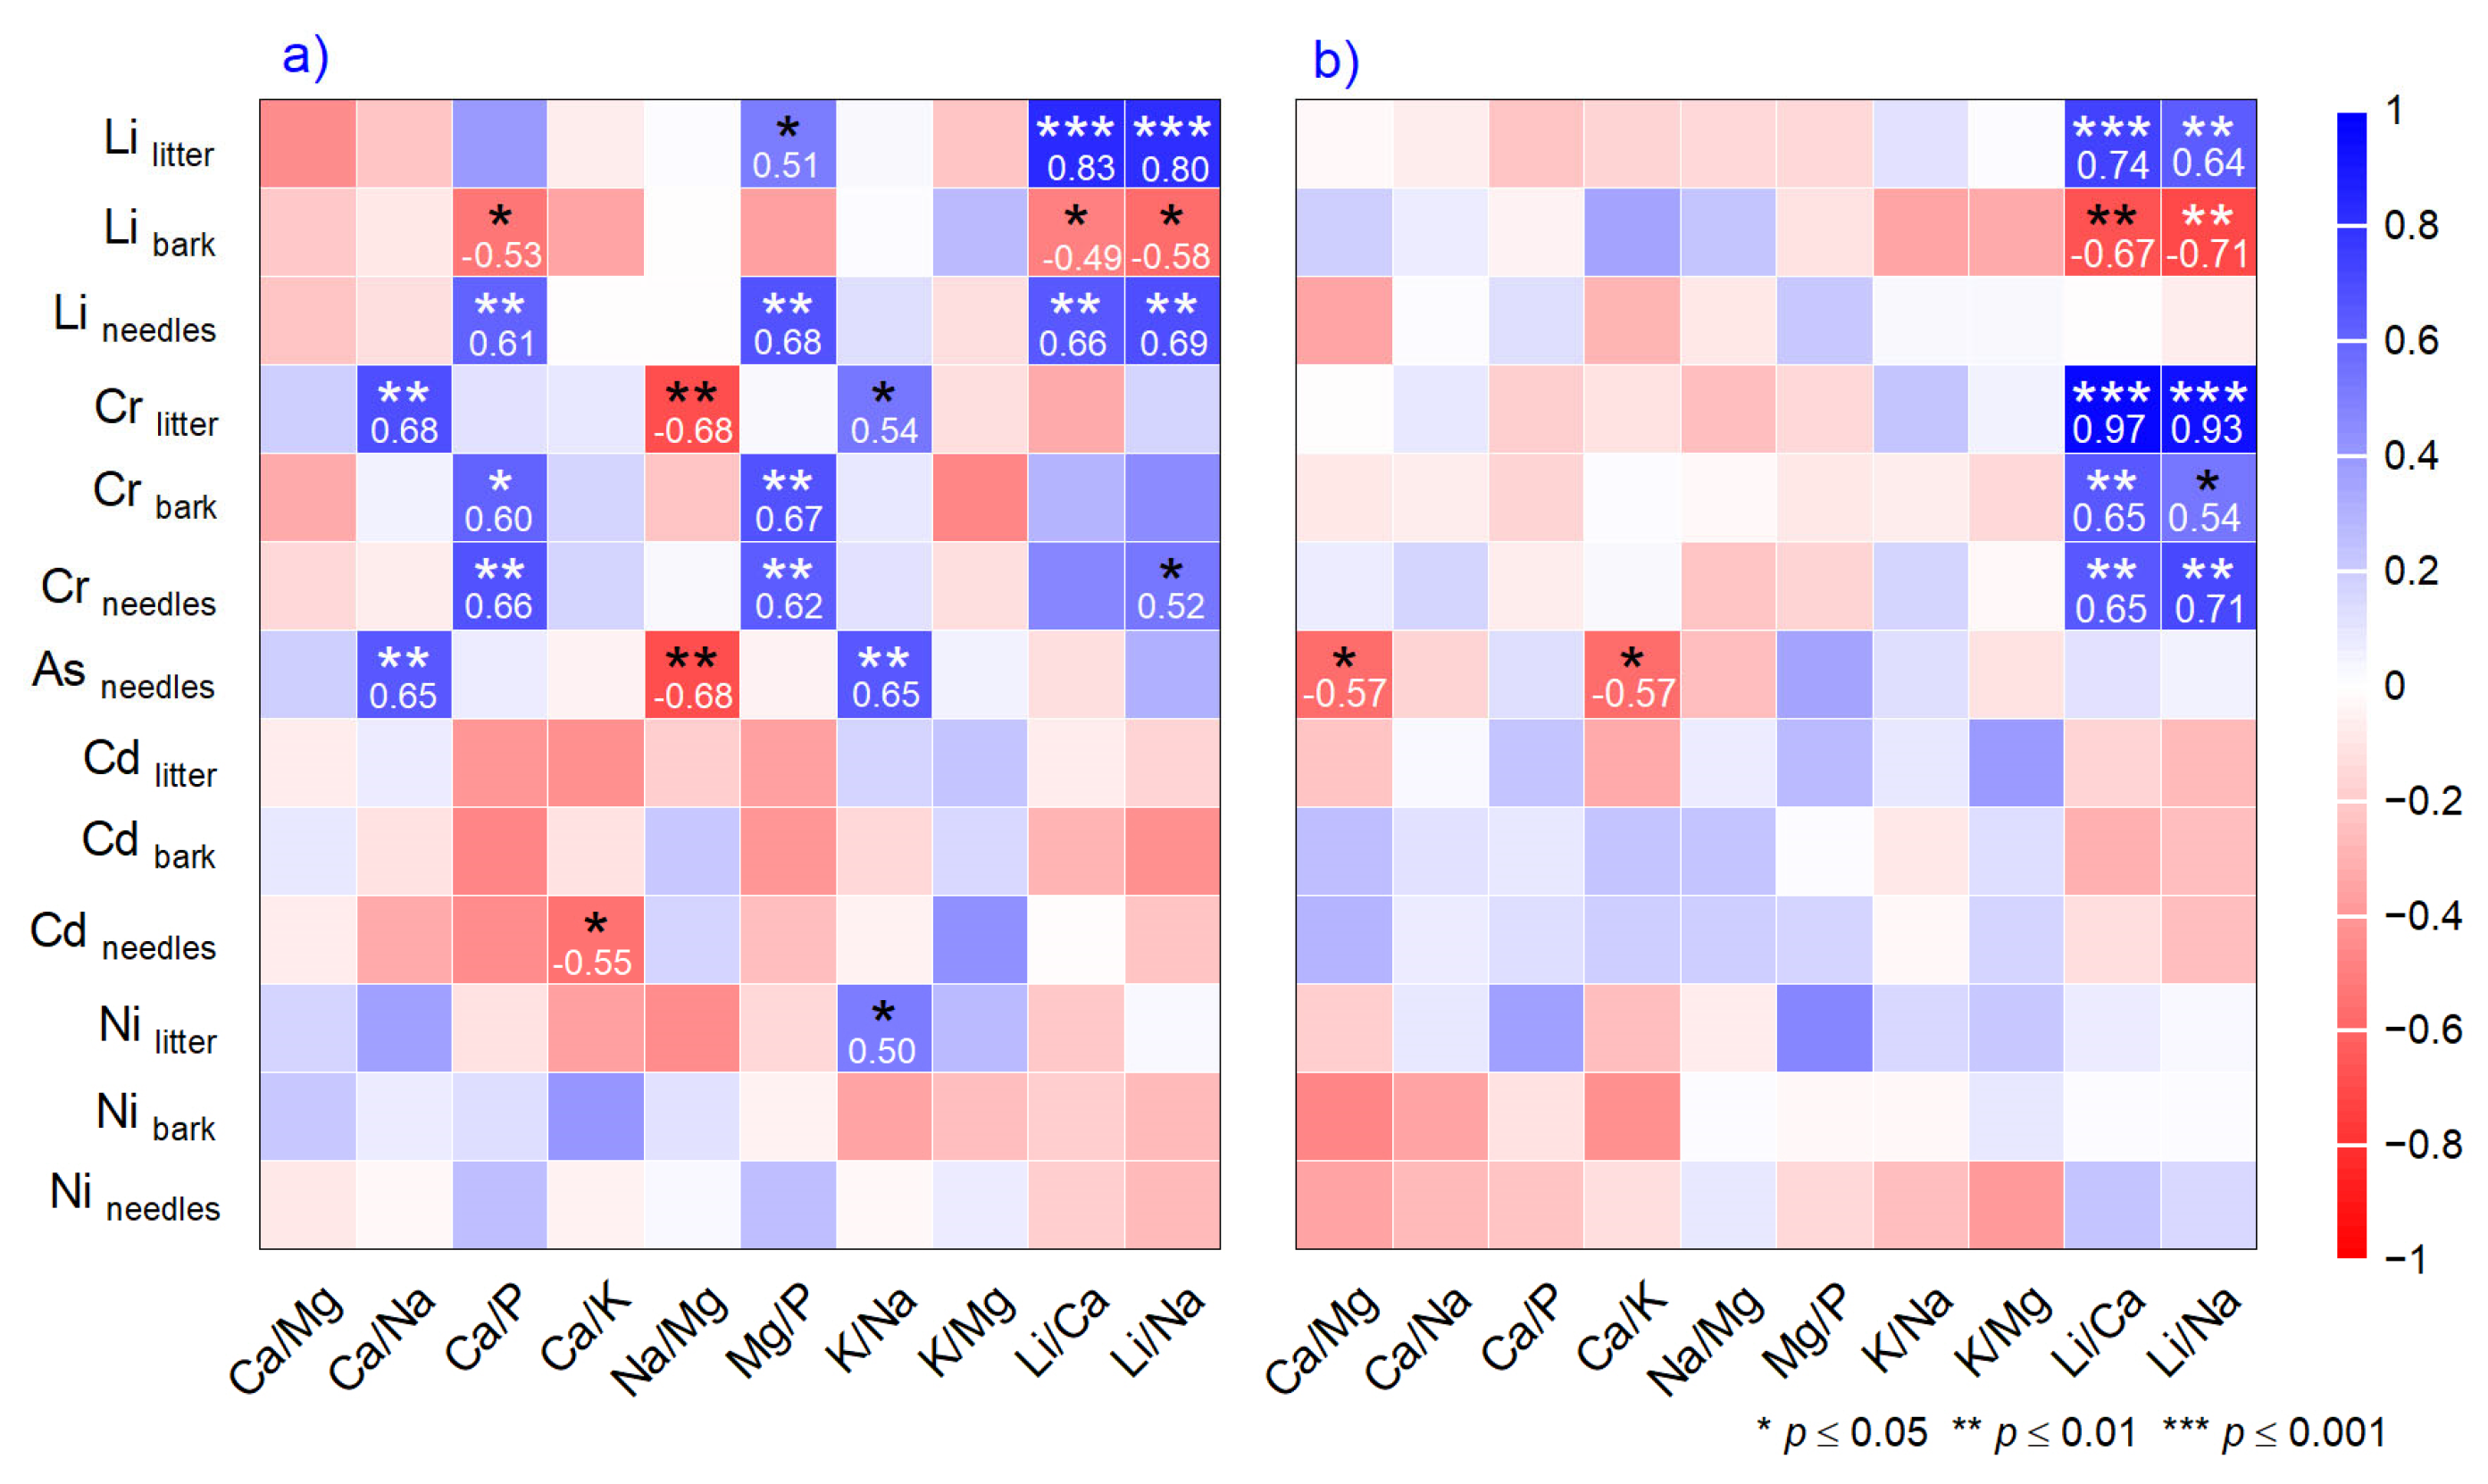
The mole ratios in litter showed more significant relationships than those in needles (Figure 4a,b). The litter ratios had a negative relationship between Libark vs. Ca/P, Cdneedles vs. Ca/K, Crlitter, and Asneedles vs. Na/Mg. An opposite, strong positive relationship was found between Ca/Na, Ca/P, Mg/P, K/Na, and Li/Na, and Ni, As, Cr, and Li across all matrices (Figure 4a). The Ca/Mg and Ca/K ratios in needles decreased with rising As concentration (Figure 4b). A symmetrical relationship was found for Cr in needles and bark, demonstrating similarity to Li/Ca and Li/Na ratios.

2.4. Environmental Risk Assessment

A bioconcentration factor index (BCF) value > 1 indicated that needles and bark showed potential for metal accumulation. In our case, in needles, BCF had extreme values for Ca, Mg K, P, Mn, Fe, Zn, Cu, Ni, and Cr of 62, 36, 149, 126, 23, 511, 289, 59, 1399, and 2423 mg kg−1, which were found in 82, 76, 100, 58, 35, 100, 58, 64, 88, and 100% of samples. In bark, Ca, Mg, K, P, Mn, Fe, Zn, Ni, and Cr had maximum values of 23, 22, 88, 32, 10, 10, 111, 146, and 82 mg kg−1 found in 29, 29, 88, 23, 5.8, 5.8, 29, 64, and 47% of samples. BCF ≤ 1 indicated that plants only absorb and do not accumulate the metal in their organs, as was the case for Na, Sr, Cd, and Li (64, 82, 58, and 100% of samples) in needles, and Na, Sr, Cu, Cd, and Li (41, 88, 5.8, 100, and 100% of samples) in bark (Figure 5).
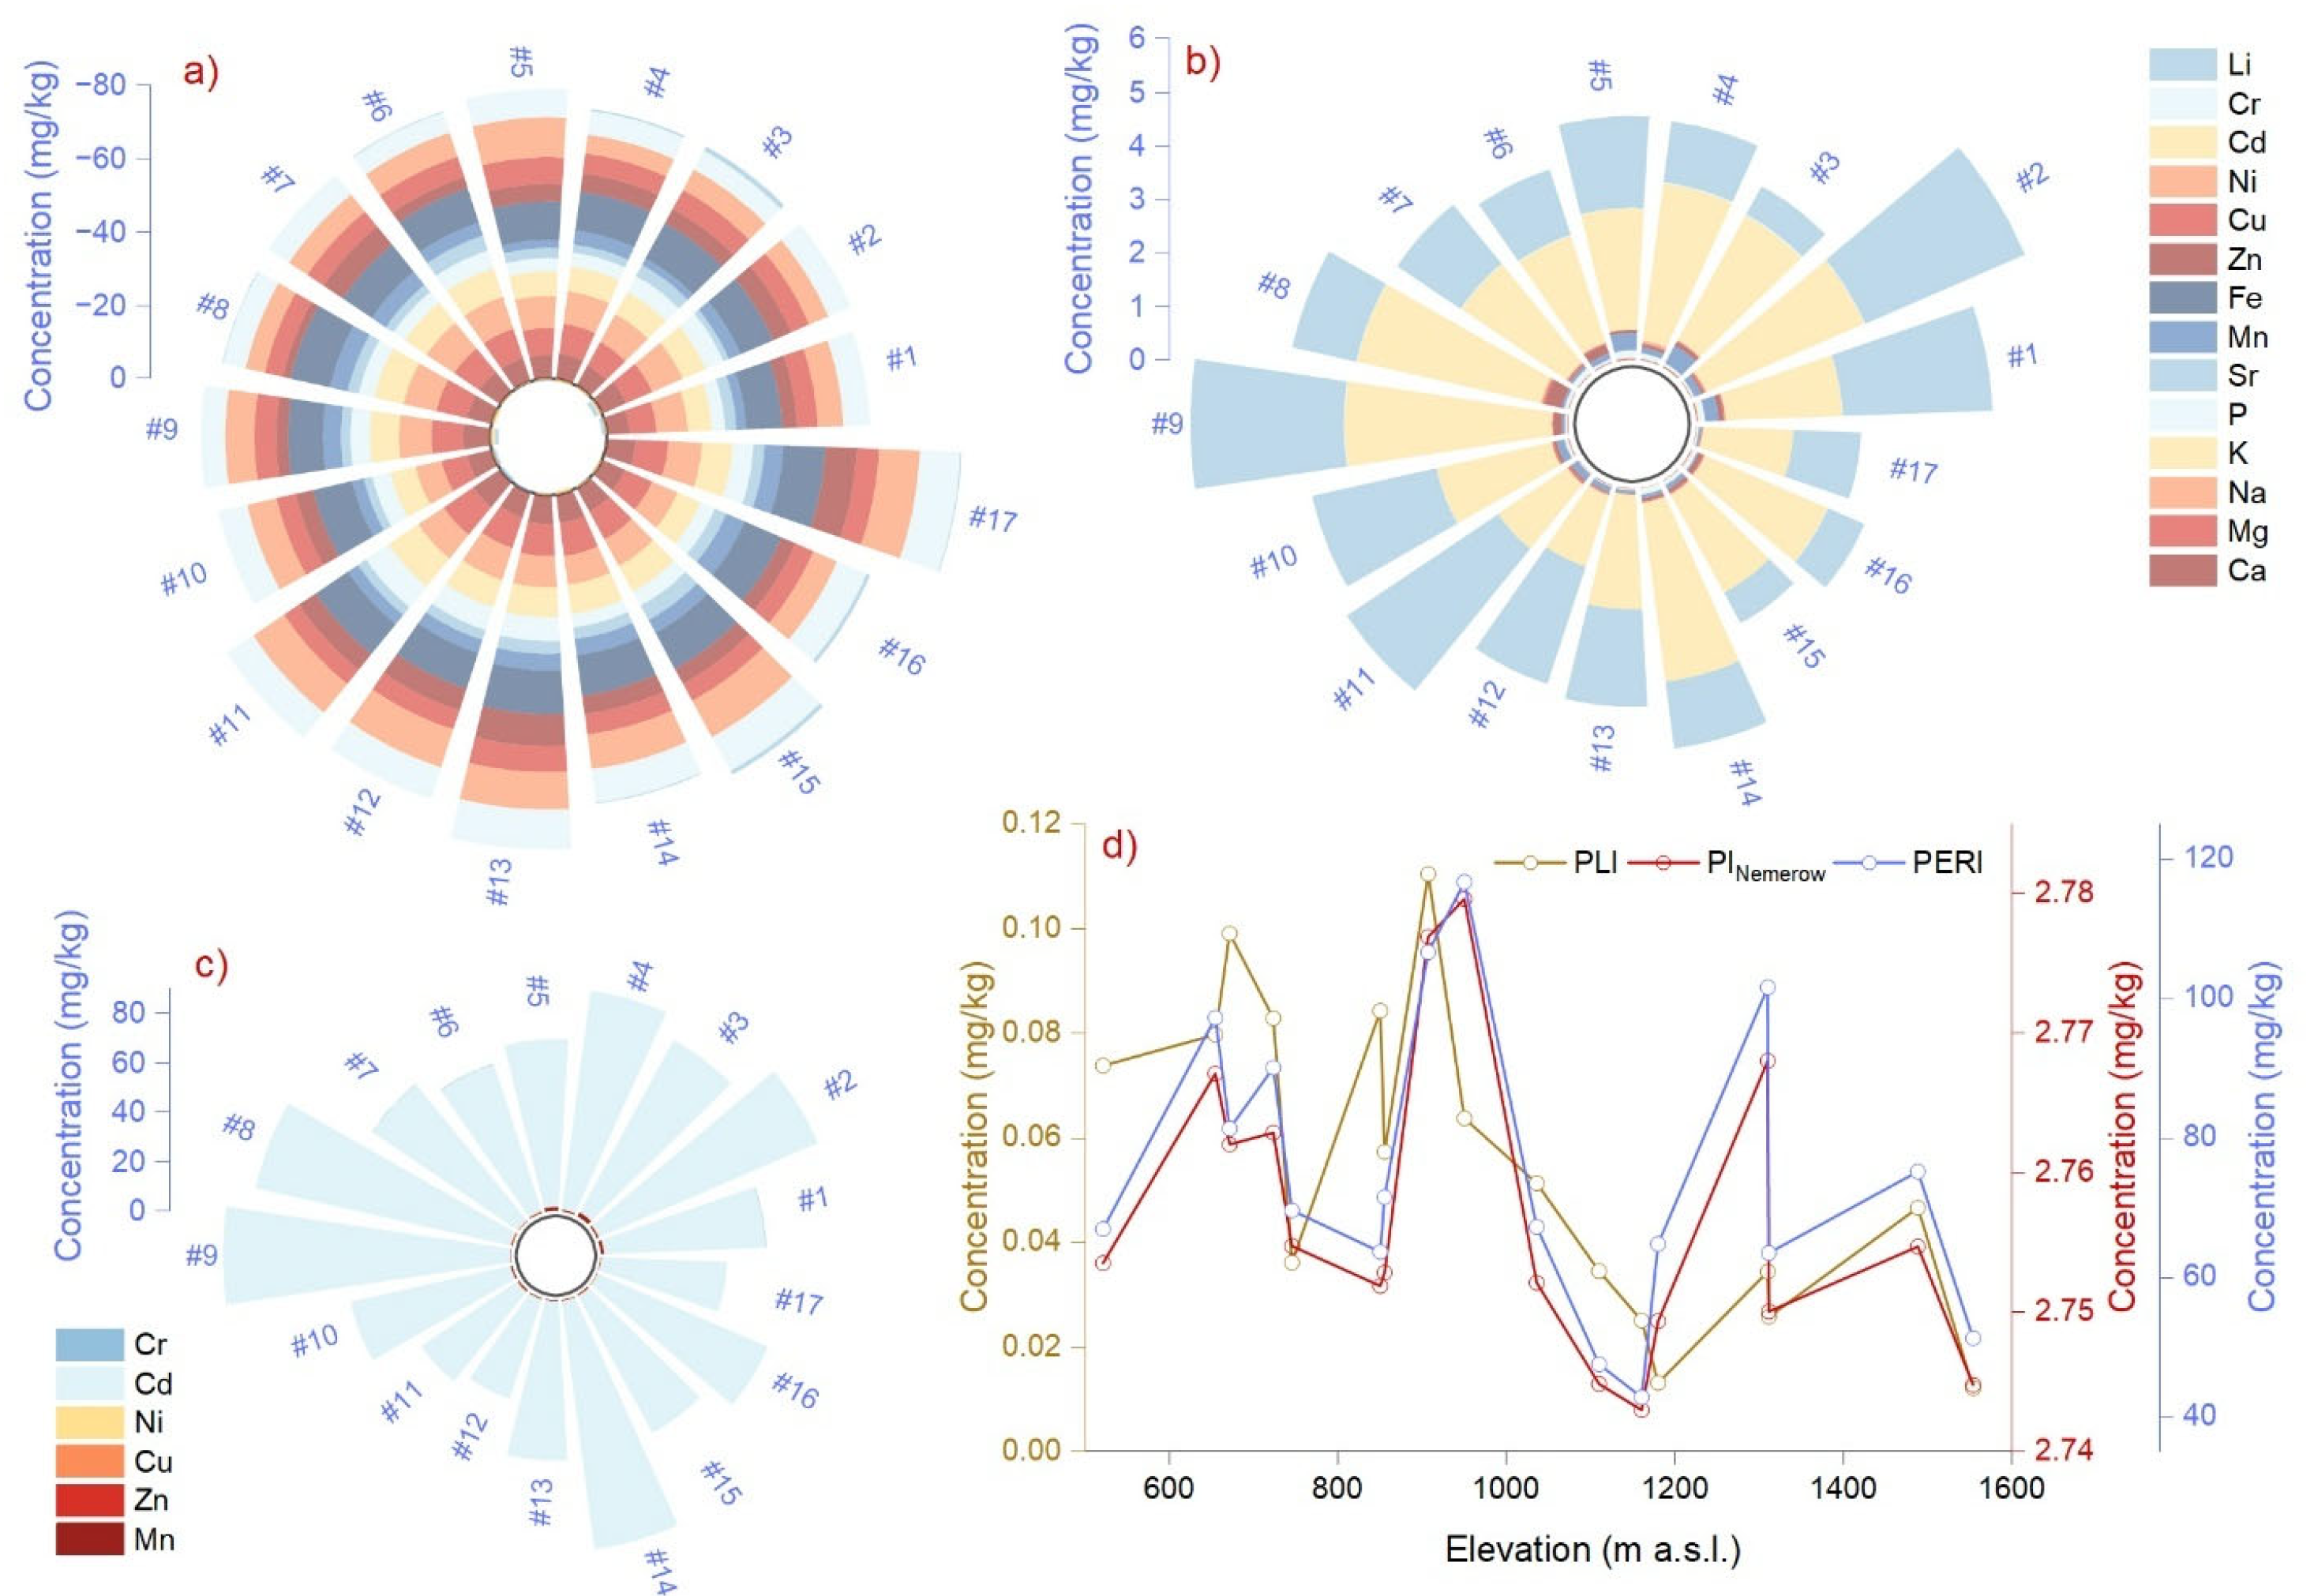
The sites were classified as unpolluted or considerably contaminated when evaluating the litter. The Geo-accumulation index had negative values except for Cd and Li, where the variation interval was between −0.09 and 1.36 and −1.31 and 1.18 mg kg−1 (Figure 6a). Contamination factor values indicated moderate contamination levels, particularly for sites located at 654, 907, 950, 1110, and 1310 m altitude (Figure 6b). Ecological risk was below 1 for Mn, Zn, Cu, Ni, and Cr, but in the case of Cd, the mean values were 74 mg kg−1, i.e., moderate values above 100 were found at 907, 950, and 1310 m, corresponding to considerable enrichment (Figure 6c). The pollution load index showed uncontaminated litter ranging between 0.01 and 0.11 mg kg−1 in all cases. The Nemerow pollution index had values between 2.74 and 2.78 mg kg−1, indicating moderate contamination. Finally, ecological risk and potential ecological risk values documented a low risk associated with toxic elements in litter (Figure 6d).

3. Discussion

3.1. Elemental Distribution, Origins and Altitudinal Trends

The bioaccumulation of HMs and other atmospheric pollutants in tree organs is highly important for evaluating ecosystem health [30,31]. The origins of heavy metals in the Cozia Mountains are mainly anthropogenic, resulting from two industrial facilities and road traffic. Similar values of 206/207Pb and 87/86Sr isotopic fingerprints were obtained in water and sediment samples in the Olt River that crosses our study area, which was demonstrated to be from anthropogenic inputs [32]. All metals showed a high variability unrelated to altitude, except for As in needles, which showed a decreasing trend (Figure S2). We found that nutrient content had sustained high values between 950 and 1160 m, which decreased until 1310 m in needles; the opposite pattern was found in bark, which peaked around 1023 m in litter. Also, the non-toxic and toxic elements presented intermetallic similarities rather than within matrices, which can be attributed to particle weight [33]. Air currents from higher altitudes can transport significant volumes of particles charged with metals [34]. Earlier studies on long-range HMs atmospheric transport illustrated that remote high-elevation forest limits and treelines have been affected at least since the 1980s [35,36]. The process of transporting atmospheric deposition is complex and depends on anthropic activities that generate emissions, particle size, climatology, topology, and forest characteristics. High-elevation forest limits are exposed to specific wind and abrasion contact forces with air masses, causing differences in metal deposition [37]. Both dry and wet deposition can be factors of different metal deposition and absorption since water-soluble metals (Ni, Fe, Pb, Mn, Cd, Zn, and Cu) are reflected in vegetation and soil solution [38]. In comparison, insoluble metals (Cr, Ni, Fe, Al) are mainly found in vegetation layers [39,40,41]. Point sources and the distance to the affected area are essential to systematic contamination [42].
The presented results indicated high bioavailability in Norway spruce, mainly for Zn, which decreases with distance from a point source. These findings were also presented in other similar studies [43]. It was noted that in Norway spruce bark, the chemical concentration content differs between 0.25–0.45 mm and below 0.18 mm granulometric fraction, being higher in the fines fraction [44]. The Cu (5.5 mg/kg), Zn (155 mg/kg), Ni (4.28 mg/kg), and Cr (2.11 mg/kg) obtained in a natural forest from Sweden can be compared with our mean bark concentrations [44]. A similar study in Sweden indicated higher concentration (mg/kg to evaluate HM content in the litter) in bark of Ca (7290), K (2490), Mg (1110), P (640), and Na (96), compared with our results, but similar values of toxic elements Sr (31.1), Cr (0.47), Ni (2.94), and Cd (0.63) [45]. Our results show that the heavy metal analysis of the bark had lower concentrations than in the needles, which can be used to conclude that needles can be used as bioindicators of heavy metal pollution and the status of elements essential for vital growth. Similar results have previously been presented in the literature [46,47].
The metal concentration in needles is used to assess nutrient deficiency under pollution stress, offering valuable information regarding the contamination degree and the mineral levels for sustaining vital plant growth [48,49]. The mean concentration of essential nutrients in needles had a decreasing order from K > Ca > Mg > P > Na, with maximum values of 7200, 6300, 940, 971, and 107 mg/kg (Figure 1; Table 1). The limits for plant nutrition and global health include values (mg/kg dry weight) between 500 and 40,000 (K), 500 and 10,000 (Ca), 2000 and 5000 (Na), 1500 and 3500 (Mg), and 2000 and 5000 (P) [50]. According to the present guideline, only Ca and K are within the limits, and Na, Mg, and P are much below them. The minimal nutrient requirements for Norway spruce normal growth and development are mentioned in the literature as >6000, 700, 800, and 1800 mg/kg for K, Ca, Mg, and P [51]. In this case, our findings suggest that Mg is within the minimal requirements, and only P is below the beneficial threshold. Phosphorus is mainly responsible for maintaining the normal water regime, and its deficiency is correlated with high N deposition [52]. Elevated N availability reduces carbon allocation to roots and ectomycorrhizal fungi, depleting its retention and increasing leaching, causing tree functional and growth issues [53]. Additionally, a recent monitoring study of the mineral content of Norway spruce needles shows that P deficiency has been chronically declined in the last 25 years on Ore Mountain, possibly associated with environmental pollution [54]. Mg is essential in chlorophyll biosynthesis and is mobile, being reported to be translocated in Norway spruce from older to younger needles [55]. Mg seems to induce sensitivity to photosynthesis in forest ecosystems and regulates biomass production under scarce resources [56]. The Mg from air pollution enrichment has low transfer ability from the bark and needles to the wood [57].
The second group of chemical elements evaluated was d-block transition metals, which, according to our results, had a decreasing order in all matrices as follows: Fe > Mn > Zn > Cu (Figure 1; Table 1). Comparison of measurements performed on our samples with optimal concentration ranges as necessary for Fe (50–150 mg/kg), Mn (10–20 mg/kg), Zn (15–30 mg/kg), and Cu (1–5 mg/kg) [51] revealed above-sufficiency threshold values. The measured Fe concentration ranges between 1000 and 6599 mg/kg, which exceeds the thresholds by over 43 times and is associated with a competition mechanism with other essential elements. Higher metal content, such as Fe, Mn, Zn, and Cu, detected in needle samples can be attributed to their role as significant components of emissions from industrial activities and vehicle engines. The needles of pine collected from urban areas exposed to street dust pollution had Fe concentrations up to 29,465 mg/kg [58]. In similar studies regarding urban pollution and natural forest ecosystems, Fe had values in needles up to 274 mg/kg [59], 248 mg/kg [60], 356 mg/kg [61], 189 mg/kg [62], and 644 mg/kg [63]. High Fe ions can induce oxidative stress, damaging the cells and plasma membrane and increasing the production of reactive oxygen species. Mn is a nutrient with physiological implications since it acts as an activator and cofactor of various metalloenzymes [64]. Still, under normal conditions, concentrations above 400 mg/kg can be toxic for most plants [65]. When evaluating similar studies, we found a wide range of concentrations: 1804 mg/kg [66], 720 mg/kg [67], 591 mg/kg [68], and 117 mg/kg [69], concluding that the maximum Mn concentration of 1033 mg/kg found in our study can be detrimental to Norway spruce. Zn is mainly assessed as a nutrient that increases resistance against drought stress by regulating physiological and molecular functions such as cell membrane stability, stomatal regulation, and water use efficiency, and as a stimulator of antioxidant activity [70,71]. The concentration of Zn in tree needles is reported to be 56 mg/kg [68], 570 mg/kg [72], and 47 mg/kg [73]. In an urban area, Picea punges were used as bioindicators of urban air pollution, and the results indicated that the Zn concentration depends on traffic density and the needles’ ages, with values up to 80 mg/kg in 5-year-old samples [74]. Cu is essential for enzymatic activities, chlorophyll production, respiration and antioxidant systems, and signal transduction [75]. The Cu concentration decreases with needle age, and translocation to younger parts of foliage is observed [76]. The previous reports show values of Cu in needles of 26 mg/kg [77], 19 mg/kg [78], 9.2 mg/kg [68], 7.7 mg/kg [76], which show that in our study area, the values are not excessively high but can be associated with road pollution.
The third group of toxic metals shows a decreasing order of the mean concentrations in needles from Sr > Cr > Ni > Li > As > Cd (Figure 1; Table 1). The interval range for normal growth and development in plants was set at Cr (1–2 mg/kg), Ni (0.1–1 mg/kg) [50], Cd (0.098 mg/kg) [79,80], As (5 mg/kg), Sr (350 mg/kg), and Li (20 mg/kg) [81]. Strontium (Sr) may occur naturally; however, in this case, it can be associated with industrial activities conducted in Copsa Mica, leading to severe groundwater contamination [2]. We found a maximum 81 mg/kg concentration at the 1160 m altitude site. The results are comparable with other European reports, which indicated values of 63 mg/kg [82], 71.9 mg/kg [83], 33 mg/kg [69], and 37 mg/kg [84]. Sr is an alkaline earth metal with a 15-ranking abundance (340 ppm). The Sr exhibits mobility and can translocate between various plant organs via the plasma membrane transporter mechanism for Ca and K. Those elements are replaced, and stable Sr induces several toxic effects, including reduced growth rates [85]. Chromium (Cr) varied between 19 and 127 mg/kg, with the maximum value at the 1160 m altitude site. The recommended values in plants were exceeded at all sites, and the content was much higher compared to similar results in needles exposed to traffic, as is the case of 4.5 mg/kg [69], industrial urban areas 16 mg/kg [78], or a natural protected park 10.6 [86]. Cr is the 21st most abundant element in the crust (100 ppm) found in air particulate matter and is registered as a priority pollutant uptake by plants through phosphate or sulfate transporters [87]. Several toxic effects of Cr on plant physiology, biochemistry, molecular traits disrupting the cell cycle, enzyme activity, nitrogen assimilation, and antioxidant activity, were previously reported [40,88,89]. Nickel (Ni), in small amounts, is beneficial for regulating metabolism through enzymatic activity, with values ranging from 4.3 to 36 mg/kg, significantly higher than the recommended limits. The maximum levels were measured at altitudes between 521 and 723 m. Other results show lower concentrations of 1.1 mg/kg [69], 6.4 mg/kg [68], 1.3–5.2 mg/kg [78], and 9.78 mg/kg [86]. Even though some authors suggested that values up to 10 mg/kg are toxic for sensitive species [50], in low-polluted areas, reported values were between 8.1 and 55 mg/kg, mentioning that Ni bioavailability increased with soil acidity and organic matter content [66]. Lithium (Li) is a metal of great interest in transitioning to green energy, increasing yearly demand and consumption, causing extensive waste worldwide, and inducing toxic effects on plants by affecting photosynthesis, DNA biosynthesis, and enzyme activation [90]. In higher amounts, it can displace K+, Mg2+, and Ca2+ in biological membranes [91]. In our study, Li varied between 5.2 and 37 mg/kg (maximum values around 1000 m and 521 m altitude), comparable with the average of 30 mg/kg reported for the earth’s crust [90,92]. In plants, Li concentrations have not been extensively studied, and the thresholds for severe toxicity up to 40 mg/kg in most cases differ between species, whether naturally occurring or resulting from contamination [93]. Similar results show values of Li in needles ranging from 14 to 48 [94], 0.03 to 0.07 mg/kg [25], and 4.0 mg/kg [69]. Arsenic (As) is a highly recognized metal with toxic potential originating from natural sources and anthropogenic activities, and it is easily transported through air and water [95]. Here, we found values ranging between 0.37 and 0.87 mg/kg, comparable with other findings of 0.20–0.31 mg/kg [25], 0.53 mg/kg [69], and extremely high values were also reported in tailing dumps of an abandoned lead-zinc mine in South Korea (11.7 mg/kg) [95]. The highest concentrations are found between 500 and 1000 m altitude. Cadmium (Cd) is extensively studied for its harmful effects on living organisms, with one of the primary sources of contamination being atmospheric deposition [96]. The higher toxicity increases reactive oxygen species, causing membrane damage and cell biomolecule degradation. Cd reduces Fe and Zn uptake in plants [97]. Still, high chlorophyll, carbon, hydrogen, nitrogen, phosphorus, potassium, proline, soluble sugars, and phenolic compounds in Pinus sylvestris and Abies alba needles increase photosynthetic functions and enhance Cd tolerance [8,67]. In our study, the range of Cd varied between 0.11 and 0.41 mg/kg, which is not extreme. Similar values were previously reported as 0.11 mg/kg [86], 0.23 mg/kg [78], 0.18 mg/kg [80], 0.036 mg/kg [69], and 0.08 mg/kg [25].

3.2. Relationship Between Nutrients Mole Ratio and Toxic Metals

Atmospheric particulate matter (dry or wet deposition) through soil–plant systems is included in the terrestrial biogeochemical cycle and can induce climatic effects by absorbing or scattering solar radiation and cloud condensation nuclei [98]. Unfortunately, few studies on tree species in natural forests evaluate the toxicity of the deficiency of various mole ratios compared with stoichiometry in Norway spruce, with more results reported for Larix sp. and Pinus sp. [25,99,100]. Even so, the literature indicates an optimal mole ratio of Ca/Mg (6.5:1), Ca/K (13:1), Mg/K (2:1), Ca/P (1–2:1), and K/Mg (1.5:1) [101,102,103]. The Ca/K (0.85) and Mg/P (2.05) ratios in needles found in our study reflect a balanced mineral ratio, also discussed in similar studies [99]. Additionally, in needles, we calculated mole ratios of K/Na (81:1) and Ca/Na (70:1), revealing an increase in the proportion of essential elements potassium and calcium. In our study, K and Ca are not in elevated amounts, and their deficiency is associated with detrimental effects on photosynthesis, osmoregulation, and several other essential processes. Sodium, in high concentrations, is harmful for physiological processes by interfering with K+ uptake, which is not the case in our study, where it was below the threshold and considered beneficial. The dualism of K/Na and Ca/Na can affect biophysical and biochemical processes, metabolic cell functions, activation enzymes, respiration, and photosynthesis, but only when Na is in higher amounts [104]. K and Mg are involved in photosynthesis, phloem transport of photoassimilates, and photoprotection [105], and in our study, the ratio was 7:1, which can be considered normal. The literature indicates that the high concentration of certain metals, such as Fe and Mn, in needles could explain the deficiency in essential minerals [48,49]. Several toxic metals, such as Cr, Ni, Cd, and As, are associated with Na, Mg, and P deficiency in needles [106]. Based on correlation analysis, an increase in toxic Zn reduces K and Ca in needles. Additionally, the increasing As in needles negatively affects Ca/Mg and Ca/K, a fact sustained by correlation and hierarchical cluster analysis (Figure 3c and Figure 4b). Arsenic inhibits the uptake of various nutrients, including Ca, Mg, and K, since it can enter the cells of plants using channels of essential nutrients [107,108]. A more complex relationship between mole ratios and toxic metals is observed in litter, suggesting that toxic metal concentrations increase during litter decomposition. The literature reveals gaps in information regarding changes in the elemental composition of litter after decomposition. However, the limited results also showed that the concentrations of Cr and Cd increased, regardless of ecosystem type and litter species during decomposition [109].
Recent advances have pointed out the importance of studying Li isotopic fractioning during watering and its content vs. mineral ratios to assess past environmental processes that involve weathering and hydrothermal circulation [110,111,112]. Li mobility is related to critical cations in the carbon cycle (Ca, Mg, Na, K, P), which vary over time but can evolve quickly and have similar mobility in all elements [113]. These results suggest that the Li and 7/6Li isotope ratios can precisely trace Earth’s surface processes [114]. A recent country-level database showed that Li/Ca and Li/Na in natural waters (0.035–3.02 and 0.005–0.21) [111] differed from those measured in needles (0.002–0.008; 0.05–0.66) and litter (0.02–0.75; 0.07–0.82). The Li/Ca and Li/Na ratios are temperature proxies, and they differ significantly between abiotic and biogenic components due to elemental assimilation during carbonate mineral precipitation under soil acidity and dissolved inorganic carbon [115]. Significant peaks were found for both ratios at 650, 950, and 1100 m, which can be explained by a low decomposition rate in litter and transfer to soil rather than plant assimilation, reflected by extremely low BCF indices.

3.3. Environmental Health Risks

The bioconcentration factor (BCF) indicates the potential to uptake single HMs and translocate them into tree organs. Our results documented an imbalanced contamination level between needles and litter, with high BCF values in needles and low transfer from litter to plant organs. The average BCF of Fe, Zn, Cu, Ni, Cd, Cr, and Li was 164, 36, 14, 360, 1, 484, and 0.4 in needles and 3.2, 17.6, 2.8, 53, 0.4, 23, and 0.1 for bark, respectively. Needles are more suitable for monitoring metal pollution since they have a higher accumulation ability than bark. The results indicate that Norway spruce had a higher accumulation capacity of Cr, Ni, Fe, Zn, and Cu. The litter was classified as unpolluted or considerably contaminated, but the imbalanced metal levels can be a problem for forest growth. The Cd concentrations induced a moderate ecological risk at most sites. Even so, at 907, 950, and 1310 m altitude, the ecological risk is considerable in our study area, necessitating future monitoring activities due to its high toxicity. The Igeo, Cf, PLI, PINemerow, and PERI indicate that Cd can represent a moderate risk for most sites.
The integrated assessment of pollution in biological samples documents two aspects: (i) mixed sources of contaminants transported from sap flow to leaves originating from inorganic and organic soil used to assess past pollution, and (ii) stomatal absorption, which discloses air deposition [116,117,118,119]. Together with minerals, toxic metals (Hg, Cu, Pb, Ni, Zn, As) are assimilated, affecting plant physiology [120]. Depending on its amount, each HM is responsible for detrimental effects on plant growth and development, and it can affect the functioning of the soil microbial community structure, altering C:N:P stoichiometry [121]. The As, Pb, Cr, Co, Mn, and Zn concentrations in litter induce inhibition of carbon fixation, resulting in negative implications for biogeochemical cycles [122,123]. Not only do absolute values of metal concentration in plants reflect dysfunctions between physiological processes but also balanced mineral composition.

4. Materials and Methods

4.1. Study Area and Sample Collection

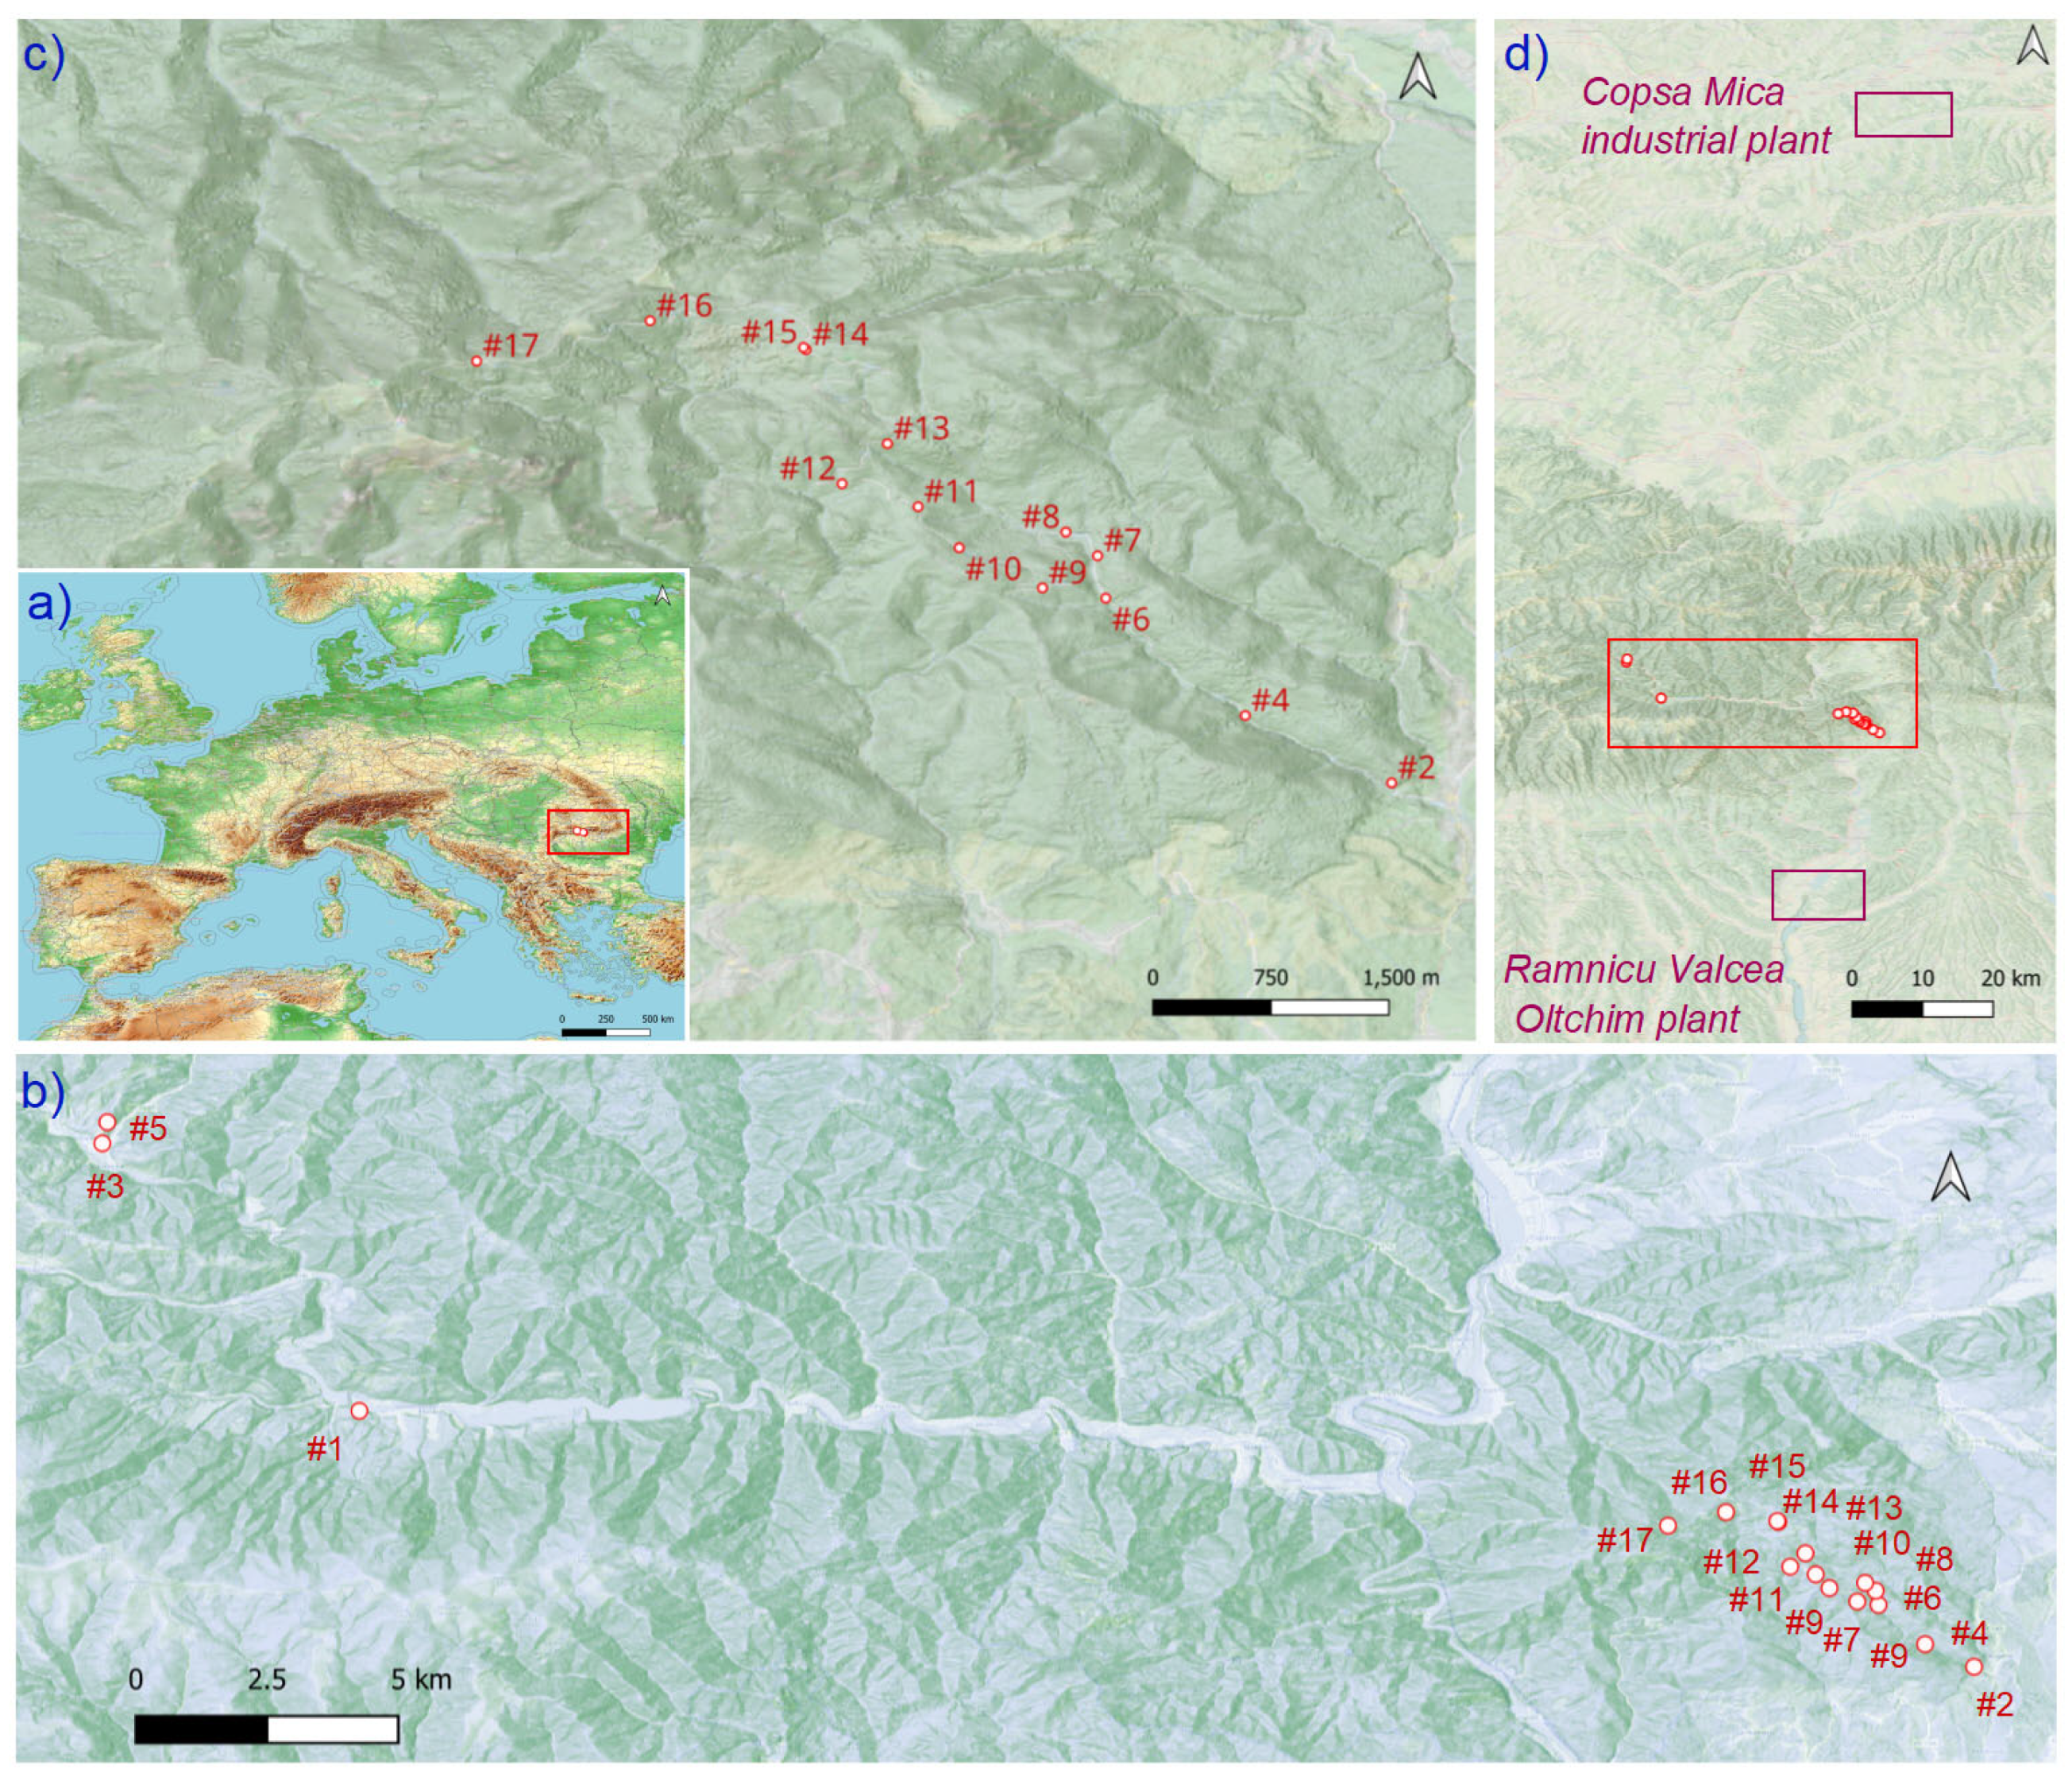
The study area is located in the Southern Carpathians, in the “Cozia Mountains” National Park, which covers 17,100 ha (Figure 7a). The region is considered to be little affected by pollution and where the country’s most prominent resorts for treatment (pulmonary diseases) and relaxation are located. A highly used road crosses the park through the Olt Valley and connects the northwestern country border to Bucharest. The geological structure combines crystalline and sedimentary rocks, and several particular geomorphological characteristics are found along the altitudinal gradient. The highest mountain peak reaches 1668 m a.s.l. A succession of vegetation layers starts at the mountain base with European beech (Fagus sylvatica L.), mixed with oaks (Quercus petraea (Matt.) Liebl.) and birch (Betula pendula Roth). Upwards, P. abies and Abies alba Mill. become dominant. Two significant contamination sources were identified at less than 100 km from both edges of the Olt Valley, namely the Olchim chemical plant and the Copsa Mica Industrial plant (Figure 1). The Oltchim chemical plant was founded in 1966 to produce inorganic, macromolecular, and organic synthesis products (chlor-alkali, oxo-alcohols, propylene oxide, vinyl chloride monomer). This industrial complex includes the Sodic Govora plants that produce live steam, and contain facilities for producing, conditioning, and delivering fuels, water, electricity, and thermal energy. The principal emissions of metal pollution resulting from its activities include Cu, Zn, Pb, Mn, Cd, Ni, Co, Fe, and Hg [5,32,124]. The industrial activity in Copsa Mica began in 1935 and has caused significant environmental issues by releasing substantial amounts of Hg, Sr, Li, Pb, Cd, Cu, Al, Cr, Ni, Co, Fe, As, Zn, and Mn into the atmosphere, earning recognition as the most polluting source in Europe [2,125,126].
The sampling design was created to understand whether pollution differs along an altitudinal gradient. In mid-October 2021, we collected first- and second-year-old needles and tree bark from dominant, apparently healthy P. abies trees. In each sampling plot, samples were collected from three trees. Specifically, three plots were selected from the litter, with a distance of five meters between each plot. All materials were subsequently mixed, and a selection was further evaluated. Of the 17 locations, 3 are outside the national park, inside the mountain, with no evident contamination factor considered as control sites, and 14 are within the park, near a highly used national road (Figure 1). The 14 sites evaluated for pollution were near the Olt Valley, which also transports air masses possibly contaminated by two highly industrialized areas. We chose an intermediate southern exposition (inside the forest) on the roadside to encompass an almost 1000-m-wide altitudinal gradient. Samples were selected by hand from the first-level branches (2–3 m height) with rubber gloves, thoroughly mixed, and transported in plastic bags to the laboratory, where they were stored in a cool, dry space. In addition, we collected and investigated litter samples from the litter horizon, fermentation, and the humus horizon, depending on the altitude and degree of decomposition. In the litter horizon, the material was undissolved and in fermentation; and in the humus horizon, the material was decayed, exhibiting various degrees of decomposition. To assess heavy metal (HM) content within the litter, we collected samples from the uppermost layer of the forest floor, which contains mineral-organic debris, including needles, branches (less than 5 cm in diameter), fruits, and various types of plant matter exhibiting different stages of decomposition. The bark was extracted from the trunks of trees. In each area, we took six samples from trees of similar diameter and mixed the samples to reduce the environmental variability, georeferenced at the time of sampling. In total, 901 measurements were obtained from three matrices, considering 17 chemical elements.

4.2. Sample Preparation and Analysis

4.2.1. Elemental Analysis

The collected samples were transported into plastic bags and air-dried at the laboratory at 80 °C for 24 h, and the dry weight was measured. The material was finely ground in an agate mortar before being sieved (<0.2 mm). A digestion process was applied to the intended samples to bring them into solution. A closed iPrep vessel speed iwaveJ system, MARS6 CEM One Touch (Microwave Accelerated Reaction System, CEM6 One Touch, CEM Corporation, Charlotte, NC, USA), was used for this procedure to decompose the organic compounds from soil and plant material and extract the target elements to assess multi-elemental metals. This was done according to the two-step temperature-controlled digestion program Microwave Digestion-CEM-Mars 6 Method Note Compendium, 2019. Samples were subjected to microwave-assisted nitric, chlorhydric, and fluorhydric acid digestion. Approximately 0.5–1.0 g aliquot of each sample was weighed, followed by digestion in a mixture of (3 mL HNO3 69% + 2 mL HCl 38% + 5 mL HF 40%) at high pressure, temperature, and the combination of the microwave was increased up to 200 °C, during 6 min, and maintained at this level for 20 min. All plasticware was cleaned by soaking it for 24 h in 10% HNO3, using ultrapure water, then drying it and ventilating it in an oven at 40 °C. The vessels were cooled and carefully opened at the end of the digestion process. Each digest was transferred quantitatively with ultra-pure water to a 50 mL volumetric flask.
The Cd, As, Cr, Li, and Sr were measured in litter, needles, and bark using inductively coupled plasma (ICP-Q-MS Plasma Quant Elite, Analytik Jena, Jena, Germany) equipped with an AIM 3300 Autosampler (Analytik Jena, Jena, Germany) and collision reaction interface iCRI working in H2 and He modes. Calibration standard solutions were prepared by successive dilution of a high-purity ICP-multielement calibration standard (10 μg × L−1 from twenty-nine element ICP-MS standard, Matrix: 5% HNO3, ICP Multi-Element Standard Solution XXI CertiPUR®, Merck KGaA Frankfurter, Darmstadt, Germany). An internal standard was prepared from the dilution of 100 μg × mL−1 internal standard solution of Tb, Y, Sc, Bi in a matrix of 2% HNO3 (Anlytik Jena, Jena, Germany). Working parameters for plasma were chosen to obtain a good compromise between high sensitivity and low oxide levels (140Ce16O+/140Ce < 3.0% and 137Ba2+/137Ba+ < 3.0%). The following instrumental parameters of the ICP-Q-MS Plasma Quant Elite spectrometer were set: 1.00 L × min−1 nebulizer gas flow (NEB); 1.1 L × min−1 auxiliary gas flow (AGF); 9 L × min−1 plasma gas flow (PGF); 1200 W (ICP RF Power).
Mn, Ni, Cu, Zn, and Fe were quantified by flame atomic absorption spectroscopy (AAS). An AAS NOVAA 300 model, with Air-C2H2 flame type of an average fuel flow rate between 0.8–4.0 L × min−1 and the support gas flow rate between 13.5–17.5 L × min−1, was used for sample analysis. Hollow cathode lamps of the different metals were used as radiation sources, and the analytical measurements were based on time-averaged absorbance. Resonance lines at 279.5, 232.0, 324.7, 213.8, and 248.0 nm were employed for Mn, Ni, Cu, Zn, and Fe. Lamp intensity (4–6 mA) and bandpass (0.2–0.5 nm) were used. Air/acetylene flow rates were between 0.9–1.1 L × min−1 for all metals. Before each series of measurements, a calibration line was created for each element. Resonance lines at 422.7, 766.5, 285.2, and 589 nm were employed for macro elements such as Ca, K, Mg, and Na, using a lamp intensity (4–6 mA) and bandpass (0.2–0.5 nm). Air/acetylene flow rates were between 0.9–1.1 L × min−1 for all metals. All chemicals used were of analytical grade and were obtained from Sigma-Aldrich. All solutions and sample dilution for ICP-Q-MS analysis were prepared with deionized water obtained from a Milli-Q Millipore system (Bedford, MA, USA) with resistivity not less than 18.2 MΩ cm−1. The multielement standard solution CertiPur® with a certified value of 1000 ± 3 mg × L−1 obtained from Merck, Germany, was used for the calibration curve in the quantitative analysis. For both analytical methods mentioned above, all the investigated calibration curves were characterized by a high correlation coefficient (r > 0.995), and a correlation coefficient of 0.9999 was a requirement when assessing the method performance of ICP-MS.

4.2.2. Analyses of 206/207Pb and 87Sr/86Sr Isotope Ratios

The instrument performance of ICP-Q-MS Plasma Quant Elite was optimized for the elemental profile of Sr and Pb, and 87Sr/86Sr and 206/207Pb isotope ratios. A Sr isotope (25 µg L−1) standard reference solution (NIST SRM 987 Strontium Carbonate Isotopic Standard [127]) was used as the isotope standard. NIST SRM 987 and SrCO3 are certified for their Sr isotopic composition with an 87Sr/86Sr certified value of 0.71034 ± 0.00026 (2 σ) for the NIST SRM 987 Sr strontium carbonate isotopic standard reference material. The relative standard deviation value was 0.00046, with an RSD% of 0.0648%. A 0.1 g hot-dissolved Pb rod isotope standard reference solution (NIST SRM 981 common Lead Isotopic Standard [128]) was used as the isotope standard. The NIST SRM 981, Common Lead Isotopic Material, certified for its Pb isotopic composition with a 207Pb/206Pb certified value of 0.91464 ± 0.00033, demonstrated the value for an average of 0.91453, with a precision of 0.040418%. The accuracy and precision of the isotope ratio methods for Sr and Pb were tested using replicate ICP-MS Plasma Quant Elite measurements (Analytic Jena GmbH, Jena, Germany).

4.3. Statistical Analyses

Descriptive statistics were used to evaluate each dataset and to assess the subsequent statistical analysis. Pairwise comparisons between elemental levels in needles, bark, and litter were conducted using the Turkey post-hoc test, which was based on multiple correlations. Next, the normal distribution hypothesis and variance homogeneity in sample data were tested using Shapiro–Wilk and Bartlett’s tests, respectively. In addition, multiple linear regression, one-way variance analysis (ANOVA), and correlation analysis were calculated to evaluate the intrinsic relationship between macronutrient content and metals. The measure of regression fit was done by calculating the Root Mean Square Error (RMSE), interpreted as the standard deviation of unexplained variance; lower RMSE values indicate a better fit. The means comparison was performed using Bonferroni correction for significance level, and the Levene test was used to compare variances. A Spearman’s rank correlation analysis and hierarchical clustering analysis (HCA) were performed using group average and correlation distance type, showing the similarities on the y axes to assess possible relationships between elements and to understand their origins. Statistical computation was performed using Matplotlib v3.10.1, SciPy v1.15.2, Pandas v2.2.3, and NumPy v2.2.0 packages under the Python v3.13.1 environment [129,130].

4.4. Risk Assessment

Six risk assessment indices—one index for assessing heavy metal in plants (BCF), and five indices (Igeo, Cf, PLI, PINemerow, and PERI) for understanding the pollution degree in litter—were used to evaluate ecosystem health and to understand the possible effects of heavy metal contaminant air deposition. The intervals of interpretation are presented separately for each index in the Table 3.
The Bio-concentration factor (BCF) was assessed to determine whether trees can be classified as metal accumulators. The degree of chemicals absorbed from the environment in plant organs was evaluated as the metal concentration in a specific plant organ (bark, needles) at sampling time (Cp) reported to litter concentration (Cs) in mg/kg (Equation (1)).
B C F = C p / C s  
The Geo-accumulation index (Igeo) is a measure used to evaluate the amount of HM contamination in soil (litter) samples (in our case, in the litter) that considers the natural diagenesis process [131]. The Igeo index was calculated according to Equation (2).
I g e o = l o g 2   ( C n / 1.5 × B n )  
where Cn represents the concentration of metal in the soil (litter) (mg/kg), Bn represents the geochemical background, and 1.5 is a constant used to correct potential variation in the baseline data.
The Contamination factor (Cf) is a measure to evaluate the contamination status of metals in the litter based on their measured concentration and a background value [132].
C f = C m s a m p l e / C m b a c k g r o u n d
where the Cm sample is the metal concentration in soil (litter), and the Cm background represents the metal amount from a natural reference considered naturally occurring in the continental crust.
The pollution load index (PLI) is a measure for evaluating the potential magnitude of heavy metal contamination in soil (litter) and was assessed using Equation (4) [133]. The PLI documents the contribution of each HM to regional pollution and can reflect temporal and spatial changes.
P L I = ( C F 1 × C F 2 × C F 3 × C F n ) 1 / n
The Nemerow pollution index (PINemerow) is a weighted multi-factor index that evaluates the quality of an environment by considering extreme values compared with the criteria imposed (Equation (5)).
P N = ( ( P 1 ) 2 + P i m a x 2 ) / 2  
P 1 = 1 n i = n n P i
where PN is the comprehensive pollution index of the sample, Pimax represents the maximum value of a single-value pollution index of the contaminants, and P1 is the average value of the single-factor index (Equation (6)).
The potential ecological risk (PERI) was used as a diagnostic tool for the HM concentration in the air deposition resulting from anthropogenic activities due to increasing elemental concentration in the litter and vegetation organs, which could threaten ecosystem health and functions. The integrated risk index is a concept that accumulates heavy metal characteristics, environmental behavior, and possible toxicological effects using an equivalent property index grading method [10,134]. The potential ecological risk index of a single element and for multiple elements was calculated using Equations (7)–(9).
C f i = C s i / C n i
E r i = T r i x C f i
R I = i = 1 n E r i
where C f i represents the pollution coefficient of a single element, C s i is the value of litter heavy metal, C n i is the background level, E r i is ecological risk, and T r i is the toxic response factor for a single element, which accounts for toxicity and sensitivity requirements.

5. Conclusions

We investigated the contamination level, altitudinal distribution, sources, and ecological hazards of heavy metals derived from air pollution and deposition in the “Cozia Mountains”, southern Romania. Overall, heavy metals originating from anthropogenic sources showed extremely high levels in needles compared to bark and litter. We used 206/207Pb and 87/86Sr isotopic fingerprints to document the origins of contaminants. Altitudinal trends were not observed, but evident changes in metal concentration around 1000 m, which varied between needles, bark, and litter, can be related to the transport and deposition by large atmospheric air masses. The results indicate that the Fe, Mn, Zn, and Cu levels exceed the recommended thresholds, which could negatively impact environmental health and interfere with essential elements such as K. Also, we observed that the Ca/Mg and Ca/K ratios were negatively correlated with As content in needles. Norway spruce can bioaccumulate high concentrations of Fe, Zn, Cu, Ni, and Cr in needles and bark, which is why it can be used for bioremediation strategies. The litter was classified as unpolluted to considerably contaminated, and at 907, 950, and 1310 m altitude, the ecological risk is considerable due to Cd pollution. Our results documented that contamination levels of long-range atmospheric deposition are detected and may affect the functioning of forest ecosystems.

Supplementary Materials

The following supporting information can be downloaded at: https://www.mdpi.com/article/10.3390/plants14060968/s1, Figure S1: The trends of nutrients in relationship with altitude; Figure S2: The trends of non-toxic metals in relationship with altitude; Figure S3: The trends of toxic metals in relation to altitude; Table S1. Criteria for interpreting health risks indices.

Author Contributions

Conceptualization, C.N. and A.M.I.; methodology, C.N.; software, C.N.; validation, A.M.I., C.S., R.Z. and C.R.; formal analysis, C.N.; investigation, C.N.; resources, A.M.I.; data curation, A.M.I., C.S., R.Z. and C.R.; writing—original draft preparation, C.N.; writing—review and editing, C.N. and J.J.C.; visualization, C.N.; supervision, J.J.C.; project administration, A.M.I.; funding acquisition, A.M.I. All authors have read and agreed to the published version of the manuscript.

Funding

This research was funded under contract no. 20N/2023, Project PN23150302, titled “Development of Innovative Technology for Lithium Isotopes Separation through Electromobility and Artificial Intelligence Algorithms”, financed by the Romanian Ministry of Research, Innovation, and Digitalization.

Data Availability Statement

Data are contained within the article and Supplementary Materials.

Acknowledgments

The work has been conducted under the NUCLEU Program-Financing Contract no. 20N/2023, Project PN 23 15 03 02—“Development of innovative technology for the Lithium isotopes separation through electromobility and artificial intelligence algorithms”, financed by the Romanian Ministry of Research, Innovation, and Digitalization and by the grants of the Romanian National Authority for Scientific Research and Innovation. C.N. extends gratitude for the support provided through Contract No. FORCLIMSOC 2023–2026, Projects PN 23090202 and 502 PN 23090302.

Conflicts of Interest

The authors declare no conflicts of interest.

References

  1. Rajkumar, M.; Prasad, M.N.V.; Swaminathan, S.; Freitas, H. Climate change driven plant–metal–microbe interactions. Environ. Int. 2013, 53, 74–86. [Google Scholar] [CrossRef] [PubMed]
  2. Nechita, C.; Iordache, A.M.; Lemr, K.; Levanič, T.; Pluhacek, T. Evidence of declining trees resilience under long term heavy metal stress combined with climate change heating. J. Clean. Prod. 2021, 317, 128428. [Google Scholar] [CrossRef]
  3. Méndez-López, M.; Gómez-Armesto, A.; Eimil-Fraga, C.; Alonso-Vega, F.; Rodríguez-Soalleiro, R.; Álvarez-Rodríguez, E.; Arias-Estévez, M.; Nóvoa-Muñoz, J.C. Needle age and precipitation as drivers of Hg accumulation and deposition in coniferous forests from a southwestern European Atlantic region. Environ. Res. 2022, 215, 114223. [Google Scholar] [CrossRef] [PubMed]
  4. Ershov, V.; Sukhareva, T.; Isaeva, L.; Ivanova, E.; Urbanavichus, G. Pollution-Induced Changes in the Composition of Atmospheric Deposition and Soil Waters in Coniferous Forests at the Northern Tree Line. Sustainability 2022, 14, 15580. [Google Scholar] [CrossRef]
  5. Iordache, A.M.; Nechita, C.; Voica, C.; Pluháček, T.; Schug, K.A. Climate change extreme and seasonal toxic metal occurrence in Romanian freshwaters in the last two decades—Case study and critical review. npj Clean Water 2022, 5, 2. [Google Scholar] [CrossRef]
  6. Lorenz, M.; Brunke, M. Trends of nutrients and metals in precipitation in northern Germany: The role of emissions and meteorology. Environ. Monit. Assess. 2021, 193, 325. [Google Scholar] [CrossRef]
  7. Urrutia-Pereira, M.; Varanda Rizzo, L.; Latour Staffeld, P.; Chong-Neto, H.J.; Viegi, G.; Solé, D. Dust from the Sahara to the American Continent: Health impacts: Dust from Sahara. Allergol. Et Immunopathol. 2021, 49, 187–194. [Google Scholar] [CrossRef]
  8. Abás, E.; Marina-Montes, C.; Laguna, M.; Lasheras, R.; Rivas, P.; Peribáñez, P.; del Valle, J.; Escudero, M.; Velásquez, A.; Cáceres, J.O.; et al. Evidence of human impact in Antarctic region by studying atmospheric aerosols. Chemosphere 2022, 307, 135706. [Google Scholar] [CrossRef]
  9. Byrne, A. Trouble in the air: Recent developments under the 1979 Convention on Long-Range Transboundary Air Pollution. Rev. Eur. Comp. Int. Environ. Law 2017, 26, 210–219. [Google Scholar] [CrossRef]
  10. Luo, H.; Wang, Q.; Guan, Q.; Ma, Y.; Ni, F.; Yang, E.; Zhang, J. Heavy metal pollution levels, source apportionment and risk assessment in dust storms in key cities in Northwest China. J. Hazard. Mater. 2022, 422, 126878. [Google Scholar] [CrossRef]
  11. Salazar-Rojas, T.; Cejudo-Ruiz, F.R.; Calvo-Brenes, G. Magnetic and Chemical Testing in Plants, Road Dust and Soil, as Indicators of Atmospheric Pollution. Water Air Soil Pollut. 2024, 235, 601. [Google Scholar] [CrossRef]
  12. Chen, L.-C.; Maciejczyk, P.; Thurston, G.D. Chapter 6—Metals and air pollution. In Handbook on the Toxicology of Metals, 5th ed.; Nordberg, G.F., Costa, M., Eds.; Academic Press: Cambridge, MA, USA, 2022; pp. 137–182. [Google Scholar]
  13. Mirzaei Aminiyan, M.; Baalousha, M.; Mousavi, R.; Mirzaei Aminiyan, F.; Hosseini, H.; Heydariyan, A. The ecological risk, source identification, and pollution assessment of heavy metals in road dust: A case study in Rafsanjan, SE Iran. Environ. Sci. Pollut. Res. 2018, 25, 13382–13395. [Google Scholar] [CrossRef] [PubMed]
  14. Vareda, J.P.; Valente, A.J.M.; Durães, L. Assessment of heavy metal pollution from anthropogenic activities and remediation strategies: A review. J. Environ. Manag. 2019, 246, 101–118. [Google Scholar] [CrossRef]
  15. Cong, Y.; Yu, R.-l.; Yan, Y.; Weng, B.-S.; Hu, G.-R.; Sun, J.-W.; Cui, J.-Y.; Huang, Y.-Y. Source analysis of metals in the tea plant using linear correlation analysis combined with a lead-strontium isotope tracer. Catena 2023, 229, 107194. [Google Scholar] [CrossRef]
  16. Novak, M.; Holmden, C.; Farkaš, J.; Kram, P.; Hruska, J.; Curik, J.; Veselovsky, F.; Stepanova, M.; Kochergina, Y.V.; Erban, V.; et al. Calcium and strontium isotope dynamics in three polluted forest ecosystems of the Czech Republic, Central Europe. Chem. Geol. 2020, 536, 119472. [Google Scholar] [CrossRef]
  17. Cong, L.; Zhou, S.; Niyogi, D.; Wu, Y.; Yan, G.; Dai, L.; Liu, S.; Zhang, Z.; Hu, Y. Concentrations and isotopic analysis for the sources and transfer of lead in an urban atmosphere-plant-soil system. J. Environ. Manag. 2022, 311, 114771. [Google Scholar] [CrossRef]
  18. Zaynab, M.; Al-Yahyai, R.; Ameen, A.; Sharif, Y.; Ali, L.; Fatima, M.; Khan, K.A.; Li, S. Health and environmental effects of heavy metals. J. King Saud Univ. Sci. 2022, 34, 101653. [Google Scholar] [CrossRef]
  19. Remick, K.A.; Helmann, J.D. Chapter One—The elements of life: A biocentric tour of the periodic table. In Advances in Microbial Physiology; Poole, R.K., Kelly, D.J., Eds.; Academic Press: Cambridge, MA, USA, 2023; Volume 82, pp. 1–127. [Google Scholar]
  20. Huang, D.; Gong, X.; Liu, Y.; Zeng, G.; Lai, C.; Bashir, H.; Zhou, L.; Wang, D.; Xu, P.; Cheng, M.; et al. Effects of calcium at toxic concentrations of cadmium in plants. Planta 2017, 245, 863–873. [Google Scholar] [CrossRef]
  21. Brown, P.H.; Zhao, F.-J.; Dobermann, A. What is a plant nutrient? Changing definitions to advance science and innovation in plant nutrition. Plant Soil 2022, 476, 11–23. [Google Scholar] [CrossRef]
  22. Marschner, H. Functions of Mineral Nutrients: Micronutrients, 2nd ed.; Academic Press: London, UK, 1995. [Google Scholar]
  23. Subbarao, G.V.; Ito, O.; Berry, W.L.; Wheeler, R.M. Sodium—A Functional Plant Nutrient. Crit. Rev. Plant Sci. 2003, 22, 391–416. [Google Scholar] [CrossRef]
  24. Marschner, H. Marschner’s Mineral Nutrition of Higher Plants, 3rd ed.; Academic Press: Amsterdam, The Netherlands, 2011. [Google Scholar]
  25. Afanaseva, L.V.; Kalugina, O.V.; Kharpukhaeva, T.M. Elemental Chemical Composition of the Larix Sibirica Needles in the Predbaikalia. Russ. J. Bioorganic Chem. 2024, 50, 2818–2825. [Google Scholar] [CrossRef]
  26. Zhang, K.; Cheng, X.; Dang, H.; Zhang, Q. Biomass:N:K:Ca:Mg:P ratios in forest stands world-wide: Biogeographical variations and environmental controls. Glob. Ecol. Biogeogr. 2020, 29, 2176–2189. [Google Scholar] [CrossRef]
  27. Gao, Y.; Yuan, Y.; Li, Q.; Kou, L.; Fu, X.; Dai, X.; Wang, H. Mycorrhizal type governs foliar and root multi-elemental stoichiometries of trees mainly via root traits. Plant Soil 2021, 460, 229–246. [Google Scholar] [CrossRef]
  28. Li, Y.; Chen, X.; Dong, Y.; Wei, S.; Zeng, M.; Jiao, R. Response strategies of slash pine (Pinus elliottii) to cadmium stress and the gain effects of inoculation with Herbaspirillum sp. YTG72 in alleviating phytotoxicity and enhancing accumulation of cadmium. Environ. Sci. Pollut. Res. 2024, 31, 31590–31604. [Google Scholar] [CrossRef]
  29. Kubov, M.; Schieber, B.; Janík, R. Seasonal dynamics of macronutrients in aboveground biomass of two herb-layer species in a beech forest. Biologia 2019, 74, 1415–1424. [Google Scholar] [CrossRef]
  30. Turkyilmaz, A.; Sevik, H.; Cetin, M. The use of perennial needles as biomonitors for recently accumulated heavy metals. Landsc. Ecol. Eng. 2018, 14, 115–120. [Google Scholar] [CrossRef]
  31. Cocozza, C.; Ravera, S.; Cherubini, P.; Lombardi, F.; Marchetti, M.; Tognetti, R. Integrated biomonitoring of airborne pollutants over space and time using tree rings, bark, leaves and epiphytic lichens. Urban For. Urban Green. 2016, 17, 177–191. [Google Scholar] [CrossRef]
  32. Alahabadi, A.; Ehrampoush, M.H.; Miri, M.; Ebrahimi Aval, H.; Yousefzadeh, S.; Ghaffari, H.R.; Ahmadi, E.; Talebi, P.; Abaszadeh Fathabadi, Z.; Babai, F.; et al. A comparative study on capability of different tree species in accumulating heavy metals from soil and ambient air. Chemosphere 2017, 172, 459–467. [Google Scholar] [CrossRef]
  33. Sevik, H.; Cetin, M.; Ozturk, A.; Ozel, H.; Pinar, B. Changes in Pb, Cr and Cu concentrations in some bioindicators depending on traffic density on the basis of species and organs. Appl. Ecol. Environ. Res. 2019, 17, 12843–12857. [Google Scholar] [CrossRef]
  34. Iordache, A.M.; Nechita, C.; Pluhacek, T.; Iordache, M.; Zgavarogea, R.; Ionete, R.E. Past and present anthropic environmental stress reflect high susceptibility of natural freshwater ecosystems in Romania. Environ. Pollut. 2020, 267, 115505. [Google Scholar] [CrossRef]
  35. Jeong, H.; Choi, J.Y.; Lee, J.; Lim, J.; Ra, K. Heavy metal pollution by road-deposited sediments and its contribution to total suspended solids in rainfall runoff from intensive industrial areas. Environ. Pollut. 2020, 265, 115028. [Google Scholar] [CrossRef] [PubMed]
  36. Ali, H.; Khan, E.; Ilahi, I. Environmental Chemistry and Ecotoxicology of Hazardous Heavy Metals: Environmental Persistence, Toxicity, and Bioaccumulation. J. Chem. 2019, 2019, 6730305. [Google Scholar] [CrossRef]
  37. Davidson, C.I.; Grimm, T.C.; Nasta, M.A. Airborne Lead and Other Elements Derived from Local Fires in the Himalayas. Science 1981, 214, 1344–1346. [Google Scholar] [CrossRef]
  38. Cong, Z.; Kang, S.; Dong, S.; Liu, X.; Qin, D. Elemental and individual particle analysis of atmospheric aerosols from high Himalayas. Environ. Monit. Assess. 2010, 160, 323–335. [Google Scholar] [CrossRef]
  39. Ciarkowska, K.; Miechówka, A. Identification of the factors determining the concentration and spatial distribution of Zn, Pb and Cd in the soils of the non-forest Tatra Mountains (southern Poland). Environ. Geochem. Health 2022, 44, 4323–4341. [Google Scholar] [CrossRef]
  40. He, X.; Liu, P.; Zhao, W.; Xu, H.; Zhang, R.; Shen, Z. Size distribution of water-soluble metals in atmospheric particles in Xi’an, China: Seasonal variations, bioavailability, and health risk assessment. Atmos. Pollut. Res. 2021, 12, 101090. [Google Scholar] [CrossRef]
  41. Morselli, L.; Olivieri, P.; Brusori, B.; Passarini, F. Soluble and insoluble fractions of heavy metals in wet and dry atmospheric depositions in Bologna, Italy. Environ. Pollut. 2003, 124, 457–469. [Google Scholar] [CrossRef]
  42. Pulatoglu, A.O.; Koç, İ.; Özel, H.B.; Şevik, H.; Yıldız, Y. Using trees to monitor airborne Cr pollution: Effects of compass direction and woody species on Cr uptake during phytoremediation. BioResources 2025, 20, 121–139. [Google Scholar] [CrossRef]
  43. Zeren Çetin, İ. Used in Urban Area for Landscape Planning and Design Spatial and Temporal Variations in Chromium (Cr) Concentrations in Picea orientalis L. Turk. J. Agric. Food Sci. Technol. 2024, 12, 1730–1738. [Google Scholar] [CrossRef]
  44. Zhu, X.; Yu, W.; Li, F.; Liu, C.; Ma, J.; Yan, J.; Wang, Y.; Tian, R. Spatio-temporal distribution and source identification of heavy metals in particle size fractions of road dust from a typical industrial district. Sci. Total Environ. 2021, 780, 146357. [Google Scholar] [CrossRef]
  45. Popović, V.; Šešlija Jovanović, D.; Miletić, Z.; Milovanović, J.; Lučić, A.; Rakonjac, L.; Miljković, D. The evaluation of hazardous element content in the needles of the Norway spruce (Picea abies L.) that originated from anthropogenic activities in the vicinity of the native habitats. Environ. Monit. Assess. 2022, 195, 109. [Google Scholar] [CrossRef] [PubMed]
  46. Miranda, I.; Gominho, J.; Mirra, I.; Pereira, H. Chemical characterization of barks from Picea abies and Pinus sylvestris after fractioning into different particle sizes. Ind. Crops Prod. 2012, 36, 395–400. [Google Scholar] [CrossRef]
  47. Rothpfeffer, C.; Karltun, E. Inorganic elements in tree compartments of Picea abies—Concentrations versus stem diameter in wood and bark and concentrations in needles and branches. Biomass Bioenergy 2007, 31, 717–725. [Google Scholar] [CrossRef]
  48. Kuang, Y.W.; Wen, D.Z.; Zhou, G.; Liu, S.Z. Distribution of elements in needles of Pinus massoniana (Lamb.) was uneven and affected by needle age. Environ. Pollut. 2007, 145, 730–737. [Google Scholar] [CrossRef]
  49. Giertych, M.J.; de Temmerman, L.O.; Rachwal, L. Distribution of elements along the length of Scots pine needles in a heavily polluted and a control environment. Tree Physiol. 1997, 17, 697–703. [Google Scholar] [CrossRef]
  50. White, P.J.; Brown, P.H. Plant nutrition for sustainable development and global health. Ann. Bot. 2010, 105, 1073–1080. [Google Scholar] [CrossRef]
  51. Brække, F.H.; Salih, N. Reliability of foliar analyses of Norway spruce stands in a Nordic gradient. Silva Fenn. 2002, 36, 489–504. [Google Scholar] [CrossRef]
  52. Wallander, H.; Thelin, G. The stimulating effect of apatite on ectomycorrhizal growth diminishes after PK fertilization. Soil Biol. Biochem. 2008, 40, 2517–2522. [Google Scholar] [CrossRef]
  53. Högberg, P.; Johannisson, C.; Yarwood, S.; Callesen, I.; Näsholm, T.; Myrold, D.D.; Högberg, M.N. Recovery of ectomycorrhiza after ‘nitrogen saturation’ of a conifer forest. New Phytol. 2011, 189, 515–525. [Google Scholar] [CrossRef]
  54. Novotný, R.; Fadrhonsová, V.; Šrámek, V. Long-Term Monitored Norway Spruce Plots in the Ore Mountains—30 Years of Changes in Forest Health, Soil Chemistry and Tree Nutrition After Air Pollution Calamity. Plants 2024, 13, 2379. [Google Scholar] [CrossRef]
  55. Zethof, J.H.T.; Julich, S.; Feger, K.-H.; Julich, D. Legacy effect of 25 years reduced atmospheric sulphur deposition on spruce tree nutrition. J. Plant Nutr. Soil Sci. 2024, 187, 834–843. [Google Scholar] [CrossRef]
  56. Jiao, C.; Zhang, J.; Yu, H.; He, N. Variation of magnesium drives plant adaption to heterogeneous environments by regulating efficiency in photosynthesis on a large scale. J. Ecol. 2024, 112, 2758–2770. [Google Scholar] [CrossRef]
  57. Erdem, R.; Koç, İ.; Çobanoglu, H.; Şevik, H. Variation of Magnesium, One of the Macronutrients, in Some Trees Based on Organs and Species. Forestist 2024, 74, 84–93. [Google Scholar] [CrossRef]
  58. Amirmohammadi, M.; Khademi, H.; Ayoubi, S.; Faz, A. Pine needles as bioindicator and biomagnetic indicator of selected metals in the street dust, a case study from southeastern Iran. Chemosphere 2024, 352, 141281. [Google Scholar] [CrossRef]
  59. Zsigmond, A.R.; Száraz, A.; Urák, I. Macro and trace elements in the black pine needles as inorganic indicators of urban traffic emissions. Environ. Pollut. 2021, 291, 118228. [Google Scholar] [CrossRef]
  60. Figas, A.; Siwik-Ziomek, A.; Kobierski, M. Heavy Metals and Sulphur in Needles of Pinus sylvestris L. and Soil in the Forests of City Agglomeration. Forests 2021, 12, 1310. [Google Scholar] [CrossRef]
  61. Ivanova, E.A.; Lukina, N.V.; Smirnov, V.E.; Isaeva, L.G. Effect of Industrial Airborne Pollution on the Chemical Composition of Pine Needle Litterfall at the Northern Distribution Limit of Pine Forests. Contemp. Probl. Ecol. 2022, 15, 851–862. [Google Scholar] [CrossRef]
  62. Parzych, A.; Mochnacky, S.; Sobisz, Z.; Polláková, N.; Šimanský, V. Needles and bark of Picea abies (L.) H. Karst and Picea omorika (Panciç) Purk. as bioindicators of environmental quality. Folia For. Pol. Ser. A For. 2018, 60, 230–240. [Google Scholar] [CrossRef]
  63. Konieczyński, P.; Moszczyński, J.; Wesołowski, M. Comparison of Fe, Zn, Mn, Cu, Cd and Pb concentration in spruce needles collected in the area of Gdansk and Gdynia in northern Poland. Environ. Prot. Nat. Resour 2018, 78, 1–9. [Google Scholar] [CrossRef]
  64. Schmidt, S.B.; Husted, S. The Biochemical Properties of Manganese in Plants. Plants 2019, 8, 381. [Google Scholar] [CrossRef]
  65. Kabata-Pendias, A. Trace Elements in Soils and Plants, 3rd ed.; Kabata-Pendias, A., Ed.; CRC Press: Boca Raton, FL, USA, 2000. [Google Scholar]
  66. Jonczak, J.; Sut-Lohmann, M.; Polláková, N.; Parzych, A.; Šimanský, V.; Donovan, S. Bioaccumulation of Potentially Toxic Elements by the Needles of Eleven Pine Species in Low Polluted Area. Water Air Soil Pollut. 2021, 232, 28. [Google Scholar] [CrossRef]
  67. Świercz, A.; Świątek, B.; Pietrzykowski, M. Changes in the Concentrations of Trace Elements and Supply of Nutrients to Silver Fir (Abies alba Mill.) Needles as a Bioindicator of Industrial Pressure over the Past 30 Years in Świętokrzyski National Park (Southern Poland). Forests 2022, 13, 718. [Google Scholar] [CrossRef]
  68. Erdyneeva, S.A.; Shiretorova, V.G.; Radnaeva, L.D. Distinctive features of heavy metals’ accumulation in coniferous trees in Buryatia, Russia. IOP Conf. Ser. Earth Environ. Sci. 2019, 320, 012021. [Google Scholar] [CrossRef]
  69. Zeiner, M.; Juranović Cindrić, I. Accumulation of Major, Minor and Trace Elements in Pine Needles (Pinus nigra) in Vienna (Austria). Molecules 2021, 26, 3318. [Google Scholar] [CrossRef]
  70. Umair Hassan, M.; Aamer, M.; Umer Chattha, M.; Haiying, T.; Shahzad, B.; Barbanti, L.; Nawaz, M.; Rasheed, A.; Afzal, A.; Liu, Y.; et al. The Critical Role of Zinc in Plants Facing the Drought Stress. Agriculture 2020, 10, 396. [Google Scholar] [CrossRef]
  71. Kaur, H.; Garg, N. Zinc toxicity in plants: A review. Planta 2021, 253, 129. [Google Scholar] [CrossRef]
  72. Tatuśko-Krygier, N.; Diatta, J.; Chudzińska, E.; Waraczewska, Z.; Gawroński, D.; Youssef, N. Bioactive levels of Zn, Pb, Cu, Cd and Mg, Fe in pollution sensitive and tolerant Scots pines needles—Is survival mineral-dependent? Ecol. Indic. 2023, 146, 109751. [Google Scholar] [CrossRef]
  73. Pongrac, P.; Vogel-Mikuš, K.; Regvar, M.; Kaligarič, M.; Vavpetič, P.; Kelemen, M.; Grlj, N.; Shelef, O.; Golan-Goldhirsh, A.; Rachmilevitch, S.; et al. On the distribution and evaluation of Na, Mg and Cl in leaves of selected halophytes. Nucl. Instrum. Methods Phys. Res. Sect. B Beam Interact. Mater. At. 2013, 306, 144–149. [Google Scholar] [CrossRef]
  74. Sulhan, O.F.; Sevik, H.; Isinkaralar, K. Assessment of Cr and Zn deposition on Picea pungens Engelm. in urban air of Ankara, Türkiye. Environ. Dev. Sustain. 2023, 25, 4365–4384. [Google Scholar] [CrossRef]
  75. Chen, G.; Li, J.; Han, H.; Du, R.; Wang, X. Physiological and Molecular Mechanisms of Plant Responses to Copper Stress. Int. J. Mol. Sci. 2022, 23, 12950. [Google Scholar] [CrossRef]
  76. Aznar, J.C.; Richer-Laflèche, M.; Bégin, C.; Bégin, Y. Lead Exclusion and Copper Translocation in Black Spruce Needles. Water Air Soil Pollut. 2009, 203, 139–145. [Google Scholar] [CrossRef]
  77. Solgi, E.; Keramaty, M.; Solgi, M. Biomonitoring of airborne Cu, Pb, and Zn in an urban area employing a broad leaved and a conifer tree species. J. Geochem. Explor. 2020, 208, 106400. [Google Scholar] [CrossRef]
  78. Vladimirovna Afanasyeva, L.; Ayushievna Ayushina, T. Accumulation of heavy metals and biochemical responses in Siberian larch needles in urban area. Ecotoxicology 2019, 28, 578–588. [Google Scholar] [CrossRef] [PubMed]
  79. Heinrichs, H.; Schulz-Dobrick, B.; Wedepohl, K. Terrestrial geochemistry of Cd, Bi, Tl, Pb, Zn and Rb. Geochim. Cosmochim. Acta 1980, 44, 1519–1533. [Google Scholar] [CrossRef]
  80. Dytłow, S.; Górka-Kostrubiec, B. Concentration of heavy metals in street dust: An implication of using different geochemical background data in estimating the level of heavy metal pollution. Environ. Geochem. Health 2021, 43, 521–535. [Google Scholar] [CrossRef]
  81. Aral, H.; Vecchio-Sadus, A. Toxicity of lithium to humans and the environment—A literature review. Ecotoxicol. Environ. Saf. 2008, 70, 349–356. [Google Scholar] [CrossRef]
  82. Rodushkin, I.; Pallavicini, N.; Engström, E.; Sörlin, D.; Öhlander, B.; Ingri, J.; Baxter, D.C. Assessment of the natural variability of B, Cd, Cu, Fe, Pb, Sr, Tl and Zn concentrations and isotopic compositions in leaves, needles and mushrooms using single sample digestion and two-column matrix separation. J. Anal. At. Spectrom. 2016, 31, 220–233. [Google Scholar] [CrossRef]
  83. Wyttenbach, A.; Tobler, L. The seasonal variation of 20 elements in 1st and 2nd year needles of Norway spruce, Picea abies (L.) Karst. Trees 1988, 2, 52–64. [Google Scholar] [CrossRef]
  84. Belykh, O.A.; Chuparina, E.V.; Mokryy, A.V. Elemental Composition of Needles of the Family Pinaceae in the Territory with Accumulated Environmental Damage, Southern Baikal Region. Russ. J. Gen. Chem. 2020, 90, 2622–2626. [Google Scholar] [CrossRef]
  85. Burger, A.; Lichtscheidl, I. Strontium in the environment: Review about reactions of plants towards stable and radioactive strontium isotopes. Sci. Total Environ. 2019, 653, 1458–1512. [Google Scholar] [CrossRef]
  86. Pongrac, P.; Baltrenaite, E.; Vavpetič, P.; Kelemen, M.; Kladnik, A.; Budič, B.; Vogel-Mikuš, K.; Regvar, M.; Baltrenas, P.; Pelicon, P. Tissue-specific element profiles in Scots pine (Pinus sylvestris L.) needles. Trees 2019, 33, 91–101. [Google Scholar] [CrossRef]
  87. Srivastava, D.; Tiwari, M.; Dutta, P.; Singh, P.; Chawda, K.; Kumari, M.; Chakrabarty, D. Chromium Stress in Plants: Toxicity, Tolerance and Phytoremediation. Sustainability 2021, 13, 4629. [Google Scholar] [CrossRef]
  88. Ali, S.; Mir, R.A.; Tyagi, A.; Manzar, N.; Kashyap, A.S.; Mushtaq, M.; Raina, A.; Park, S.; Sharma, S.; Mir, Z.A.; et al. Chromium Toxicity in Plants: Signaling, Mitigation, and Future Perspectives. Plants 2023, 12, 1502. [Google Scholar] [CrossRef] [PubMed]
  89. Zulfiqar, U.; Haider, F.U.; Ahmad, M.; Hussain, S.; Maqsood, M.F.; Ishfaq, M.; Shahzad, B.; Waqas, M.M.; Ali, B.; Tayyab, M.N.; et al. Chromium toxicity, speciation, and remediation strategies in soil-plant interface: A critical review. Front. Plant Sci. 2023, 13, 1081624. [Google Scholar] [CrossRef]
  90. Shahzad, B.; Tanveer, M.; Hassan, W.; Shah, A.N.; Anjum, S.A.; Cheema, S.A.; Ali, I. Lithium toxicity in plants: Reasons, mechanisms and remediation possibilities—A review. Plant Physiol. Biochem. 2016, 107, 104–115. [Google Scholar] [CrossRef]
  91. Leung, D.W.M.; Prendergast, P.J. Physiological Responses of Plants to Environmental Lithium Pollution. In Lithium and Nickel Contamination in Plants and the Environment; World Scientific Series on Advances in Environmental Pollution Management; World Scientific: Singapore, 2023; Volume 1, pp. 49–62. [Google Scholar]
  92. Kuloğlu, S.S.; Yalçin, E.; Çavuşoğlu, K.; Acar, A. Dose-dependent toxicity profile and genotoxicity mechanism of lithium carbonate. Sci. Rep. 2022, 12, 13504. [Google Scholar] [CrossRef]
  93. Neves, O.; Moreno, F.; Pinheiro, D.; Pinto, M.C.; Inácio, M. Soil low-density geochemical mapping of technology-critical elements (TCEs) and its environmental implications: The case of lithium in Portugal. Sci. Total Environ. 2024, 934, 173207. [Google Scholar] [CrossRef]
  94. Cetin, M.; Sevik, H.; Cobanoglu, O. Ca, Cu, and Li in washed and unwashed specimens of needles, bark, and branches of the blue spruce (Picea pungens) in the city of Ankara. Environ. Sci. Pollut. Res. 2020, 27, 21816–21825. [Google Scholar] [CrossRef]
  95. Shin, J.H.; Yu, J.; Wang, L.; Kim, J.; Koh, S.-M. Investigation of Spectral Variation of Pine Needles as an Indicator of Arsenic Content in Soils. Minerals 2019, 9, 498. [Google Scholar] [CrossRef]
  96. Haider, F.U.; Liqun, C.; Coulter, J.A.; Cheema, S.A.; Wu, J.; Zhang, R.; Wenjun, M.; Farooq, M. Cadmium toxicity in plants: Impacts and remediation strategies. Ecotoxicol. Environ. Saf. 2021, 211, 111887. [Google Scholar] [CrossRef]
  97. Xu, Z.-M.; Li, Q.-S.; Yang, P.; Ye, H.-J.; Chen, Z.-S.; Guo, S.-H.; Wang, L.-L.; He, B.-Y.; Zeng, E.Y. Impact of osmoregulation on the differences in Cd accumulation between two contrasting edible amaranth cultivars grown on Cd-polluted saline soils. Environ. Pollut. 2017, 224, 89–97. [Google Scholar] [CrossRef] [PubMed]
  98. Luo, X.; Bing, H.; Luo, Z.; Wang, Y.; Jin, L. Impacts of atmospheric particulate matter pollution on environmental biogeochemistry of trace metals in soil-plant system: A review. Environ. Pollut. 2019, 255, 113138. [Google Scholar] [CrossRef] [PubMed]
  99. Pietrzykowski, M.; Woś, B.; Haus, N. Scots pine needles macronutrient (N, P, K, CA, MG, and S) supply at different reclaimed mine soil substrates--as an indicator of the stability of developed forest ecosystems. Environ. Monit. Assess. 2013, 185, 7445–7457. [Google Scholar] [CrossRef] [PubMed]
  100. Schiop, S.T.; Al Hassan, M.; Sestras, A.F.; Boscaiu, M.; Sestras, R.E.; Vicente, O. Identification of Salt Stress Biomarkers in Romanian Carpathian Populations of Picea abies (L.) Karst. PLoS ONE 2015, 10, e0135419. [Google Scholar] [CrossRef]
  101. Kopittke, P.M.; Menzies, N.W. A Review of the Use of the Basic Cation Saturation Ratio and the “Ideal” Soil. Soil Sci. Soc. Am. J. 2007, 71, 259–265. [Google Scholar] [CrossRef]
  102. Moore, P.A., Jr.; Miller, D.M. Decreasing Phosphorus Solubility in Poultry Litter with Aluminum, Calcium, and Iron Amendments. J. Environ. Qual. 1994, 23, 325–330. [Google Scholar] [CrossRef]
  103. Ribeiro, C.; Madeira, M.; Araújo, M.C. Decomposition and nutrient release from leaf litter of Eucalyptus globulus grown under different water and nutrient regimes. For. Ecol. Manag. 2002, 171, 31–41. [Google Scholar] [CrossRef]
  104. Benito, B.; Haro, R.; Amtmann, A.; Cuin, T.A.; Dreyer, I. The twins K+ and Na+ in plants. J. Plant Physiol. 2014, 171, 723–731. [Google Scholar] [CrossRef]
  105. Tränkner, M.; Tavakol, E.; Jákli, B. Functioning of potassium and magnesium in photosynthesis, photosynthate translocation and photoprotection. Physiol. Plant. 2018, 163, 414–431. [Google Scholar] [CrossRef]
  106. Jacek, O.; Peter, B.R.; Roma, Z.; Piotr, K.; Mark, G.T. Needle nutrients in geographically diverse Pinus sylvestris L. populations. Ann. For. Sci. 2002, 59, 1–18. [Google Scholar]
  107. Rodríguez-Ruiz, M.; Aparicio-Chacón, M.V.; Palma, J.M.; Corpas, F.J. Arsenate disrupts ion balance, sulfur and nitric oxide metabolisms in roots and leaves of pea (Pisum sativum L.) plants. Environ. Exp. Bot. 2019, 161, 143–156. [Google Scholar] [CrossRef]
  108. Abbas, G.; Murtaza, B.; Bibi, I.; Shahid, M.; Niazi, N.K.; Khan, M.I.; Amjad, M.; Hussain, M.; Natasha, N. Arsenic Uptake, Toxicity, Detoxification, and Speciation in Plants: Physiological, Biochemical, and Molecular Aspects. Int. J. Environ. Res. Public Health 2018, 15, 59. [Google Scholar] [CrossRef] [PubMed]
  109. Yue, K.; Yang, W.; Tan, B.; Peng, Y.; Huang, C.; Xu, Z.; Ni, X.; Yang, Y.; Zhou, W.; Zhang, L.; et al. Immobilization of heavy metals during aquatic and terrestrial litter decomposition in an alpine forest. Chemosphere 2019, 216, 419–427. [Google Scholar] [CrossRef] [PubMed]
  110. Pogge von Strandmann, P.A.E.; Burton, K.W.; Opfergelt, S.; Genson, B.; Guicharnaud, R.A.; Gislason, S.R. The lithium isotope response to the variable weathering of soils in Iceland. Geochim. Cosmochim. Acta 2021, 313, 55–73. [Google Scholar] [CrossRef]
  111. Iordache, A.M.; Voica, C.; Roba, C.; Nechita, C. Evaluation of potential human health risks associated with Li and their relationship with Na, K, Mg, and Ca in Romania’s nationwide drinking water. Front. Public Health 2024, 12, 1456640. [Google Scholar] [CrossRef]
  112. Penniston-Dorland, S.; Liu, X.-M.; Rudnick, R.L. Lithium Isotope Geochemistry. Rev. Mineral. Geochem. 2017, 82, 165–217. [Google Scholar] [CrossRef]
  113. Pogge von Strandmann, P.A.E.; Fraser, W.T.; Hammond, S.J.; Tarbuck, G.; Wood, I.G.; Oelkers, E.H.; Murphy, M.J. Experimental determination of Li isotope behaviour during basalt weathering. Chem. Geol. 2019, 517, 34–43. [Google Scholar] [CrossRef]
  114. von Strandmann, P.A.E.P.; Kasemann, S.A.; Wimpenny, J.B. Lithium and Lithium Isotopes in Earth’s Surface Cycles. Elements 2020, 16, 253–258. [Google Scholar] [CrossRef]
  115. Li, W.; Liu, X.-M.; Chadwick, O.A. Lithium isotope behavior in Hawaiian regoliths: Soil-atmosphere-biosphere exchanges. Geochim. Cosmochim. Acta 2020, 285, 175–192. [Google Scholar] [CrossRef]
  116. Kang, H.; Liu, X.; Guo, J.; Wang, B.; Xu, G.; Wu, G.; Kang, S.; Huang, J. Characterization of mercury concentration from soils to needle and tree rings of Schrenk spruce (Picea schrenkiana) of the middle Tianshan Mountains, northwestern China. Ecol. Indic. 2019, 104, 24–31. [Google Scholar] [CrossRef]
  117. Erdem, R.; Aricak, B.; Cetin, M.; Sevik, H. Change in some heavy metal concentrations in forest trees by species, organ, and soil depth. Forestist 2023, 73, 257–263. [Google Scholar] [CrossRef]
  118. Çomaklı, E.; Bingöl, M.S. Heavy metal accumulation of urban Scots pine (Pinus sylvestris L.) plantation. Environ. Monit. Assess. 2021, 193, 192. [Google Scholar] [CrossRef]
  119. Isinkaralar, K.; Koç, İ.; Kuzmina, N.A.; Menshchikov, S.L.; Erdem, R.; Aricak, B. Determination of heavy metal levels using Betula pendula Roth. under various soil contamination in Southern Urals, Russia. Int. J. Environ. Sci. Technol. 2022, 19, 12593–12604. [Google Scholar] [CrossRef]
  120. Montoya, O.L.Q.; Niño-Ruiz, E.D.; Pinel, N. On the mathematical modelling and data assimilation for air pollution assessment in the Tropical Andes. Environ. Sci. Pollut. Res. 2020, 27, 35993–36012. [Google Scholar] [CrossRef] [PubMed]
  121. Wang, F.; Dong, W.; Zhao, Z.; Wang, H.; Li, W.; Chen, G.; Wang, F.; Zhao, Y.; Huang, J.; Zhou, T. Heavy metal pollution in urban river sediment of different urban functional areas and its influence on microbial community structure. Sci. Total Environ. 2021, 778, 146383. [Google Scholar] [CrossRef]
  122. Ma, S.; Qiao, L.; Liu, X.; Zhang, S.; Zhang, L.; Qiu, Z.; Yu, C. Microbial community succession in soils under long-term heavy metal stress from community diversity-structure to KEGG function pathways. Environ. Res. 2022, 214, 113822. [Google Scholar] [CrossRef]
  123. Wang, C.; Wang, Y.; Liu, P.; Sun, Y.; Song, Z.; Hu, X. Characteristics of bacterial community structure and function associated with nutrients and heavy metals in coastal aquaculture area. Environ. Pollut. 2021, 275, 116639. [Google Scholar] [CrossRef]
  124. Iordache, A.M.; Nechita, C.; Zgavarogea, R.; Voica, C.; Varlam, M.; Ionete, R.E. Accumulation and ecotoxicological risk assessment of heavy metals in surface sediments of the Olt River, Romania. Sci. Rep. 2022, 12, 880. [Google Scholar] [CrossRef]
  125. Harja, M.; Ciocinta, R.C.; Ondrasek, G.; Bucur, D.; Dirja, M. Accumulation of Heavy Metal Ions from Urban Soil in Spontaneous Flora. Water 2023, 15, 768. [Google Scholar] [CrossRef]
  126. Hoaghia, M.-A.; Cadar, O.; Moisa, C.; Roman, C.; Kovacs, E. Heavy metals and health risk assessment in vegetables grown in the vicinity of a former non-metallic facility located in Romania. Environ. Sci. Pollut. Res. 2022, 29, 40079–40093. [Google Scholar] [CrossRef]
  127. National Institute of Standards and Technology (NIST). Certificate of Analysis SRM 987 Strontium Isotopic Standard. Available online: https://www-s.nist.gov/srmors/certificates/987.pdf (accessed on 5 October 2024).
  128. National Institute of Standards and Technology (NIST). Certificate of Analysis SRM 981 Common Lead Isotopic Standard. Available online: https://www-s.nist.gov/srmors/certificates/981.pdf (accessed on 5 October 2024).
  129. Van Rossum, G.; Drake, F.L. Python 3 Reference Manual: (Python Documentation Manual Part 2). (CreateSpace Independent Publishing Platform, 2009); Centrum voor Wiskunde en Informatica: Amsterdam, The Netherlands, 1995; Volume 111. [Google Scholar]
  130. Pedregosa, F.; Varoquaux, G.; Gramfort, A.; Michel, V.; Thirion, B.; Grisel, O.; Blondel, M.; Prettenhofer, P.; Weiss, R.; Dubourg, V. Scikit-learn: Machine learning in Python. J. Mach. Learn. Res. 2011, 12, 2825–2830. [Google Scholar]
  131. Muller, G. Index of geoaccumulation in sediments of the Rhine River. Geo J. 1969, 2, 108–118. [Google Scholar]
  132. Hans Wedepohl, K. The composition of the continental crust. Geochim. Cosmochim. Acta 1995, 59, 1217–1232. [Google Scholar] [CrossRef]
  133. Tomlinson, D.L.; Wilson, J.G.; Harris, C.R.; Jeffrey, D.W. Problems in the assessment of heavy-metal levels in estuaries and the formation of a pollution index. Helgoländer Meeresunters 1980, 33, 566–575. [Google Scholar] [CrossRef]
  134. Hakanson, L. An ecological risk index for aquatic pollution control.a sedimentological approach. Water Res. 1980, 14, 975–1001. [Google Scholar] [CrossRef]
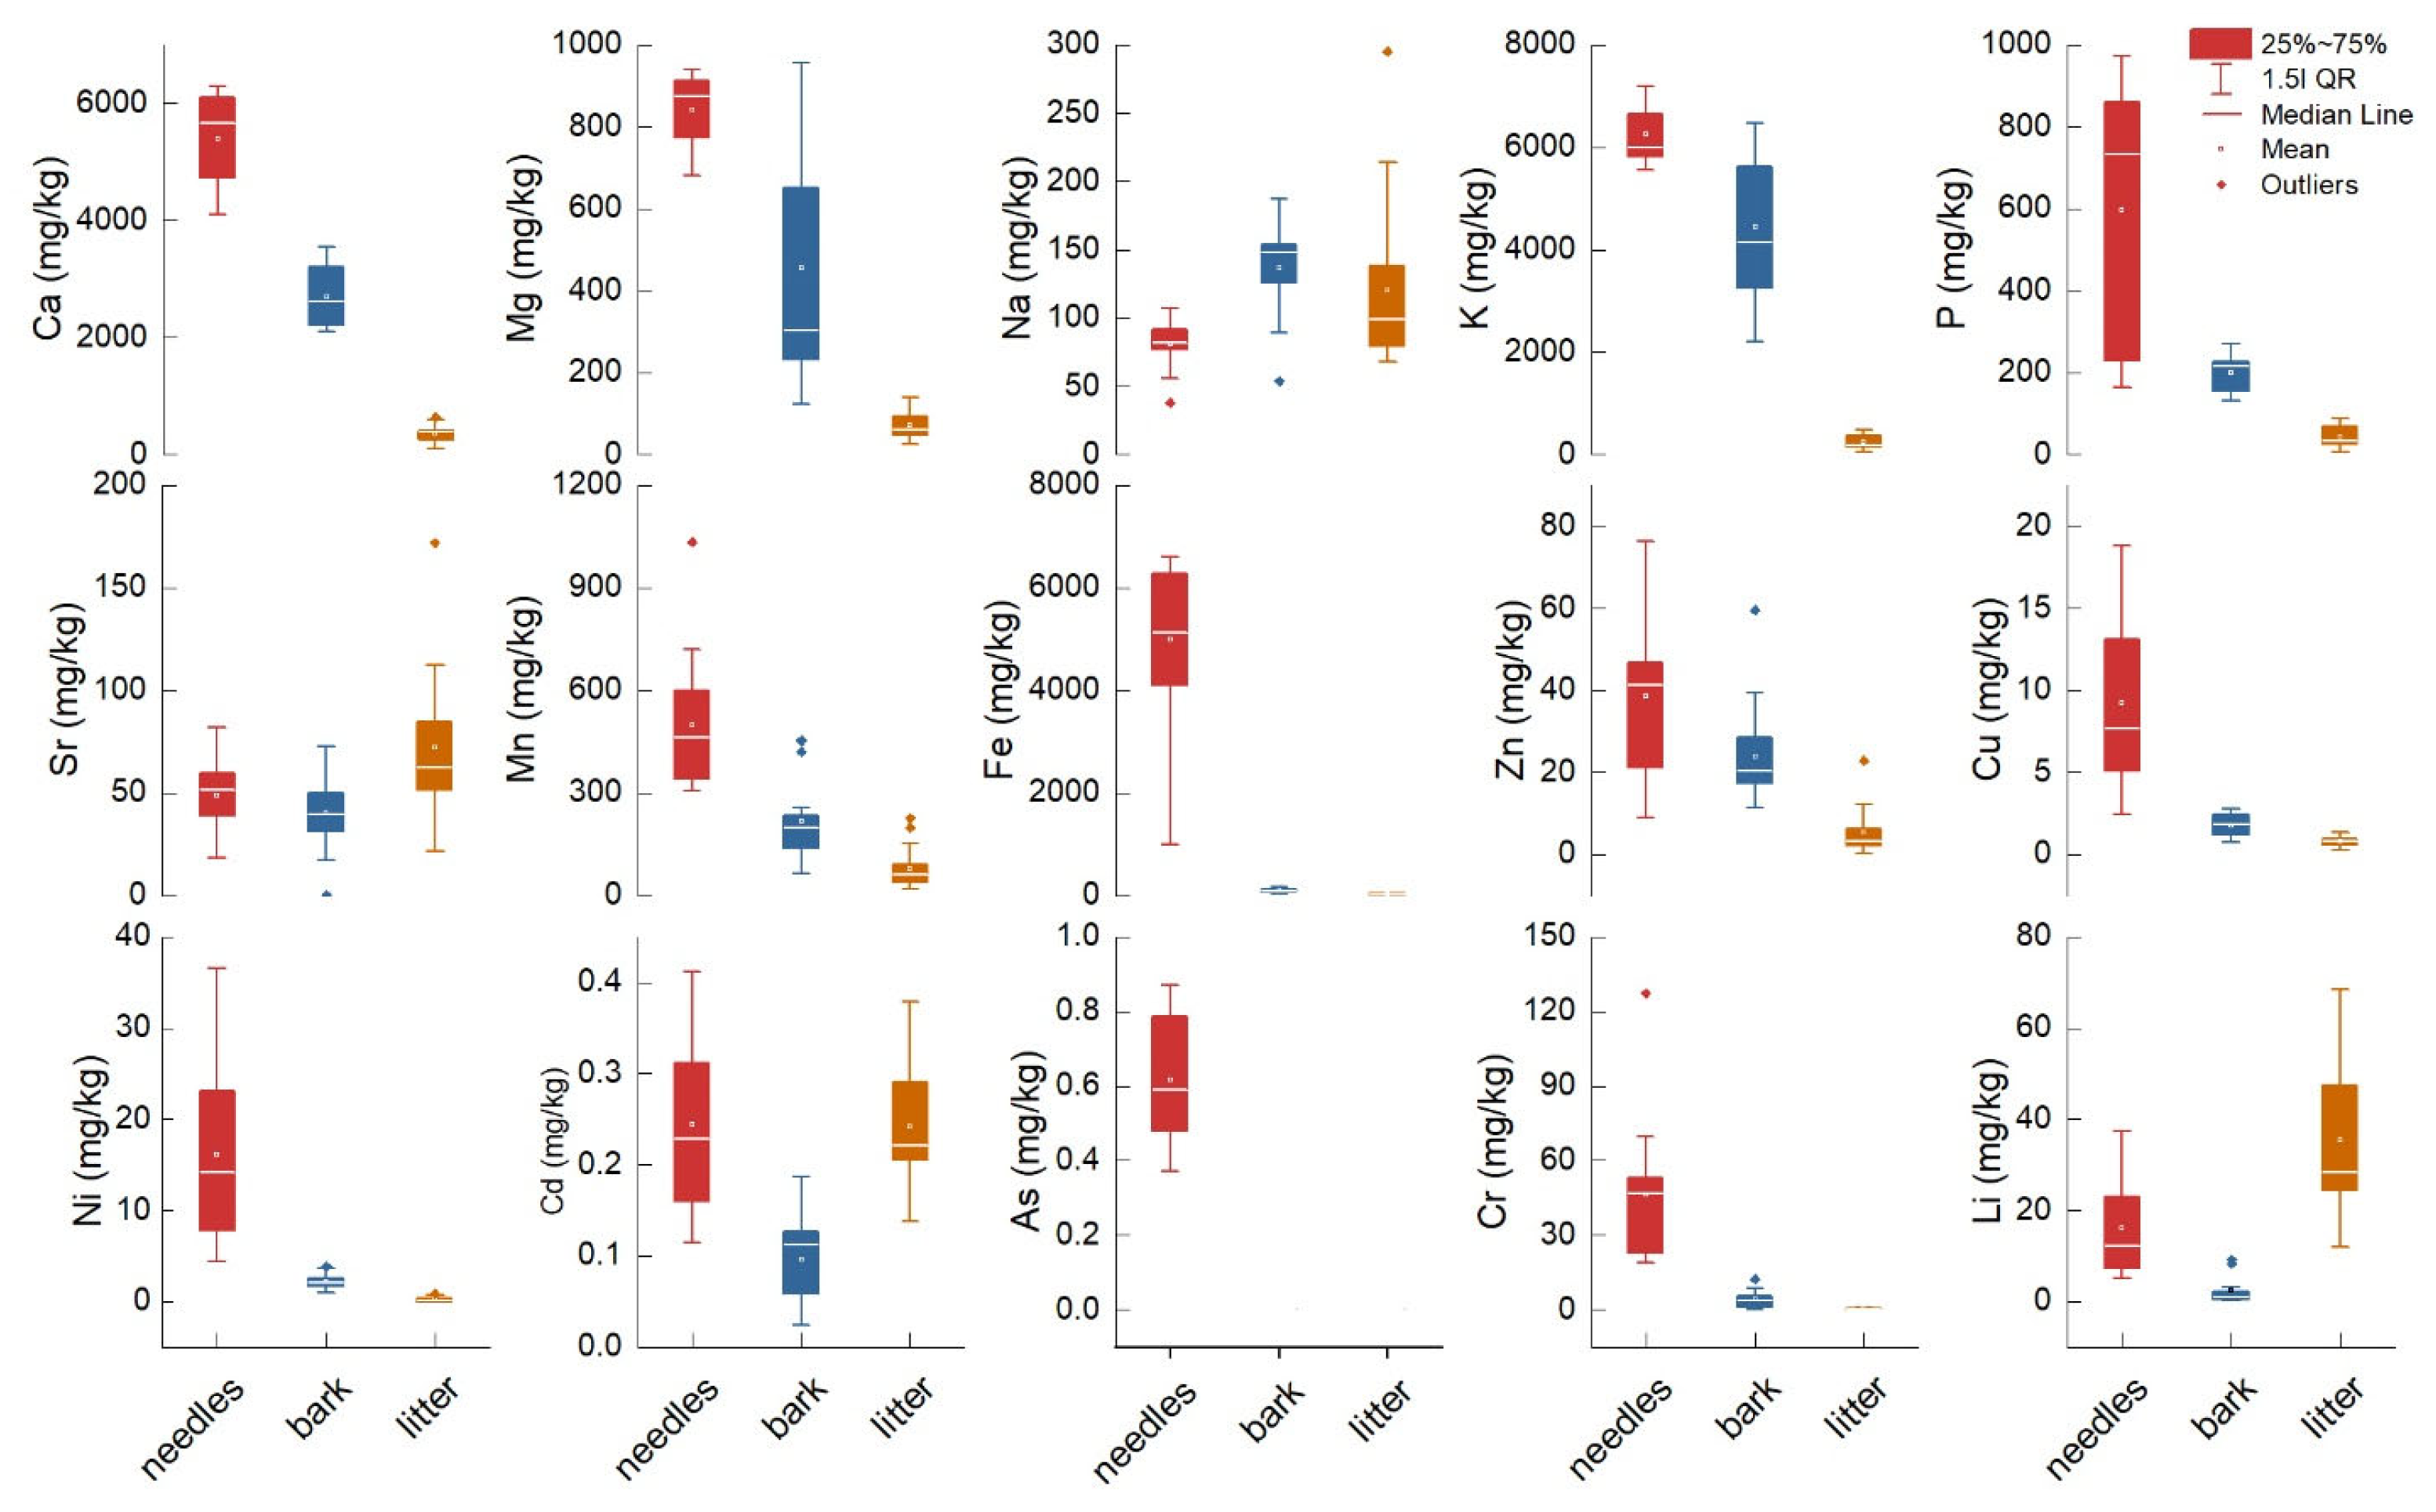
Figure 1. Elemental chemical concentration in Norway spruce needles, bark, and litter measured in Cozia.
Plants 14 00968 g001
Figure 2. The distribution of isotope ratios 206/207Pb and 87/86Sr and ratios between nutrients measured in Norway spruce needles and litter.
Plants 14 00968 g002
Figure 3. Hierarchical cluster analysis (ac) and correlation analysis (df) of litter (a,d), bark (b,e), and needle (c,f) element concentrations. Asterisks indicate significance levels.
Plants 14 00968 g003
Figure 4. Correlations between mole ratios in (a) litter and (b) needles, and toxic elements in needles, bark, and litter. Asterisks indicate significance levels.
Plants 14 00968 g004
Figure 5. Bio-concentration factor (BCF) index illustration for each metal and altitude in bark and Norway spruce needles. See sites’ codes and altitudes in Figure 1.
Plants 14 00968 g005
Figure 6. Graphical representation of environmental health risk assessment indices for each metal and altitude; (a) Geo-accumulation index (Igeo), (b) Contamination factor (Cf), (c) Ecological risk (Er), (d) Pollution load index (PLI), Nemerow pollution index (PINemerow), and potential ecological risk (PERI). See sites’ codes and altitudes in Figure 1.
Plants 14 00968 g006
Figure 7. Location map of the studied area in (a) eastern Europe, (b) locations of the sampling sites in the Cozia Mountains, (c) a detailed illustration of the altitudinal gradient, and (d) distance and relief between study sites (red rectangle) and two industrial contamination sources (pink rectangles). The numbers on the map indicate altitude as follows: control sites [#1 (521 m), #3 (671 m), #5 (745 m)], and the altitudinal gradient used to evaluate the pollution status [#2 (654 m), #4 (723 m), #6 (850 m), #7 (855 m), #8 (907 m), #9 (950 m), #10 (1036 m), #11 (1110 m), #12 (1160 m), #13 (1180 m), #14 (1310 m), #15 (1311), #16 (1488 m), and #17 (1554 m)].
Plants 14 00968 g007
Table 1. Summary statistics (mean ± standard error of the mean) for each metal investigated in Norway spruce needles, bark, and litter (data are given in mg kg−1), respectively. Statistical differences between needles, bark, and litter are indicated by different letters.
ElementTissue or ComponentBonferroni TestLevene’s
Test
RMSE
NeedlesBarkLitterBark vs.
Needles
t-Value
Litter vs.
Needles
t-Value
Litter vs.
Bark
t-Value
Prob > F
K6263 ± 133 (A)4448 ± 339 (B)250 ± 30 (C)−6.06 ***−20.11 ***−14.04 ***<0.0001871
Ca5391 ± 182 (A) 2692 ± 121 (B)359 ± 36 (C)−14.87 ***−27.73 ***−12.86 ***<0.0001528
Mg840 ± 21 (A)454 ± 71 (B)70 ± 8.5 (C)−6.29 ***−12.55 ***−6.25 ***<0.0001178
P597 ± 76 (A)199 ± 9.6 (B)44 ± 6.5 (B)−6.34 ***−8.79 ***−2.45<0.0001183
Na81 ± 4.0 (B)136 ± 8.3 (A)120 ± 14 (A)3.91 **2.74 *−1.170.0841
Fe4991 ± 376 (A) 94 ± 10 (B)37 ± 4.4 (B)−15.90 ***−16.09 ***−0.18<0.0001897
Mn496 ± 48 (A)219 ± 28 (B)78 ± 14 (C)−5.85 ***−8.81 ***−2.96 *0.001138
Zn38 ± 4.86 (A) 23 ± 2.9 (B)5.2 ± 1.37 (C)−3.09 **−6.98 ***−3.88 ***<0.000113
Cu9.26 ± 1.1 (A) 1.78 ± 0.16 (B) 0.77 ± 0.07 (B) −7.79 ***−8.85 ***−1.05<0.00012.7
Sr48.79 ± 4.3 (B)39 ± 4.3 (B)72 ± 8.5 (A)−1.032.74 *3.78 **0.0624
Cr46 ± 6.4 (A)4.05 ± 0.82 (B)0.35 ± 0.07 (B)−7.95 ***−8.65 ***−0.69<0.000115
Ni16 ± 2.29 (A)2.22 ± 0.20 (B)0.23 ± 0.06 (B)−7.40 ***−8.45 ***−1.05<0.00015.4
Li16 ± 2.66 (B)2.3 ± 0.75 (C)35 ± 4.38 (A)−3.24 **4.58 ***7.82 ***<0.000112
As0.61 ± 0.04 (A)
Cd0.24 ± 0.02 (A)0.09 ± 0.01 (B)0.24 ± 0.01 (A)−6.01 ***−0.095.91 ***0.060.07
* Significance levels are p < 0.05 *, p < 0.01 **, p < 0.001 ***.
Table 2. Summary statistics of ratios calculated for litter and Norway spruce needles. ANOVAs were used to test differences between litter and needles.
Mole RatioTissue or ComponentSummary StatisticsOne-Way ANOVA
MeanSDMinMaxF-ValueProb > F
Ca/Mglitter5.341.262.787.689.570.004
needles6.420.704.607.25
Ca/Nalitter3.581.900.686.61128.55<0.0001
needles70.2224.1554.87152.89
Ca/Plitter10.826.402.4528.670.800.37
needles13.289.335.0231.67
Ca/Klitter1.580.580.893.0325.83<0.0001
needles0.850.070.710.96
Na/Mglitter0.090.010.040.1233.73<0.0001
needles2.071.400.815.72
Mg/Plitter2.191.390.464.620.0830.77
needles2.051.430.874.83
K/Nalitter2.421.370.314.55189.96<0.0001
needles81.4023.5860.44157.68
K/Mglitter3.601.061.805.77181.89<0.0001
needles7.480.536.458.21
Li/Calitter0.130.160.020.7211.760.001
needles0.0020.0020.000.008
Li/Nalitter0.350.210.070.824.570.04
needles0.210.160.050.66
Table 3. Criteria for interpreting environmental and ecological health risk indices.
IndicesInterval of ValuesInterpretation
BCF≤1plants only absorb metals
>1plants have the potential for accumulation
Igeo≤1uncontaminated
0 ≤ Igeo < 1uncontaminated to moderately contaminated
1 ≤ Igeo < 2moderately contaminated
2 ≤ Igeo < 3moderately to heavily contaminated
3 ≤ Igeo < 4heavily contaminated
4 ≤ Igeo < 5heavily to extremely contaminated
Igeo ≥ 5extremely contaminated
CfCf < 1low contamination
1 < Cf < 3moderate contamination
3 < Cf < 6considerable contamination
Cf > 6very high contamination
PLIPLI < 1uncontaminated
1 ≤ PLI < 2uncontaminated to moderately contaminated
2 ≤ PLI < 3moderately to strongly contaminated
PLI ≥ 3strongly contaminated
PINemerow≤0.7uncontaminated
0.7–1danger range
1–2low contamination
2–3moderate contamination
≥3severe contamination
EriEri < 40low
40 ≤ Eri < 80moderate
80 ≤ Eri < 160considerable
160 ≤ Eri < 320high
320 ≥ Erivery high
PERIRI < 150moderate
150 ≤ RI < 300considerable
300 ≤ RI < 600very high
600 ≥ RI
Disclaimer/Publisher’s Note: The statements, opinions and data contained in all publications are solely those of the individual author(s) and contributor(s) and not of MDPI and/or the editor(s). MDPI and/or the editor(s) disclaim responsibility for any injury to people or property resulting from any ideas, methods, instructions or products referred to in the content.