

The Impact of Temperature on the Leaves of Ceratonia siliqua L.: Anatomical Aspect, Secondary Metabolite Analysis, and Antimicrobial Activity of the Extracts

 ,
,  , , ,
, , ,
Abstract
1. Introduction
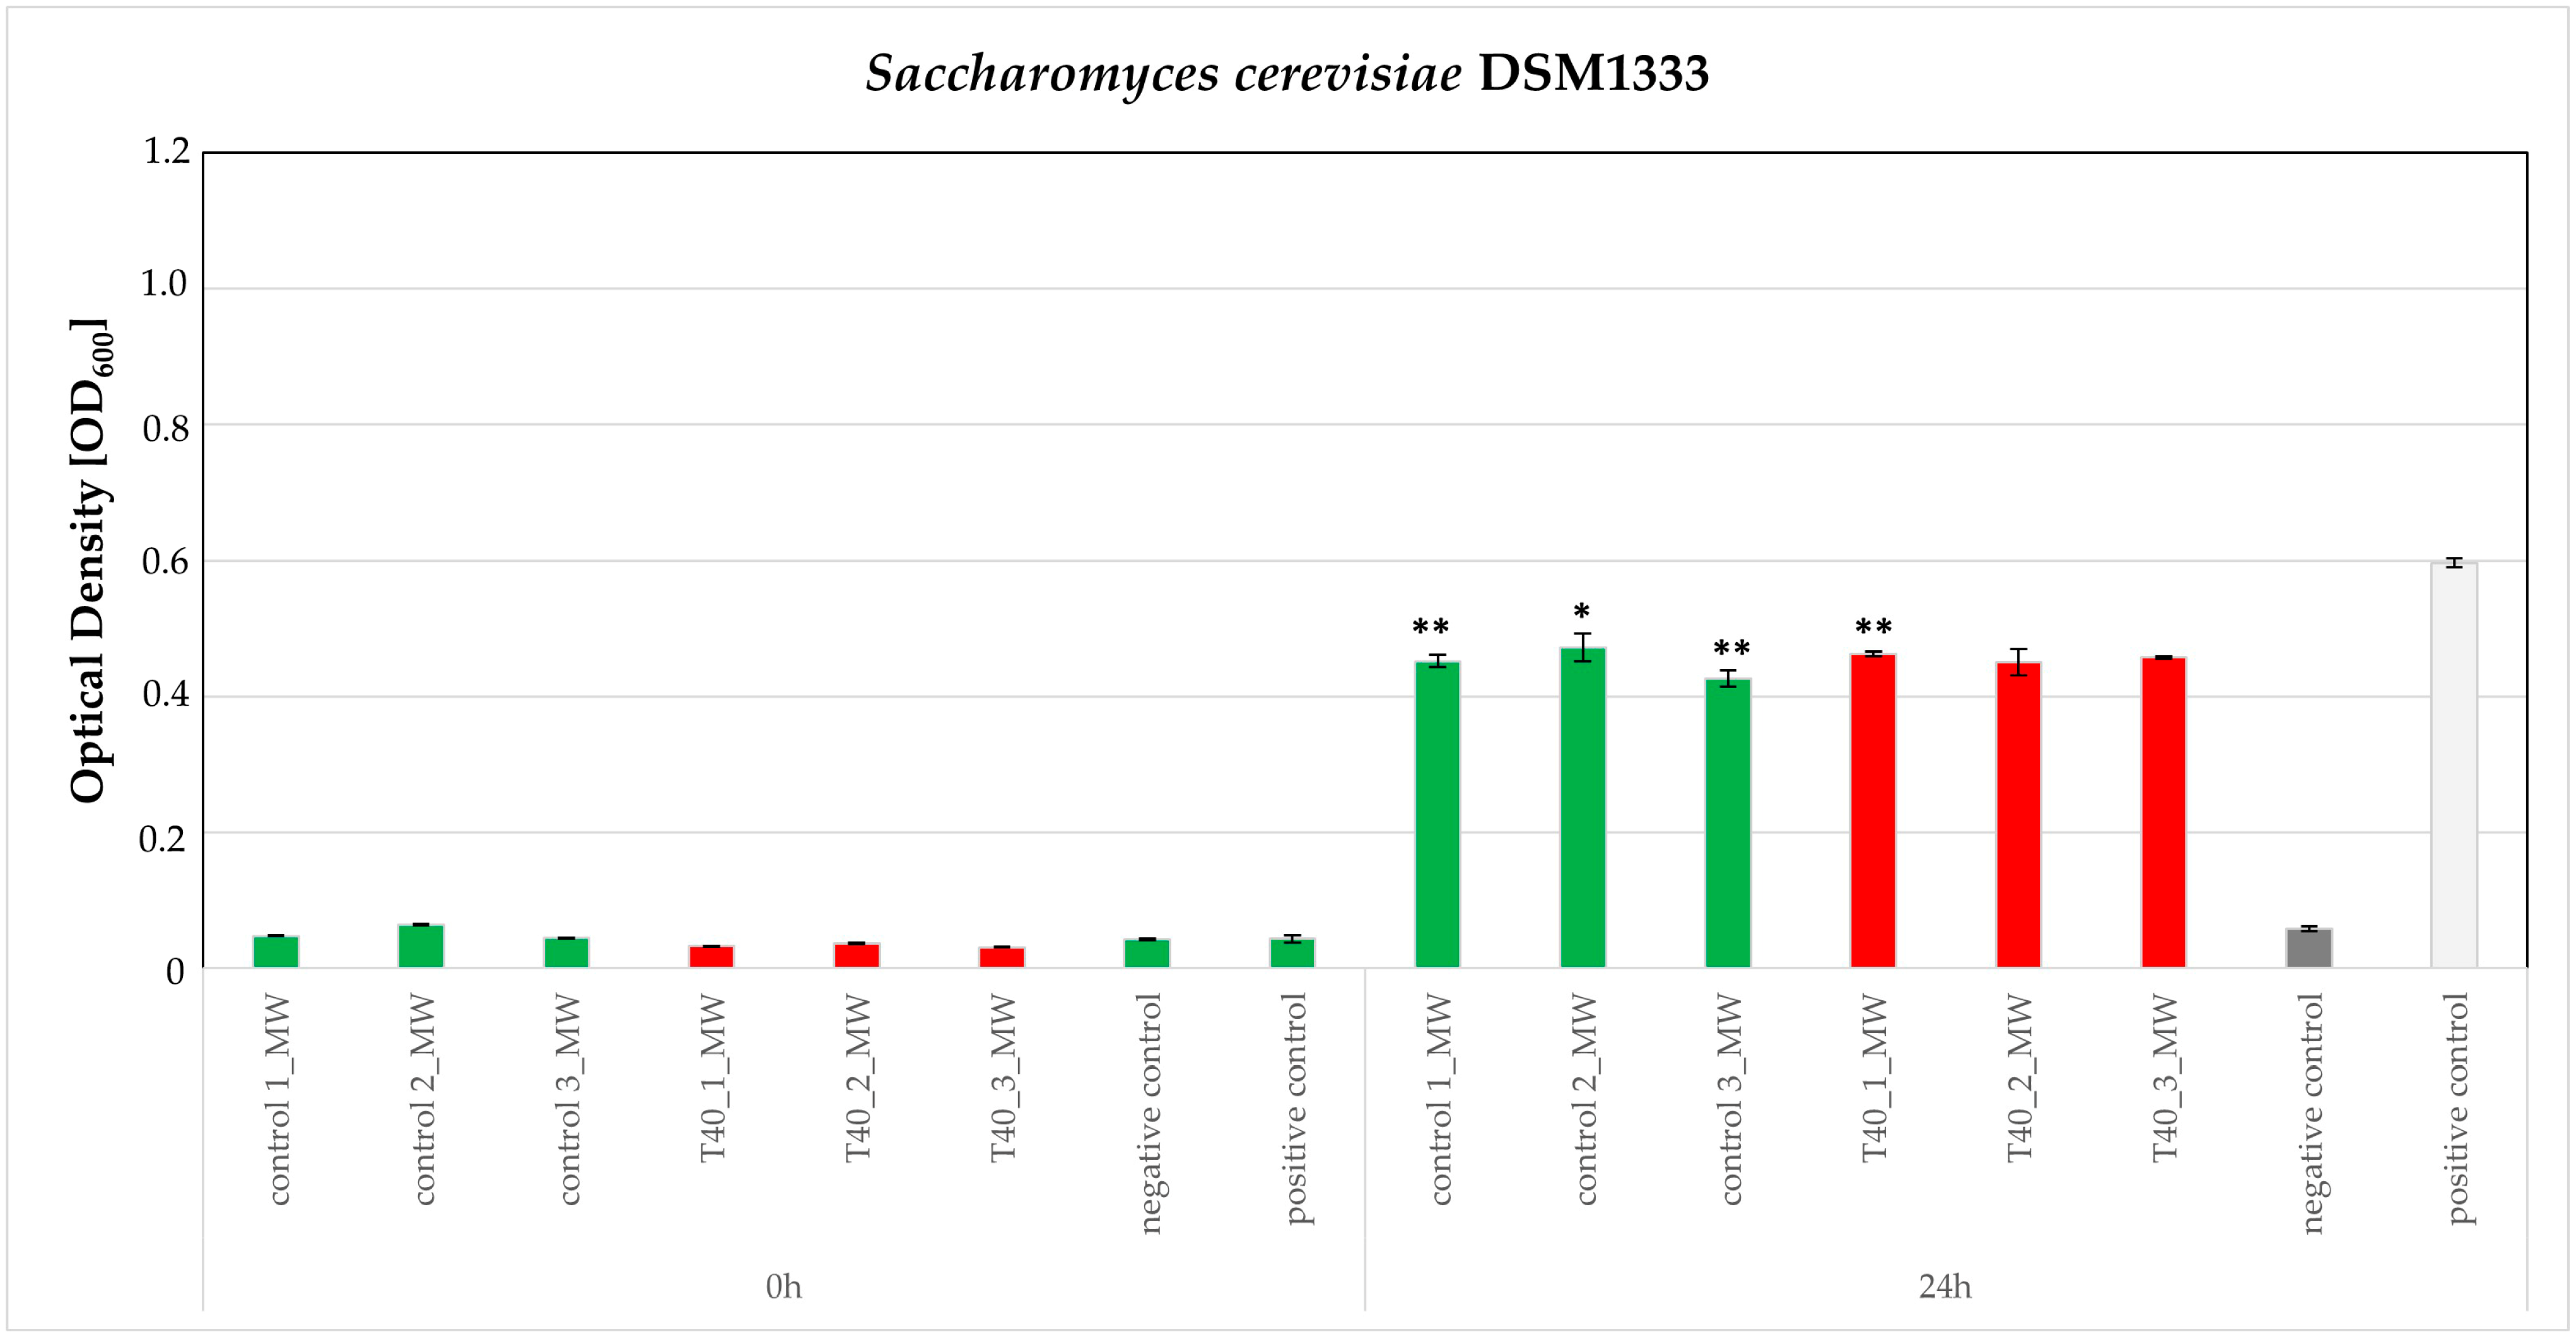
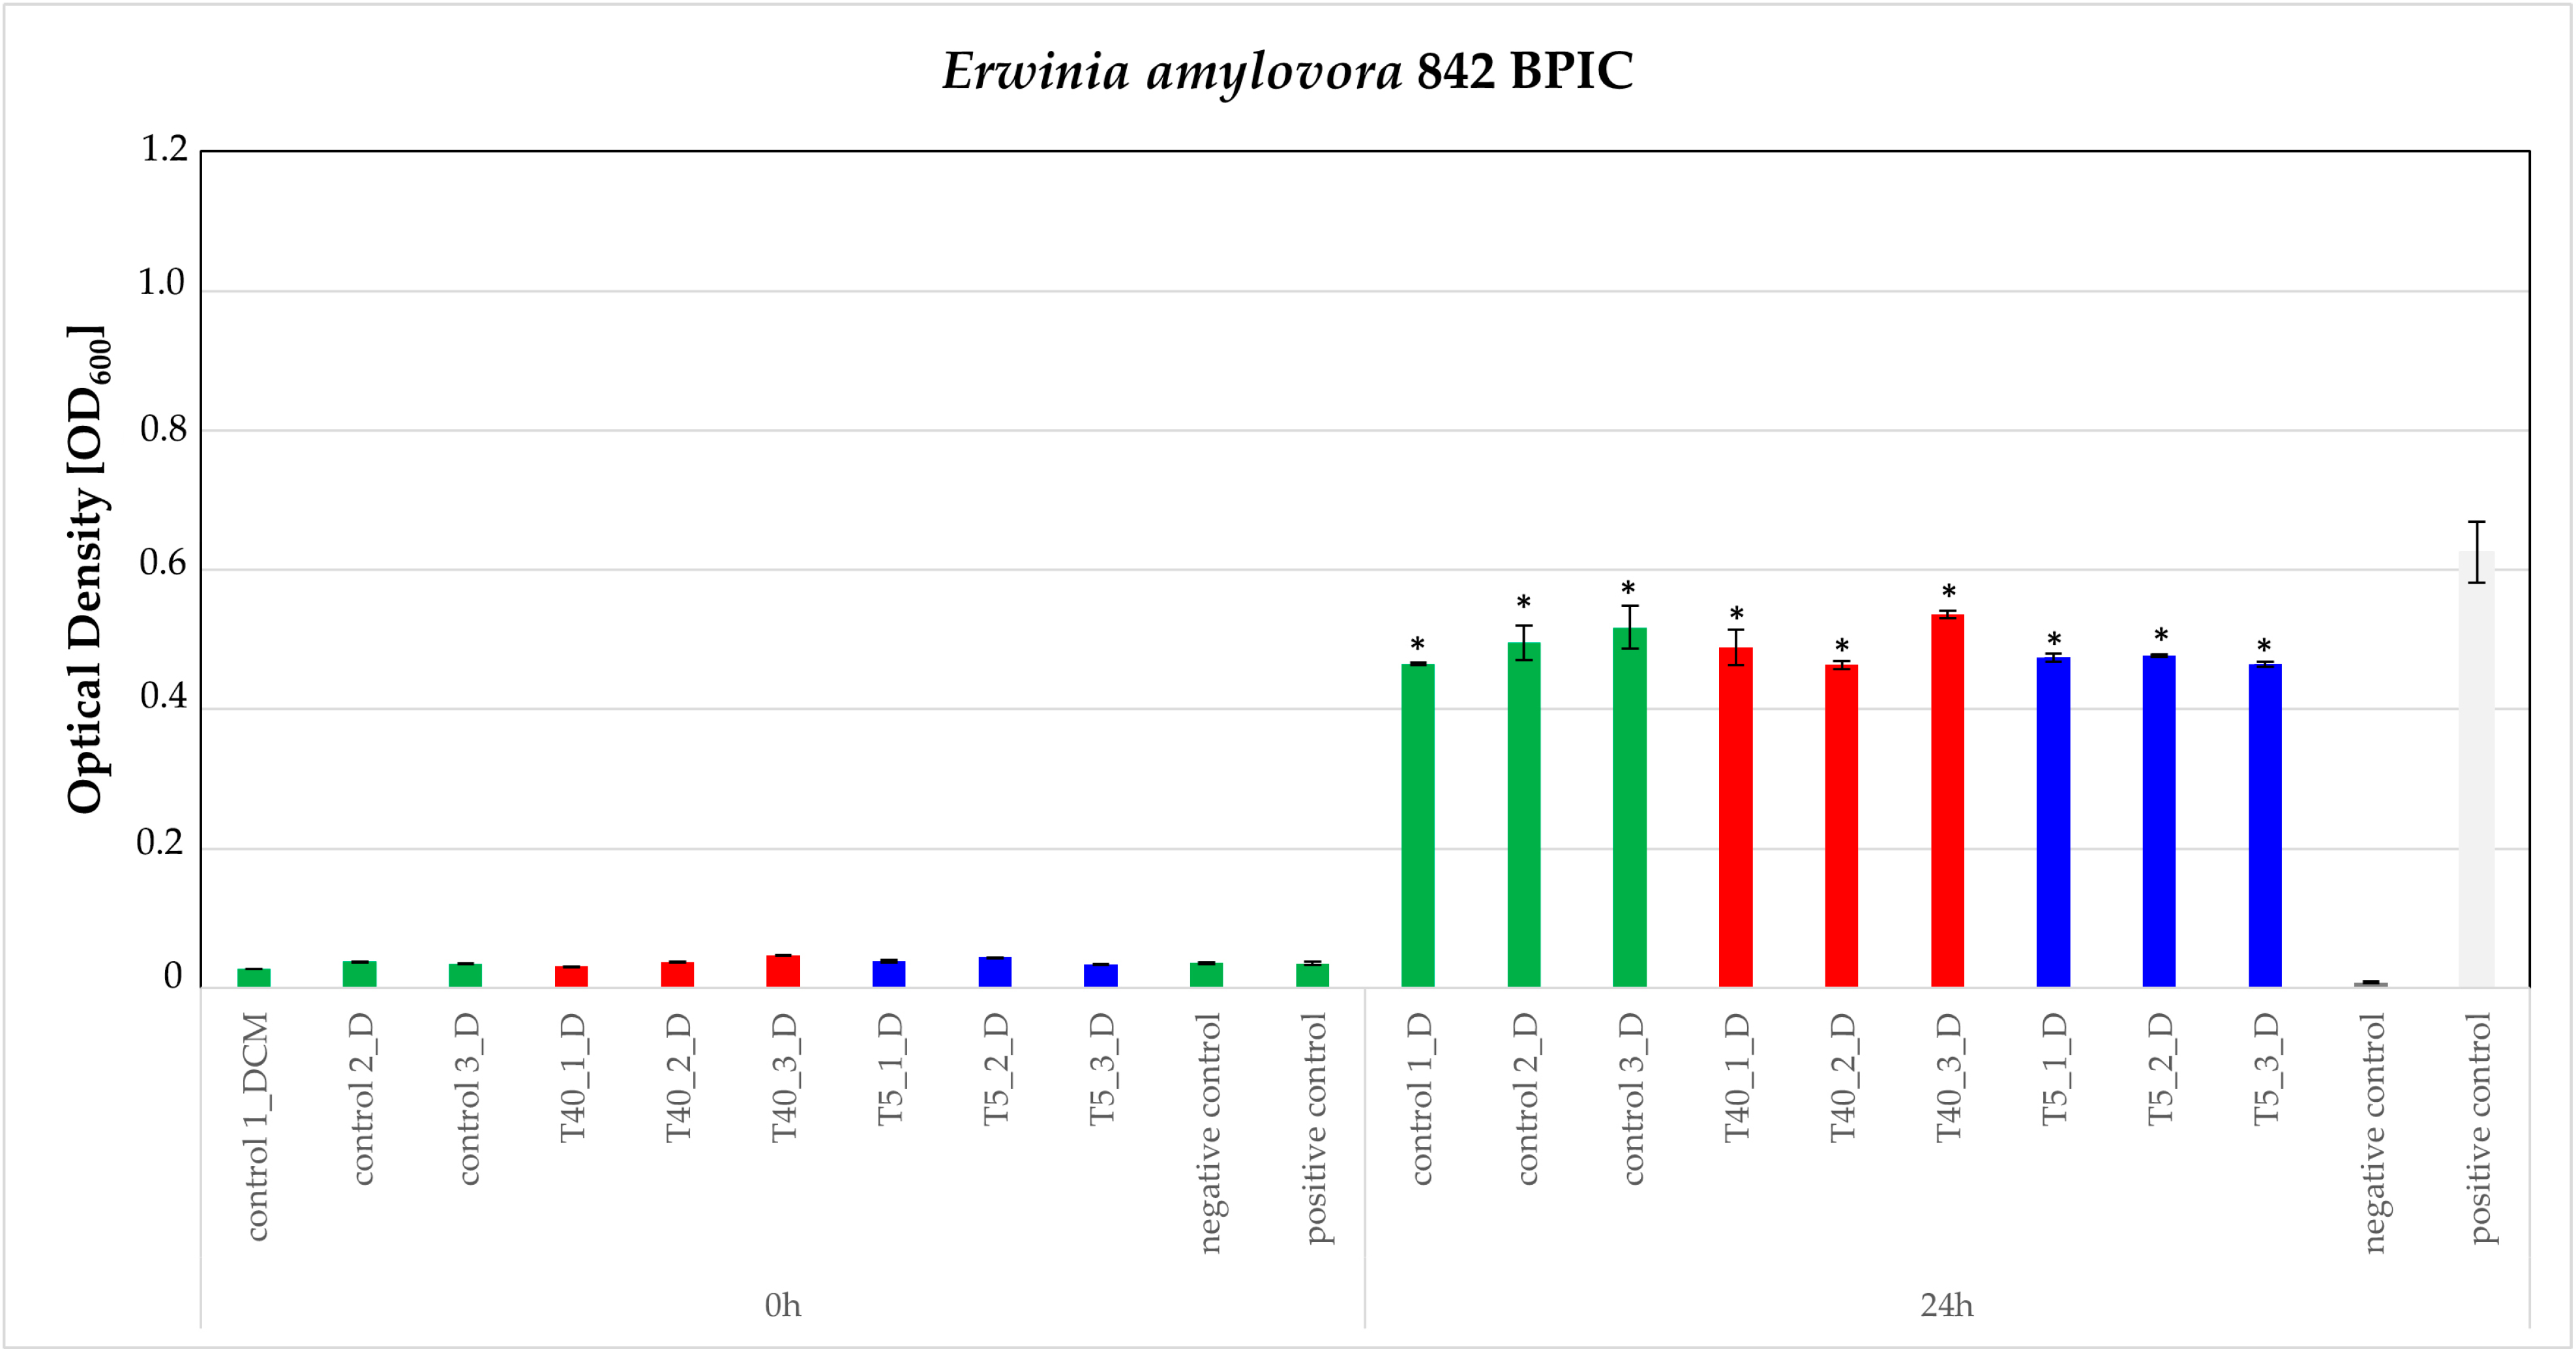
2. Results
3. Discussion
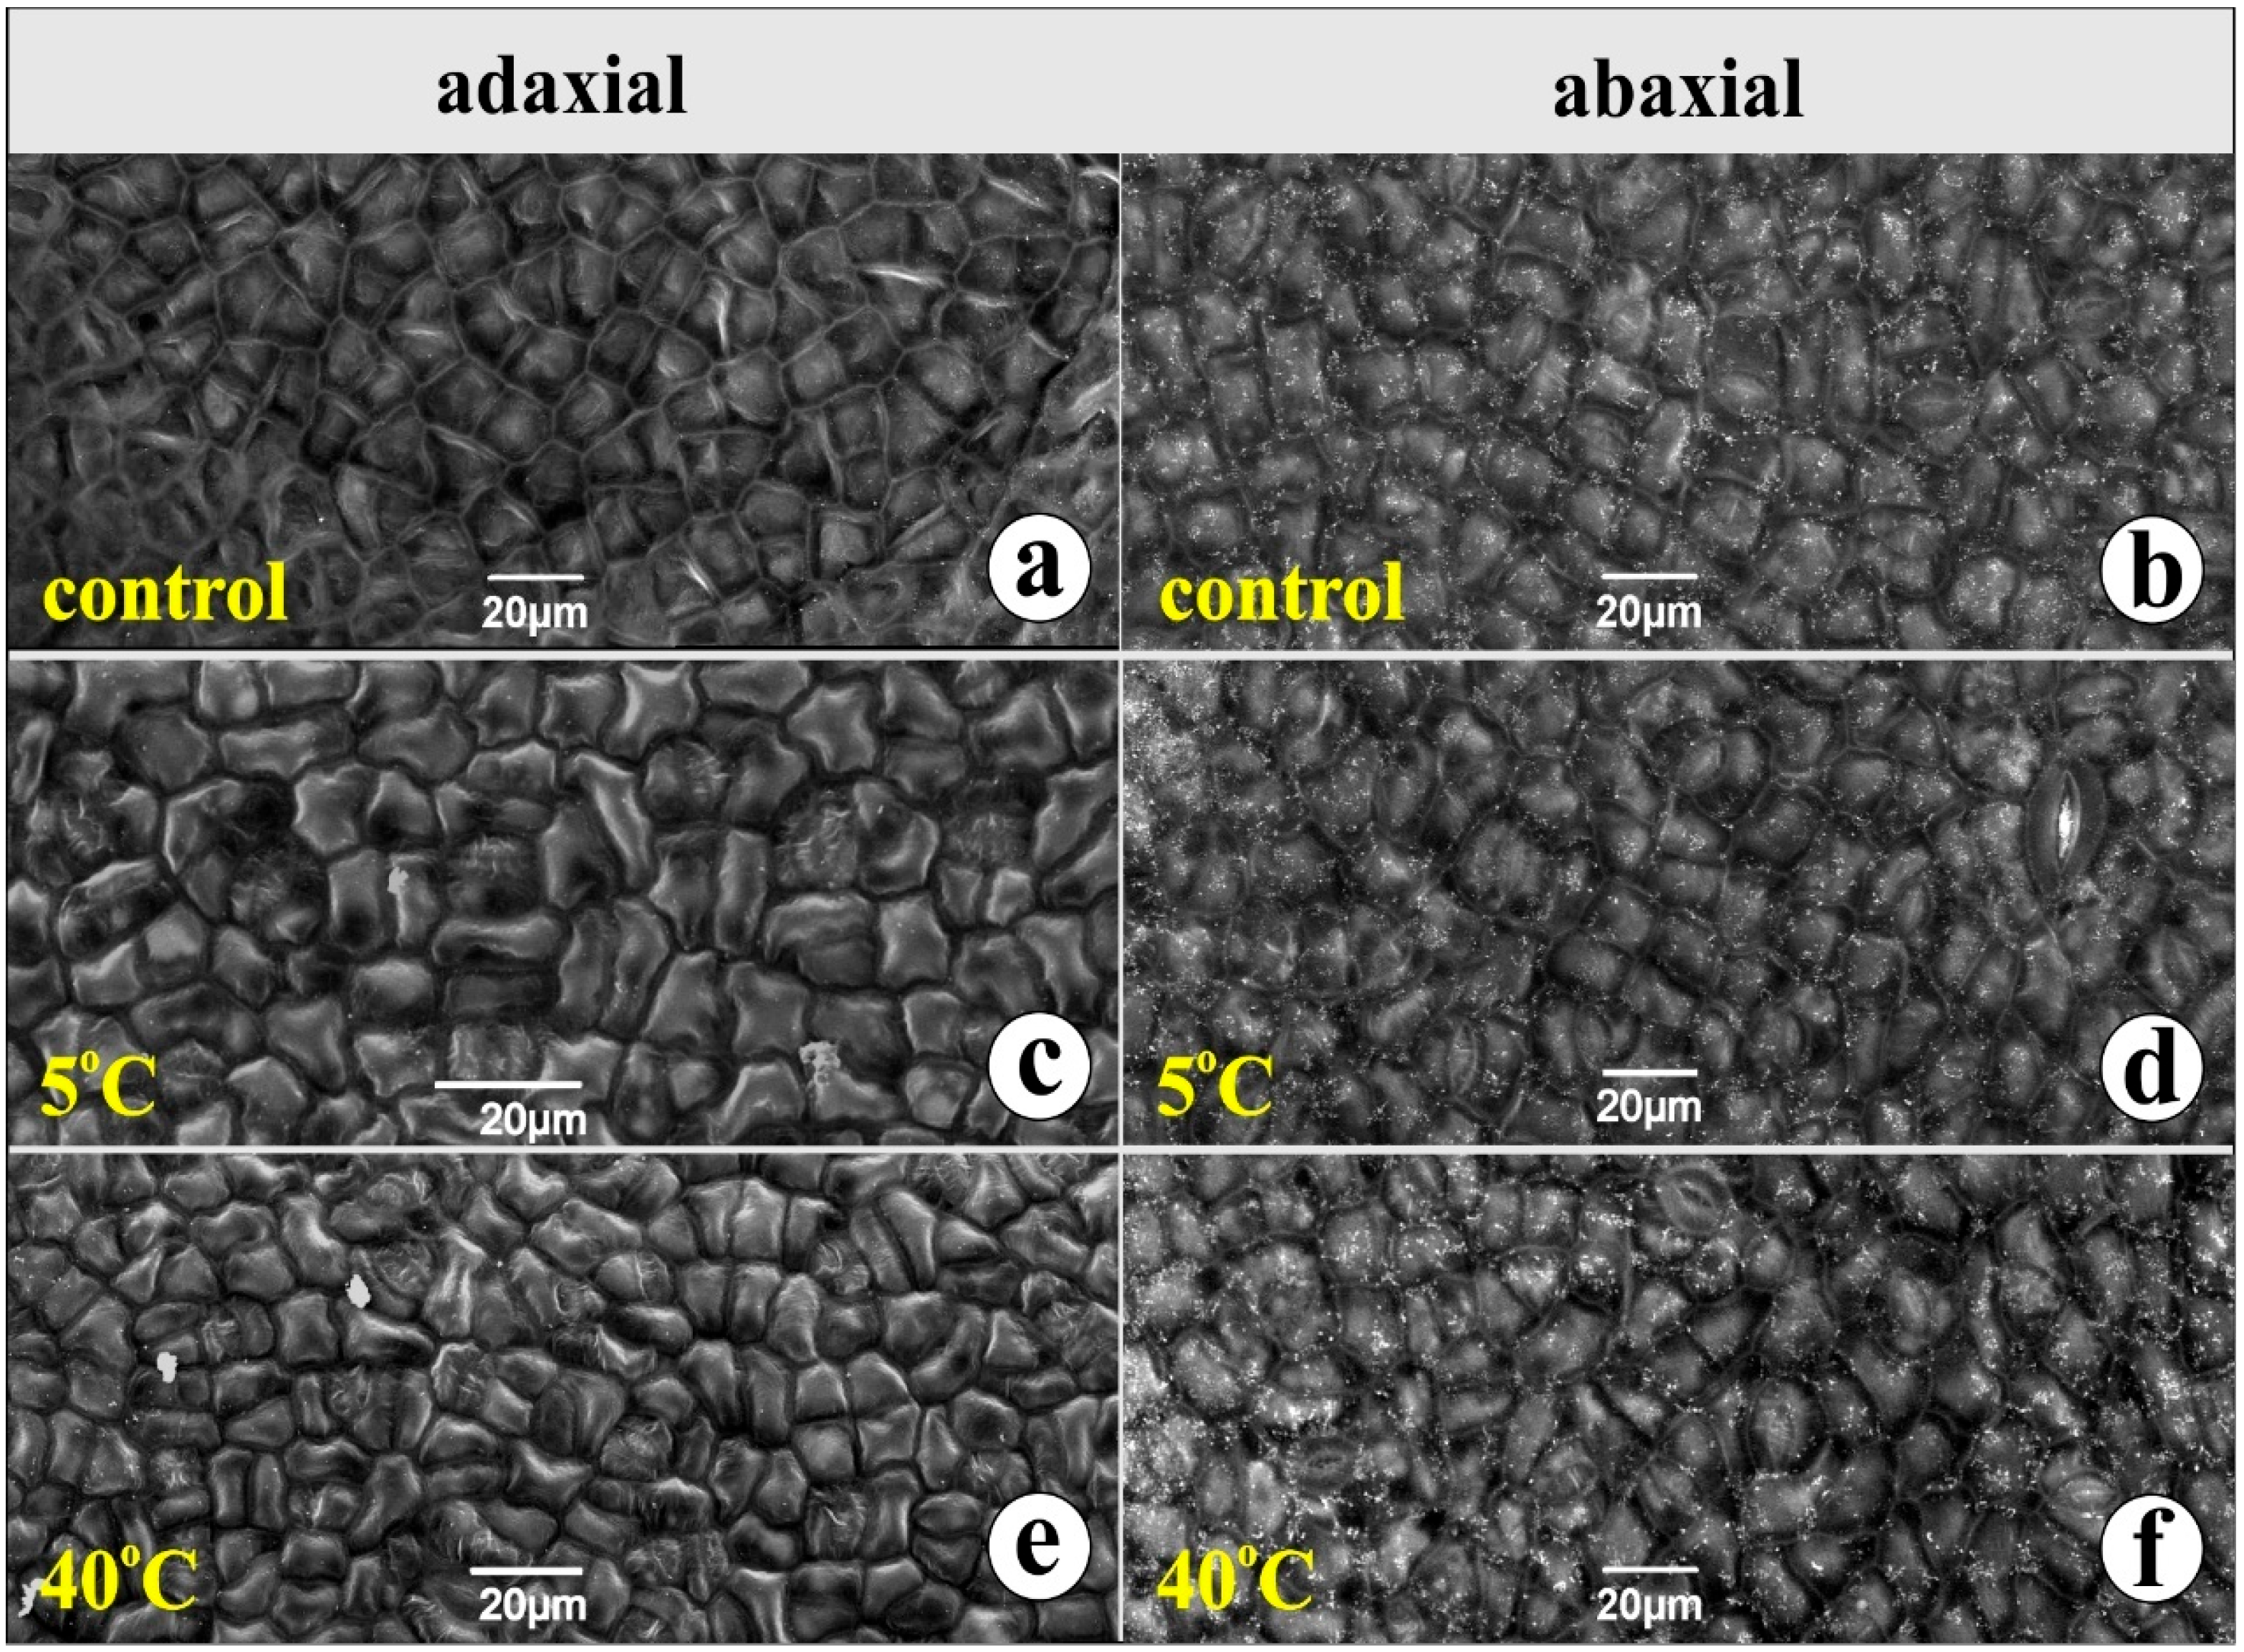
3.1. Leaf Structure
3.2. Chlorophyll, MDA, and TPC Content
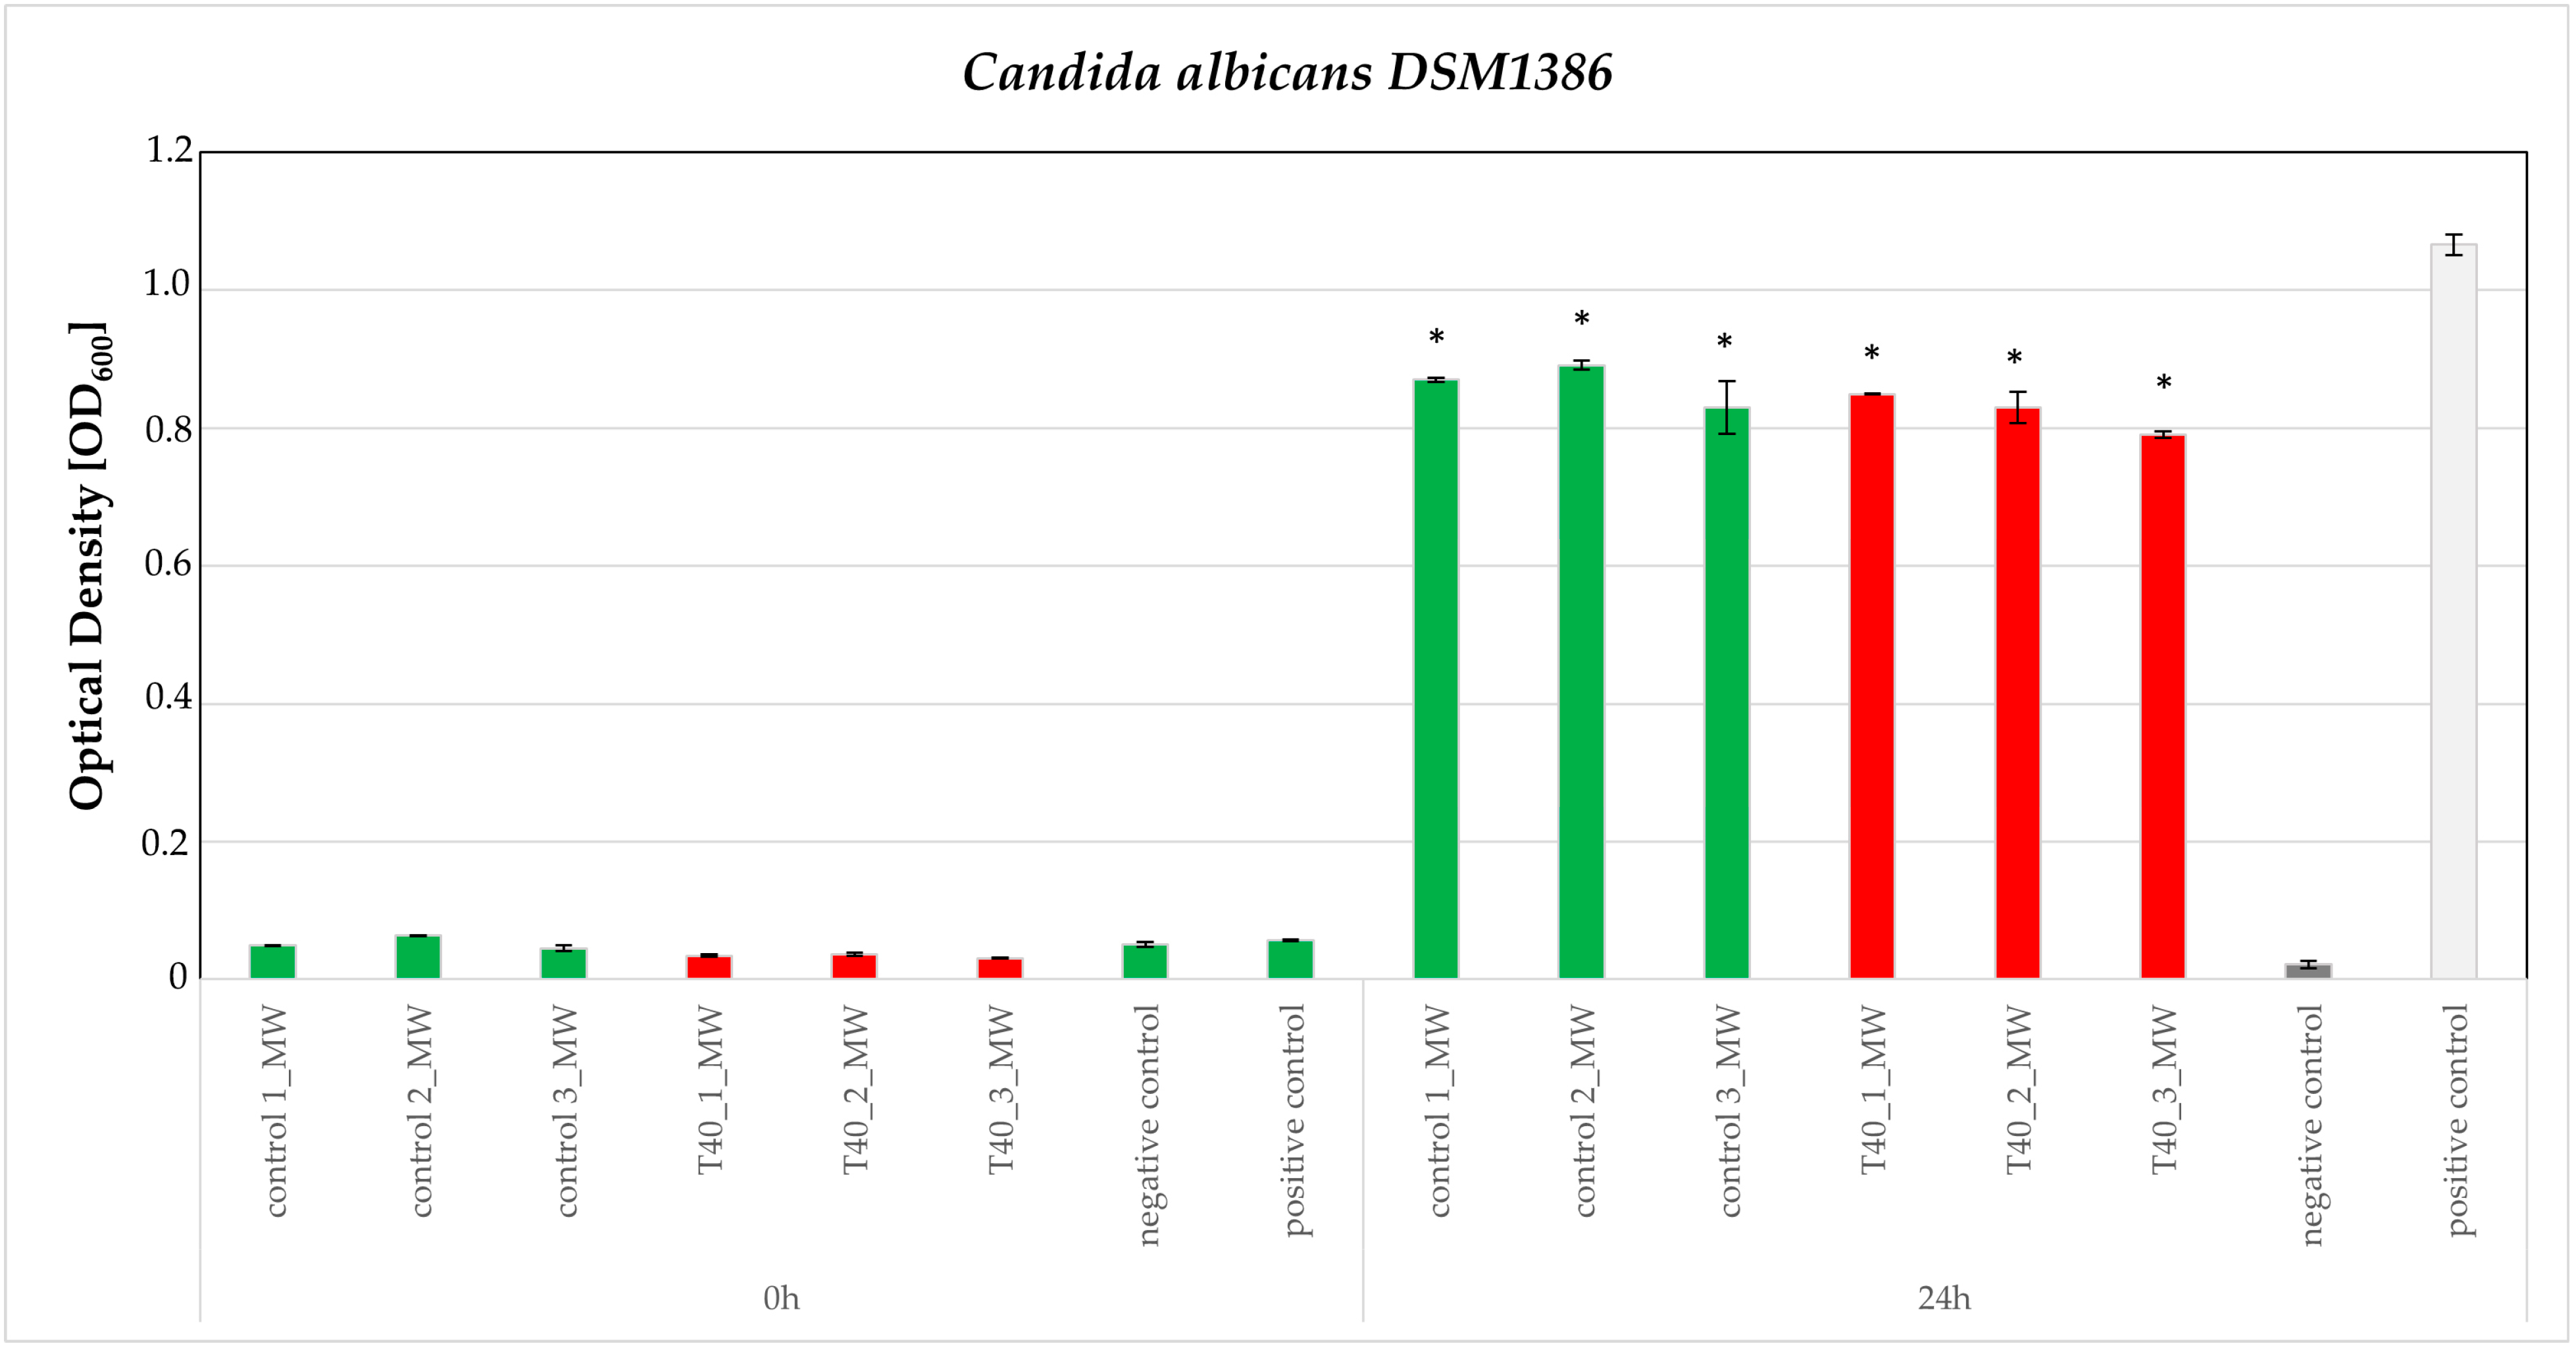
3.3. Bioassays
4. Materials and Methods
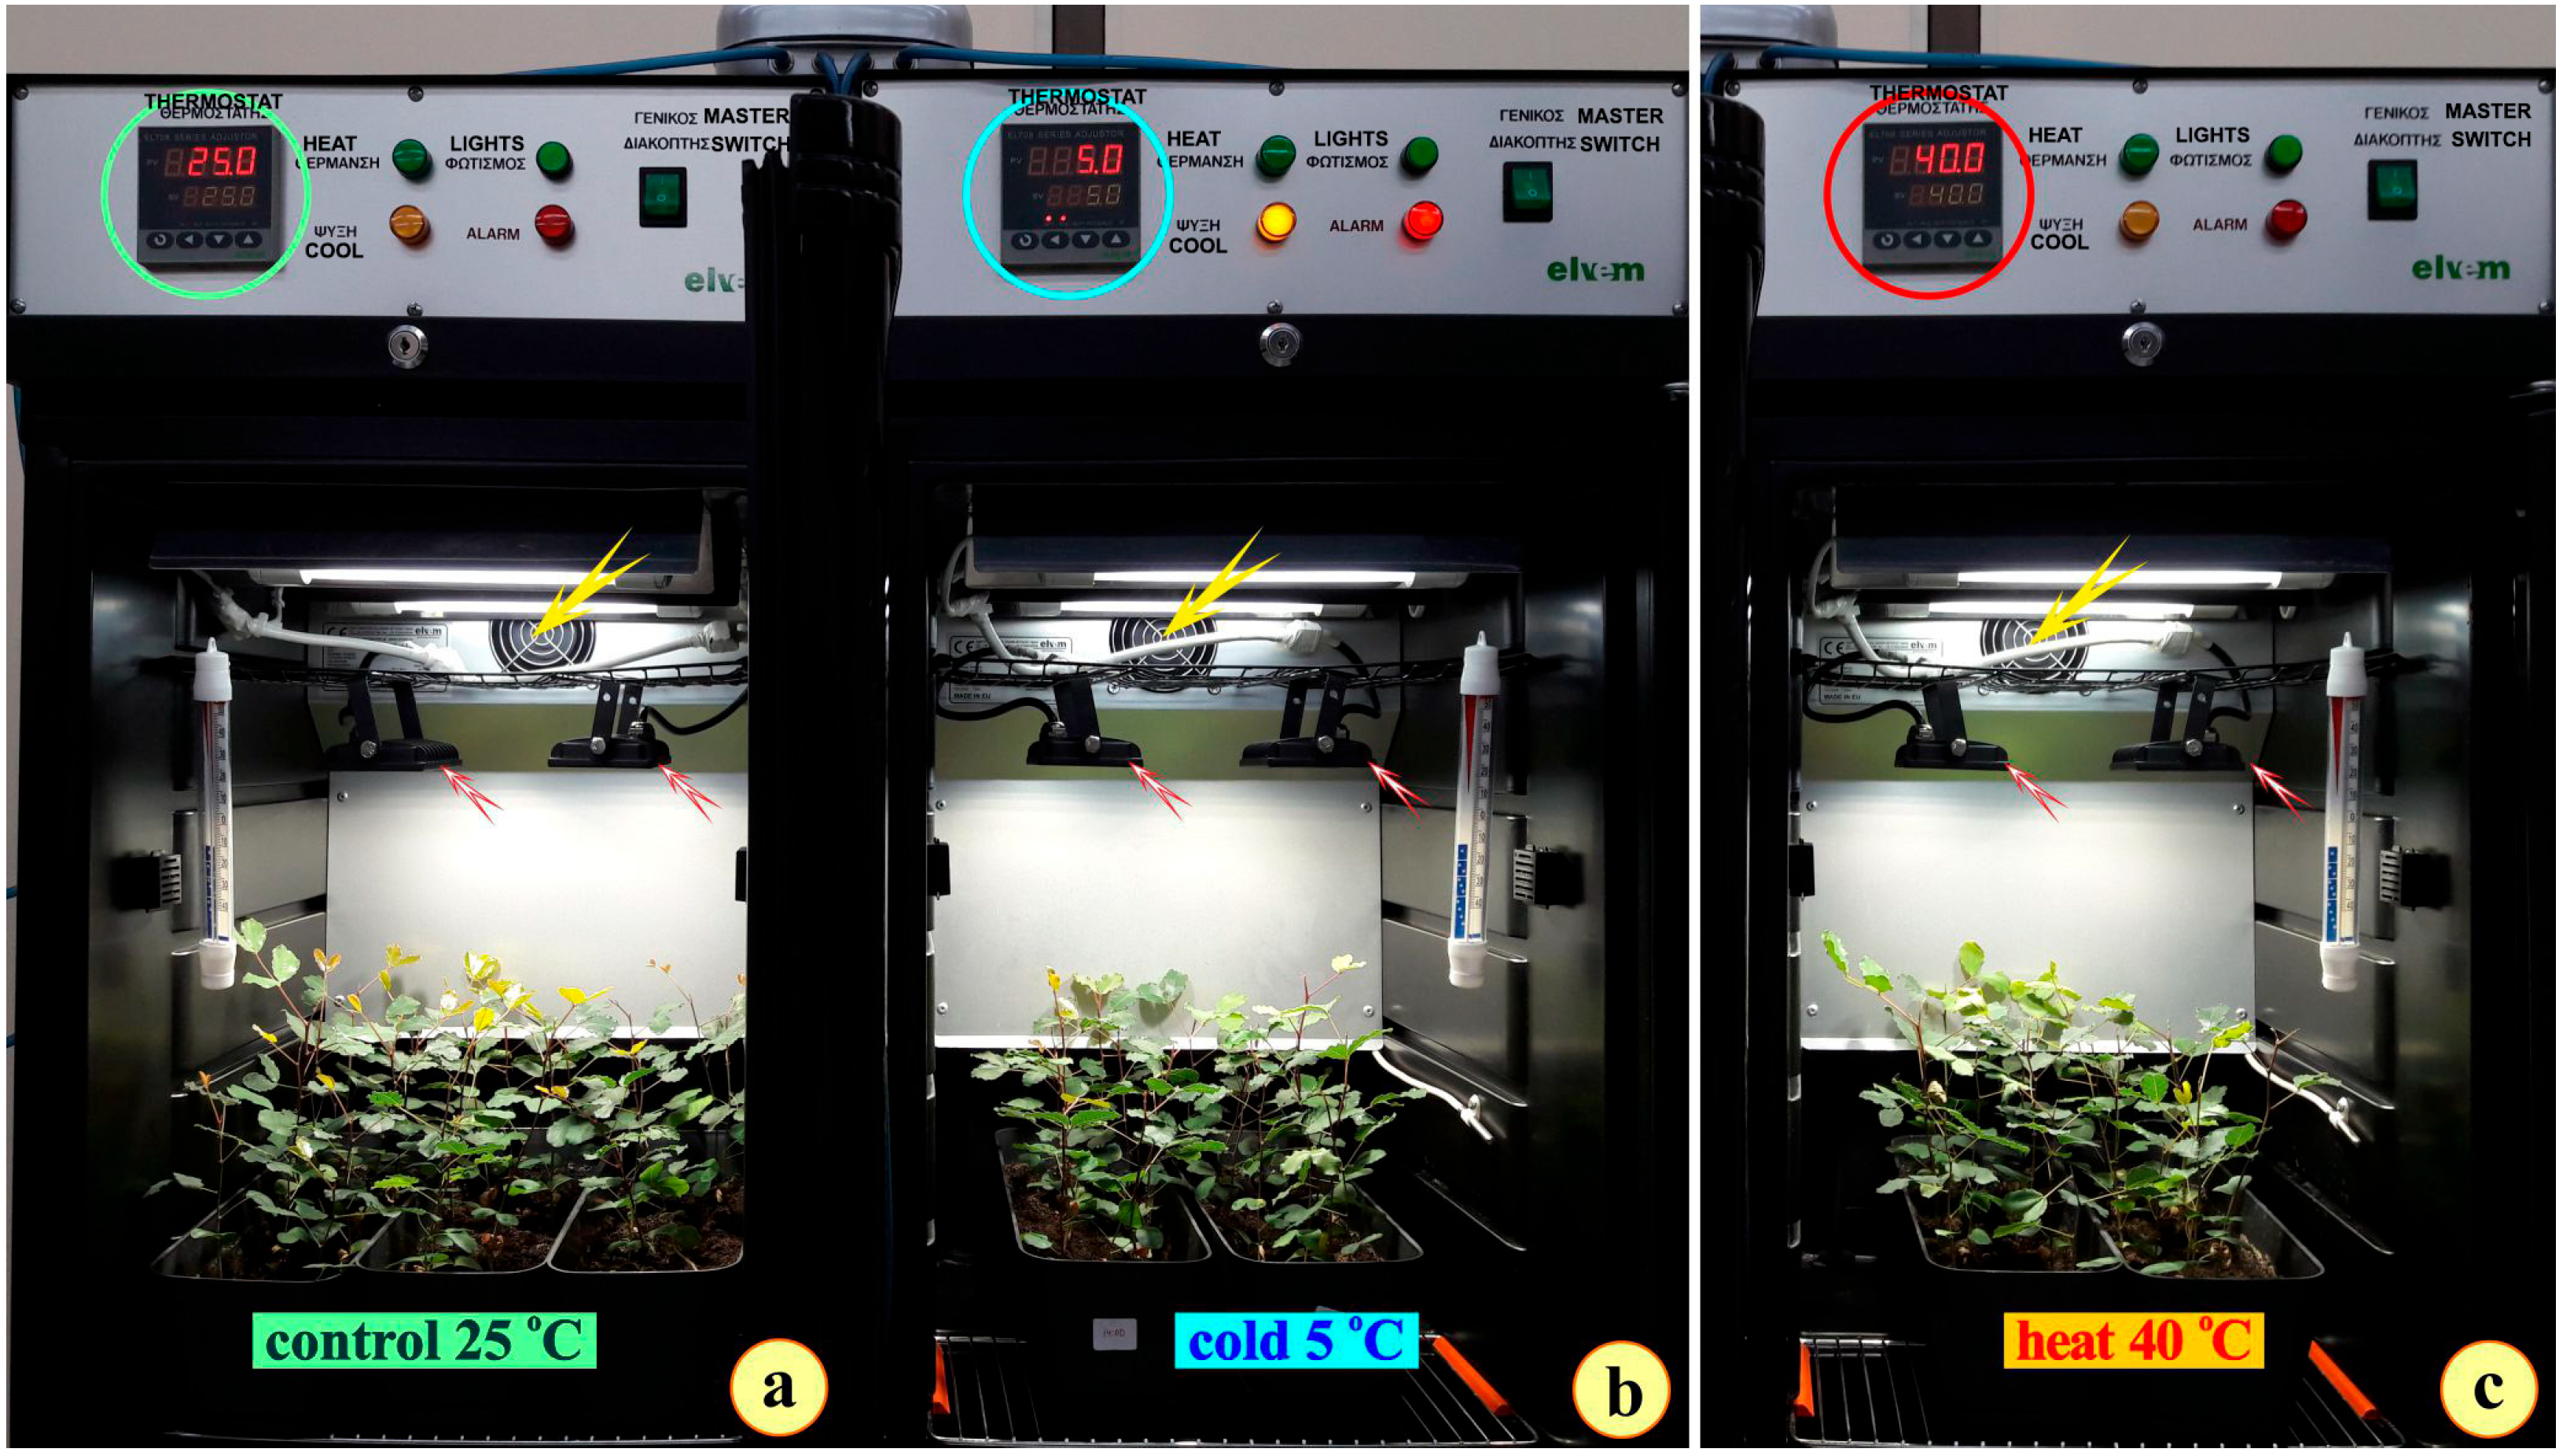
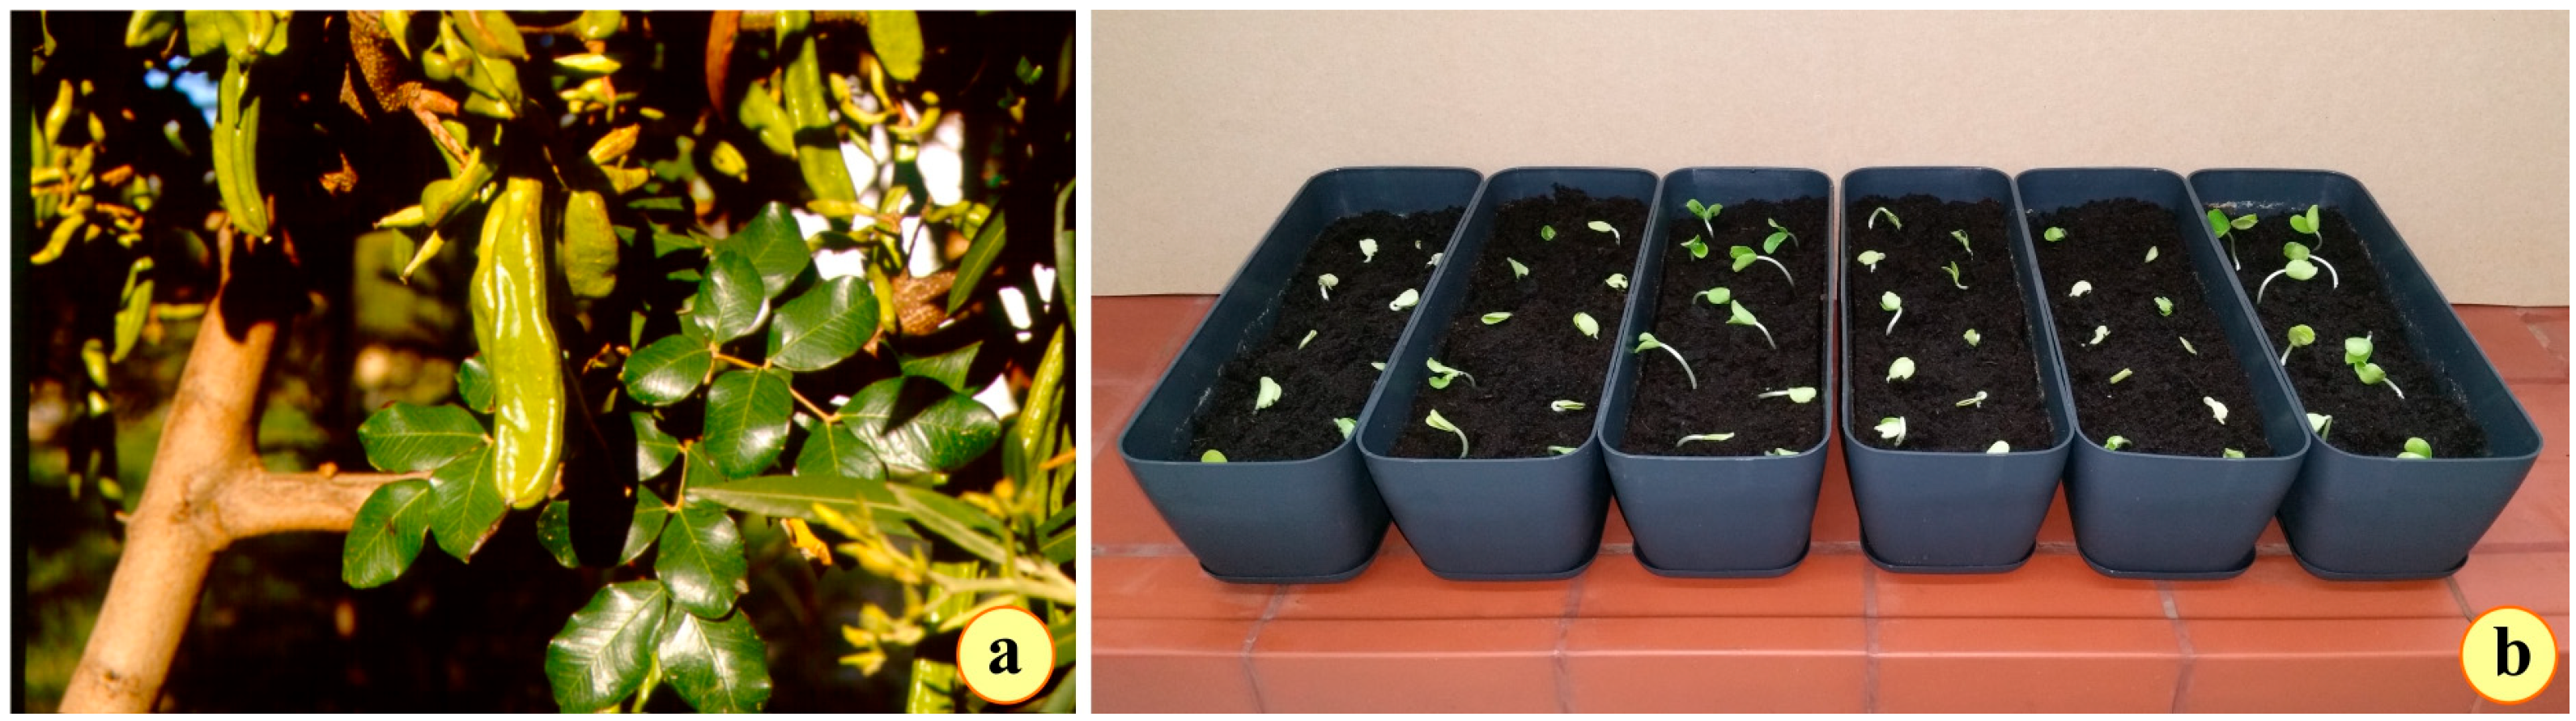
4.1. Plant Material and Exposure Setup
4.2. Microscopy
4.3. Pigments Protocol
4.4. Protocol for MDA (Malondialdehyde) Determination in Plant Tissues
4.5. Determination of Total Phenolic Content
4.6. Mass Spectroscopy (HRMS) Analysis
4.7. Data Processing and Chemometrics
4.8. Gas Chromatography–Mass Spectrometry (GC-MS) Analysis
4.9. Strains of Microorganisms and Growth Conditions
4.10. Broth Microdilution Method
4.11. PCA Analysis
5. Conclusions
Author Contributions
Funding
Data Availability Statement
Acknowledgments
Conflicts of Interest
References
- Mitrakos, K. A theory for Mediterranean plant life. Acta Oecol.-Oecol. Plant 1980, 1, 245–252. [Google Scholar]
- Aschmann, H. Distribution and Peculiarity of Mediterranean Ecosystems. In Mediterranean Type Ecosystems. Origin and Structure; di Castri, F., Mooney, H.A., Eds.; Springer: Heidelberg/Berlin, Germany, 1973; pp. 11–19. [Google Scholar]
- Mitrakos, K. Winter low temperatures in Mediterranean-type ecosystems. In Ecologia Mediterranea. Revue D’écologie Terrestre et Limnique; Quezel, P., Ed.; Faculté des Sciences et Techniques de St Jérôme: Marseille, France, 1982; Volume 2, pp. 95–102. ISSN 0153-8756. [Google Scholar]
- Margaris, N.S. Adaptive strategies in plants dominating Mediterranean-type ecosystems. In Mediterranean-Type Shrublands; Di Castri, F., Goodall, D.W., Specht, R., Eds.; Elsevier: Amsterdam, The Netherlands, 1981; pp. 239–242. [Google Scholar]
- Mitrakos, K.; Christodoulakis, N.S. Leaf structural diversity in Mediterranean evergreen sclerophylls. In Components of Productivity of Mediterranean-Climate Regions-Basic and Applied Aspects; Margaris, N.S., Mooney, H.A., Eds.; Dr W. Junk Publishers: Berlin, Germany, 1981; pp. 21–25. [Google Scholar]
- Martins-Loução, M.A.; Brito de Carvalho, J.H. A Cultura da Alfarrobeira; Direcção Geral de Planeamento e Agricultura: Lisboa, Portugal, 1989; ISSN 0870-967 X. Available online: https://www.semanticscholar.org/paper/A-cultura-da-alfarrobeira-Lou%C3%A7%C3%A3o-Carvalho/48856562cbd8f4e387073ccf17e52b2d0ec0ccb8 (accessed on 15 June 2024).
- Mitrakos, K.; Diamantoglou, S.; Christodoulakis, N.S. Distribution patterns of four evergreen sclerophyllous species in Greece. Bot. Jahrb. Syst. 1991, 113, 1–6. [Google Scholar]
- Larcher, W.; Mair, B. Die Temperaturresistenz als okophysiologisches Konstitutionsmerkmal. Quercus ilex und andere Eichenarten des Mittelmeergebietes. Oecol. Plant 1969, 4, 347–376. [Google Scholar]
- Larcher, W. Temperature stress and survival ability of Mediterranean sclerophyllous plants. Plant Biosyst. 2000, 134, 279–295. [Google Scholar] [CrossRef]
- Kopeć, P. Climate Change—The Rise of Climate-Resilient Crops. Plants 2024, 13, 490. [Google Scholar] [CrossRef]
- Mooney, H.A.; Dunn, E.L. Convergent evolution of the Mediterranean climate evergreen sclerophyll shrubs. Evolution 1970, 24, 292–303. [Google Scholar] [CrossRef]
- Mooney, H.A.; Dunn, E.L. Photosynthetic systems of Mediterranean-climate shrubs and trees of California and Chile. Am. Nat. 1970, 104, 447–453. [Google Scholar] [CrossRef]
- Di Castri, F.; Mooney, H.A. Mediterranean Type Ecosystems: Origin and Structure; Springer: Berlin/Heidelberg, Germany; New York, NY, USA, 1973. [Google Scholar]
- Christodoulakis, N.S. Structural diversity and adaptations in some Mediterranean evergreen sclerophyllous species. Environ. Exp. Bot. 1992, 32, 295–305. [Google Scholar] [CrossRef]
- Christodoulakis, N.S. An anatomical study of seasonal dimorphism in the leaves of Phlomis fruticosa. Ann. Bot. 1989, 63, 389–394. [Google Scholar] [CrossRef]
- Christodoulakis, N.S.; Bazos, J. Leaf anatomy of three seasonally dimorphic subshrubs. Acta Oecol. 1990, 11, 291–296. [Google Scholar]
- Christodoulakis, N.S.; Fasseas, C. Air pollution effects on the leaf structure of Laurus nobilis, an injury-resistant species. Bull. Environ. Contam. Toxicol. 1990, 44, 276–281. [Google Scholar] [CrossRef] [PubMed]
- Soares, A.R.; Marchiosi, R.; Siqueira-Soares, R.d.C.; Barbosa de Lima, R.; Dantas dos Santos, W.; Ferrarese-Filho, O. The role of L-DOPA in plants. Plant Signal. Behav. 2014, 9, e28275. [Google Scholar] [CrossRef] [PubMed]
- Koes, R.E.; Quattrocchio, F.; Mol, J.N.M. The flavonoid biosynthetic pathway in plants: Function and evolution. BioEssays 1994, 16, 123–132. [Google Scholar] [CrossRef]
- Dement, W.A.; Mooney, H.A. Seasonal variation in the production of tannins and cyanogenic glucosides in the chaparral shrub, Heteromeles arbutifolia. Oecologia 1974, 15, 65–76. [Google Scholar] [CrossRef]
- Orshan, G.; Floret, C.; Floc’h, E.L.; Roux, A.L.; Montenegro, G.; Romane, F. General synthesis. In Plant Phenomorphological Studies in Mediterranean Type Ecosystems; Orshan, G., Ed.; Kluwer Academic Publishers: Dordrecht, The Netherlands, 1989; pp. 389–399. [Google Scholar]
- Dafni, A. Sclerophylly, chemical defense and the evolution of the Mediterranean maqui species. Fl. Veg. Mundi 1991, 9, 167–174. [Google Scholar]
- Fahn, A.; Cutler, D.F. Xerophytes. In Encyclopedia of Plant Anatomy; Borntraeger: Berlin, Germany, 1992; Volume XIII. [Google Scholar]
- Meletiou-Christou, M.S.; Rhizopolou, S.; Diamantoglou, S. Seasonal changes of carbohydrates, lipids and nitrogen content in sun and shade leaves from four Mediterranean evergreen sclerophylls. Environ. Exp. Bot. 1994, 34, 129–140. [Google Scholar] [CrossRef]
- Stephanou, M.; Manetas, Y. The effects of seasons, exposure, enhanced UV-B radiation, and water stress on leaf epicuticular and internal UV-B absorbing capacity of Cistus creticus: A Mediterranean field study. J. Exp. Bot. 1997, 48, 1977–1985. [Google Scholar] [CrossRef]
- Nikolakaki, A.; Christodoulakis, N.S. Secretory structures and cytochemical investigation of the leaf of Phlomis fruticosa, a seasonally dimorphic subshrub. Secreting activity of the leaf-originating calluses. Flora 2007, 202, 429–436. [Google Scholar] [CrossRef]
- Smirnoff, N. Antioxidant Systems and Plant Response to the Environment. In Environment and Plant Metabolism: Flexibility and Acclimation; Smirnoff, V., Ed.; BIOS Scientific Publishers: Oxford, UK, 1995; pp. 217–243. [Google Scholar]
- Munne-Bosch, S.; Nogues, S.; Alegre, L. Diurnal variations of photosynthesis and dew absorption by leaves in two evergreen shrubs growing in Mediterranean field conditions. New Phytol. 1999, 144, 109–119. [Google Scholar] [CrossRef]
- Munné-Bosch, S.; Alegre, L. Subcellular compartmentation of the diterpene carnosic acid and its derivatives in the leaves of rosemary. Plant Physiol. 2001, 125, 1094–1102. [Google Scholar] [CrossRef]
- Deda, O.; Begou, O.; Gika, H.; Theodoridis, G.; Agapiou, A. Optimization of Carob Products Preparation for Targeted LC-MS/MS Metabolomics Analysis. Metabolites 2023, 13, 645. [Google Scholar] [CrossRef] [PubMed]
- Gan, R.-Y.; Li, H.-B.; Sui, Z.-Q.; Corke, H. Absorption, metabolism, anti-cancer effect and molecular targets of epigallocatechin gallate (EGCG): An updated review. Crit. Rev. Food Sci. Nutr. 2018, 58, 924–941. [Google Scholar] [CrossRef]
- Shao, H.B.; Chu, L.Y.; Jaleel, C.A.; Zhao, C.X. Water-deficit stress-induced anatomical changes in higher plants. Comptes Rendus Biol. 2008, 331, 215–225. [Google Scholar] [CrossRef]
- Munné-Bosch, S. The role of α-tocopherol in plant stress tolerance. J. Plant Physiol. 2005, 162, 743–748. [Google Scholar] [CrossRef]
- Tomasi, P.; Luo, Z.; Abdel-Haleem, H. Drought and high heat stresses modify Brassica napus L. leaf cuticular wax. Plant Stress 2024, 13, 100513. [Google Scholar] [CrossRef]
- Capaldi, F.R.; Gratão, P.L.; Reis, A.R.; Lima, L.W.; Azevedo, R.A. Sulfur metabolism and stress defense responses in plants. Trop. Plant Biol. 2015, 8, 60–73. [Google Scholar] [CrossRef]
- Sharma, P.; Lakra, N.; Goyal, A.; Ahlawat, Y.K.; Zaid, A.; Siddique, K.H.M. Drought and heat stress mediated activation of lipid signaling in plants: A critical review. Front. Plant Sci. 2023, 14, 1216835. [Google Scholar] [CrossRef]
- Yuan, Z.; Duan, H.; Xu, Y.; Wang, A.; Gan, L.; Li, J.; Liu, M.; Shang, X. α-Tocospiro C, a novel cytotoxic α-tocopheroid from Cirsium setosum. Phytochem. Lett. 2014, 8, 116–120. [Google Scholar] [CrossRef]
- Munné-Bosch, S.; Alegre, L. Drought-induced changes in the redox state of α-tocopherol, ascorbate and the diterpene carnosic acid in chloroplasts of Labiatae species differing in carnosic acid contents. Plant Physiol. 2003, 131, 1816–1825. [Google Scholar] [CrossRef]
- Munné-Bosch, S.; Falk, J. New insights into the function of tocopherols in plants. Planta 2004, 218, 323–326. [Google Scholar] [CrossRef]
- Orabi, S.A.; Abdelhamid, M.T. Protective role of α-tocopherol on two Vicia faba cultivars against seawater-induced lipid peroxidation by enhancing capacity of antioxidative system. J. Saudi Soc. Agric. Sci. 2016, 15, 145–154. [Google Scholar] [CrossRef]
- El-Quesni, F.E.M.; Abd El-Aziz, N.G.; Kandil, M.M. Some studies on the effect of ascorbic acid and α-tocopherol on the growth and some chemical composition of Hibiscus rosa-sinensis L. Nubaria. Ozean J. Appl. Sci. 2009, 2, 156–167. [Google Scholar]
- Akram, N.A.; Bashir, R.; Ashraf, G.; Bashir, S.; Ashraf, M.; Alyemeni, M.N.; Bajguz, A.; Ahmad, P. Exogenous α-tocopherol regulates the growth and metabolism of eggplant (Solanum melongena L.) under drought stress. Plants 2023, 12, 237. [Google Scholar] [CrossRef] [PubMed]
- Kaplan, F.; Guy, C.L. β-Amylase induction and the protective role of maltose during temperature shock. Plant Physiol. 2004, 135, 1674–1684. [Google Scholar] [CrossRef]
- Agati, G.; Stefano, G.; Biricolti, S.; Tattini, M. Mesophyll distribution of ‘antioxidant’ flavonoid glycosides in Ligustrum vulgare leaves under contrasting sunlight irradiance. Ann. Bot. 2009, 104, 853–861. [Google Scholar] [CrossRef]
- Agati, G.; Biricolti, S.; Guidi, L.; Ferrini, F.; Fini, A.; Tattini, M. The biosynthesis of flavonoids is enhanced similarly by UV radiation and root zone salinity in L. vulgare leaves. J. Plant Physiol. 2011, 168, 204–212. [Google Scholar] [CrossRef]
- Agurla, S.; Gahir, S.; Munemasa, S.; Murata, Y.; Raghavendra, A.S. Mechanism of stomatal closure in plants exposed to drought and cold stress. In Survival Strategies in Extreme Cold and Desiccation. Advances in Experimental Medicine and Biology; Iwaya-Inoue, M., Sakurai, M., Uemura, M., Eds.; Springer: Singapore, 2018; Volume 1081. [Google Scholar] [CrossRef]
- Ullah, S.; Khan, M.N.; Lodhi, S.S.; Ahmed, I.; Tayyab, M.; Mehmood, T.; Din, I.U.; Khan, M.; Sohail, Q.; Akram, M. Targeted metabolomics reveals fatty acid abundance adjustments as playing a crucial role in drought-stress response and post-drought recovery in wheat. Front. Genet. 2022, 10, 972696. [Google Scholar] [CrossRef]
- Osório, M.L.; Osório, J.; Vieira, A.C. Influence of enhanced temperature on photosynthesis, photooxidative damage, and antioxidant strategies in Ceratonia siliqua L. seedlings subjected to water deficit and rewatering. Photosynthetica 2011, 49, 3–12. [Google Scholar] [CrossRef]
- Li, X.; Li, M.H.; Deng, W.W.; Ahammed, G.J.; Wei, J.P.; Yan, P.; Zhang, L.P.; Fu, J.Y.; Han, W.Y. Exogenous melatonin improves tea quality under moderate high temperatures by increasing epigallocatechin-3-gallate and theanine biosynthesis in Camellia sinensis L. J. Plant Physiol. 2020, 253, 153273. [Google Scholar] [CrossRef]
- Zhang, X.N.; Liao, Y.W.; Wang, X.R.; Zhang, L.; Ahammed, G.J.; Li, Q.Y.; Li, X. Epigallocatechin-3-gallate enhances tomato resistance to tobacco mosaic virus by modulating RBOH1-dependent H2O2 signaling. Plant Physiol. Biochem. 2020, 150, 263–269. [Google Scholar] [CrossRef]
- Li, J.; Yang, Y.; Sun, K.; Chen, Y.; Chen, X.; Li, X. Exogenous melatonin enhances cold, salt, and drought stress tolerance by improving antioxidant defense in tea plant (Camellia sinensis (L.) O. Kuntze). Molecules 2019, 24, 1826. [Google Scholar] [CrossRef]
- Keunen, E.; Peshev, D.; Vangronsveld, J.; Van Den Ende, W.; Cuypers, A. Plant sugars are crucial players in the oxidative challenge during abiotic stress: Extending the traditional concept. Plant Cell Environ. 2013, 36, 1242–1255. [Google Scholar] [CrossRef] [PubMed]
- Al Mamari, H.H. Phenolic compounds: Classification, chemistry, and updated techniques of analysis and synthesis. In Phenolic Compounds: Chemistry, Synthesis, Diversity, Non-Conventional Industrial, Pharmaceutical and Therapeutic Applications; IntechOpen: Rijeka, Croatia, 2021; pp. 73–94. [Google Scholar] [CrossRef]
- Parvin, K.; Nahar, K.; Mohsin, S.M.; Al Mahmud, J.; Fujita, M.; Hasanuzzaman, M. Plant Phenolic Compounds for Abiotic Stress Tolerance. In Managing Plant Production Under Changing Environment; Hasanuzzaman, M., Ahammed, G.J., Nahar, K., Eds.; Springer: Singapore, 2022. [Google Scholar] [CrossRef]
- Kumar, K.; Debnath, P.; Singh, S.; Kumar, N. An Overview of Plant Phenolics and Their Involvement in Abiotic Stress Tolerance. Stresses 2023, 3, 570–585. [Google Scholar] [CrossRef]
- Wang, L.; Di, T.; Peng, J.; Li, Y.; Li, N.; Hao, X.; Ding, C.; Huang, J.; Zeng, J.; Yang, Y.; et al. Comparative metabolomic analysis reveals the involvement of catechins in adaptation mechanism to cold stress in tea plant (Camellia sinensis var. sinensis). Environ. Exp. Bot. 2022, 201, 104978. [Google Scholar] [CrossRef]
- Michel, T.; Halabalaki, M.; Skaltsounis, A.-L. New concepts, experimental approaches, and dereplication strategies for the discovery of novel phytoestrogens from natural sources. Planta Med. 2013, 79, 514–532. [Google Scholar] [CrossRef]
- Caesar, L.K.; Cech, N.B. Synergy and antagonism in natural product extracts: When 1 + 1 does not equal 2. Nat. Prod. Rep. 2019, 36, 869–888. [Google Scholar] [CrossRef]
- Larcher, W. Low temperature effects on Mediterranean sclerophylls: An unconventional viewpoint. In Components of Productivity of Mediterranean-Climate Regions–Basic and Applied Aspects, Proceedings of the International Symposium on Photosynthesis, Primary Production and Biomass Utilization in Mediterranean-Type Ecosystems, Kassandra, Greece, 13–15 September 1980; Margaris, N.S., Mooney, H.A., Eds.; Springer: Dordrecht, The Netherlands, 1980; pp. 259–266. [Google Scholar] [CrossRef]
- Fontana, R.; Macchi, G.; Caproni, A.; Sicurella, M.; Buratto, M.; Salvatori, F.; Pappadà, M.; Manfredini, S.; Baldisserotto, A.; Marconi, P. Control of Erwinia amylovora growth by Moringa oleifera leaf extracts: In vitro and in planta effects. Plants 2022, 11, 957. [Google Scholar] [CrossRef]
- APAT (Agency for the Protection of the Environment and for Technical Services). Seed Propagation of Mediterranean Trees and Shrubs; APAT: Roma, Italy, 2003; ISBN 88-448-0081-0. [Google Scholar]
- Mitrakos, K. The Botany of Ceratonia. In Proceedings of the 2nd International Carob Symposium, Generalitat Valenciana, Conselleriad’ Agricultura I Pesca, Valencia, Spain, 29 September–1 October 1987; pp. 209–218. [Google Scholar]
- Martins-Loução, M.A. Carob (Ceratonia siliqua L.). In Legumes and Oilseed Crops I. Biotechnology in Agriculture and Forestry; Bajaj, Y.P.S., Ed.; Springer: Berlin/Heidelberg, Germany, 1990; Volume 10, pp. 658–675. [Google Scholar] [CrossRef]
- Tsakaldimi, M.N.; Ganatsas, P.P. Treatments improving seeds germination of two Mediterranean sclerophyll species, Ceratonia siliqua and Pistacia lentiscus. In Proceedings of the 3rd Balkan Scientific Conference, Sofia, Bulgaria, 2–6 October 2001; Volume II, pp. 119–127. [Google Scholar]
- Ortiz, P.L.; Arista, M.; Talavera, S. Germination ecology of Ceratonia siliqua L. (Caesalpiniaceae), a Mediterranean tree. Flora 1995, 190, 89–95. [Google Scholar] [CrossRef]
- Reynolds, E.S. The use of lead citrate at a high pH as an electron opaque stain in electron microscopy. J. Cell Biol. 1963, 17, 208–212. [Google Scholar] [CrossRef]
- Christodoulakis, N.S.; Lampri, P.-N.; Fasseas, C. Structural and cytochemical investigation on the leaf of silverleaf nightshade (Solanum elaeagnifolium), a drought-resistant alien weed of the Greek flora. Aust. J. Bot. 2009, 57, 432–438. [Google Scholar] [CrossRef]
- Christodoulakis, N.S.; Kogia, D.; Mavroeidi, D.; Fasseas, C. Anatomical and cytochemical investigation on the leaf of Teucrium polium L., a pharmaceutical shrub of the Greek phryganic formations. J. Biol. Res. 2010, 14, 199–209. [Google Scholar]
- Gechev, T.; Mehterov, N.; Denev, I.; Hille, J. A simple and powerful approach for isolation of Arabidopsis mutants with increased tolerance to H2O2. In Induced Cell Death Methods in Enzymology; Elsevier Inc.: Amsterdam, The Netherlands, 2013; pp. 203–220. [Google Scholar] [CrossRef]
- Lichtenthaler, H.K.; Buschmann, C. Determinations of total carotenoids and chlorophylls a and b of leaf extracts in different solvents. Biochem. Soc. Trans. 1983, 11, 591–592. [Google Scholar] [CrossRef]
- Taulavuori, E.; Hellström, E.K.; Taulavuori, K.; Laine, K. Comparison of two methods used to analyse lipid peroxidation from Vaccinium myrtillus (L.) during snow removal, reacclimation and cold acclimation. J. Exp. Bot. 2001, 52, 2375–2380. [Google Scholar] [CrossRef]
- Singleton, V.L.; Rossi, J.A. Colorimetry of total phenolics with phosphomolybdic-phosphotungstic acid reagents. Am. J. Enol. Vitic. 1965, 16, 144–158. [Google Scholar] [CrossRef]
- Waterman, P.G.; Mole, S. Analysis of Phenolic Plant Metabolites; Blackwell: Oxford, UK, 1994. [Google Scholar]
- Varympopi, A.; Dimopoulou, A.; Theologidis, I.; Karamanidou, T.; Kaldeli Kerou, A.; Vlachou, A.; Karfaridis, D.; Papafotis, D.; Hatzinikolaou, D.G.; Tsouknidas, A.; et al. Bactericides based on copper nanoparticles restrain growth of important plant pathogens. Pathogens 2020, 9, 1024. [Google Scholar] [CrossRef]
- Pedregosa, F.; Varoquaux, G.; Gramfort, A.; Michel, V.; Thirion, B.; Grisel, O.; Blondel, M.; Prettenhofer, P.; Weiss, R.; Dubourg, V.; et al. SciKit-Learn: Machine Learning in Python. arXiv 2012, arXiv:1201.0490. [Google Scholar]
- Papadopoulou, S.; Stefi, A.L.; Meletiou-Christou, M.-S.; Christodoulakis, N.S.; Gkikas, D.; Rhizopoulou, S. Structural and physiological traits of compound leaves of Ceratonia siliqua trees grown in urban and suburban ambient conditions. Plants 2023, 12, 514. [Google Scholar] [CrossRef]


| Species | Leaves | Leaf Buds | Stem Cambium | Stem Xylem |
|---|---|---|---|---|
| Ceratonia siliqua | −6 | −8 | −9 | −11 |
| Nerium oleander | −8 | −12 | −14 | −15 |
| Myrtus communis | −12 | −11 | −17 | −15 |
| Laurus nobilis | −12 | −10 | −14 | −16 |
| Olea europaea | −12 | −13 | −20 | −18 |
| Quercus coccifera | −12 | −13 | −21 | −22 |
| Quercus suber | −12 | −16 | −26 | −22 |
| Arbutus unedo | −12 | −17 | −18 | −16 |
| Rhamnus alaternus | −12 | −18 | −17 | −16 |
| Viburnum tinus | −13 | −15 | −20 | −17 |
| Pistacia lentiscus | −14 | −16 | −20 | −17 |
| Quercus ilex | −15 | −17 | −28 | −26 |
| Phillyrea latifolia | −16 | −20 | −23 | −22 |
| Pinus pinea | −13 | −16 | −19 | −17 |
| Pinus halepensis | −13 | - | −22 | −18 |
| Cupressus sempervirens | −16 | - | −29 | −22 |
| μm | Thickness of the Adaxial Epidermis | Thickness of the Abaxial Epidermis | Thickness of the Palisade Parenchyma | Total Leaf Thickness | |
|---|---|---|---|---|---|
| Treatment | |||||
| C. siliqua control | 43 ± 7 a | 27 ± 6 | 84 ± 12 | 282 ± 15 a | |
| C. siliqua cold-treated | 30 ± 5 b | 20 ± 5 | 69 ± 15 | 180 ± 12 b | |
| C. siliqua heat-treated | 38 ± 3 ab | 24 ± 6 | 75 ± 11 | 213 ± 16 b | |
| ID | Mode | Compound | RT (min) | Exp. m/z | Theor. m/z | Δm (ppm) | Formula | RDB | Fragment Mass | Chemical Class |
|---|---|---|---|---|---|---|---|---|---|---|
| 1 | Neg | Disaccharide (Maltose) | 0.88 | 341.10904 | 341.1089 | 0.4 | C12H22O11 | 2.5 | 179.0562/161.0456/281.0885 | Carbohydrates and carbohydrate conjugates |
| 2 | Pos | Thymine | 0.89 | 127.0502 | 127.0502 | 0.0 | C5H6N2O2 | 3.5 | 84.0445/109.0399 | Pyrimidines and pyrimidine derivatives |
| 3 | Neg | Di-galloyl-glucose (isomer 1) | 0.94 | 483.0771 | 483.0769 | 0.4 | C20H19 O14 | 11.5 | 331.0667/313.0562/169.0140 | Tannins |
| 4 | Pos | Loliolide | 1.13 | 197.1172 | 197.1172 | 0.0 | C11H16O3 | 3.5 | 179.1068/135.1169/161.0962 | Benzofurans |
| 5 | Neg | Glucogallin | 1.22 | 331.0664 | 331.066 | 1.2 | C13H15O10 | 6.5 | 271.0456/211.0245/169.0140 | Tannins |
| 6 | Neg | Di-galloyl-glucose (isomer 2) | 1.29 | 483.0771 | 483.0769 | 0.4 | C20H19O14 | 11.5 | 331.0667/313.0562/169.0140 | Tannins |
| 7 | Neg | Di-galloyl-glucose (isomer 3) | 1.60 | 483.0771 | 483.0769 | 0.4 | C20H19O14 | 11.5 | 331.0667/313.0562/169.0140 | Tannins |
| 8 | Neg | 6-O-(hydroxybenzoyl)hexopyranosyl 6-O-(trihydroxybenzoyl)hexopyranoside | 2.5 | 443.1191 | 443.1184 | 1.6 | C19H23O12 | 8.5 | 331.0669/313.0564/193.0141 | |
| 9 | Neg | Methyl gallate | 4.23 | 183.0296 | 183.0288 | 4.4 | C8H7O5 | 5.5 | x | Benzoic acids and derivatives |
| 10 | Neg | Tri-galloyl-glucose | 4.35/5.04 | 635.0877 | 635.0879 | −0.3 | C27H23O18 | 16.5 | 465.0668/421.0773 | Tannins |
| 11 | Neg | epigallocatechin gallate | 5.07 | 457.07742 | 457.0765 | 2.0 | C22H17O11 | 14.5 | x | Flavans (catechin gallates) |
| 12 | Neg | Tetra-galloyl-glucose | 5.57 | 787.0984 | 787.0988 | −0.5 | C34H27O22 | 21.5 | 635.0887/617.0782/465.0676 | Tannins |
| 13 | Neg | Myricitrin | 5.73 | 463.0877 | 463.0871 | 1.3 | C21H19O12 | 12.5 | 317.0298/316.0221 | Flavonoid glycosides |
| 14 | Neg | Quercitrin | 6.22 | 447.0928 | 447.0922 | 1.3 | C21H19O11 | 12.5 | 301.0352 | Flavonoid glycosides |
| 15 | Neg | Azelaic acid | 6.42 | 187.0976 | 187.0976 | 0.2 | C9H16O4 | 2.5 | 125.0971/143.1077/169.0871 | Medium-chain fatty acids |
| 16 | Pos | Gingerol | 6.58/10.09 | 293.1758 | 293.1758 | 0.0 | C17H26O4 | 5.5 | 221.1547 | Methoxyphenols |
| 17 | Neg | 5,8,12-Trihydroxy-9-octadecenoic acid | 8.39 | 329.2333 | 329.2333 | −0.1 | C18H34O5 | 2.5 | 311.2231/171.1027 | Long-chain fatty acids |
| 18 | Pos | Pipericine | 8.44 | 336.3260 | 336.3261 | −0.3 | C22H41NO | 2.5 | 319.3001/301.2896 | Fatty amides |
| 19 | Pos | LysoPG(16:0/0:0) | 8.78 | 485.2885 | 485.2874 | 2.3 | C22H45O9P | 0.5 | 351.1803/467.2787 | Glycerophosphoglycerols |
| 20 | Neg | 13(S)-Hydroperoxylinolenic acid | 8.97 | 309.2071 | 309.2071 | 0.0 | C18H30O4 | 4.5 | 291.1967/239.1655/183.1029/273.1864 | Lineolic acids and derivatives |
| 21 | Neg | [6]-Gingerdiol D-glucopyranoside | 9.12 | 457.2442 | 457.2443 | −0.2 | C23H38O9 | 5.5 | 181.0719 | Fatty acyl glycosides |
| 22 | Pos | MG(16:0/0:0/0:0) | 10.18 | 313.2734 | 313.2743 | −2.9 | C19H38O4 | 1.5 | 257.2477/239.2371 | Monoradylglycerols |
| 23 | Neg | Octadecenedioic acid | 10.34 | 311.2227 | 311.2228 | −0.3 | C18H32O4 | 3.5 | 293.2124 | Long-chain fatty acids |
| 24 | Pos | [12]-Gingerdiol | 11.24 | 381.2995 | 381.2999 | −1.0 | C23H40O4 | 3.5 | 265.2556/165.1638/135.1169/121.1012 | Methoxyphenols |
| 25 | Neg | Pomolic acid | 11.62 | 471.3483 | 471.3480 | 0.6 | C30H48O4 | 7.5 | 425.3427/339.2694 | Triterpenoids |
| 26 | Pos | Ganoderol B | 12.32 | 423.3613 | 423.3627 | −3.3 | C30H48O2 | 7.5 | 405.3515/189.1638/283.2421 | Triterpenoids |
| Indicator Strains | Media | Incubation Temperature | Accession Number |
|---|---|---|---|
| Bacillus subtilis | Luria-Bertani (LB) agar/broth | 30 °C | DSM10 |
| Escherichia coli | Luria-Bertani (LB) agar/broth | 37 °C | DSM6897 |
| Pseudomonas aeruginosa | Luria-Bertani (LB) agar/broth | 30 °C | DSM50071 |
| Candida albicans | YPD agar/broth | 37 °C | DSM1386 |
| Staphylococcus aureus | Luria-Bertani (LB) agar/broth | 37 °C | DSM346 |
| Saccharomyces cerevisiae | YPD agar/broth | 30 °C | DSM1333 |
| Xanthomonas campestris pv. campestris | Luria-Bertani (LB) agar/broth | 30 °C | 1656 BPIC |
| Pseudomonas syrigae pv. syringae | Luria-Bertani (LB) agar/broth | 30 °C | - |
| Erwinia amylovora | Luria-Bertani (LB) agar/broth | 30 °C | 842 BPIC |
Disclaimer/Publisher’s Note: The statements, opinions and data contained in all publications are solely those of the individual author(s) and contributor(s) and not of MDPI and/or the editor(s). MDPI and/or the editor(s) disclaim responsibility for any injury to people or property resulting from any ideas, methods, instructions or products referred to in the content. |
© 2025 by the authors. Licensee MDPI, Basel, Switzerland. This article is an open access article distributed under the terms and conditions of the Creative Commons Attribution (CC BY) license (https://creativecommons.org/licenses/by/4.0/).
Share and Cite
Stefi, A.L.; Kalampokis, E.; Ntroumpogianni, G.C.; Katsiadrami, I.; Nikou, T.; Katsifas, E.A.; Gkikas, D.; Christodoulakis, N.S.; Halabalaki, M. The Impact of Temperature on the Leaves of Ceratonia siliqua L.: Anatomical Aspect, Secondary Metabolite Analysis, and Antimicrobial Activity of the Extracts. Plants 2025, 14, 557. https://doi.org/10.3390/plants14040557
Stefi AL, Kalampokis E, Ntroumpogianni GC, Katsiadrami I, Nikou T, Katsifas EA, Gkikas D, Christodoulakis NS, Halabalaki M. The Impact of Temperature on the Leaves of Ceratonia siliqua L.: Anatomical Aspect, Secondary Metabolite Analysis, and Antimicrobial Activity of the Extracts. Plants. 2025; 14(4):557. https://doi.org/10.3390/plants14040557
Chicago/Turabian StyleStefi, Aikaterina L., Evangelos Kalampokis, Georgia C. Ntroumpogianni, Iliana Katsiadrami, Theodora Nikou, Efstathios A. Katsifas, Dimitrios Gkikas, Nikolaos S. Christodoulakis, and Maria Halabalaki. 2025. "The Impact of Temperature on the Leaves of Ceratonia siliqua L.: Anatomical Aspect, Secondary Metabolite Analysis, and Antimicrobial Activity of the Extracts" Plants 14, no. 4: 557. https://doi.org/10.3390/plants14040557
APA StyleStefi, A. L., Kalampokis, E., Ntroumpogianni, G. C., Katsiadrami, I., Nikou, T., Katsifas, E. A., Gkikas, D., Christodoulakis, N. S., & Halabalaki, M. (2025). The Impact of Temperature on the Leaves of Ceratonia siliqua L.: Anatomical Aspect, Secondary Metabolite Analysis, and Antimicrobial Activity of the Extracts. Plants, 14(4), 557. https://doi.org/10.3390/plants14040557