Article

Theoretical Analyses of Turgor Pressure and Expansive Growth Rate of Plant Cells During Water Deficit

by
Joseph K. E. Ortega
Department of Mechanical Engineering, University of Colorado Denver, Denver, CO 80217-3364, USA
Plants 2025, 14(22), 3538; https://doi.org/10.3390/plants14223538
Submission received: 15 October 2025 / Revised: 11 November 2025 / Accepted: 14 November 2025 / Published: 20 November 2025
(This article belongs to the Section Plant Modeling)

Abstract

Expansive plant growth during water deficit is common in temperate and extreme climates. Understanding how the turgor pressure, P, behaves during water deficit is essential for a better understanding of expansive growth rate, v. Here, validated biophysical equations together with dimensional analyses are used to simulate water deficit and determine the behavior of P and v. A dimensionless number, Πpw, helps simplify the biophysical equations and interpret the results. The magnitude of Πpw increases as water deficit severity increases. Analyses reveal that both P and v decrease curvilinearly as Πpw increases. Simple mathematical relationships between P, v, and Πpw, are derived, providing a clear and quantitative understanding of how P and v change as water deficits become more severe. Additionally, it is shown how the results of these analyses can be used to assess P and v of roots growing in water deficit.

1. Introduction

Early in life we learn that water is required for plant growth. We learn that plants can grow when water is limited but not when it is absent. And we observe how plants that lack water become limp and less turgid. Of course, a much better understanding is needed to improve our ability to address many important problems such as crop production in adverse conditions and climate change [1]. With the introduction of new tools over the past century, a considerable amount of molecular and genetic research has been conducted to understand plant growth in water deficits, e.g., [2,3,4]. However, our understanding of the behavior and regulation of turgor pressure and expansive growth during water deficit is far from satisfactory. In a 1973 review, Hsiao [5] noted that “with the shift of attention to metabolic and molecular aspects of stress physiology in the mid-1960s, the importance of water uptake and the resulting turgor as a physical force needed for cell growth has at times been almost overlooked or ignored.” And in 2024 after quoting Hsiao [5], Voothuluru et al. [6] stated that “Arguably, the same statement could still be made today, and the role of turgor as well as mechanisms of turgor regulation and turgor sensing remain important areas for further investigation.” Other recent reviews echo the need for a better understanding of turgor pressure behavior and regulation in plant growth [7,8].
A problem in the pursuit of a better understanding is that water deficits can elicit many responses from plants, not all of which are directly relevant to growth. In addition, of those responses related to growth, some are biologically active, and others are biologically passive. In this study, biologically active responses are defined as those that change the biophysical properties of the organelles involved in expansive growth during water deficits, i.e., those responses that elicit a change in osmotic pressure, water transport properties of the plasma membrane, and mechanical properties of the cell wall. In contrast, biological passive responses are defined as those where the biophysical properties of the relevant organelles remain relatively constant during water deficits. The biological passive responses can be complicated and can appear to be biologically active responses. Therefore, it is important to have a good theoretical understanding of biological passive responses when water is limited, so that biologically active responses can be distinguished from biologically passive responses.
The overall objective of this study is to provide a quantitative understanding of biological passive responses of turgor pressure and expansive growth rate to water deficits and demonstrate how active responses to water deficits can be detected. The specific objective is to modify validated biophysical equations to reveal the relationship between the turgor pressure, expansive growth rate, and severity of water deficit, and then demonstrate how active changes in the biophysical properties of relevant organelles can be detected using these mathematical relationships.

1.1. Biophysical Perspective of Expansive Growth

Plants increase in size by permanently increasing the volume of their constitutive cells, i.e., expansive growth. From a biophysical perspective, two organelles are predominately involved in expansive growth, the plasma membrane and the cell wall. The plasma membrane encloses the protoplast and a wall chamber encloses the plasma membrane. The plasma membrane is a bilipid membrane embedded with a variety of large and small protein molecules, some of which are water channels (aquaporins) that make the membrane semi-permeable [9]. The wall chamber is composed of polysaccharide networks embedded with proteins [10]. Expansive growth requires the wall chamber to undergo irreversible (plastic) deformation in order to permanently increase the volume of the cell.
Turgor pressure, P (the pressure difference inside, Pi, and outside, Po, of the plasma membrane; P = PiPo), provides the force for the wall deformation, F = PA (bold letters represent vectors). And water uptake by osmosis produces the P. In a model (ideal) nongrowing plant cell, the P is equal to the osmotic pressure difference, Δπ = πiπo. In a growing cell, wall stress relaxation reduces the P to produce water flow into the cell, i.e., water uptake. The rate of water uptake is related to the magnitude of the difference between Δπ and P, and the magnitude of the relative hydraulic conductance of the plasma membrane, L. The magnitude of L is related to the number of aquaporins in the plasma membrane (see Appendix A for definitions of variables and units).
P stresses the wall and produces reversible (elastic) deformation. When P exceeds a magnitude, PC (critical turgor pressure), the wall deformation is both elastic and plastic. Plastic deformation of the wall is produced and regulated by breaking load-bearing bonds between wall polymers (wall loosening) using protein catalyst such as expansins and enzymes, and/or changing the pH in the wall [10]. The magnitude of the rate of plastic wall deformation is related to a variable termed the relative irreversible wall extensibility: ϕ. The rate of wall loosening is related to the magnitude of ϕ. An increase in ϕ reflects an increase in the rate of wall loosening and an increase in the rate of wall stress relaxation. The increase in wall stress relaxation decreases the P, which increases the rate of water uptake. Together, these processes result in an increase in the plastic deformation rate of the wall chamber and an increase in expansive growth rate, v. An analytic description of this process is presented in [11].

1.2. Biophysical Equations Describing Expansive Growth

A comprehensive understanding of a system and its behavior requires a detailed understanding of its individual components and a quantitative understanding of the relationship between the individual components. In the history of science, relevant interrelated equations, often called governing equations, have proven to be invaluable to a quantitative understanding of system behavior, e.g., Navier-Stokes’ equations in fluid mechanics [12] and Maxwell’s equations in electrodynamics [13]. Throughout the recent decades, biophysical equations that describe expansive growth rate of walled cells have been developed and can act as governing equations. Biophysical equations that describe the biophysical framework presented in the previous section have been derived and validated with experimental results from plant and fungal cells [14,15,16,17,18,19,20]. Although these equations have been reviewed [21,22], a short description of these equations is presented here for the reader’s convenience and for a better understanding of the analyses that follow. The biophysical equations presented here neglect the transpiration water loss from individual cells, which will be the subject of a subsequent theoretical study. The complete set of equations that include a term for transpiration water loss can be found in the following papers [18,19,20,21,22].

1.2.1. Rate of Water Uptake

The rate of change in water volume encompassed by the plasma membrane as a function of time is dVw/dt. The rate of change in relative water volume is; vw = (dVw/dt)/V = dVw/Vdt, where V is the volume of the cell [14].
v w = L   π P
The L is related to the hydraulic conductivity, Lp, of the plasma membrane, L = Lp (A/V) where A is the area of the plasma membrane. Equation (1) states that the relative water uptake rate, vw, is equal to the product of the hydraulic conductance, L, and the difference in the osmotic pressure difference, Δπ, and turgor pressure, P.

1.2.2. Rate of Deformation of the Cell Wall

The rate of change in volume encompassed by the cell wall chamber as a function of time is dVcw/dt. The rate of change in relative volume enclosed by the wall chamber is; vcw = dVcw/Vdt [17].
v c w = ϕ   P P C + 1 ε   d P d t
ε is the volumetric elastic modulus of the wall chamber. Equation (2) states that the relative deformation rate of the wall, vcw, is equal to the sum of the relative plastic deformation rate, ϕ   P     P C , and the relative elastic deformation rate, 1 ε   d P d t . Expansive growth rate of a plant cell requires that the relative plastic deformation rate of the wall is nonzero.

1.2.3. Rate of Change in the Turgor Pressure

An equation describing the rate of change in turgor pressure, dP/dt, can be obtained by recognizing that vw = vcw. Solving for dP/dt, Equation (3) is obtained [17].
d P d t = ε   L π P ϕ   P P C
Equation (3) states that the rate of change of P is equal to the product of the volumetric elastic modulus, ε, and the difference in the relative water uptake rate, L π P , and the relative plastic deformation rate of the wall, ϕ   P   P C .

1.3. Dimensionless Numbers and the Physical Interpretation of the Variables

A dimensionless form of Equations (1)–(3) was obtained using dimensional analyses [23]. The coefficients of the dimensionless terms yield dimensionless groups of variables (Π parameters) that have specific physical interpretations. Prior studies have demonstrated that these Π parameters can be used to provide insight into the biophysical processes involved in expansive growth [23,24,25,26,27,28]. A few Π parameters are important to the analyses conducted here. The subscripts on the Π parameters represent the ratio of specific biophysical processes, e.g., Πpv is interpreted to be the ratio of plastic deformation rate and growth rate in relative volumetric terms, and Πwv is interpreted to be the ratio of the water uptake rate and the growth rate in relative volumetric terms.
Π p v =   ϕ   P C   v s   = 1 h   M P a M P a 1 1 h   =   r e l a t i v e   v o l u m e t r i c   p l a s t i c   d e f o r m a t i o n   r a t e   o f   t h e   w a l l   r e l a t i v e   v o l u m e t r i c   g r o w t h   r a t e
Π w v =   L   P C     v s   = 1 h   M P a M P a 1 1 h   =   r e l a t i v e   v o l u m e t r i c   w a t e r   u p t a k e   r a t e   r e l a t i v e   v o l u m e t r i c   g r o w t h   r a t e
A more relevant Π parameter is obtained by dividing Πpv by Πwv., which yields the dimensionless number, Πpw [25,28].
Π p w = Π p v Π w v =   ϕ   L = 1 h   M P a 1 h   M P a   =   r e l a t i v e   v o l u m e t r i c   p l a s t i c   d e f o r m a t i o n   r a t e   o f   t h e   w a l l   r e l a t i v e   v o l u m e t r i c   w a t e r   u p t a k e   r a t e
In Πpw, it can be seen that ϕ represents the “relative volumetric plastic deformation rate of the wall” and L represent the “relative volumetric water uptake rate”.

1.4. Method

In this study, the biological passive P and v responses to changes in water uptake rates are simulated and analyzed for a model (ideal) plant cell. The results of dimensional analyses are used to interpret the physical meaning of relevant biophysical variables in the biophysical equations. Dimensional analyses show that changing the magnitude of the relative hydraulic conductance of the plasma membrane, L, can simulate changing the relative volumetric water uptake rate. Here, water deficit is simulated by decreasing the magnitude of L. Then, the behavior of P and v are calculated and analyzed. Because the magnitude of L is used to represent the magnitude of “water uptake rate”, the subscripts “w” will be used to remember the “water uptake rate” interpretation; Lw.
It is noted in Equation (2) that the expansive growth rate is related to the magnitude of the plastic deformation rate of the cell wall. And dimensional analyses demonstrate that the magnitude and behavior of ϕ can be used to represent the magnitude and behavior of the plastic deformation rate of the wall. Because the magnitude of ϕ is used to represent the magnitude of “plastic deformation rate of the wall”, the subscripts “p” will be used to remember the “plastic deformation rate of the wall” interpretation; ϕp.

1.5. Overview

It is found that P and v decrease when Lw decreases in magnitude. Also, it is found that P decreases and v increases when ϕp increases in magnitude. When Lw is large (simulating well-watered condition), the decrease in P is small and only slightly reduces the increase in v caused by the increase in ϕp. But when Lw is small (simulating water deficit condition), the decrease in P is large and significantly reduces the increase in v caused by the same increase in ϕp. This complicated behavior is addressed by incorporating the dimensionless number, Π p w =   ϕ p   L w , into relevant biophysical equations [28]. Then, the magnitude of Πpw increases as the severity of water deficit increases. It is shown that P and v decrease curvilinearly as Πpw increases. The converted biophysical equations provide another perspective and approach to analyzing experimental results. This perspective and approach are demonstrated with experimental results from studies of maize primary roots growing in water deficit conditions.

2. Analyses and Results

2.1. Turgor Pressure

The behavior of P as a function of time, P(t), is obtained by solving Equation (3) with the initial condition, P(t = 0) = Po [17].
P t = ( P o P eq ) e   t t c + P e q
Equation (4) describes the exponential change of P from an initial equilibrium constant value, Po, to another equilibrium constant value, Peq. The time constant, tc, for the exponential change is defined by Equation (5).
t c = 1 ε   ϕ p + L w  
The magnitude of Peq is defined by Equation (6).
P e q = L w   Δ π + ϕ p   P C ϕ p + L w
Equations (4)–(6) can be used to study P(t) when Lw, Δπ, ϕp, and PC change in magnitude individually or in combination.

2.2. Turgor Pressure When Lw and ϕp Change

The curves for P(t) in Figure 1 are calculated with Equations (4)–(6) for a model cell that has the biophysical properties similar to those found in growing pea stems, Pisum sativum L. [29]; see Table 1. Each P(t) curve simulates the initiation of elongation growth, at t = 0, by making ϕp = 0.25 h−1 MPa−1 at t = 0 h. Also, each P(t) curve is for a growing cell with a different water uptake rate, i.e., different value of Lw. The top curve (green) represents P(t) during growth in well-watered conditions (Lw = 2.0 h−1 MPa−1), the curve below it (blue) represents P(t) during growth in moderate water deficit (Lw = 0.5 h−1 MPa−1), and the bottom curve (red) represents P(t) during growth in severe water deficit (Lw = 0.025 h−1 MPa−1).
In the top two curves (green and red), the behavior of P(t) is shown after simulated changes in the wall plastic deformation rate, i.e., after different values of ϕp. The value for ϕp increases at t = 0 h and t = 0.75 h and decreases at t = 1.5 h on the time scale. The specific values for all the biophysical variables in each time interval are presented in Table 1.
The following can be observed in Figure 1 and Table 1.
(a)
P(t), Peq, and vs decrease when the rate of water uptake (Lw) decreases.
(b)
P(t) and Peq decrease, and vs increases, when the wall plastic deformation rate (ϕp) increases and Lw remains constant.
(c)
The same increase in ϕp produces a larger decrease in P(t) and Peq when Lw is smaller, and this produces a smaller increase in vs.
(d)
When Lw and/or ϕp decrease, tc increases. In general, changes in P(t) and v(t) take longer to complete when Lw is small.
It is noted that the quantitative information in P(t) is contained in its two components, Peq and tc, see Equations (4)–(6). Therefore, quantitative analyses of P(t) are performed by conducting quantitative analyses of Peq and tc.

2.3. Analyses of the Time Constant, tc

The tc for each curve is calculated using Equation (5) and presented for each time interval in Table 1. Note that the magnitude of tc increases when the term, ε (ϕp + Lw), decreases in magnitude. And the time required for transition between different magnitudes of Peq increases when tc increases. For an exponential change, most of the transition is completed in approximately 4tc. So, time of transition between different magnitudes of Peq can be estimated as 4tc. In general, tc and the transition time increase during water deficit because Lw is always smaller compared to well-watered conditions. Interestingly, plant cells with stiffer walls (larger values for ε) have faster transition times than cells with smaller values for ε. Generally, more mature walls are stiffer than those of growing plant cells.

2.4. Analyses of the Equilibrium Turgor Pressure, Peq

Equation (6) describes Peq. It is noted that Peq is a function of ϕp, Lw, Δπ, and PC. Examination of Equation (6) shows that the relationship between Peq, Δπ, and PC is straight-forward, i.e., Peq increases and decreases when Δπ and PC increase and decrease individually or in combination. However, the relationship between Peq, ϕp, and Lw is more complicated. Graphing Peq as a function of ϕp and Lw requires multiple curves, where one variable (Lw or ϕp) is held constant while the second variable changes. This is similar to what was performed in Figure 1 where Lw is constant for each curve and ϕp is changed (green and blue curves). Importantly, employing a dimensionless number, Π p w =   ϕ   L , allows Equation (6) to be modified so that a single curve can describe Peq when Lw and ϕp change, individually or concurrently [28]. Notice that Πpw increases when ϕ increases and L decreases. Equation (7) is a modified expression for Peq that incorporates Π p w =   ϕ p   L w , (see Appendix B for details).
P e q =   Δ π + Π p w   P C 1 + Π p w
In Equation (7), when Δπ and PC are constant, Peq is only a function of Πpw. Therefore, Peq can be plotted by a single curve. Figure 2 shows that as Πpw increases, Peq decreases curvilinearly. The decrease in Peq is large when Πpw increases from zero to five. The decrease is more gradual for larger values of Πpw. It is noted that Peq approaches PC (PC = 3.0 MPa) as Πpw increases but never becomes PC.
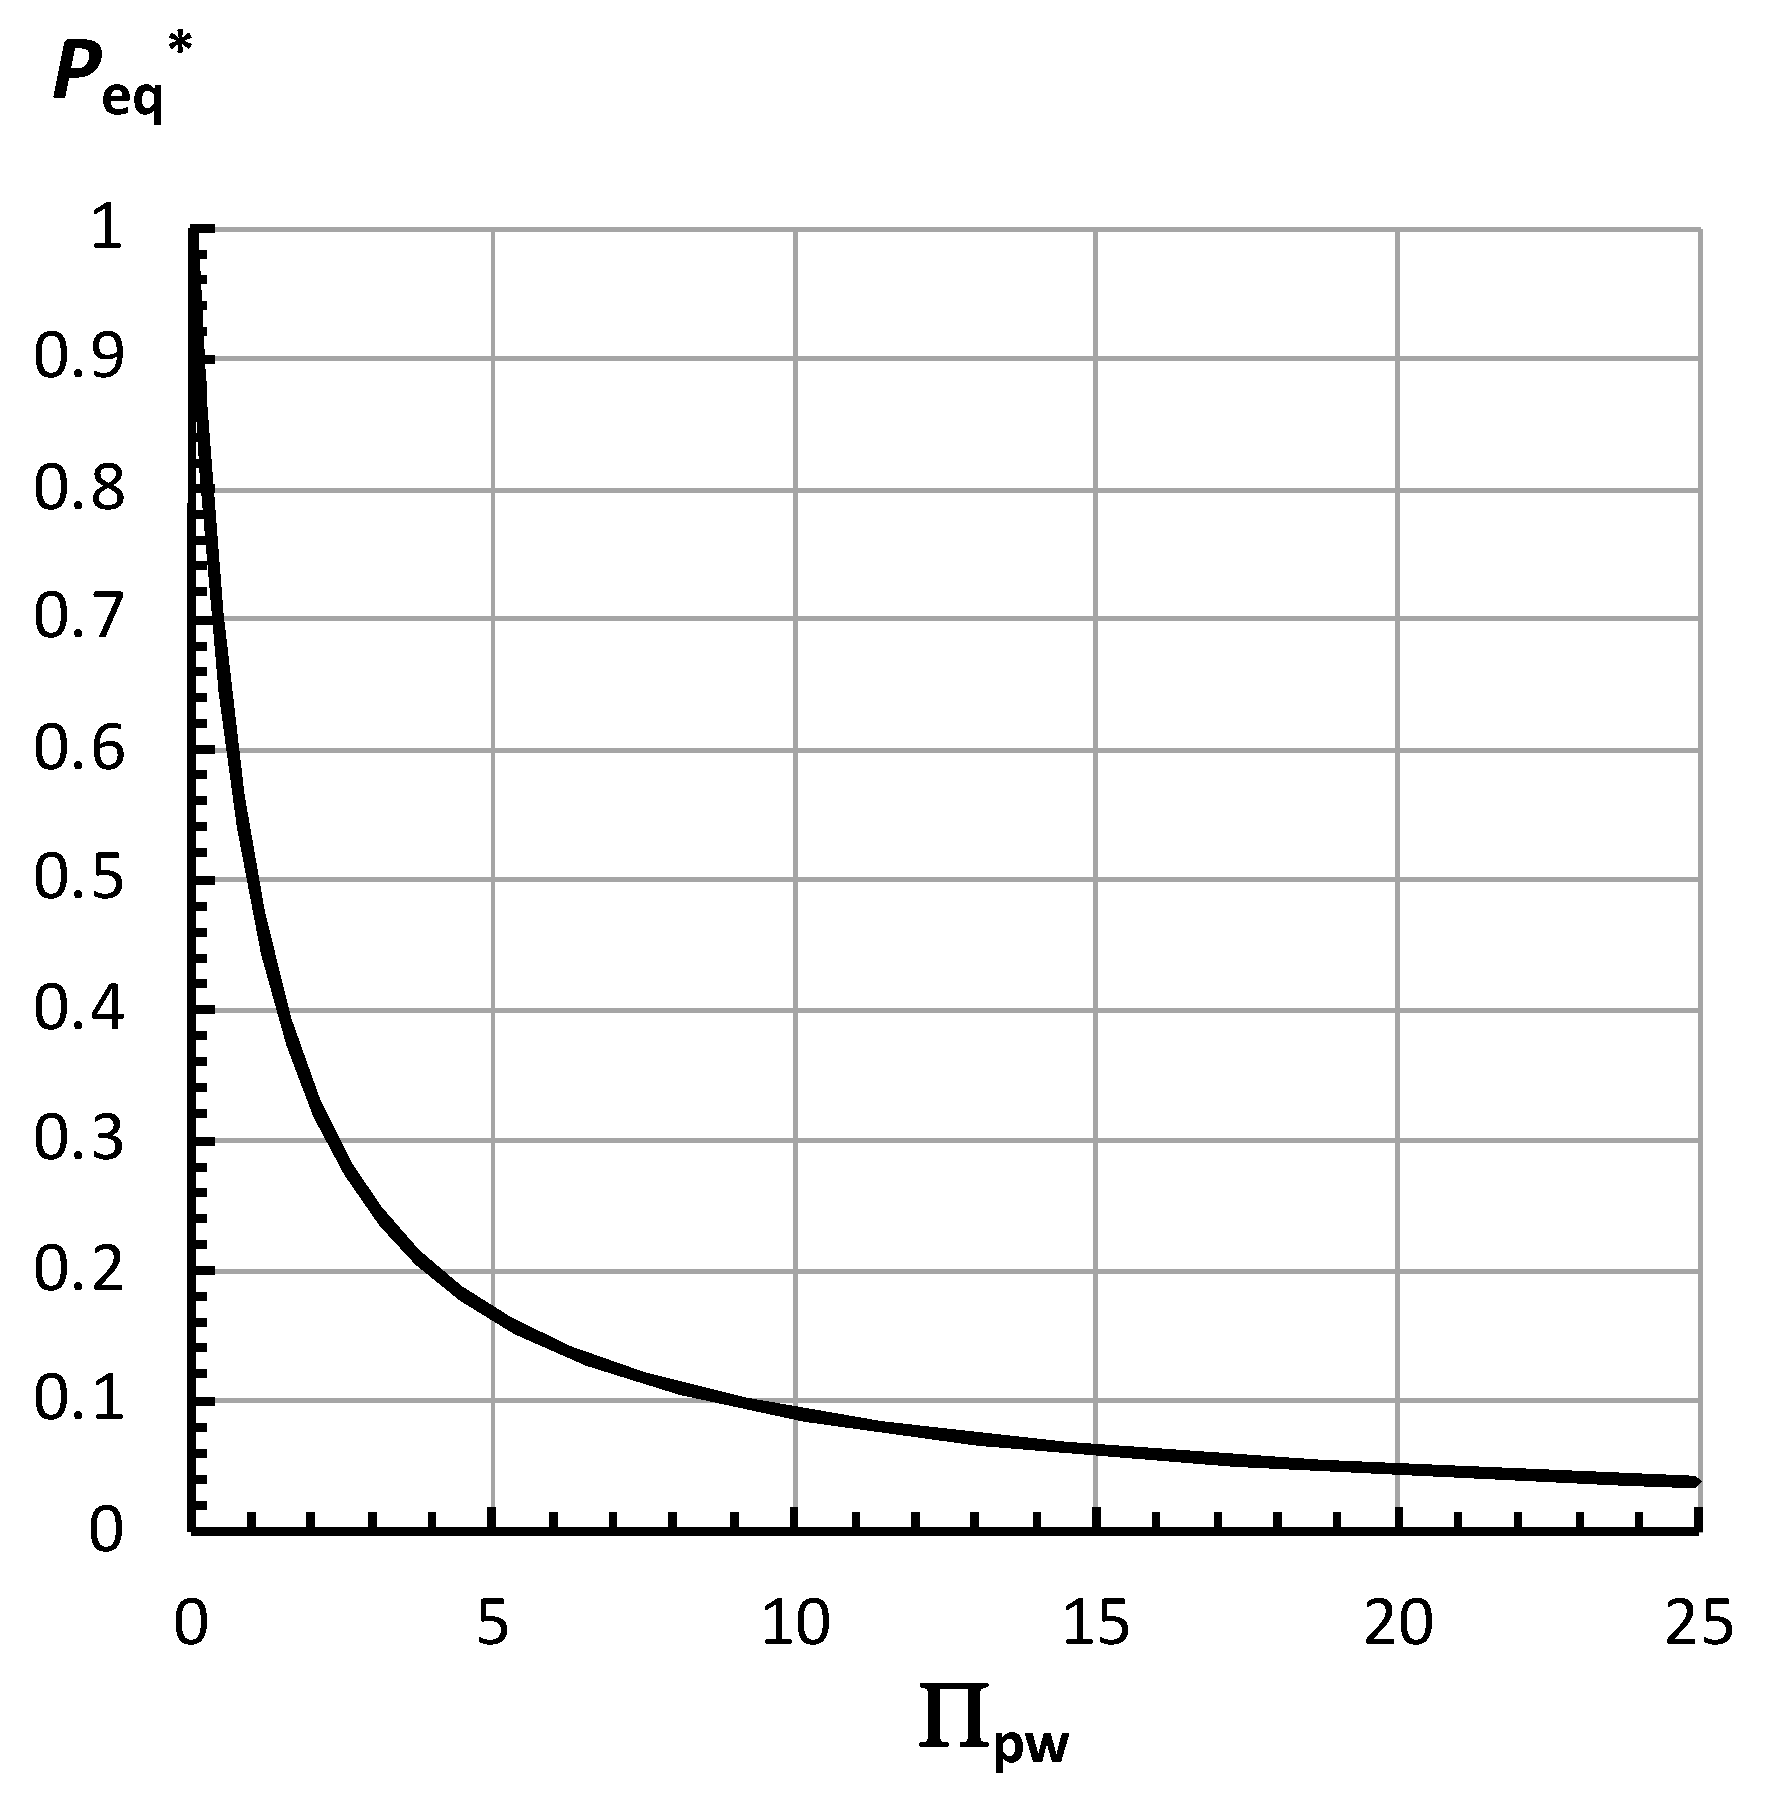
A dimensionless equilibrium turgor pressure, Peq*, as a function of Πpw can be obtained; Equation (8) (see Appendix C for details).
P e q * = P e q P C Δ π P C = 1 1 + Π p w
Figure 3 is a plot of Peq* versus Πpw.
It can be seen that Figure 3 is similar to Figure 2 and that Peq* decreases curvilinearly as Πpw increases. Equation (8) shows that when Πpw increases to very large magnitudes, Peq* becomes very small and approaches zero, but never becomes zero. Note that Peq can be obtained for any value of Πpw from Equation (8), as well as from Equation (7), (see Appendix D for an example).

2.5. Growth Rate for Gradual Changes in P

The relative rate of deformation of the cell wall chamber, vcw, is the sum of the plastic and elastic relative rates of deformation; Equation (2). Because expansive growth is defined as the permanent increase in the size (volume) of a walled cell, only the rate of plastic deformation rate contributes to the expansive growth rate. Equation (9) describes the relative expansive growth rate of a walled cell as a function of time, v(t).
v t = ϕ p   P t P C
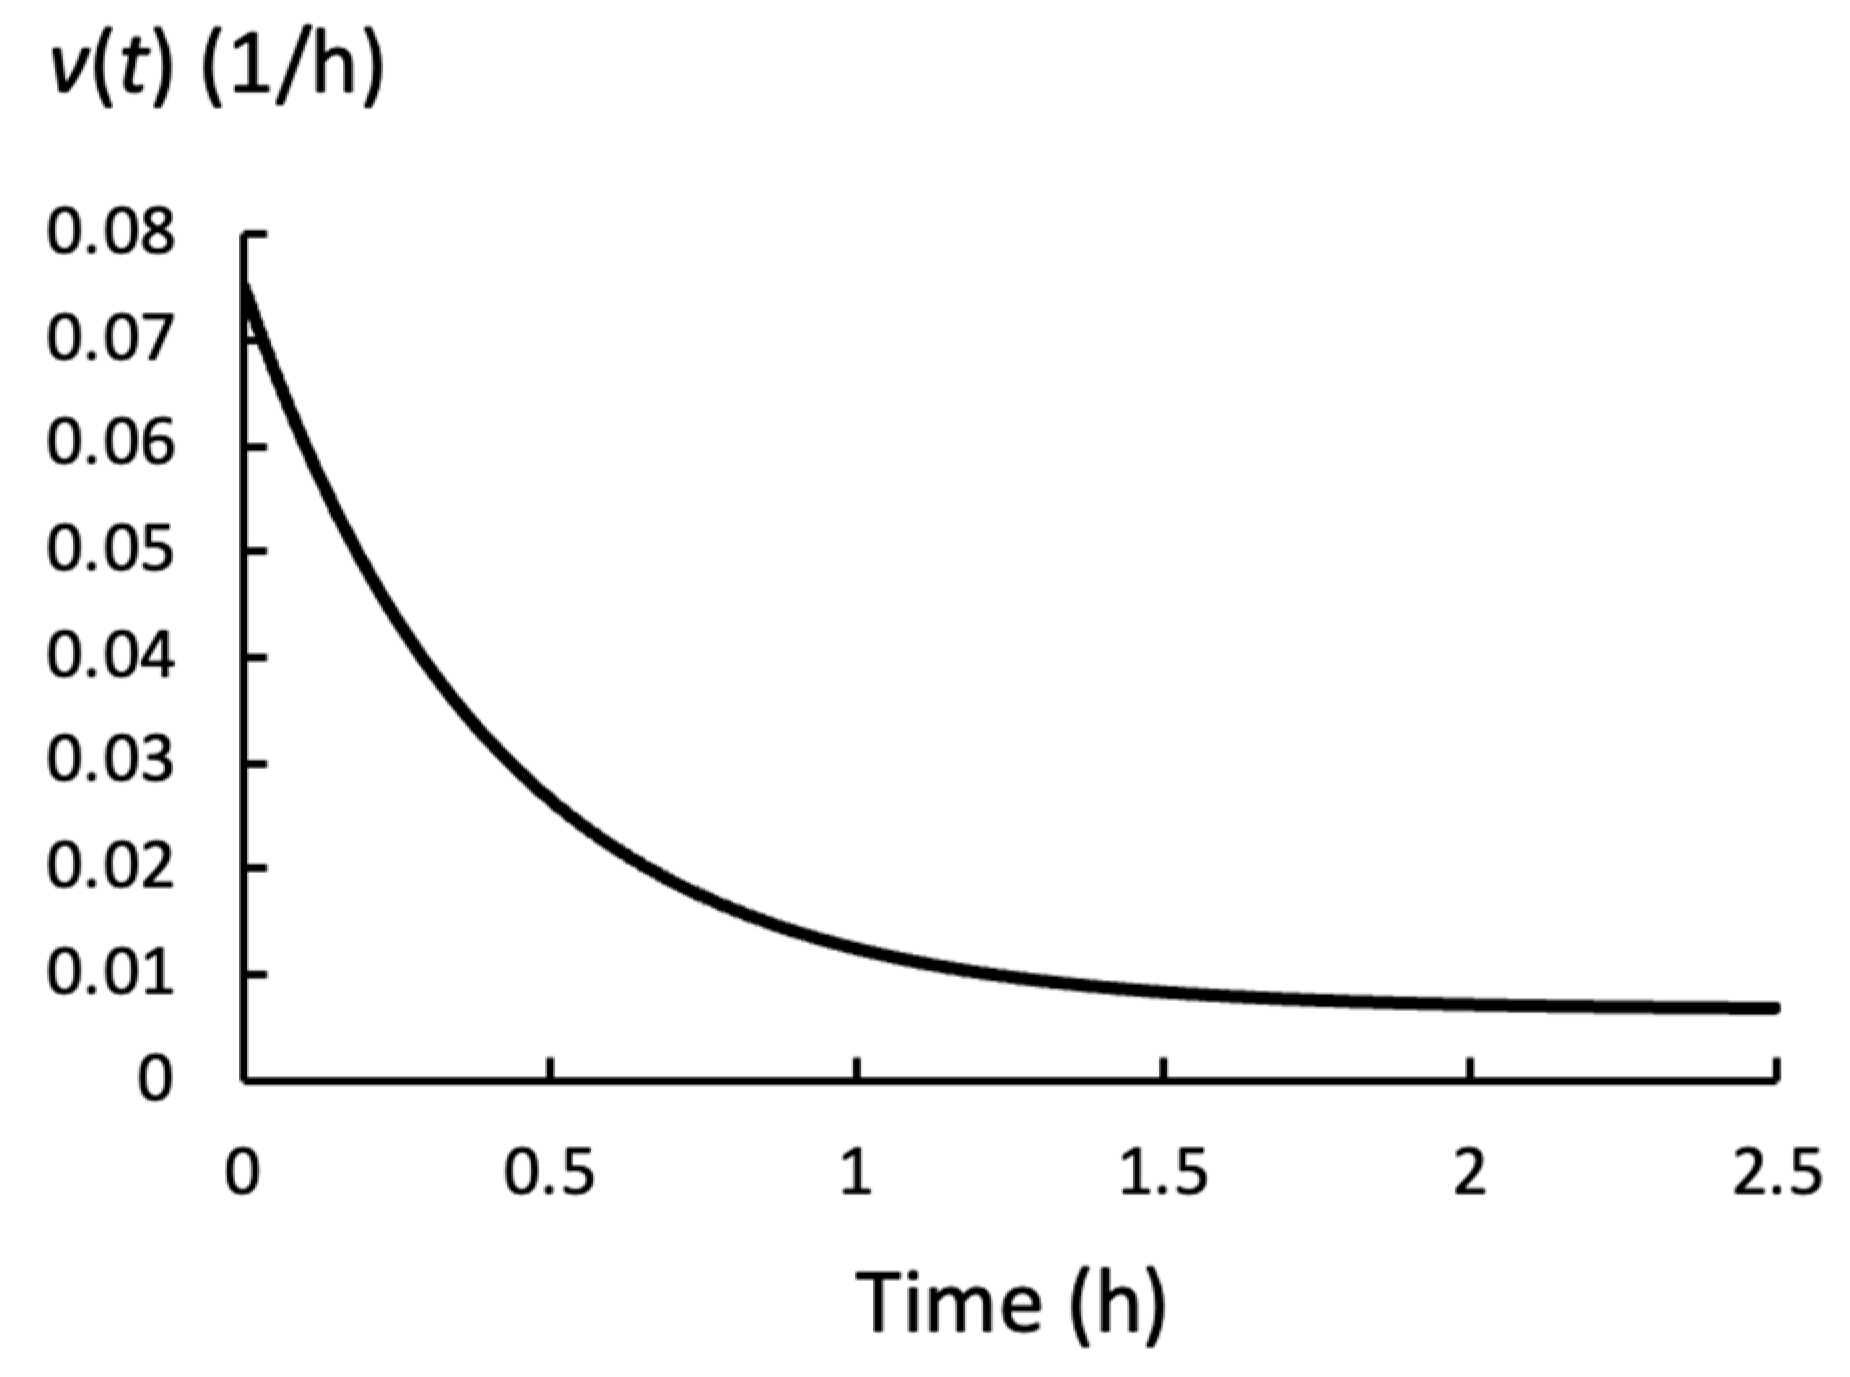
Equation (9) ignores the elastic deformation rate and cannot account for fast changes in P(t). In those cases, Equation (2) more accurately determines the relative rate of deformation of the cell wall chamber. However, Equation (9) is relatively accurate for the slow changes in P(t) that are observed during water deficits, similar to those shown by the red curve in Figure 1. Figure 4 shows the time-dependent relative growth rate, v(t), that is calculated using Equation (9) and the P(t) for the red curve in Figure 1.

2.6. Steady Relative Growth Rate, vs, i.e., When P = Constant

During the equilibrium periods, P = Peq = constant and dP/dt = 0. Then, Equation (10) can be used to determine the steady relative growth rate, vs [15,16,17]. The Peq used in Equation (10) can be determined with either Equations (6)–(8).
v s = ϕ p   P e q P C
Also, when P is constant, Equation (11) can be used to determine the steady relative growth rate, vs [16]. Equation (11) is obtained by substituting Equation (6) into Equation (10).
v s = ϕ p   L w ϕ p + L w   π P C
Equation (11) has the advantage of eliminating Peq from Equation (10) and making the dependence of vs on ϕp and Lw explicit. This advantage is balanced by a disadvantage that the relationship between vs, ϕp, and Lw is more complicated and difficult to visualize, graph, and understand [28]. An equation that is simpler to graph and understand is Equation (12). Equation (12) is obtained by incorporating Π p w =   ϕ p   L w into Equation (11) [28]; see Appendix E for details.
v s = 1 1 + Π p w   ϕ p   π P C
For convenience in subsequent analyses, we will define, ϕpπPC), as vs(max).
v s m a x = ϕ p   π P C
where vs(max) is an unachievable theoretically maximum steady growth rate for any magnitude of ϕp [28]. Notice that the term, 1/(1 + Πpw), represents a fractional coefficient of vs(max). The fractional coefficient, 1/(1 + Πpw), is identical to the expression for Peq* in Equation (8). So, the curve in Figure 3 is a plot of both Peq* and the fractional coefficient, 1/(1 + Πpw), versus Πpw. Therefore, we can write Equation (14) [28].
v s = P e q *   v s m a x
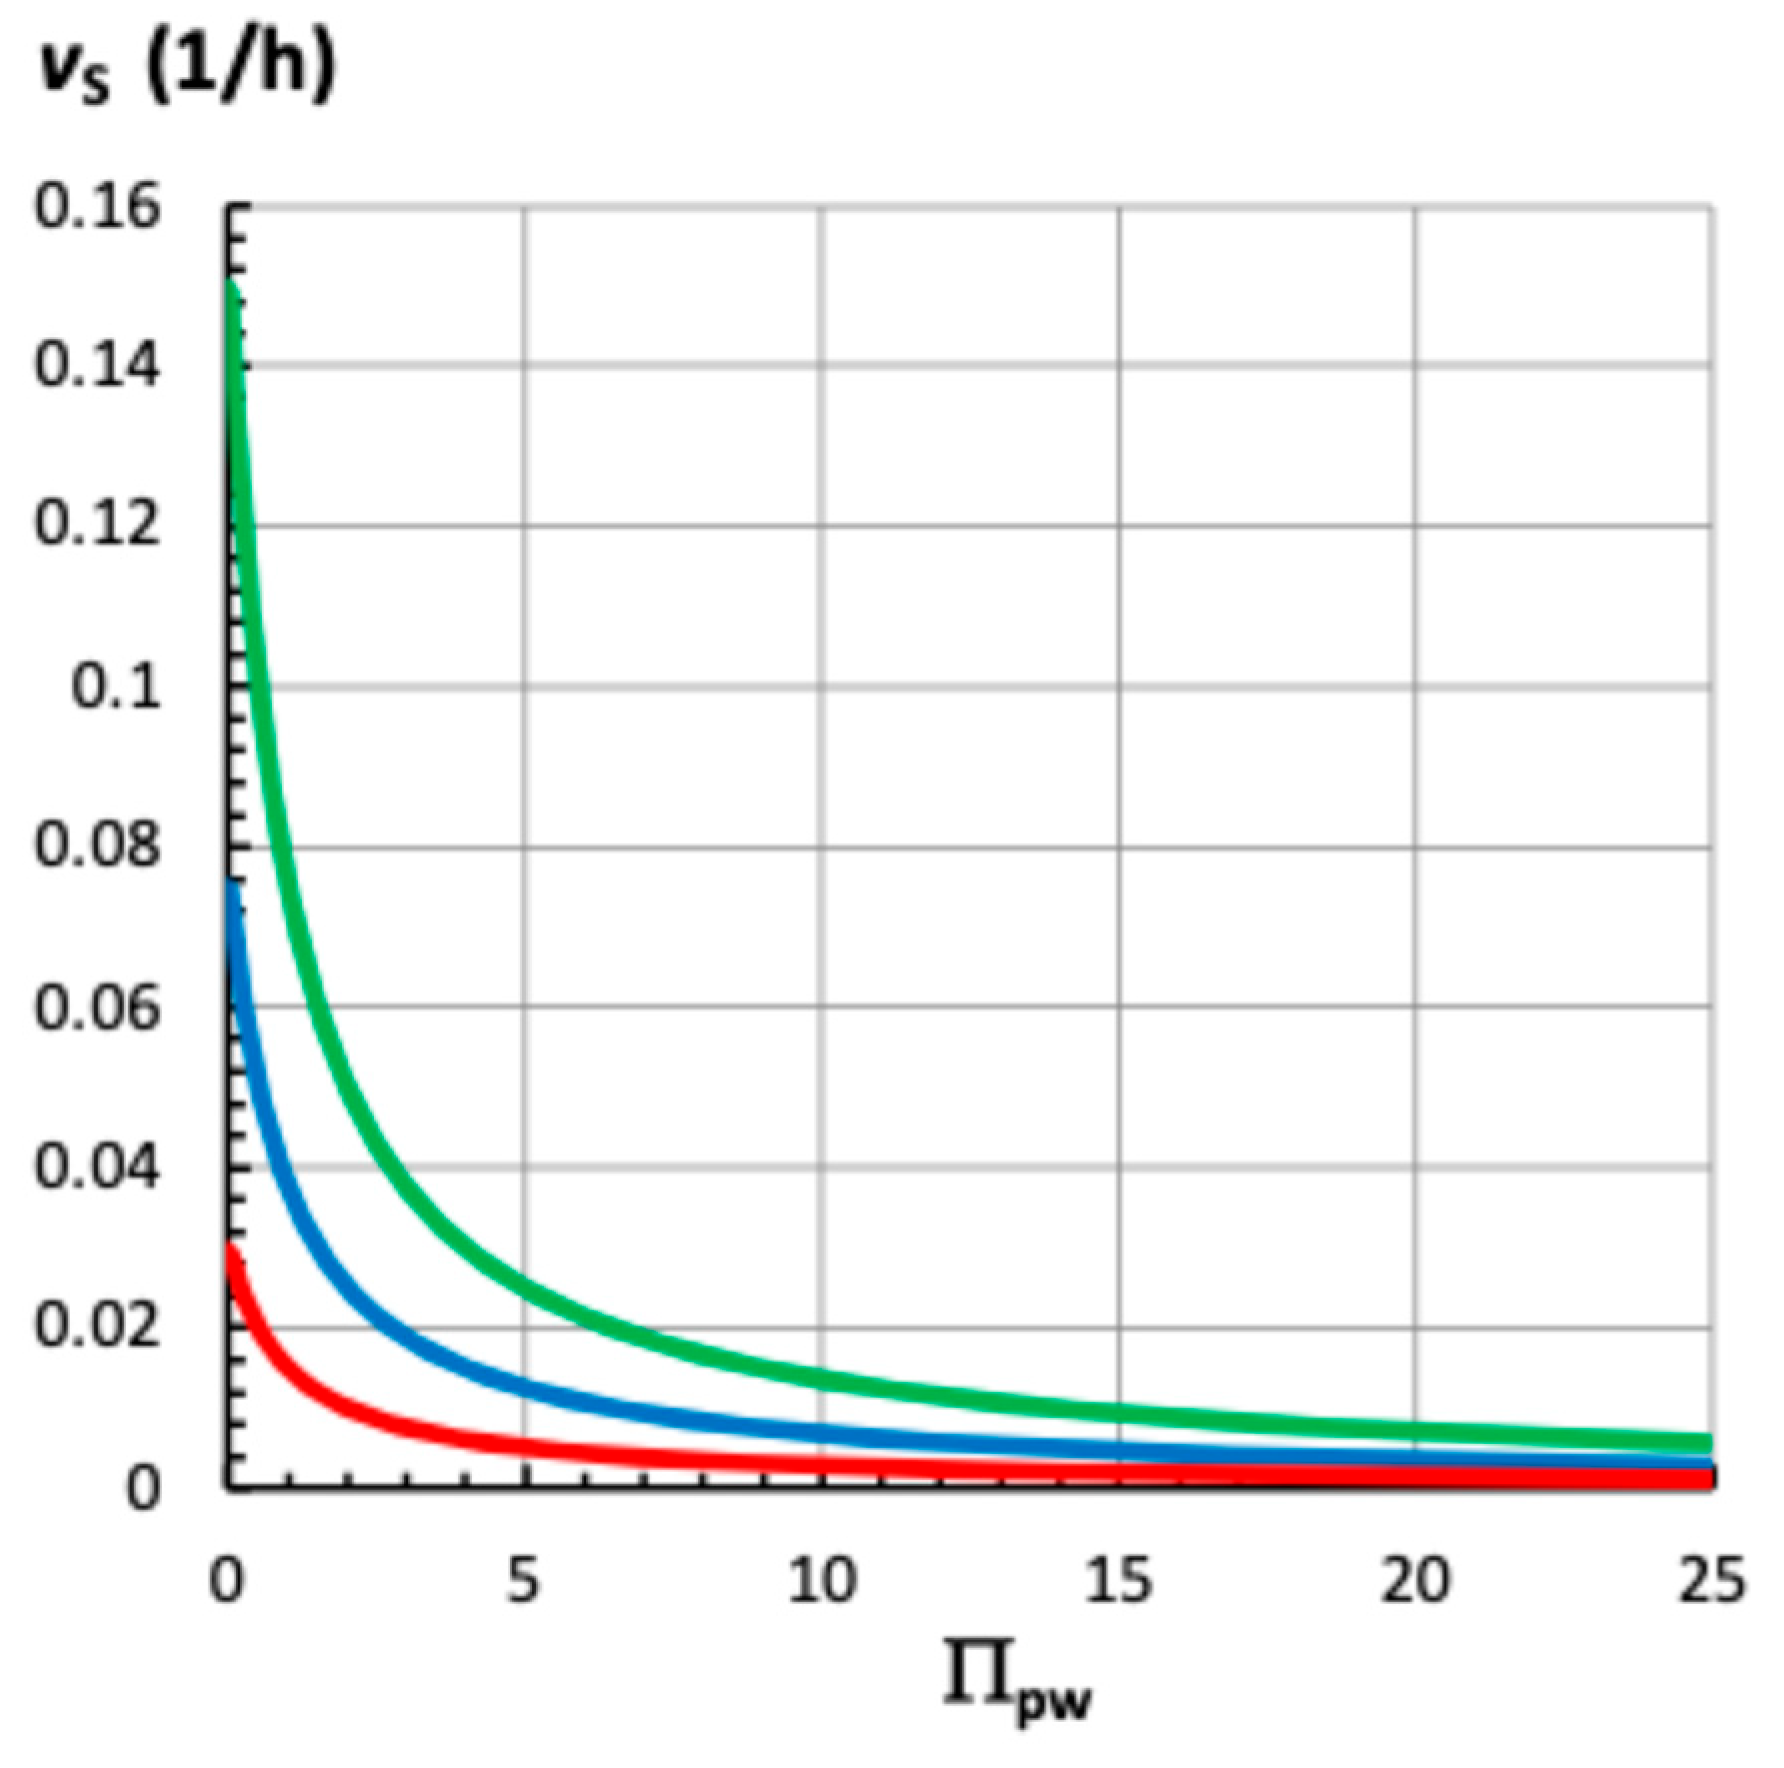
Now vs is easily calculated by using Peq*. As an example, when Π p w =   ϕ p   L w = 2 , Equation (8) is used to determine that Peq* = 1/3. Using Equation (14), vs is calculated to be 1/3 vs(max), i.e., vs = 0.333 vs(max). Equation (13) shows that vs(max) is a function of ϕp. Figure 5 shows vs plotted against Πpw for three different values of ϕp.
It can be seen that vs behaves similarly for all magnitudes of ϕp, a large decrease in vs occurs when Πpw increases from zero to five. For larger Πpw, the decrease in vs is smaller.

3. Discussion

3.1. Turgor Pressure During Water Deficits

The behavior of the time-dependent turgor pressure, P(t), of a plant cell during water deficits is simulated by decreasing the magnitude of Lw (relative volumetric water uptake rate) and calculating P(t) with Equation (4). Figure 1 shows that P(t) decreases exponentially to a smaller magnitude when Lw decreases in magnitude. This simple behavior is complicated by the fact that an increase in ϕp (relative volumetric plastic deformation rate of the wall) increases the growth rate but also decreases P(t). In well-watered cells, i.e., when Lw is large, the decrease in P(t) is small. But for cells growing in water deficit, i.e., when Lw is small, the same increase in ϕp produces a larger decrease in P(t), see Figure 1 and Table 1. This finding demonstrates that ϕp must be part of the analyses of P(t) during water deficits.
A quantitative analysis of the relationship between P(t), Lw, and ϕp was conducted with analyses of the components of P(t); Peq (equilibrium turgor pressure) and tc (time constant). The tc was calculated using Equation (5). The magnitudes of tc for the curves shown in Figure 1 are presented in Table 1. It can be seen that tc increases when Lw, ϕp, and ε decreases in magnitude, individually or in combination. So, during water deficits when Lw is smaller, the tc is always larger and changes in P(t) are always slower.
Equation (6) shows that the relationship between Peq, Lw, and ϕp is complicated and difficult to interpret. Employing the dimensionless number, Π p w =   ϕ p   L w , simplifies the relationship and shows that Peq depends on Πpw; Equation (7). It was noted that the severity of water deficit increased as the magnitude of Πpw increased in magnitude. This simplification allows Peq to be plotted against Πpw; Figure 2. A dimensionless Peq (Peq*) was derived, Equation (8), and plotted against Πpw; Figure 3. In both Figure 2 and Figure 3, it is shown that Peq and Peq* decrease curvilinearly as Πpw increases. The largest decrease occurs when Πpw increases from zero to five. It was noted that Peq approached PC at very large values of Πpw, but never became PC. And Peq* approached zero at very large values of Πpw, but never became zero.

3.2. Expansive Growth During Water Deficit

Table 1 shows that the steady relative growth rate, vs, decreases when Lw decreases. And it is shown that vs increases after an increase in ϕp, but the magnitude of the increase in vs is smaller for the same increase in ϕp when Lw is smaller. This occurs because P(t) decreases after an increase in ϕp, and the decrease is larger when Lw is smaller. During water deficits the behavior of v(t) is predominately determined by P(t), and because the tc is large, the changes in P(t) are slow. Therefore, Equation (9) can provide an accurate approximation of v(t) when Lw is small; see Figure 4.
The vs during well-watered and water deficit conditions is determined by Equation (10) that shows vs depends on Peq. And Peq depends on both ϕp and Lw, see Equation (6). Thus, vs implicitly depends on ϕp and Lw. This dependence can be made explicit, but doing so complicates the relationship and interpretation, see Equation (11). As in the case with Peq, employing Π p w =   ϕ p   L w simplifies the relationship, e.g., Equations (12)–(14), and allows the relationship between vs and Πpw to be plotted on a single graph for different values of ϕp; Figure 5. All the curves in Figure 5 are similar, showing a large decrease in vs when Πpw increases from zero to five, and a smaller decrease when Πpw is greater than five. This behavior is similar to that of Peq and Peq* versus Πpw. It can be seen that larger magnitudes of ϕp shift the curves upward so that larger growth rates occur at the same magnitude of Πpw.

3.3. Analyzing Expansive Growth During Water Deficits

Employing Πpw to understand changes of Peq and vs to water deficits provides another perspective and approach when analyzing experimental results. This approach consists of determining or estimating the magnitude of Πpw after a change in water conditions, and then employing Figure 2, Figure 3 and Figure 5 to determine how much Peq and vs change. It is simple to think that Peq and vs decrease as Πpw increases. Furthermore, determining a magnitude for Πpw provides a simple method for obtaining a quantitative interpretation of how much Peq and vs change as the severity of water deficits increases; Equations (7), (8), (12), and (14).
Equations (12) and (14) are simple equations that can be used to analyze experimental results. Recognizing that the curves shown in Figure 5 are calculated when vs(max) = constant (a different constant for each value of ϕp), then each curve represents the “passive response” of vs to water deficit. Each curve can be thought of as being composed of two parts, Peq* and vs(max). The behavior of Peq* as a function of Πpw is described by Equation (8) and this relationship remains the same. However, the behavior of vs(max) is described by Equation (13) and does not have to remain constant, i.e., ϕ, Δπ, and PC may change in magnitude (adjust) as water deficits become more severe. Therefore, any deviation of vs from the “vs versus Πpw” curve (when the values are constant), will indicate an “active response” during water deficit. Inspection of Equation (13) demonstrates that an increase in the magnitude of ϕ and/or (ΔπPC) will increase vs(max) and will therefore shift the “vs versus Πpw” curve upward, see Figure 5. Of course, a decrease in the magnitude of ϕ and/or (ΔπPC) decreases vs(max) and will shift the “vs versus Πpw” curve downward so that smaller growth rates occur at the same magnitude of Πpw.
The sensitivity of vs to active changes in the magnitude of ϕp, Δπ, and PC can be calculated using Equation (14). The magnitude of Peq* for different values of Πpw will always be the same, so the magnitude of the change in vs(max) will determine the magnitude of the change in vs. In other words, the % change (positive or negative) of vs will equal the % change (positive or negative) of vs(max) for different values of Πpw and for different ranges of Πpw. For example, when Πpw = 5, then Peq* = 1/6, see Equation (8). Using ϕp = 0.25 h−1 MPa−1, Δπ = 0.6 MPa, and PC = 0.3 MPa, then vs(max) = 0.075 h−1 is calculated, see Equation (13). Equation (14) is used to calculate vs = 0.0125 h−1. Now if ϕp increases two-fold (100%) to 0.5 h−1 MPa−1, then vs(max) = 0.15 h−1 and vs = 0.025 h−1, which represent a two-fold (100%) increase in relative growth rate. It is apparent that the magnitude of the change in vs(max) determines the magnitude of the change in vs for a specific value of Πpw. When ϕp, Δπ, and PC change individually or in combination, Equation (13) can be used to determine the percent increase or decrease in vs(max), which represents the percent increase or decrease in vs for different individual values, or range of values, of Πpw. It follows that if ϕp increases from 0.25 h−1 MPa−1 to 0.5 h−1 MPa−1 beginning at Πpw = 5 and extending to Πpw = 25, the blue curve in Figure 5 will be shifted to the position of the green curve for that range of Πpw, i.e., 5 ≤ Πpw ≤ 25.
The sensitivity of Peq to active changes in the magnitude of Δπ and PC is more complicated to determine, but the magnitude of the changes can be calculated using Equation (7). As an example, if Δπ increases from 0.6 MPa to 0.9 MPa (50% increase) and PC = 0.3 MPa, then Equation (7) can be used to calculate Peq = 0.4 MPa when Πpw = 5. An inspection of Figure 2 indicates that Peq = 0.35 MPa when Δπ = 0.6 MPa, PC = 0.3 MPa, and Πpw = 5. So, Peq has increased 0.05 MPa (14.3%) when Δπ increased 0.3 MPa (50%) at Πpw = 5. However, when Πpw = 15, the same increase in Δπ of 0.3 MPa (50%) will increase Peq from 0.32 MPa to 0.34 MPa, which represents an increase of 0.02 MPa (6%). Summarizing, a 50% increase in Δπ produces an increase in Peq of 14.3% at Πpw = 5, and 6% at Πpw = 15. This example reveals that the sensitivity of Peq on Δπ depends on the magnitude of Πpw. This occurs because Πpw is present in both the numerator and denominator of Equation (7).
Theoretically, it is not possible to determine the value(s) of Πpw that will elicit an active response. It seems reasonable that the large decreases in Peq and vs that occur between Πpw = 0 and Πpw = 5 would elicit an active response. However, only analyses conducted on experimental results can indicate where “vs versus Πpw” curves deviate from passive response curves to indicate an active response

3.4. Growth Rate and Turgor Pressure of Roots During Water Deficits

Remembering that the analyses conducted here do not consider the transpiration rate from single plant cells. Because roots do not transpire to the atmosphere or to the soil [30], the expansive growth of roots in water deficits can be evaluated with these biophysical equations and analyses. In order to extend these analyses from growing plant cells to growing plant tissues and organs, a “lump” parameter method is employed. This method considers the behavior of a group of cells (lumped together) and the lump is analyzed as a single cell. The main advantage of this approach is that simpler equations can be used for analyses (those of a single cell) and the “system” behavior of the tissue and/or organ can be assessed. Care should be exercise in these analyses, because the magnitudes of relevant variables and parameters in the equation(s) are an average of all the cells in the lump. In general, information is always lost when quantities are averaged. So important behavior of some cells within the lump that are different can be lost in the average. However, the “system” behavior of the lump of cells can be useful and can provide insight that may be difficult or impossible to obtain by focusing on individual cells. Generally, this method yields the best results when the cells in the lump are homogenous in structure, function, and behavior—such as cells in growing tissue. The lump parameter approach has been implicitly employed in prior investigations [29,30,31] and have revealed important system behavior and insights.

3.5. Growth Rate and Turgor Pressure of Maize Roots During Water Deficits

Sharp et al. [32] grew seedlings of maize (Zea mays L.) in vermiculite at decreasing water potentials, Ψw. The steady growth rates of primary roots were measured and plotted as a function of the decreasing Ψw of the vermiculite. The curve in Figure 1 of their paper [32] is similar to the curves in Figure 5 presented here.

3.5.1. Passive Response

By considering the growth zone of the primary root as a lumped parameter (from the apex to approximately 10 mm from the apex) the analyses conducted here can be extended to evaluate the results presented in Figure 1 [32]. Two features of Figure 1 [32] were noted and compared to the curves in Figure 5. One feature is that a large decrease in root elongation rate (growth rate) occurs when Ψw decreases from −0.03 MPa to −0.5 MPa (this is similar to the behavior of vs when Πpw decreases from 0 to 5 in Figure 5). The second feature is that the decrease in growth rate is smaller when Ψw decreases from −0.5 MPa to −2.0 MPa (this is similar to the behavior of vs when Πpw decreases from 5 to 25 in Figure 5).
Employing the analyses and equations presented here, a prediction can be made. It is predicted that a decrease in turgor pressure is primarily responsible for the decrease in growth rate when Ψw decreases from −0.03 MPa to −2.0 MPa. This prediction is made because Equation (14) and Figure 2, Figure 3, Figure 4 and Figure 5 demonstrate that the overall shape of the “growth rate versus water deficit” curve is determined primarily by the behavior of the turgor pressure as a function of increasing water deficit. A subsequent investigation by Spollen and Sharp [33], working with maize primary roots, provides partial confirmation of this prediction. In that investigation, a pressure probe was used to measure the turgor pressure in individual cells located in the apical 10 mm length of the primary root. It was shown that the turgor pressure was nearly uniform and constant along the 10 mm length. Furthermore, the turgor pressure was smaller when Ψw of the vermiculite was smaller. In their Figure 2 [33], it is shown that the approximate average turgor pressure was, Pave = 0.7 MPa when Ψw = −0.02 MPa, and Pave = 0.3 MPa when Ψw = −1.6 MPa. These results are consistent with the behavior of Peq and Peq* as a function of Πpw that are shown in Figure 2 and Figure 3.

3.5.2. Active Response

A careful comparison of Figure 1 in Sharp et al. [32] and Figure 5 indicates that an upward shift in the “root elongation rate versus vermiculite water potential” curve occurs approximately between −0.3 MPa and −2.0 MPa. This upward shift corresponds to the approximate range of 3 < Πpw < 25 of the “vs versus Πpw” curve in Figure 5. The upward shift indicates an active response, and that vs(max) has increased in magnitude. Inspection of Equation (13) demonstrates that an increase in the magnitude of ϕ and/or (ΔπPC) increases vs(max) and shifts the “vs versus Πpw” curve upward, see Figure 5. Then, it is predicted that ϕ and/or Δπ must have increased in magnitude, or that PC decreased in magnitude when Ψw was between −0.3 MPa and −2.0 MPa.
In another investigation by Sharp et al. [34], also working with maize primary roots, it was shown that there was substantial osmotic adjustment in the growth zone of the primary root of maize at low Ψw. Interestingly, the osmotic adjustment was largely the result of a greater inhibition of volume expansion and water deposition than solute deposition. An increase in Δπ in the range of 3 < Πpw < 25 in Figure 5 will shift the curves upward in that range. Inspection of Equation (7) demonstrates that Peq will also be shifted upward in the same range of 3 < Πpw < 25 of Figure 2.

3.5.3. Limitation of the “Lump” Parameter Method

Sharp et al. [32] employed time lapse photography to reveal that elongation growth near the root apex was insensitive to water potentials as low as −1.6 MPa. Instead, growth was inhibited in more basal locations, decreasing the growth zone length progressively as the water potential decreased. These findings highlight a limitation of the “lump” parameter method, because only the total elongation rate of the root is analyzed in this method. So, the distribution of growth along the length of the root and the decrease in growth zone length go undetected in the “lump” parameter method. Other changes within the lumped volume of cells are neglected, some of which provide important insight into the growth process. In general, it is useful to supplement the “lump” parameter findings with more in-depth studies.

3.6. Growth Rate of Roots and Shoots from Other Plants During Water Deficits

The analyses, equations, and results presented here draw support from other species of plants. The curves of elongation rates of the primary root and shoot of seedlings from maize, soybean, cotton, and squash at decreasing water potentials are similar to those in Figure 5 [35,36]. The shoots were grown in saturating humidity in an attempt to suppress transpiration. Both roots and shoots show a large curvilinear decrease in elongation rate when Ψw decreases from 0.0 MPa to −0.5 MPa, with the shoots showing the largest decrease; see Figure 3.1 in [35] and Figure 1 in [36]. For the roots, the curves demonstrate a more gradual curvilinear decrease in elongation rate when Ψw decreases from 0.0 MPa to −1.5 MPa. The results demonstrate that the roots of these plants continue to grow at water potentials that are low enough to completely inhibit shoot growth. The differences in the curves of “elongation rate versus Ψw” for maize, soybean, cotton, and squash roots [35,36] indicate a different magnitude of vs(max) in Equation (13). In general, experimental research has shown that each of the variables in Equation (13) have been actively altered during water deficit [6,32,33,34,35,36,37].

3.7. Transpiration and Apoplasm Pathway

Because the theoretical analyses conducted here neglect the transpiration water loss from individual cells, the turgor pressure and growth rate behavior presented in Figure 1, Figure 2, Figure 3, Figure 4 and Figure 5 are strictly only for plant cells that are not transpiring. However, in addition to growing roots, the results of these analyses might be extended to shoots, stems, and leaves growing in a high humidity environment that suppresses transpiration, e.g., in the laboratory or in the tropics. Future research will focus on incorporating “transpiration” into analyses similar to that conducted here. However, the analyses are complicated by the fact that transpiration from exterior cells lowers the pressure in the apoplasm pathway (cell walls and xylem), which in turn lowers the turgor pressure of the cells throughout the growing plant tissue or organ [20]. Previously, the biophysical equations were modified to evaluate the turgor pressure, water uptake rate, and expansive growth rate of plant cells in tissue when pressures within the apoplasm were lower and higher than atmospheric pressure [20]. The obtained governing equations are more complicated than those presented here. Therefore, the objective of future research is to simplify the analyses and equations, so they are similar to those presented here, and perhaps easier to understand and use than those previously obtained [20].

4. Conclusions

Here, equations derived from previously validated biophysical equations describe the behavior of the turgor pressure and expansive growth rate of plant cells as water deficit increases in severity; see Equations (7) and (8) and Equations (12)–(14), respectively. The new equations employ a dimensionless number, Π p w =   ϕ p   L w , that increases in magnitude as the severity of water deficit increases. The equations neglect transpiration water losses, so their applications are limited to plant cells that are not transpiring, i.e., roots, and non-transpiring shoots, stems, and leaves growing in saturating high humidity. The steady relative growth rate, vs, is described by Equation (14) and simply consists of the product of two variables, Peq* and vs(max). Each variable is represented by an equation, Equations (8) and (13), both of which are simple and easy to understand. Figure 5 shows that vs decreases curvilinearly as the water deficit severity (Πpw) increases. The curvilinear behavior of vs is described by the dimensionless equilibrium turgor pressure, Peq*, which was derived from the equilibrium turgor pressure, Peq, Equation (7). The effect of changes in the magnitudes of ϕp, Δπ, and PC on vs at different Πpw, or ranges of Πpw, can be determined by calculating the magnitude of vs(max) with Equation (13) and using Equation (14) to calculate vs. Adjusting the magnitude of vs(max) can fit the curves shown in Figure 5 to those of different species of plants. Also, adjusting the magnitude of vs(max) for a range of Πpw can determine the magnitude of an active response during water deficit.
The growth rate behavior presented in Figure 5 is similar to experimental results of roots and shoots (shoots that were grown in saturating high humidity) from four different species of plants grown in increasing water deficit [35,36]. The large decrease in Peq as Πpw increases, that is shown in Figure 2, is consistent with experimental results from pressure probe studies of maize roots grown in water deficit [33]. Therefore, it is concluded that the equations derived here can describe the behavior of the turgor pressure and expansive growth rate of non-transpiring plant cells as water deficits increase in severity.
The derived equations and findings can have real-world applications. For example, Figure 5 shows that you obtain the best return on your investment if you apply growth stimulants to well-watered crops (small Πpw) compared to crops in water deficit (larger Πpw). A growth stimulant that produces a 100% increase in vs, will increase the relative growth rate from 0.06/h to 0.12/h when Πpw < 1.0 (see Figure 5, blue curve to green curve), but will only increase the growth rate from 0.013/h to 0.025/h when Πpw = 5.0. Also, the finding that vs approaches zero asymptotically as Πpw increases, but never becomes zero (Figure 5), may find applications in irrigation management and ecology. It would appear that the most effective use of limited amounts of water to maintain plant growth in dry climates is to frequently distribute small quantities of water over a period of time, compared to distributing larger quantities of water less frequently over the same time period. Also, the derived equations may provide guidance for drought-tolerant crop breeding.

Funding

This research received no external funding.

Data Availability Statement

The original contributions presented in this study are included in the article. Further inquiries can be directed to the corresponding author.

Acknowledgments

The author thanks Elena L. Ortega and Alicia M. Ortega for their technical assistance and constructive discussions of this paper.

Conflicts of Interest

The author declares no conflicts of interest.

Appendix A. Definitions of Individual Variables (Units)

  • A—area of the plasma membrane (m2)
  • Lp—hydraulic conductivity of the plasma membrane (m h−1 MPa−1)
  • L—relative hydraulic conductance of the plasma membrane = L p A   V (h−1 MPa−1)
  • P—turgor pressure (MPa)
  • t—time (h)
  • V—volume (m3)
  • v—relative rate of change in volume (h−1)
  • ε—volumetric elastic modulus of the cell wall (MPa)
  • ϕ—relative irreversible extensibility of the cell wall (h−1 MPa−1)
  • π—osmotic pressure (MPa)
  • Δπ—difference in osmotic pressure across the plasma membrane (MPa)
  • Π—dimensionless parameter or dimensionless number (no units)

Appendix B. Derivation of Equation (7)

Beginning with the expression, Π p w =   ϕ p   L w , then ϕ p =   L w Π p w .
Now substituting into Equation (6) we get the expression for Equation (7).
P e q = L w   Δ π   +   ϕ p   P C ϕ p + L w = L w   Δ π   +   L w   Π p w   P C L w   Π p w +   L w = L w   Δ π   +   Π p w   P C L w   Π p w +   1 =   Δ π   +   Π p w   P C   Π p w +   1

Appendix C. Derivation of Equation (8)

Begin by substituting Equation (7) into the expression for Peq*, i.e., P e q * = P e q P C Δ π P C . Then, the expression for Equation (8) is obtained.
P e q * = P e q     P C Δ π     P C =     Δ π + Π p w   P C 1 + Π p w     P C Δ π     P C =     Δ π   +   Π p w   P C 1 + Π p w P C     1   +   Π p w   1   + Π p w Δ π     P C
=   Δ π   +   Π p w   P C     P C Π p w   P C 1 + Π p w   Δ π     P C =     Δ π   P C 1 + Π p w   Δ π     P C = Δ π   P C Δ π     P C   1 + Π p w = 1 1 + Π p w

Appendix D. Using Equation (8) to Calculate Peq

As an example of using Equation (8) to calculate Peq, consider the case where Πpw = 5.
P e q * = 1 1 + Π p w = 1 1 + 5 = 1 6
Then Peq* = 1/6 (≈0.167). Using values for Δπ and PC as 0.6 MPa and 0.3 MPa, respectively, Peq can be calculated from Equation (8) as follows:
P e q P C = 1 6   Δ π P C   a n d   P e q = 1 6   Δ π P C + P C =   0.3   M P a 6 + 0.3   M P a = 0.35   M P a
Inspection of Figure 2 shows that when Πpw = 5, Peq = 0.35 MPa.

Appendix E. Derivation of Equation (12)

Beginning with the expression Π p w =   ϕ p   L w , then L w = ϕ p Π p w . Substituting into Equation (11), the expression for Equation (12) is obtained.
v s = ϕ p   L w ϕ p + L w   π P C =   ϕ p   ϕ p   Π p w   ϕ p   +   ϕ p Π p w   π P C =   ϕ p   ϕ p   Π p w   ϕ p   1 + 1 Π p w     π P C
=   ϕ p   Π p w   1   +   1 Π p w     π P C =   ϕ p   Π p w   Π p w +   1 Π p w     π P C =   1     Π p w +   1   ϕ p   π P C

References

  1. Boyer, J.S. Plant productivity and environment. Science 1982, 218, 443–448. [Google Scholar] [CrossRef]
  2. Fedoroff, N.V. The past, present and future of crop genetic modification. New Biotechnol. 2010, 27, 461–465. [Google Scholar] [CrossRef]
  3. Cao, Y.; Yang, W.; Ma, J.; Cheng, Z.; Zhang, X.; Liu, X.; Wu, X.; Zhang, J. An Integrated Framework for Drought Stress in Plants. Int. J. Mol. Sci. 2024, 25, 9347. [Google Scholar] [CrossRef] [PubMed]
  4. Şimşek, Ö.; Isak, M.A.; Dönmez, D.; Şekerci, A.D.; İzgü, T.; Kaçar, Y.A. Advanced Biotechnological Interventions in Mitigating Drought Stress in Plants. Plants 2024, 13, 717. [Google Scholar] [CrossRef] [PubMed]
  5. Hsiao, T.C. Plant responses to water stress. Annu. Rev. Plant. Physiol. 1973, 24, 519–570. [Google Scholar] [CrossRef]
  6. Voothuluru, P.; Wu, Y.; Sharp, R.E. Not so hidden anymore: Advances and challenges in understanding root growth under water deficits. Plant Cell 2024, 36, 1377–1409. [Google Scholar] [CrossRef]
  7. Dumais, J. Mechanics and hydraulics of pollen tube growth. New Phytol. 2021, 232, 1549–1565. [Google Scholar] [CrossRef]
  8. Ali, O.; Cheddadi, I.; Landrein, B.; Long, Y. Revisiting the relationship between turgor pressure and plant cell growth. New Phytol. 2023, 238, 62–69. [Google Scholar] [CrossRef]
  9. Chaumont, F.; Tyerman, S.D. Aquaporins: Highly Regulated Channels Controlling Plant Water Relations. Plant Physiol. 2014, 164, 1600–1618. [Google Scholar] [CrossRef]
  10. Cosgrove, D.J. Structure and growth of plant cell walls. Nat. Rev. Mol. Cell Biol. 2024, 25, 340–358. [Google Scholar] [CrossRef]
  11. Ortega, J.K.E. Theoretical analyses of turgor pressure during stress relaxation and water uptake, and after changes in expansive growth rate when water uptake is normal and reduced. Plants 2023, 12, 1891. [Google Scholar] [CrossRef]
  12. Fox, R.W.; McDonald, A.T.; Pritchard, P.J. Introduction to Fluid Mechanics, 6th ed.; John Wiley and Sons, Inc.: Hoboken, NJ, USA, 2004. [Google Scholar]
  13. Jackson, J.D. Classical Electrodynamics, 3rd ed.; John Wiley and Sons: Hoboken, NJ, USA, 1975; ISBN 978-0-471-43132-9. [Google Scholar]
  14. Dainty, J. Water relations of plant cells. Adv. Bot. Res. 1963, 1, 279–326. [Google Scholar]
  15. Lockhart, J.A. An analysis of irreversible plant cell elongation. J. Theor. Biol. 1965, 8, 264–275. [Google Scholar] [CrossRef] [PubMed]
  16. Ray, P.M.; Green, P.B.; Cleland, R. Role of turgor in plant cell growth. Nature 1972, 239, 163–164. [Google Scholar] [CrossRef]
  17. Ortega, J.K.E. Augmented equation for cell wall expansion. Plant Physiol. 1985, 79, 318–320. [Google Scholar] [CrossRef]
  18. Ortega, J.K.E.; Keanini, R.G.; Manica, K.J. Pressure probe technique to study transpiration in Phycomyces sporangiophores. Plant Physiol. 1988, 87, 11–14. [Google Scholar] [CrossRef]
  19. Ortega, J.K.E. Governing equations for plant cell growth. Physiol. Plant. 1990, 79, 116–121. [Google Scholar] [CrossRef]
  20. Ortega, J.K.E. Plant cell growth in tissue. Plant Physiol. 2010, 154, 1244–1253. [Google Scholar] [CrossRef]
  21. Geitmann, A.; Ortega, J.K.E. Mechanics and modeling of plant cell growth. Trends Plant Sci. 2009, 14, 467–478. [Google Scholar] [CrossRef]
  22. Ortega, J.K.E.; Welch, S.W.J. Mathematical models for expansive growth of cells with walls. Math. Model. Nat. Phenom. 2013, 8, 35–61. [Google Scholar] [CrossRef]
  23. Ortega, J.K.E. Dimensional analysis of expansive growth of cells with walls. Res. Rev. J. Bot. Sci. 2016, 5, 17–24. [Google Scholar]
  24. Ortega, J.K.E. Dimensionless number is central to stress relaxation and expansive growth of the cell wall. Sci. Rep. 2017, 7, 3016. [Google Scholar] [CrossRef] [PubMed]
  25. Ortega, J.K.E. Dimensionless numbers for plant biology. Trends Plant Sci. 2018, 23, 6–9. [Google Scholar] [CrossRef] [PubMed]
  26. Ortega, J.K.E. Dimensionless numbers to analyze expansive growth processes. Plants 2019, 8, 17. [Google Scholar] [CrossRef]
  27. Munoz, C.M.; Ortega, J.K.E. Dimensionless numbers to study cell wall deformation of stiff mutants of Phycomyces blakesleeanus. Plant Direct 2019, 3, e00195. [Google Scholar] [CrossRef]
  28. Ortega, J.K.E. The relationship between wall extensibility, hydraulic conductance, and turgor pressure during expansive growth. Plant Physiol. 2025, 197, kiaf135. [Google Scholar] [CrossRef]
  29. Cosgrove, D.J. Cell wall yield properties of growing tissue; evaluation by in vivo stress relaxation. Plant Physiol. 1985, 78, 347–356. [Google Scholar] [CrossRef]
  30. Hsiao, T.C.; Xu, L.-K. Sensitivity of growth of roots versus leaves to water stress: Biophysical analysis and relation to water transport. J. Exp. Bot. 2000, 51, 1595–1616. [Google Scholar] [CrossRef]
  31. Cosgrove, D.J. Analysis of the dynamic and steady-state responses of growth rate and turgor pressure to changes in cell parameters. Plant Physiol. 1981, 68, 1439–1446. [Google Scholar] [CrossRef]
  32. Sharp, R.E.; Silk, W.K.; Hsiao, T.C. Growth of the maize primary root at low water potential: Spatial distribution of expansive growth. Plant Physiol. 1988, 87, 50–57. [Google Scholar] [CrossRef]
  33. Spollen, W.G.; Sharp, R.E. Spatial distribution of turgor and root growth at low water potential. Plant Physiol. 1991, 96, 438–443. [Google Scholar] [CrossRef]
  34. Sharp, R.E.; Hsiao, T.C.; Silk, W.K. Growth of the maize primary root at low water potentials. II. Role of growth and deposition of hexose and potassium in osmotic adjustment. Plant Physiol. 1990, 93, 1337–1346. [Google Scholar] [CrossRef]
  35. Spollen, W.G.; Sharp, R.E.; Saab, I.N.; Wu, Y. Regulation of cell expansion in roots and shoots at low water potentials. In Water Deficits: Plant Responses from Cell to Community; Smith, J.A.C., Griffiths, H., Eds.; Bios Scientific Publishers: Oxford, UK, 1993; pp. 37–52. [Google Scholar]
  36. Sharp, R.E.; Poroyko, V.; Hejlek, L.G.; Spollen, W.G.; Springer, G.K.; Bohnert, H.J.; Nguyen, H.T. Root growth maintenance during water deficits: Physiology to functional genomics. J. Exp. Bot. 2004, 55, 2343–2351. [Google Scholar] [CrossRef]
  37. Westgate, M.E.; Boyer, J.S. Osmotic adjustment and the inhibition of leaf, root, stem and silk growth at low water potentials in maize. Planta 1985, 164, 540–549. [Google Scholar] [CrossRef] [PubMed]
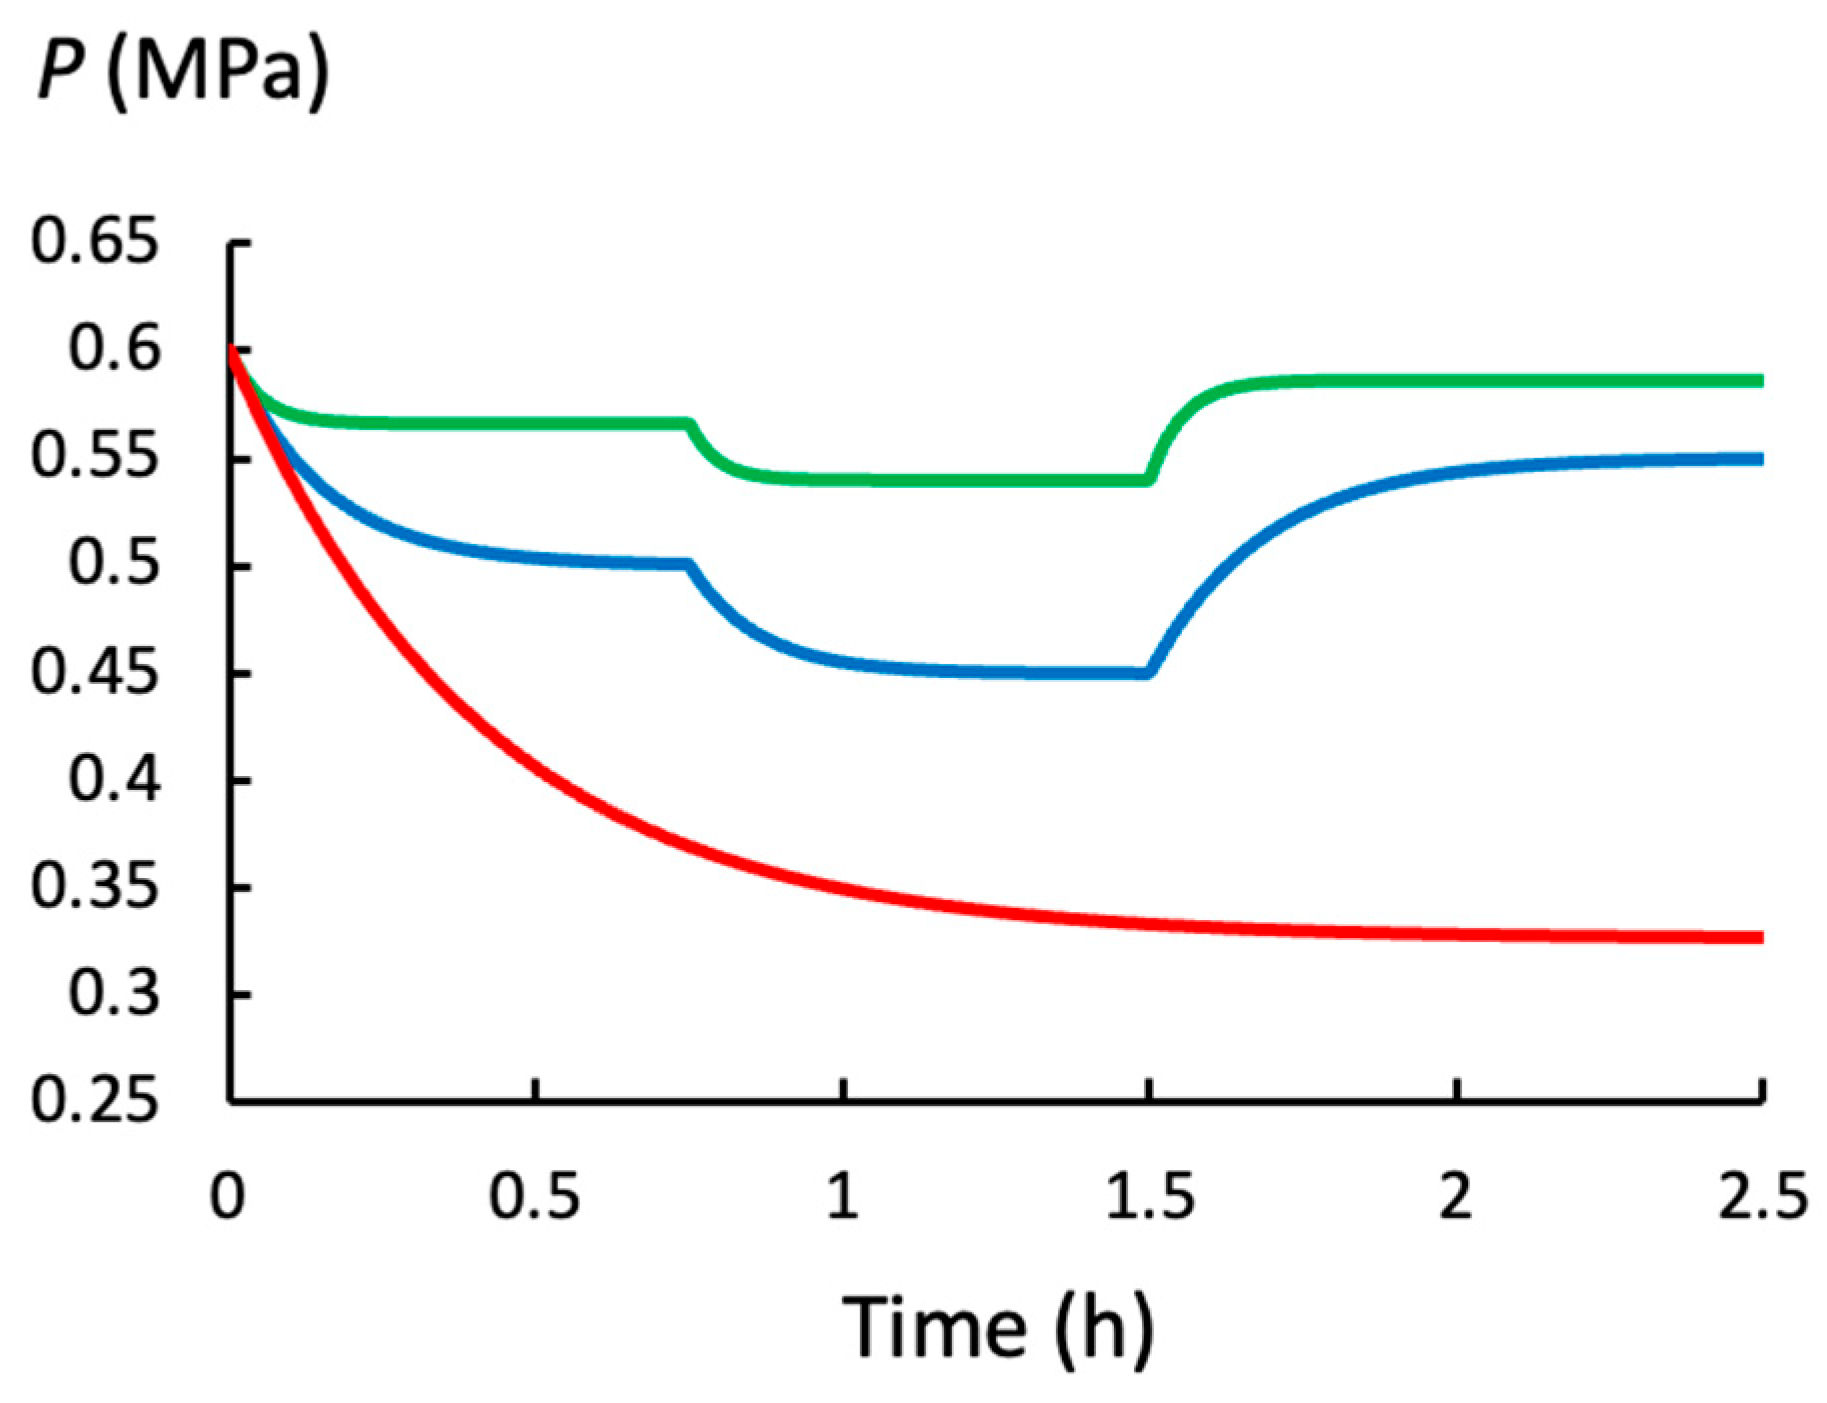
Figure 1. P(t) for a model (ideal) growing plant cell when well-watered (green curve; Lw = 2.0 h−1 MPa−1), during moderate water deficit (blue curve; Lw = 0.5 h−1 MPa−1) and during severe water deficit (red curve; Lw = 0.025 h−1 MPa−1). The green and blue curves show P(t) after ϕp increases from 0.0 to 0.25 h−1 MPa−1 at t = 0 h, after ϕp increases from 0.25 h−1 MPa−1 to 0.5 h−1 MPa−1 at t = 0.75 h, and after ϕp decreases to 0.1 h−1 MPa−1 at t = 1.5 h. In the red curve, ϕp increases 0.0 to 0.25 h−1 MPa−1 at t = 0 h and remains constant for the remainder of the time. The red curve highlights the fact that the transient time between Po and Peq is much longer during severe water deficits (Lw = 0.025 h−1 MPa−1). Table 1 presents the specific values used in Equations (4)–(6) to produce each curve.
Plants 14 03538 g001
Figure 2. Equation (7) is used to plot the equilibrium of turgor pressure, Peq, as a function of Π p w =   ϕ p   L w . The values for Δπ and PC are 0.6 MPa and 0.3 MPa, respectively.
Plants 14 03538 g002
Figure 3. Equation (8) is used to plot the dimensionless equilibrium turgor pressure, Peq*, as a function of Π p w =   ϕ p   L w .
Plants 14 03538 g003
Figure 4. The time-dependent relative growth rate, v(t), calculated using Equation (9) and P(t) for the red curve in Figure 1.
Plants 14 03538 g004
Figure 5. The steady relative growth rate, vs, versus Π p w =   ϕ p   L w when ϕp = 0.50 h−1 MPa−1 (green curve), ϕp = 0.25 h−1 MPa−1 (blue curve), and ϕp = 0.10 h−1 MPa−1 (red curve). Equation (12) was used to calculate vs as a function of Πpw. The values for Δπ and PC were the same for all curves; Δπ = 0.6 MPa and PC = 0.3 MPa.
Plants 14 03538 g005
Table 1. The numerical values for the curves in Figure 1 are presented here. The values in the first four rows (for Δπ, PC, ε, and ϕp) are common to all curves, except for the last two time-intervals of the red curve. The values in the next five rows (for Lw, Peq, tc, Πpw, and vs) are for the green curve, and the next five rows are for the blue curve. The last five rows are for the red curve and for a single a time interval of 2.5 h. The steady relative growth rate, vs, was calculated with Equation (10).
Biophysical
Variable (Units)
t < 0Time Intervals
0.0 h ≤ t < 0.75 h
0.75 h ≤ t < 1.5 h1.5 h ≤ t < 2.5 h
Δπ (MPa)0.60.60.60.6
PC (MPa)---0.30.30.3
ε (MPa)9.09.09.09.0
ϕp (h−1 MPa−1)0.00.250.500.10
  For Green Curve  
Lw (h−1 MPa−1)2.02.02.02.0
Peq (MPa)0.600.5660.5400.586
tc = (h)---0.0490.0440.053
Πpw---0.1250.250.05
vs (h−1)---0.0670.120.029
  For Blue Curve  
Lw (h−1 MPa−1)2.00.50.50.5
Peq (MPa)0.600.5000.4500.550
tc = (h)---0.1480.1110.185
Πpw---0.51.00.2
vs (h−1)---0.050.0750.025
 For Red Curve  
 t < 00.0 h ≤ t < 2.5 h  
Lw (h−1 MPa−1)2.00.025  
Peq (MPa)0.600.327  
tc = (h)---0.40  
Πpw---10.0  
vs (h−1)---0.00675  
Disclaimer/Publisher’s Note: The statements, opinions and data contained in all publications are solely those of the individual author(s) and contributor(s) and not of MDPI and/or the editor(s). MDPI and/or the editor(s) disclaim responsibility for any injury to people or property resulting from any ideas, methods, instructions or products referred to in the content.