Article

Integrated Transcriptome–Metabolome Analysis Reveals the Flavonoids Metabolism Mechanism of Maize Radicle in Response to Low Temperature

1
College of Agriculture, Heilongjiang Bayi Agricultural University, Daqing 163319, China
2
Key Laboratory of Low-Carbon Green Agriculture in Northeastern China, Ministry of Agriculture and Rural Affairs, Daqing 163319, China
3
Institute of Agricultural Resources and Environment, Jilin Academy of Agricultural Sciences, Changchun 130033, China
*
Author to whom correspondence should be addressed.
These authors contributed equally to this work.
Plants 2025, 14(19), 2988; https://doi.org/10.3390/plants14192988
Submission received: 22 August 2025 / Revised: 20 September 2025 / Accepted: 25 September 2025 / Published: 26 September 2025
(This article belongs to the Section Plant Genetics, Genomics and Biotechnology)

Abstract

The Northeast region in China is a major maize-producing area; however, low-temperature stress (TS) limits maize (Zea mays L.) seed germination, affecting population establishment and yield. In order to systematically explore the regulation mechanism of maize radicle which is highly sensitive to low-temperature environment response to TS, seeds of ZD958 and DMY1 were used to investigate germination responses under 15 °C (control) and 5 °C (TS) conditions. Phenotypic, physiological, transcriptomic, and metabolomic analyses were conducted on the radicles after 48 h of TS treatment. TS caused reactive oxygen species (ROS) imbalance and oxidative damage in radicle cells, inhibiting growth and triggering antioxidant defenses. Integrated transcriptomic and metabolomic analyses revealed that flavonoid metabolism may play a pivotal role in radicle responses to TS. Compared with the control treatment, ZD958 and DMY1 under TS treatment significantly increased (p < 0.01) the total flavonoid content, total antioxidant capacity, 4-coumarate-CoA ligase activity, and dihydroflavonol 4-reductase activity by 15.99% and 16.01%, 18.41% and 18.54%, 63.54% and 31.16%, and 5.09% and 7.68%, respectively. Despite genotypic differences, both followed a shared regulatory logic of “low-temperature signal-driven—antioxidant redirection—functional synergy.” This enabled ROS scavenging, redox balance, and antioxidant barrier formation, ensuring basal metabolism and radicle development.

1. Introduction

Maize (Zea mays L.) is a globally important multi-purpose crop used for food, feed, and industrial raw materials [1]. It has the largest planting area in China, accounting for more than one-third of China’s total grain production. The Northeast region of China is also a major maize-producing area, and the region’s sustained high-yield, efficient maize cultivation plays a vital role in stabilizing regional food supply levels and agricultural economic development [2]. Reasonable planting density can optimize the spatial layout of the population and coordinate resource competition between individuals and the population, thereby improving the photosynthetic efficiency and resource utilization efficiency, and ultimately increasing maize yield [3]. Seed germination is the initial stage of crop growth and development, which in turn affects yield and quality. Its success directly affects the quality of seedling establishment and relates to the subsequent productivity and production efficiency of the crop population [4,5]. However, owing to global climate change, unfavorable meteorological conditions such as seasonal low temperatures and cold damage during the spring season have become more frequent in northeastern China, particularly in high-latitude cold regions [6]. These conditions often result in delayed maize germination, reduced emergence and survival rates, and notably poorer uniformity [7]. These factors make it difficult to form high-quality dense plant populations, and has now become one of the key issues affecting the efficient mechanized production of maize throughout its growth cycle in the high-latitude cold regions of northeastern China, severely constraining the sustained increase in maize yields and the high-quality development of the agricultural economy.
As one of the primary abiotic stresses, low-temperature cold damage can cause excessive accumulation of reactive oxygen species (ROS) in plant cells, leading to membrane lipid peroxidation reactions and DNA, RNA, and protein damage [8], as well as inhibiting the function of the mitochondrial electron transport chain, reducing ATP synthesis efficiency, and inhibiting plant growth and development [9]. To mitigate the adverse effects of low-temperature environments, plant cells have developed various repair mechanisms, among which antioxidant system activation is a core defense strategy [10]. As a key component of the antioxidant defense system, flavonoids, including isoflavones, flavonols, anthocyanidins, flavanols, flavanones, chalcones, and dihydrochalcones, are essential natural secondary metabolites widely distributed in plants [11]. Their unique C6-C3-C6 benzene ring structure enables them to act as reducing agents in certain reactions. Their antioxidant effects are exerted through a multi-dimensional synergistic mechanism, including reducing free radical formation, scavenging stress-induced ROS, inhibiting the activity of superoxide anion (O2)-producing oxidases, and activating antioxidant enzymes [12], thus protecting plants from UV radiation, microbial damage, and oxidative stress-induced injury [13,14]. Temperature is the primary environmental factor regulating secondary metabolites in plants, and stress induced by temperatures between 4 and 10 °C leads to flavonoid and terpenoid accumulation [15]. Transcriptomic and metabolomic studies have indicated that under low-temperature stress (TS), the application of exogenous melatonin can alleviate damage to Elymus nutans Griseb. by enhancing the activity of antioxidant enzymes and increasing glycyrrhizin and delphinidin accumulation [16]. Furthermore, the differential synthesis and accumulation of 13 flavonoids (phloretin, epicatechin and quercetin, etc.) in the needles of wild-type Cryptomeria fortunei is one of the important mechanisms for its superior cold resistance [17]. Compared to cold-sensitive varieties, cold-tolerant alfalfa varieties actively upregulate the expression of genes related to flavonoid biosynthesis enzymes, such as chalcone synthase, anthocyanin dioxygenase, and flavonoid 3′-monooxygenase in leaves, synthesizing more flavonoids to counteract the adverse effects of low temperatures [18].
As one of the primary components of the seed embryo, the radicle is highly sensitive to low-temperature environments from seed germination to seedling development. In numerous studies on rice [19], maize [20], and halophytes [21], the radicle has been used as an important indicator in low-temperature tolerance variety screening and evaluation, molecular-assisted breeding, and innovation in stress-tolerant cultivation techniques. Although previous studies have investigated the mechanisms by which maize radicles respond to abiotic stress [22,23,24,25,26,27], the mechanisms underlying radicle responses to TS during maize germination remain unknown. Therefore, in order to systematically explore the regulation mechanism of maize radicle response to TS, seeds of two varieties Zhengdan958 (ZD958) and Demeiya1 (DMY1), primarily cultivated in the high-latitude cold regions of Northeastern China were used to investigate germination responses under 15 °C (control, CT) and 5 °C (TS) conditions. Phenotypic, physiological, transcriptomic, and metabolomic analyses were conducted on the radicles after 48 h of TS treatment. This study deepens the understanding of the physiological basis of maize radicles adapting to TS by revealing the metabolic regulatory pathway of flavonoids. It lays a theoretical foundation for improving the low-temperature tolerance of maize seeds during germination and optimizing the corresponding cultivation regulation techniques in cold regions.

2. Results

2.1. Effect of TS on the Phenotypic Characteristics of Maize Radicles

Under TS conditions, significant (p < 0.01) changes in the growth of ZD958 and DMY1 radicles were observed (Figure 1a). After 48 h of treatment, the terminal radicle length of ZD958 under CT treatment (ZCT) and DMY1 under CT treatment (DCT) increased by 1.90 cm and 2.03 cm, respectively, whereas those of ZD958 under TS treatment (ZTS) and DMY1 under TS treatment (DTS) increased by only 0.17 cm and 0.10 cm, respectively. This resulted in a reduction of 57.14% to 64.62% in the terminal radicle length of the TS treatment compared to the CT treatment (Figure 1b,c). Additionally, compared to the CT treatment, the fresh weight (FW) and dry weight (DW) of the embryonic roots in the ZTS and DTS decreased by 55.34% and 41.44%, and 58.88% and 48.15%, respectively, with all differences reaching extremely significant levels (p < 0.01; Figure 1d,e).

2.2. Effect of TS on Physiological and Biochemical Indicators of Maize Radicles

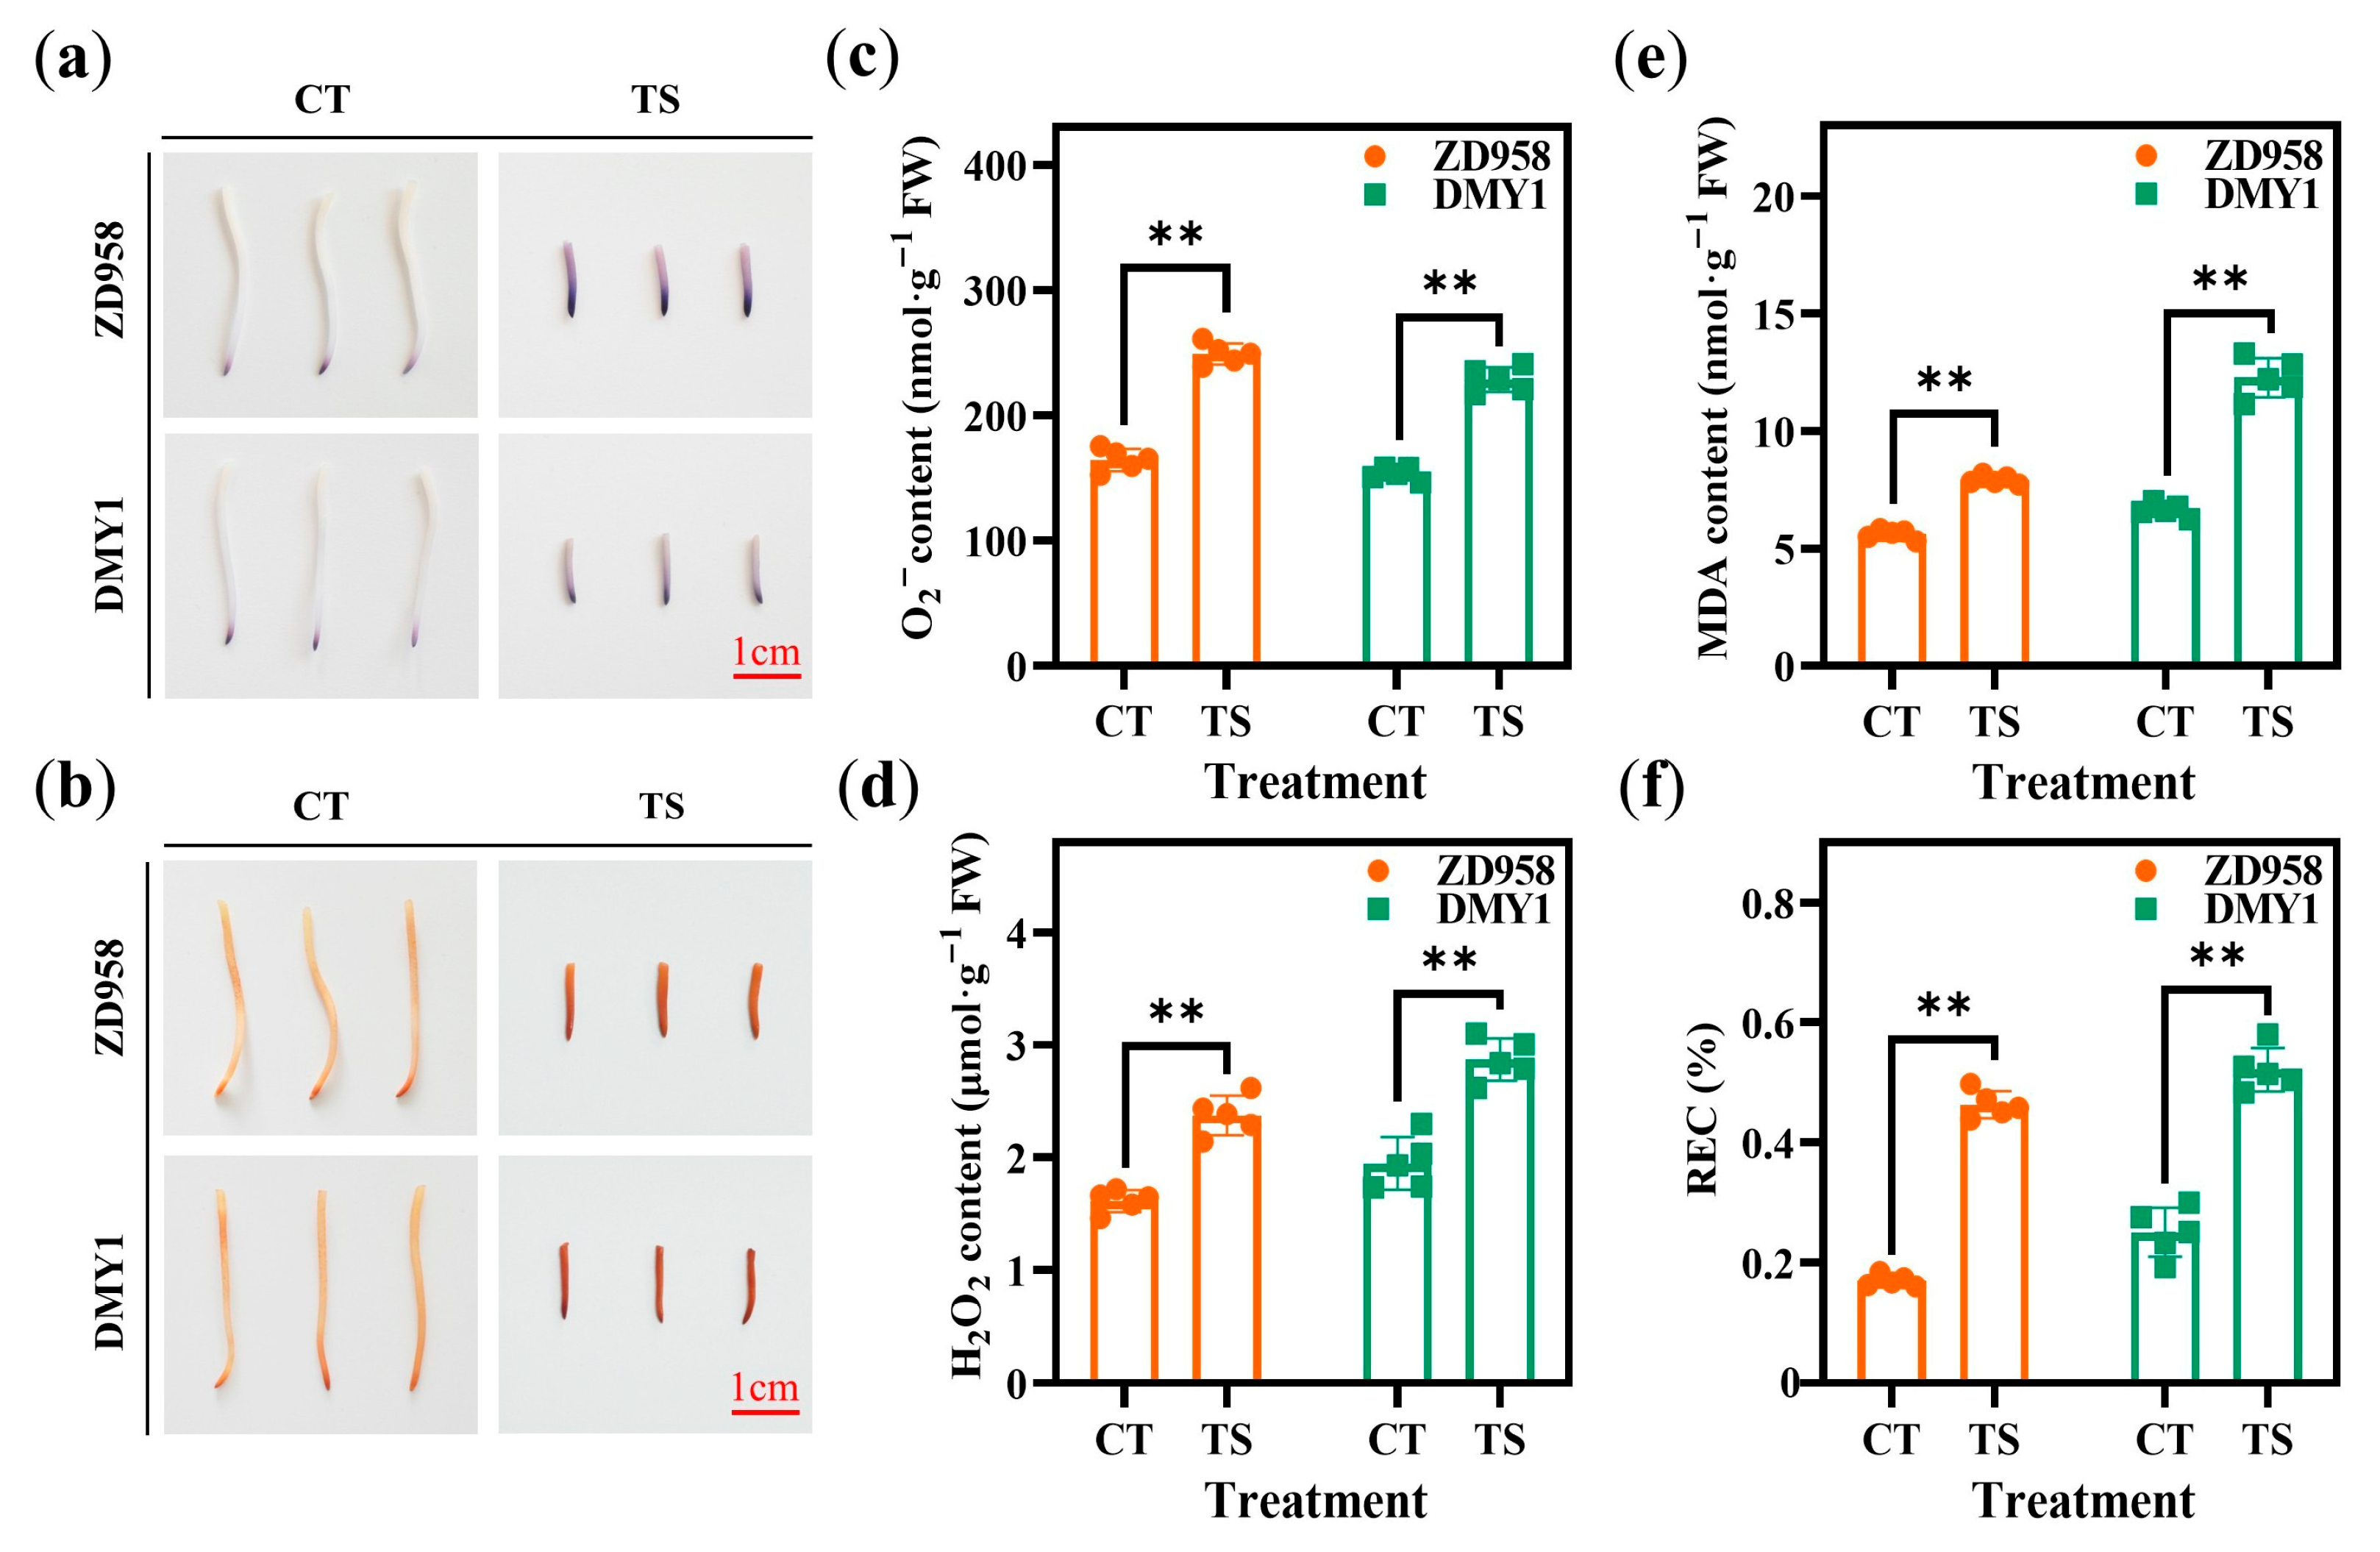
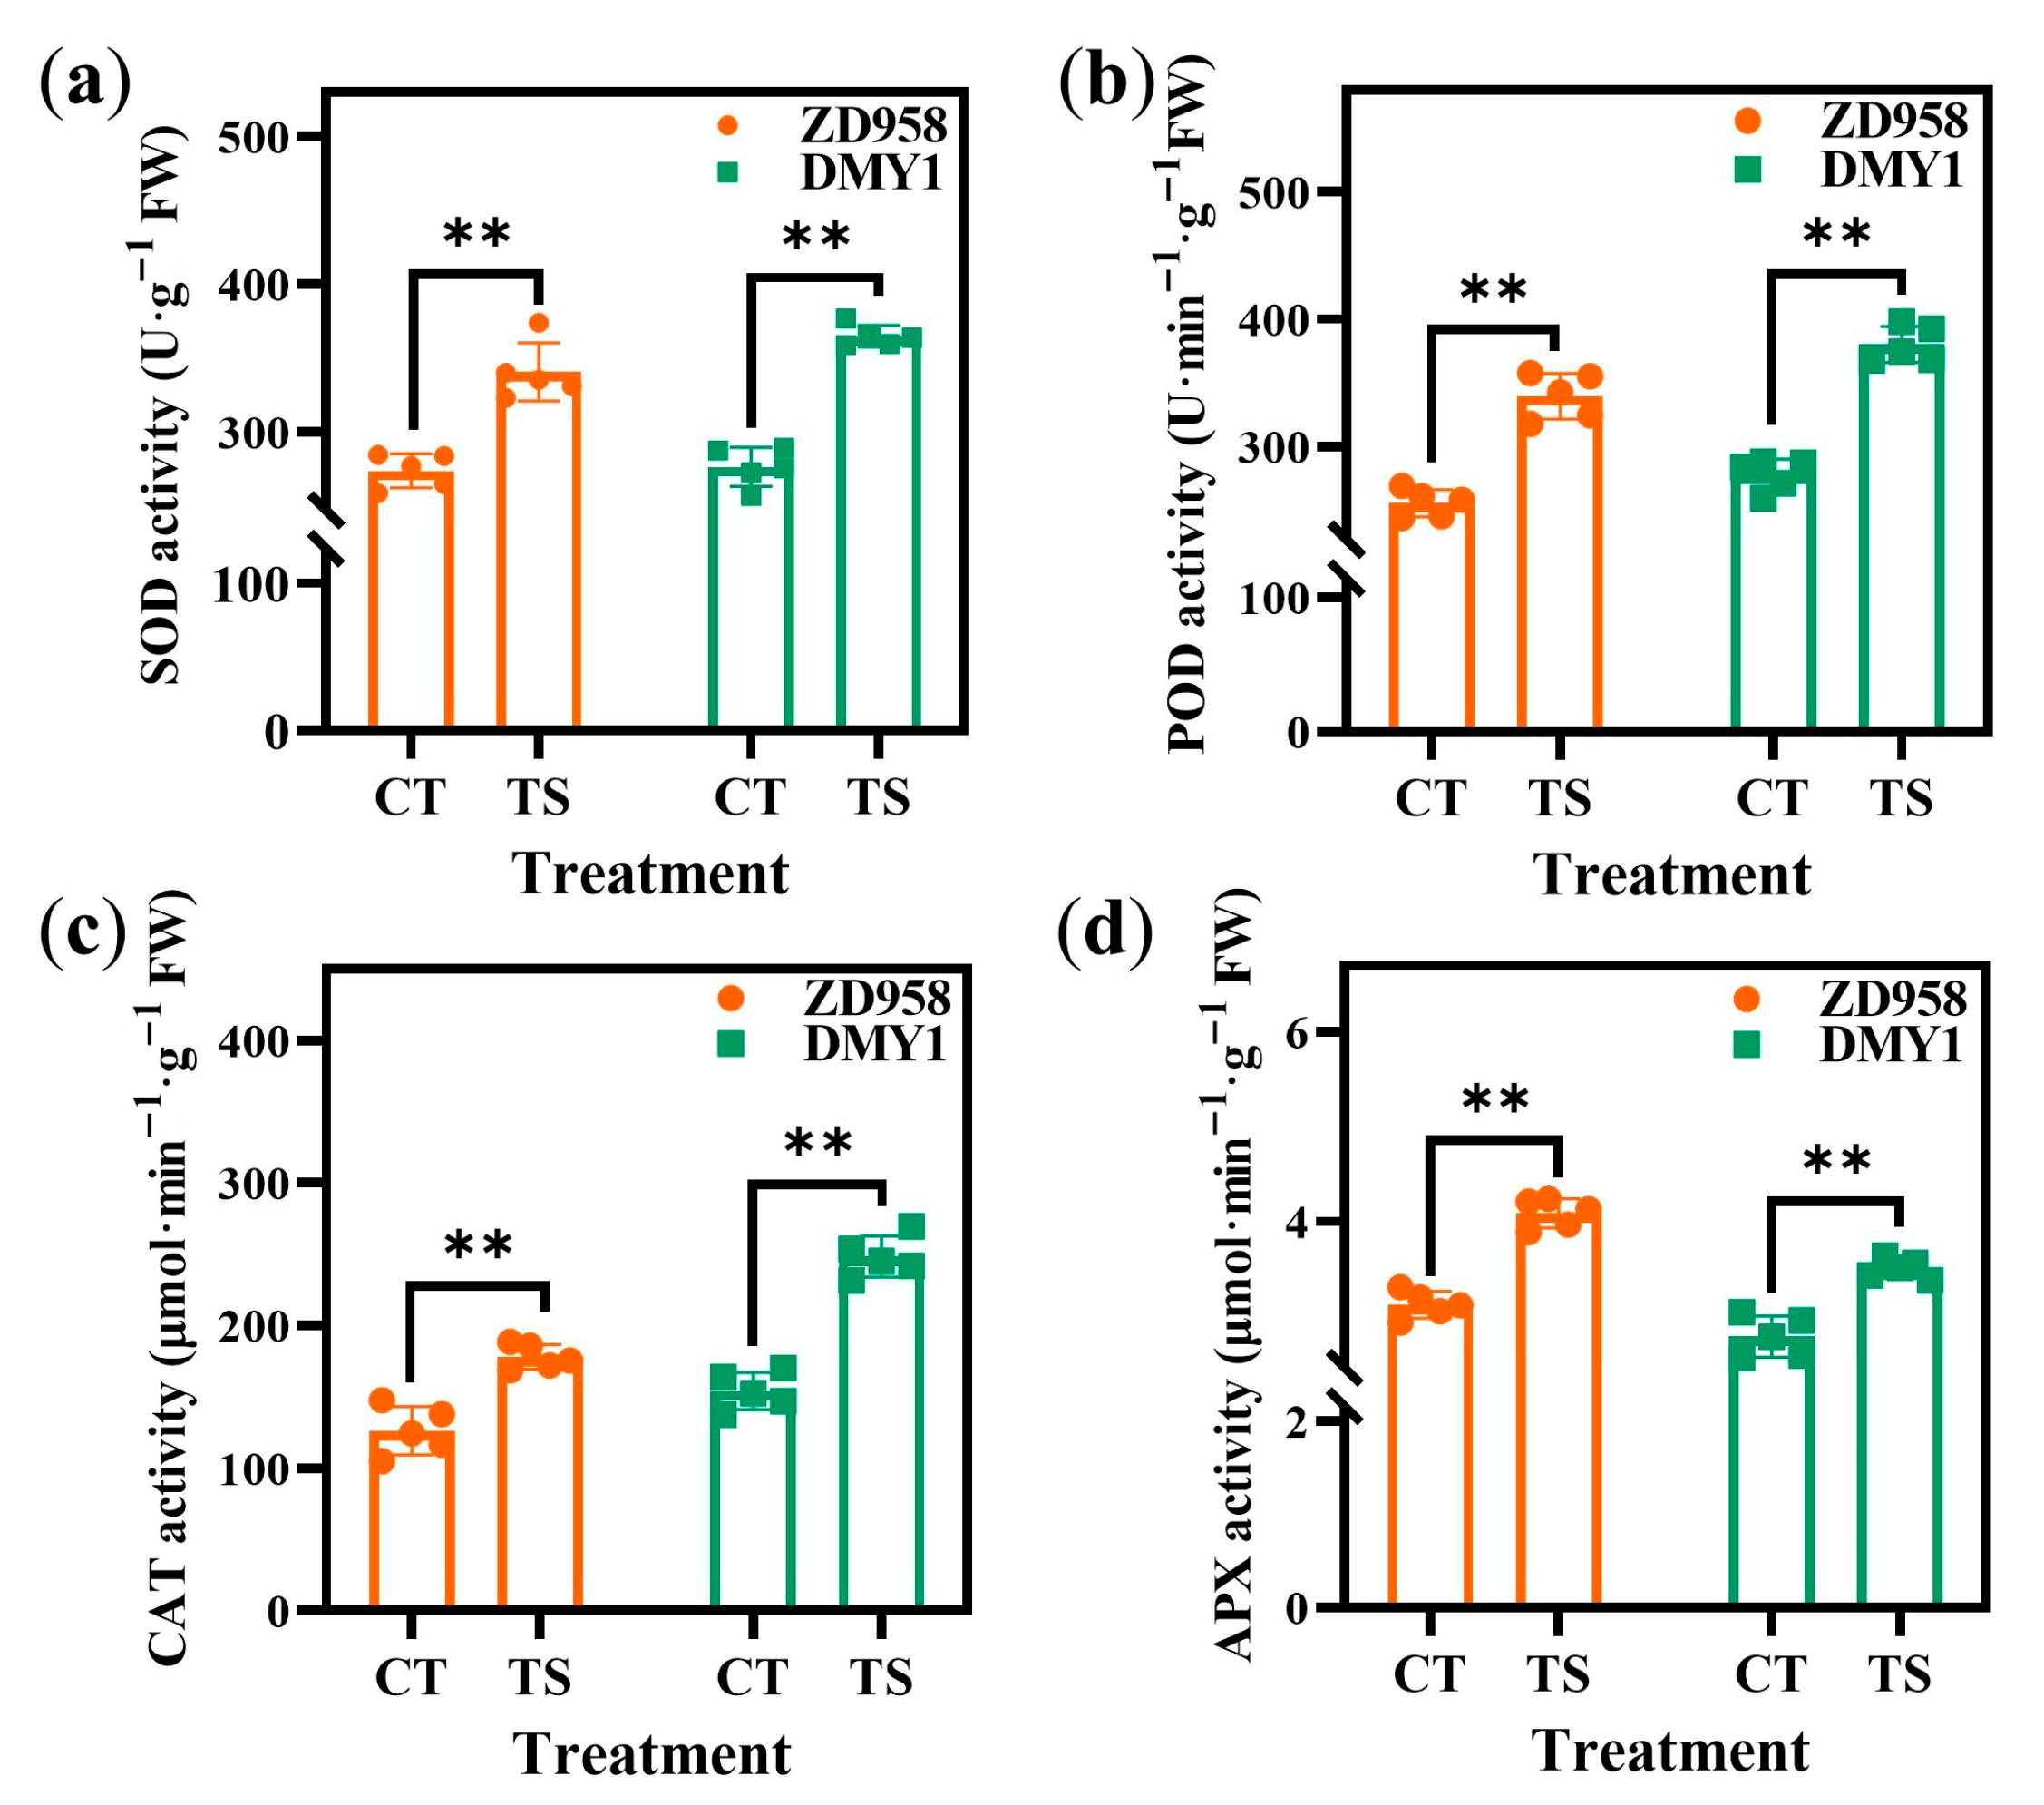
After staining the radicles of different varieties using nitrotetrazolium blue chloride (NBT) and 3,3′-diaminobenzidine (DAB), the color of the TS treatment was significantly darker than that of the CT treatment (Figure 2a,b). Simultaneously, compared to O2, H2O2, and malondialdehyde (MDA) levels in CT-treated radicles, ZTS increased these levels by 51.43%, 47.14%, and 43.38%, respectively, whereas DTS increased them by 49.10%, 47.40%, and 84.90%, respectively (Figure 2c–e). Similarly, the relative electrical conductivity (REC) of ZTS and DTS radicles increased by 173.24% and 108.30%, respectively, compared to CT treatment across all varieties (Figure 2f). Additionally, superoxide dismutase (SOD), peroxidase (POD), catalase (CAT), and ascorbate peroxidase (APX) activities increased under TS treatment, with increases of 27.85–34.72%, 29.91–32.46%, 56.00–60.84%, and 27.71–27.94, respectively, compared to CT treatment (Figure 3). The differences in these physiological indicators were highly significant (all p < 0.01).

2.3. RNA-Seq and Differentially Expressed Gene Analysis of Maize Radicles Under TS

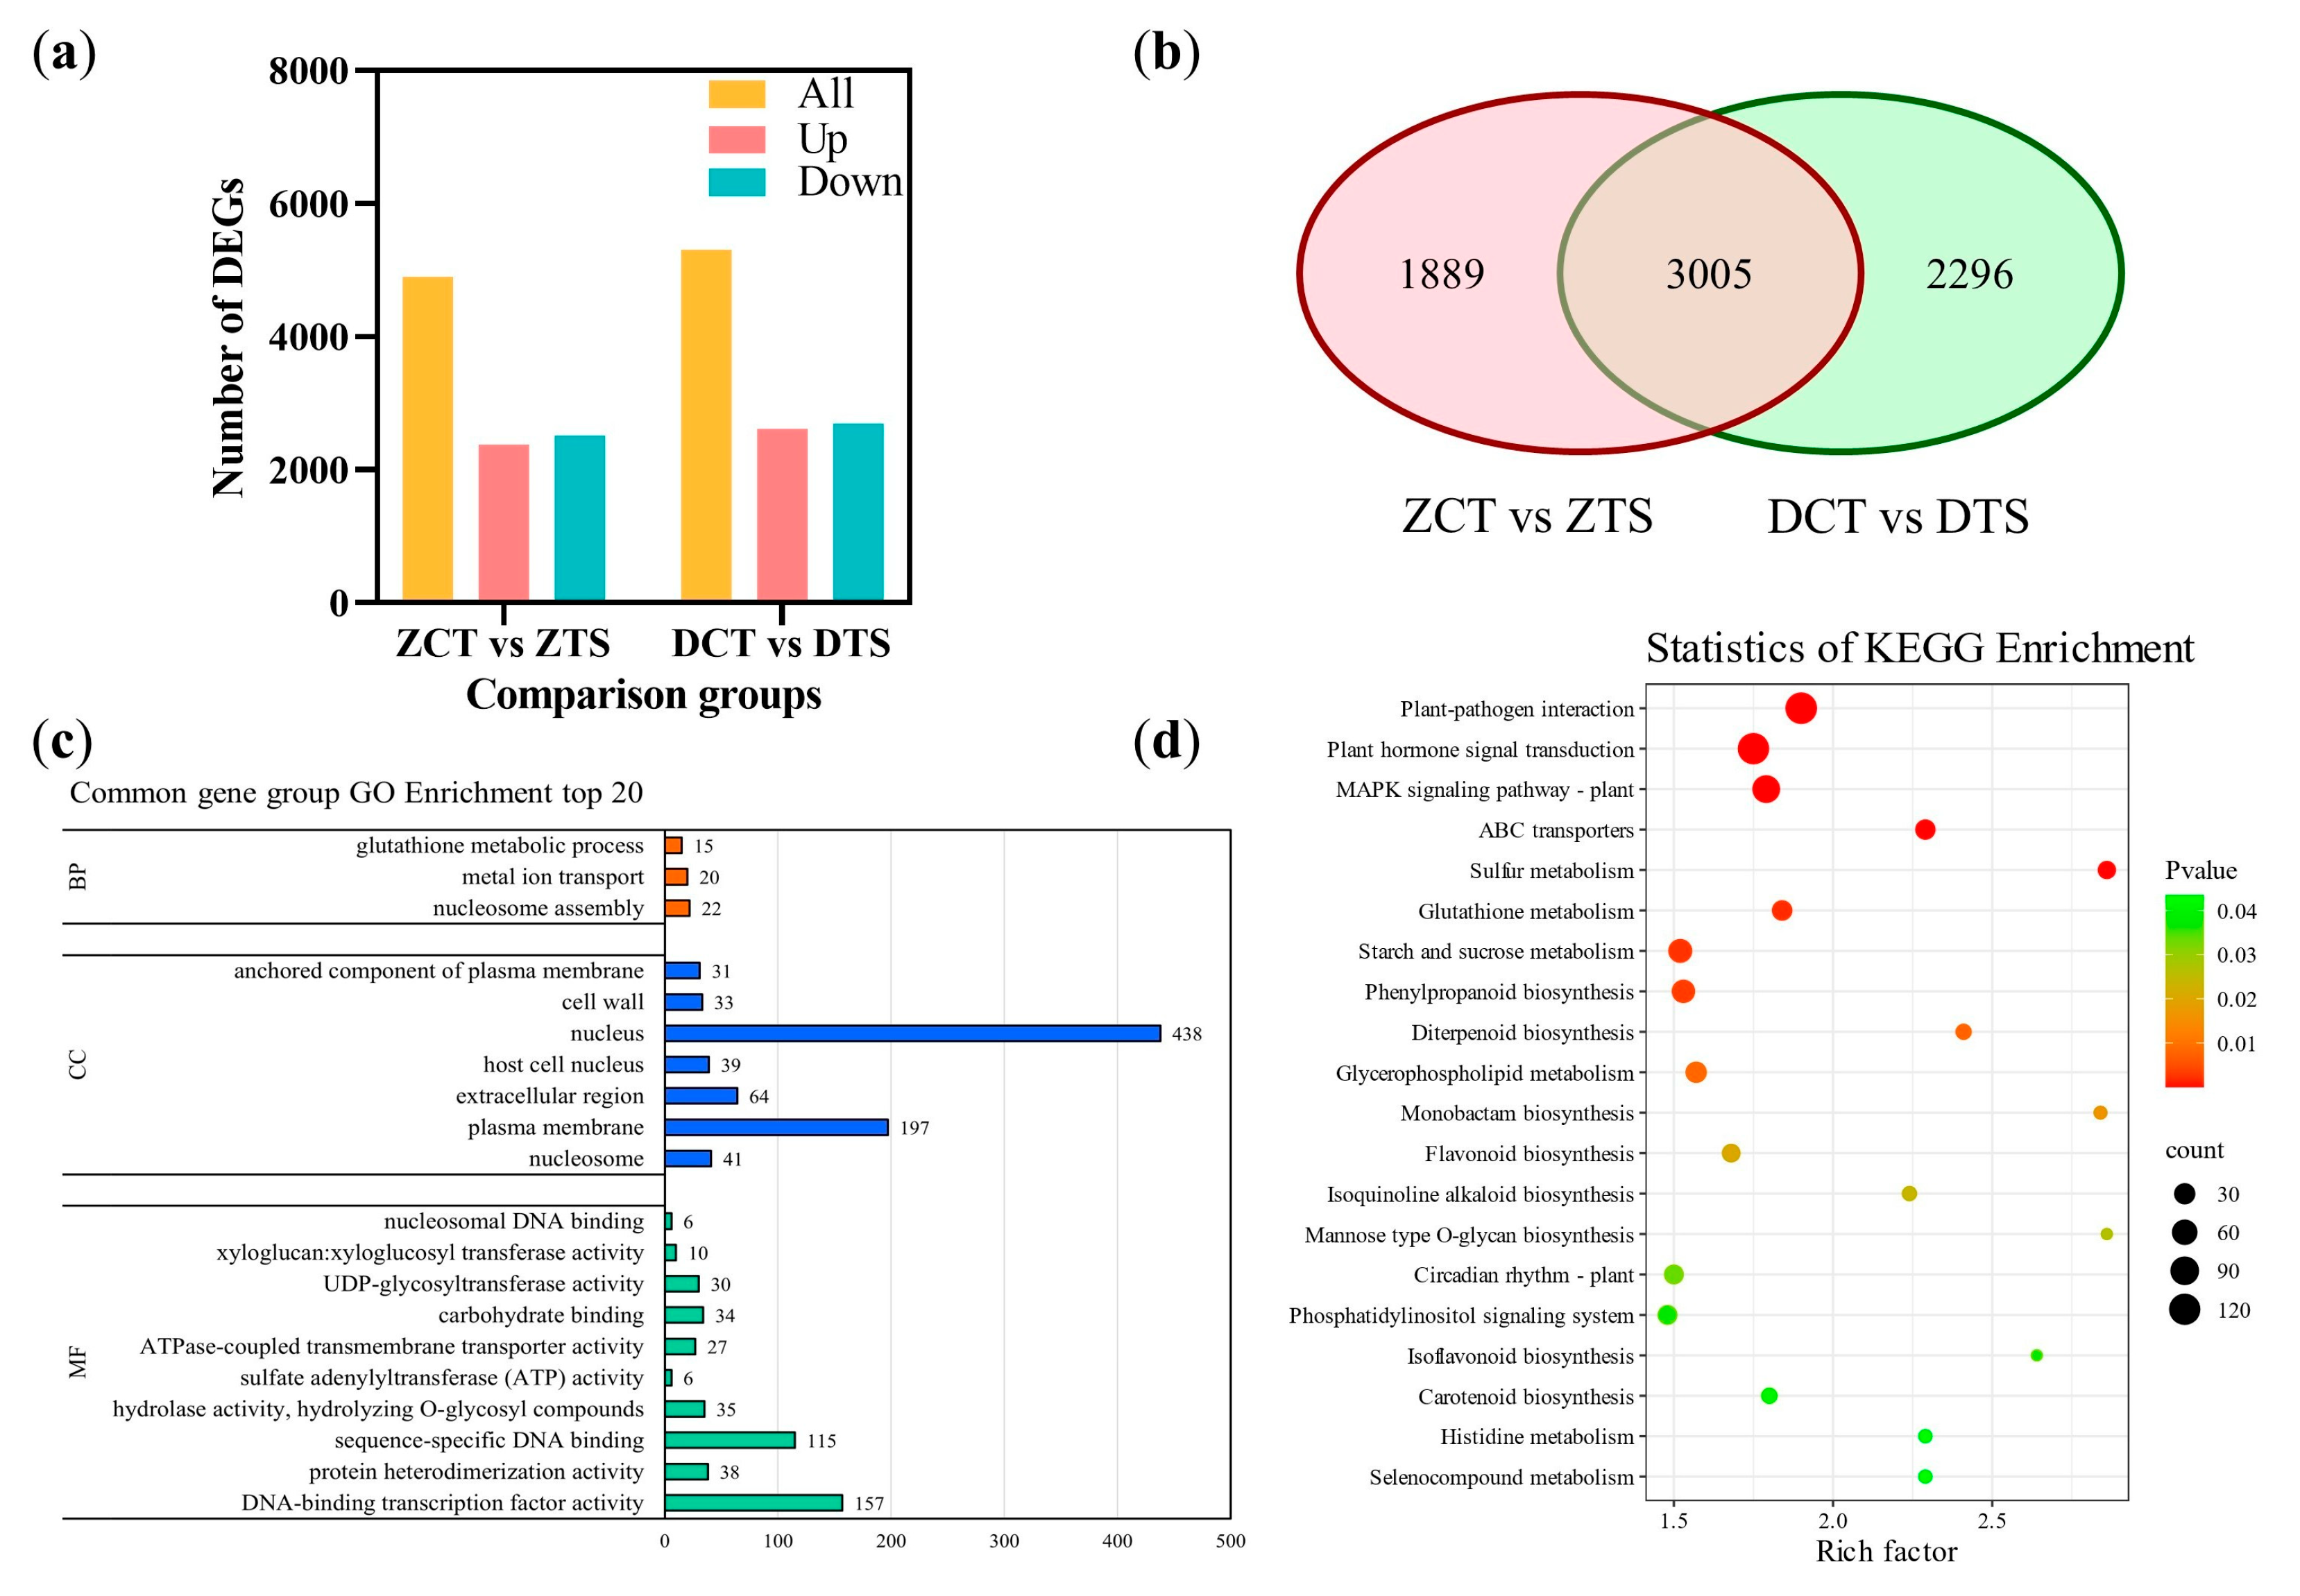
This study obtained a total of 90.71 Gb of clean data through transcriptomics sequencing to elucidate the response mechanism of maize radicles under TS. Each sample had 6.02 Gb of clean data, with a quality score Q30 of 89.42% or higher and a GC content between 53.07% and 54.32%, indicating that the sequencing data was reliable (Table S1). Principal component analysis (PCA) and correlation heat maps indicated that the three biological replicates clustered closely in the four treatments of the 12 samples, indicating that the transcriptome data had high reproducibility (Figures S1 and S2). Differentially expressed genes (DEGs) were screened based on the fragments per kilobase of exon model per million mapped reads (FPKM) of each gene, with screening criteria of |log2FC| ≥ 1 and false discovery rate (FDR) < 0.01. A total of 4894 DEGs were screened in the “ZCT vs. ZTS” comparison group, of which 2379 were upregulated and 2515 were downregulated (Figure 4a; Table S2-1). In the “DCT vs. DTS” comparison group, 5301 DEGs were identified, including 2614 upregulated and 2687 downregulated genes (Table S2-2). A total of 3005 DEGs were co-expressed between the “ZCT vs. ZTS” and “DCT vs. DTS” comparison groups (Figure 4b, Table S2-3).
Gene Ontology (GO) enrichment analysis revealed that these DEGs exhibited changes in enrichment results for molecular function (MF), cellular component (CC), and biological process (BP) (Figure 4c, Figures S3a and S4a). In the top 20 terms of DEGs in the “DCT vs. DTS” comparison group, six GO terms were enriched in BP, whereas DEGs in the “ZCT vs. ZTS” comparison group were enriched in three GO terms. Although maize radicles of different genotypes exhibited varying degrees of responses to TS, they were significantly (p < 0.05) enriched terms such as “hydrogen peroxide catabolic process” (GO: 0042744) and “response to oxidative stress” (GO: 0006979) (Table S3).
Kyoto Encyclopedia of Genes and Genomes (KEGG) enrichment analysis indicated that in the common DEGs of “ZCT vs. ZTS” and “DCT vs. DTS,” glutathione metabolism (ko00480), flavonoid biosynthesis (ko00941), isoflavonoid biosynthesis (ko00943), and other pathways were significantly enriched (p < 0.05) (Figure 4d, Table S4-1); whereas the plant–pathogen interaction (ko04626), phenylpropanoid biosynthesis (ko00940), flavonoid biosynthesis, and isoflavonoid biosynthesis pathways were significantly enriched (p < 0.05) only in the “ZCT vs. ZTS” comparison group (Figure S3b, Table S4-2). Phenylpropanoid biosynthesis, flavonoid biosynthesis, starch and sucrose metabolism (ko00500), isoflavonoid biosynthesis, and other pathways were significantly enriched (p < 0.05) only in the “DCT vs. DTS” comparison group (Figure S4b, Table S4-3). These results preliminarily indicate that the phenylpropanoid biosynthesis, flavonoid biosynthesis, and isoflavonoid biosynthesis pathways actively participate in the response of maize radicles to TS.

2.4. Co-Expression Trend Analysis of DEGs in Maize Radicles Under TS

Based on RNA-Seq data, co-expression trend analysis was performed on the identified DEGs. The 4894 DEGs of ZD958 after TS were divided into 11 modules, and the 5301 DEGs of DMY1 were divided into 15 modules. The DEGs in modules 1, 3, 4, 7, 9, 10 in the “ZCT vs. ZTS” comparison group, and modules 2, 5, 6, 7, 8, 9, 12, and 15 in the “DCT vs. DTS” comparison group showed an upward trend (Figure S5a,b). In these modules, the DEGs in modules 4 and 10 of the “ZCT vs. ZTS” comparison group were associated with antioxidant defense and ROS clearance. GO enrichment analysis showed that significantly enriched (p < 0.05) terms in BP included “oxidation-reduction process” (GO:0055114), “cellular oxidant detoxification” (GO:0098869), and “response to reactive oxygen species” (GO:0000302). In MF, significantly enriched (p < 0.05) terms included “oxidoreductase activity” (GO:0016491) and “alternative oxidase activity” (GO:0009916) (Figure 5a, Table S5-1).
KEGG enrichment analysis revealed that pathways such as flavonoid biosynthesis, isoflavonoid biosynthesis, and selenocompound metabolism (ko00450) were significantly enriched (p < 0.05, Figure 5c, Table S5-2). The DEGs in modules 8 and 9 of the “DCT vs. DTS” comparison group were primarily related to secondary metabolism and antioxidant defense. GO enrichment analysis revealed significant (p < 0.05) enrichment in BP for entries such as “response to hydrogen peroxide,” “response to oxidative stress,” “regulation of secondary metabolic process” (GO:0043455), and hydrogen peroxide catabolic process (Figure 5b, Table S5-3); KEGG pathways such as flavonoid biosynthesis, monoterpenoid biosynthesis (ko00902), and isoflavonoid biosynthesis were significantly enriched (p < 0.05, Figure 5d, Table S5-4). This result further indicates that pathways such as flavonoid biosynthesis and isoflavonoid biosynthesis are potential candidate pathways for investigating the response of maize radicles to TS.

2.5. Weighted Gene Co-Expression Network Analysis of DEGs in Maize Radicles Under TS

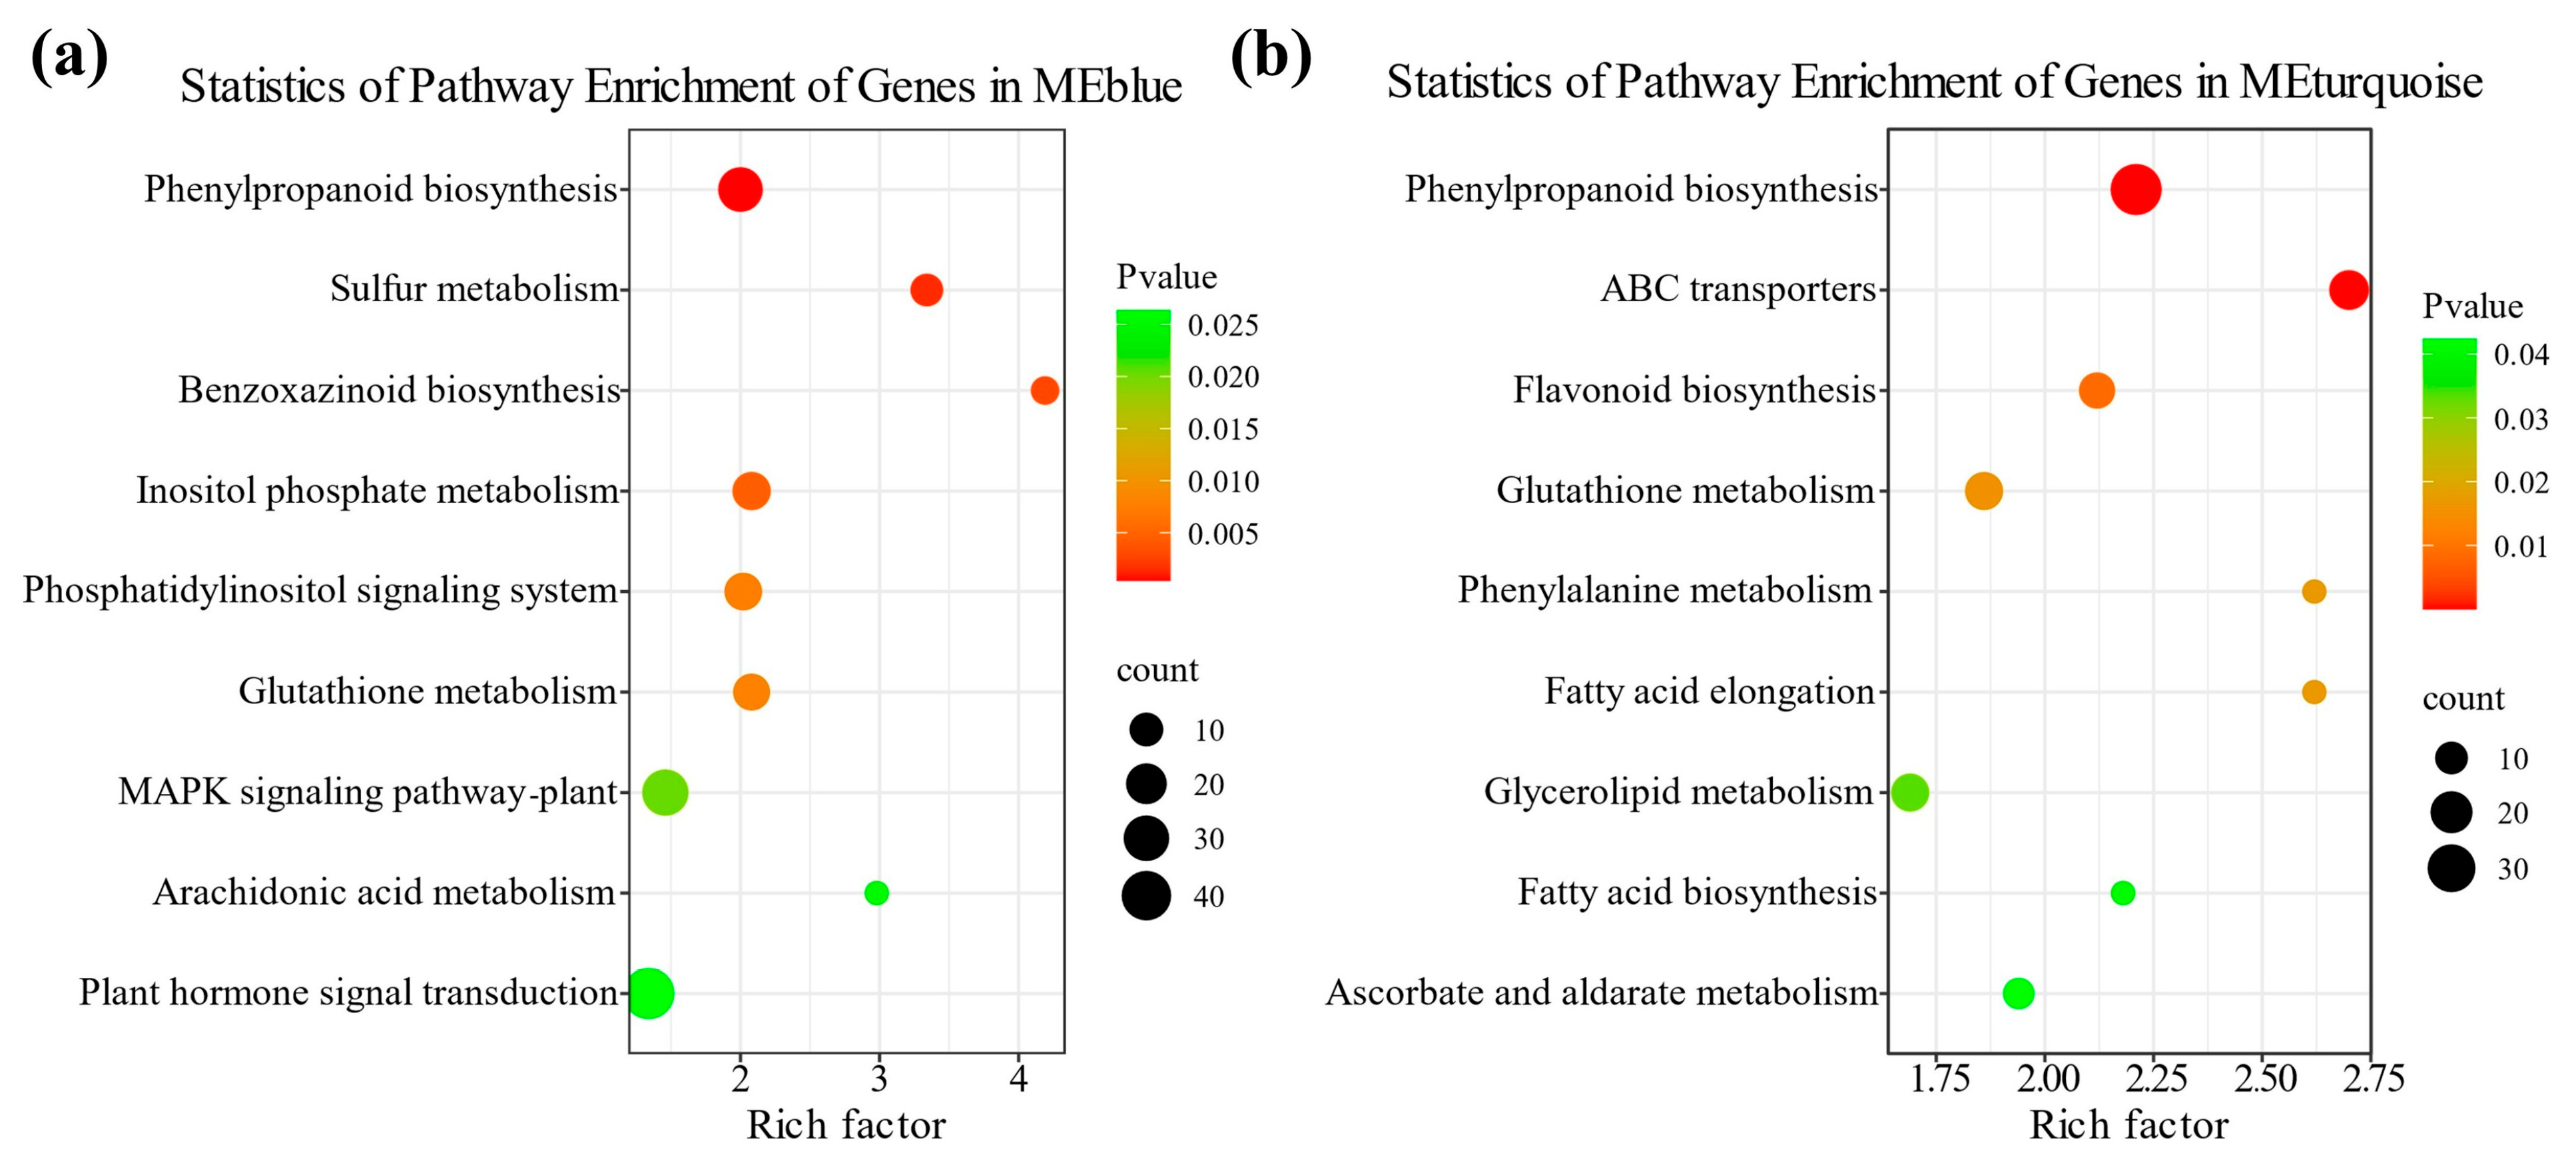
Using weighted gene co-expression network analysis (WGCNA), the DEGs of two different genotypes of maize radicles under TS were integrated into two color modules, MEblue and MEturquoise (Figure S6). The DEGs in the MEblue module were primarily related to the plant antioxidant system and membrane stability, whereas those in the MEturquoise module were mainly related to the antioxidant system and energy supply. KEGG enrichment analysis of DEGs in the two modules revealed that DEGs in the MEblue module were significantly enriched (p < 0.05) in pathways such as isoflavonoid biosynthesis, phenylpropanoid biosynthesis, and sulfur metabolism (ko00920) (Figure 6a,b; Table S6-1). DEGs in the MEturquoise module were significantly enriched (p < 0.05) in pathways such as phenylpropanoid biosynthesis, ABC transporters (ko02010), and flavonoid biosynthesis (Table S6-2). These results indicate that the phenylpropanoid biosynthesis, flavonoid biosynthesis, and isoflavonoid biosynthesis pathways are key candidate pathways in the transcriptional regulatory network of maize radicle response to TS.

2.6. Quantitative Real-Time Polymerase Chain Reaction Analysis of DEGs in Maize Radicles Under TS

Key regulatory pathways actively involved in the response of maize seed radicles to TS during the seed germination stage were comprehensively screened using DEGs analysis, co-expression trend analysis, and WGCNA. These pathways included phenylpropanoid biosynthesis, flavonoid biosynthesis, and isoflavonoid biosynthesis. Nine genes were randomly selected from these pathways for quantitative real-time polymerase chain reaction (qRT-PCR) analysis. Although the qRT-PCR values of the selected genes differed slightly from the FPKM values in RNA-Seq, the gene expression trends between the two were consistent, thereby validating the reliability of the RNA-Seq data (Figure 7).

2.7. Metabolomics Analysis of Maize Radicles Under TS

Metabolomics analysis was performed on radicle samples under different treatments to analyze their metabolic changes during germination in response to TS. PCA showed that, compared with CT treatment, TS treatment resulted in significant differences in metabolite levels among different genotypes of maize radicles, and all biological replicates exhibited good reproducibility (Figure S7). Further screening and comparison of differentially accumulated metabolites (DAMs) between different treatment groups identified 931 DAMs (574 upregulated and 357 downregulated) in the “ZCT vs. ZTS” comparison group and 1194 DAMs (554 upregulated and 640 downregulated) in the “DCT vs. DTS” comparison group. Additionally, 544 common DAMs were identified that responded to TS in both maize varieties (Figure S8).
KEGG enrichment analysis of DAMs revealed that pathways such as isoquinoline alkaloid (ko00950), isoflavonoid, and flavone and flavonol biosynthesis (ko00944) were enriched in the top 20 in the “ZCT vs. ZTS” comparison group (Table S7-1). Flavonoid biosynthesis, isoflavonoid biosynthesis, flavone and flavonol biosynthesis pathways were enriched in the top 20 in the “DCT vs. DTS” comparison group (Table S7-2); The isoflavonoid biosynthesis, phenylalanine metabolism (ko00360), and phenylpropanoid biosynthesis pathways were enriched in the top 20 common DAMs in both comparison groups (Table S7-3). The results of comprehensive transcriptomic and metabolomic analyses demonstrate that the phenylpropanoid, flavonoid biosynthesis, isoflavonoid biosynthesis, and flavone and flavonol biosynthesis pathways may play crucial roles in regulating maize radicle response to TS.

2.8. Analysis of the Regulatory Pathway of Flavonoid Metabolism in Maize Radicles Under TS

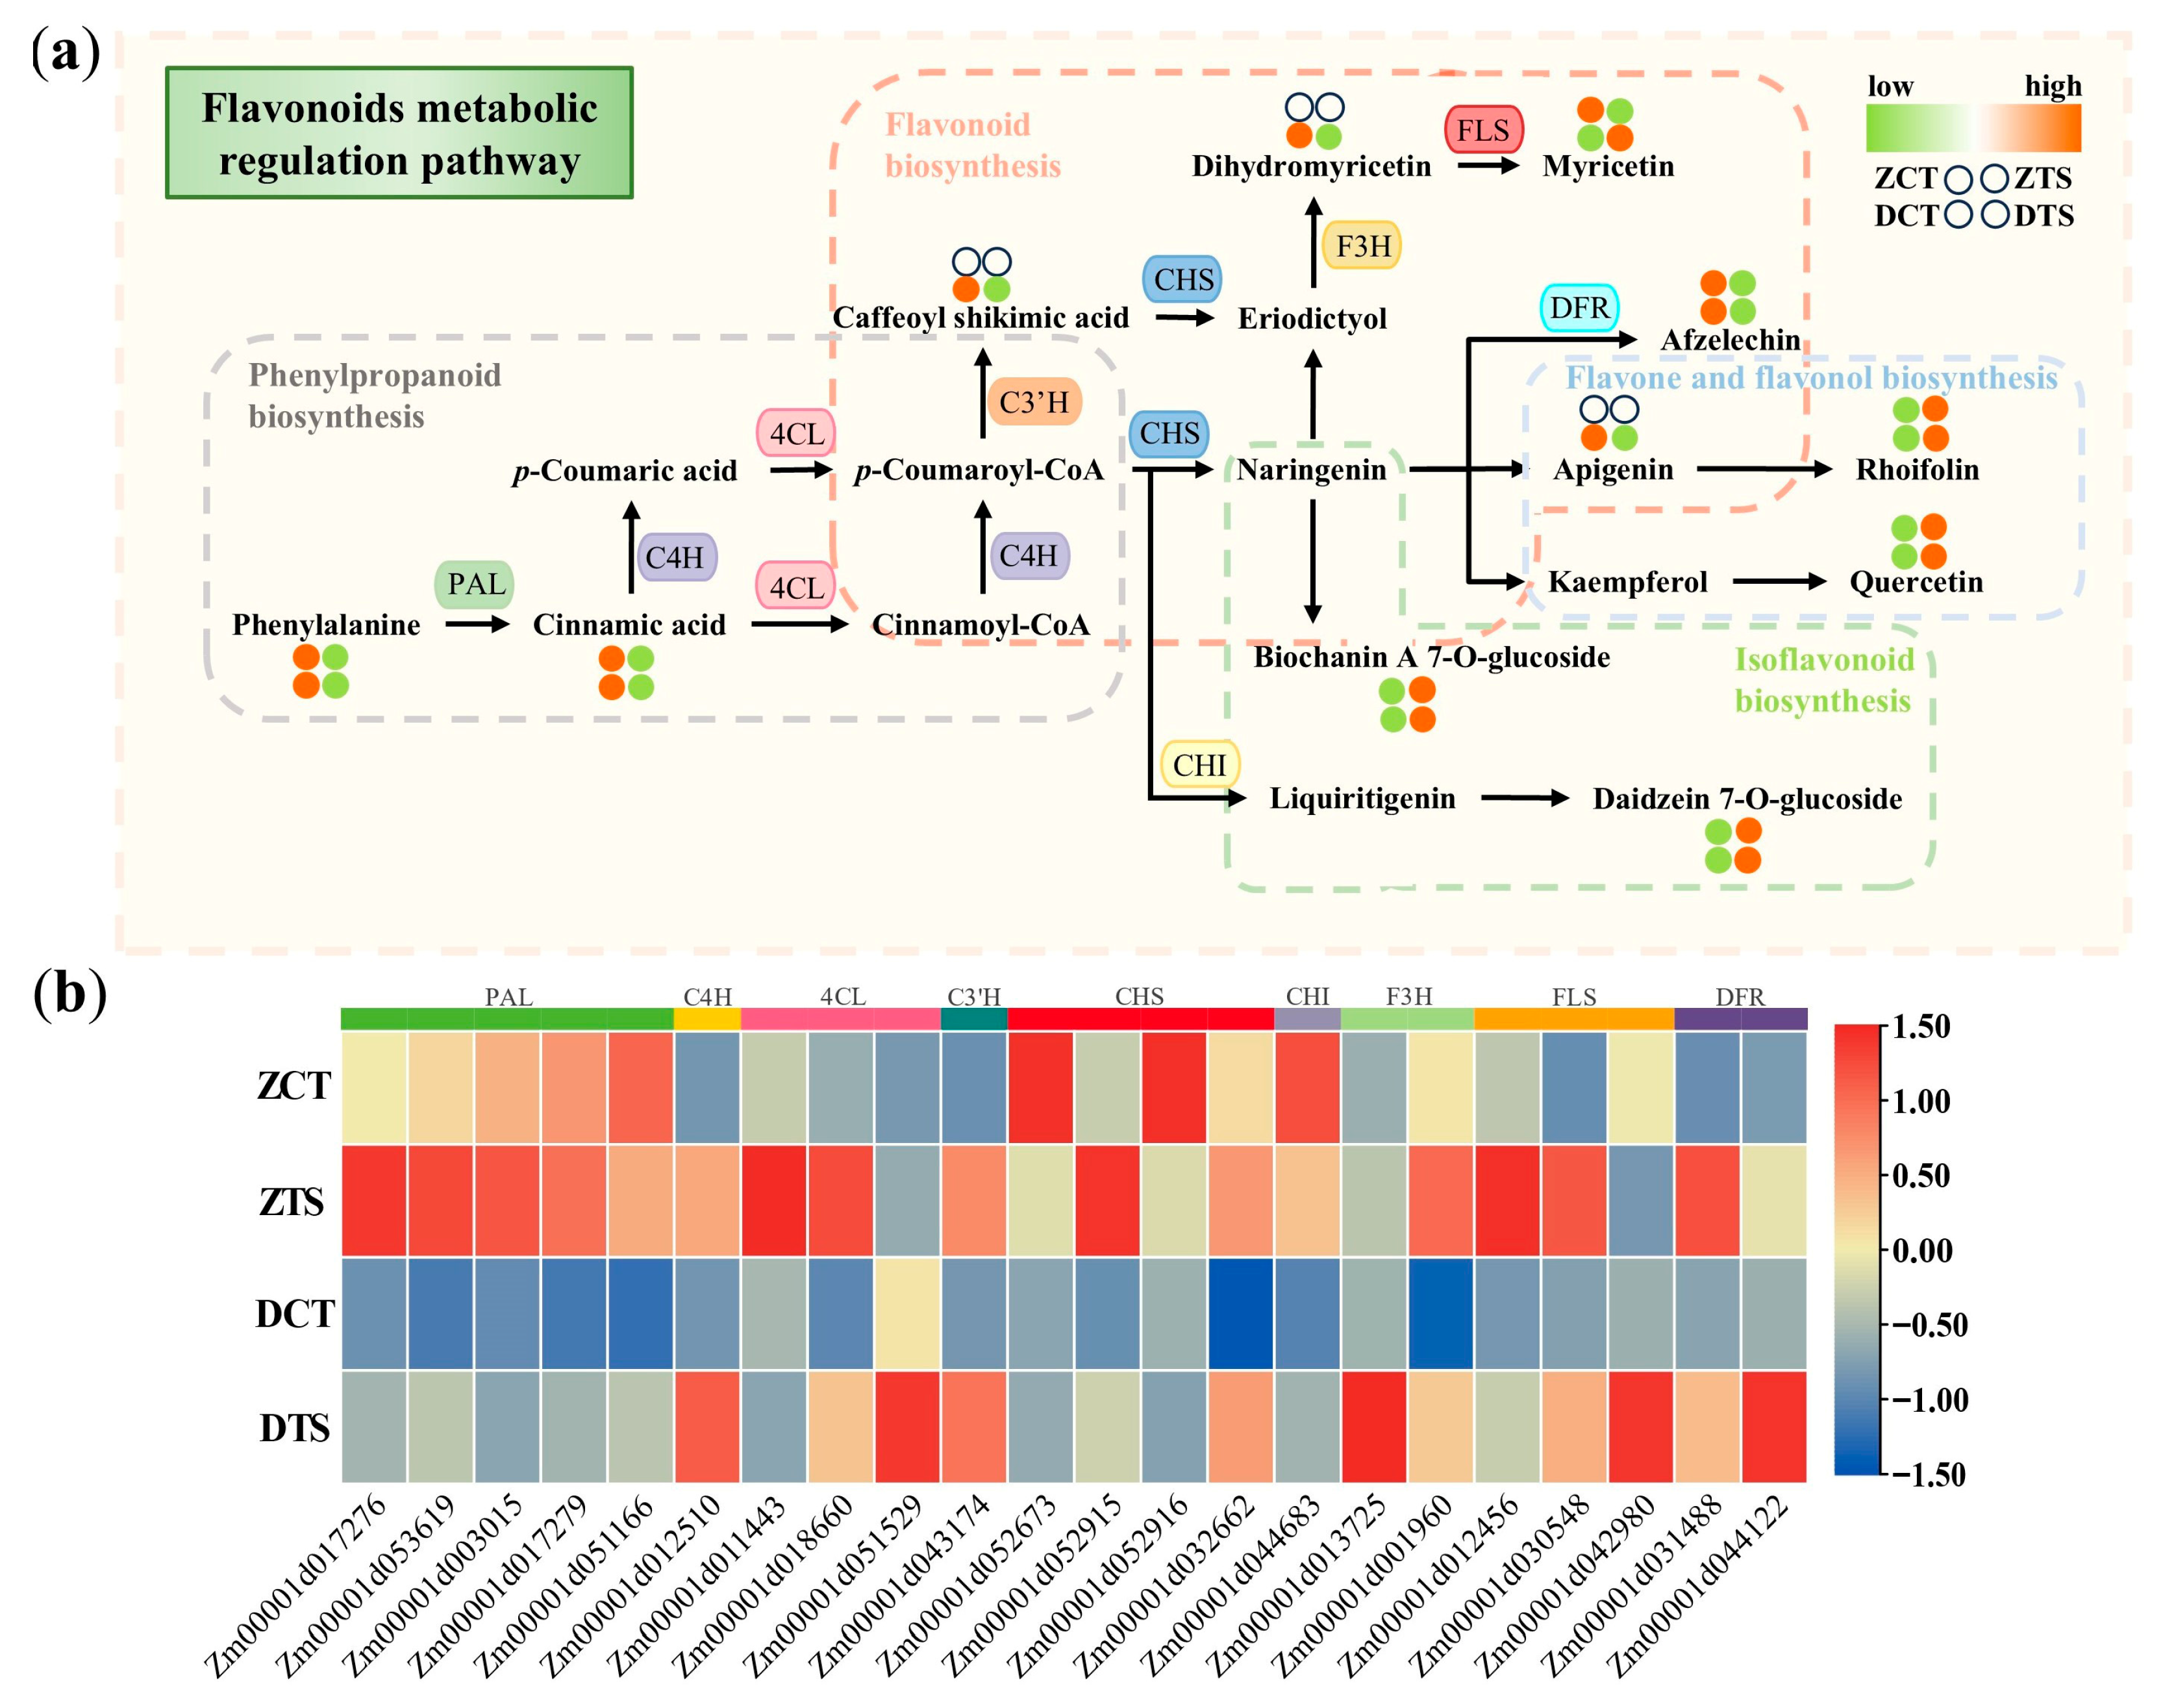
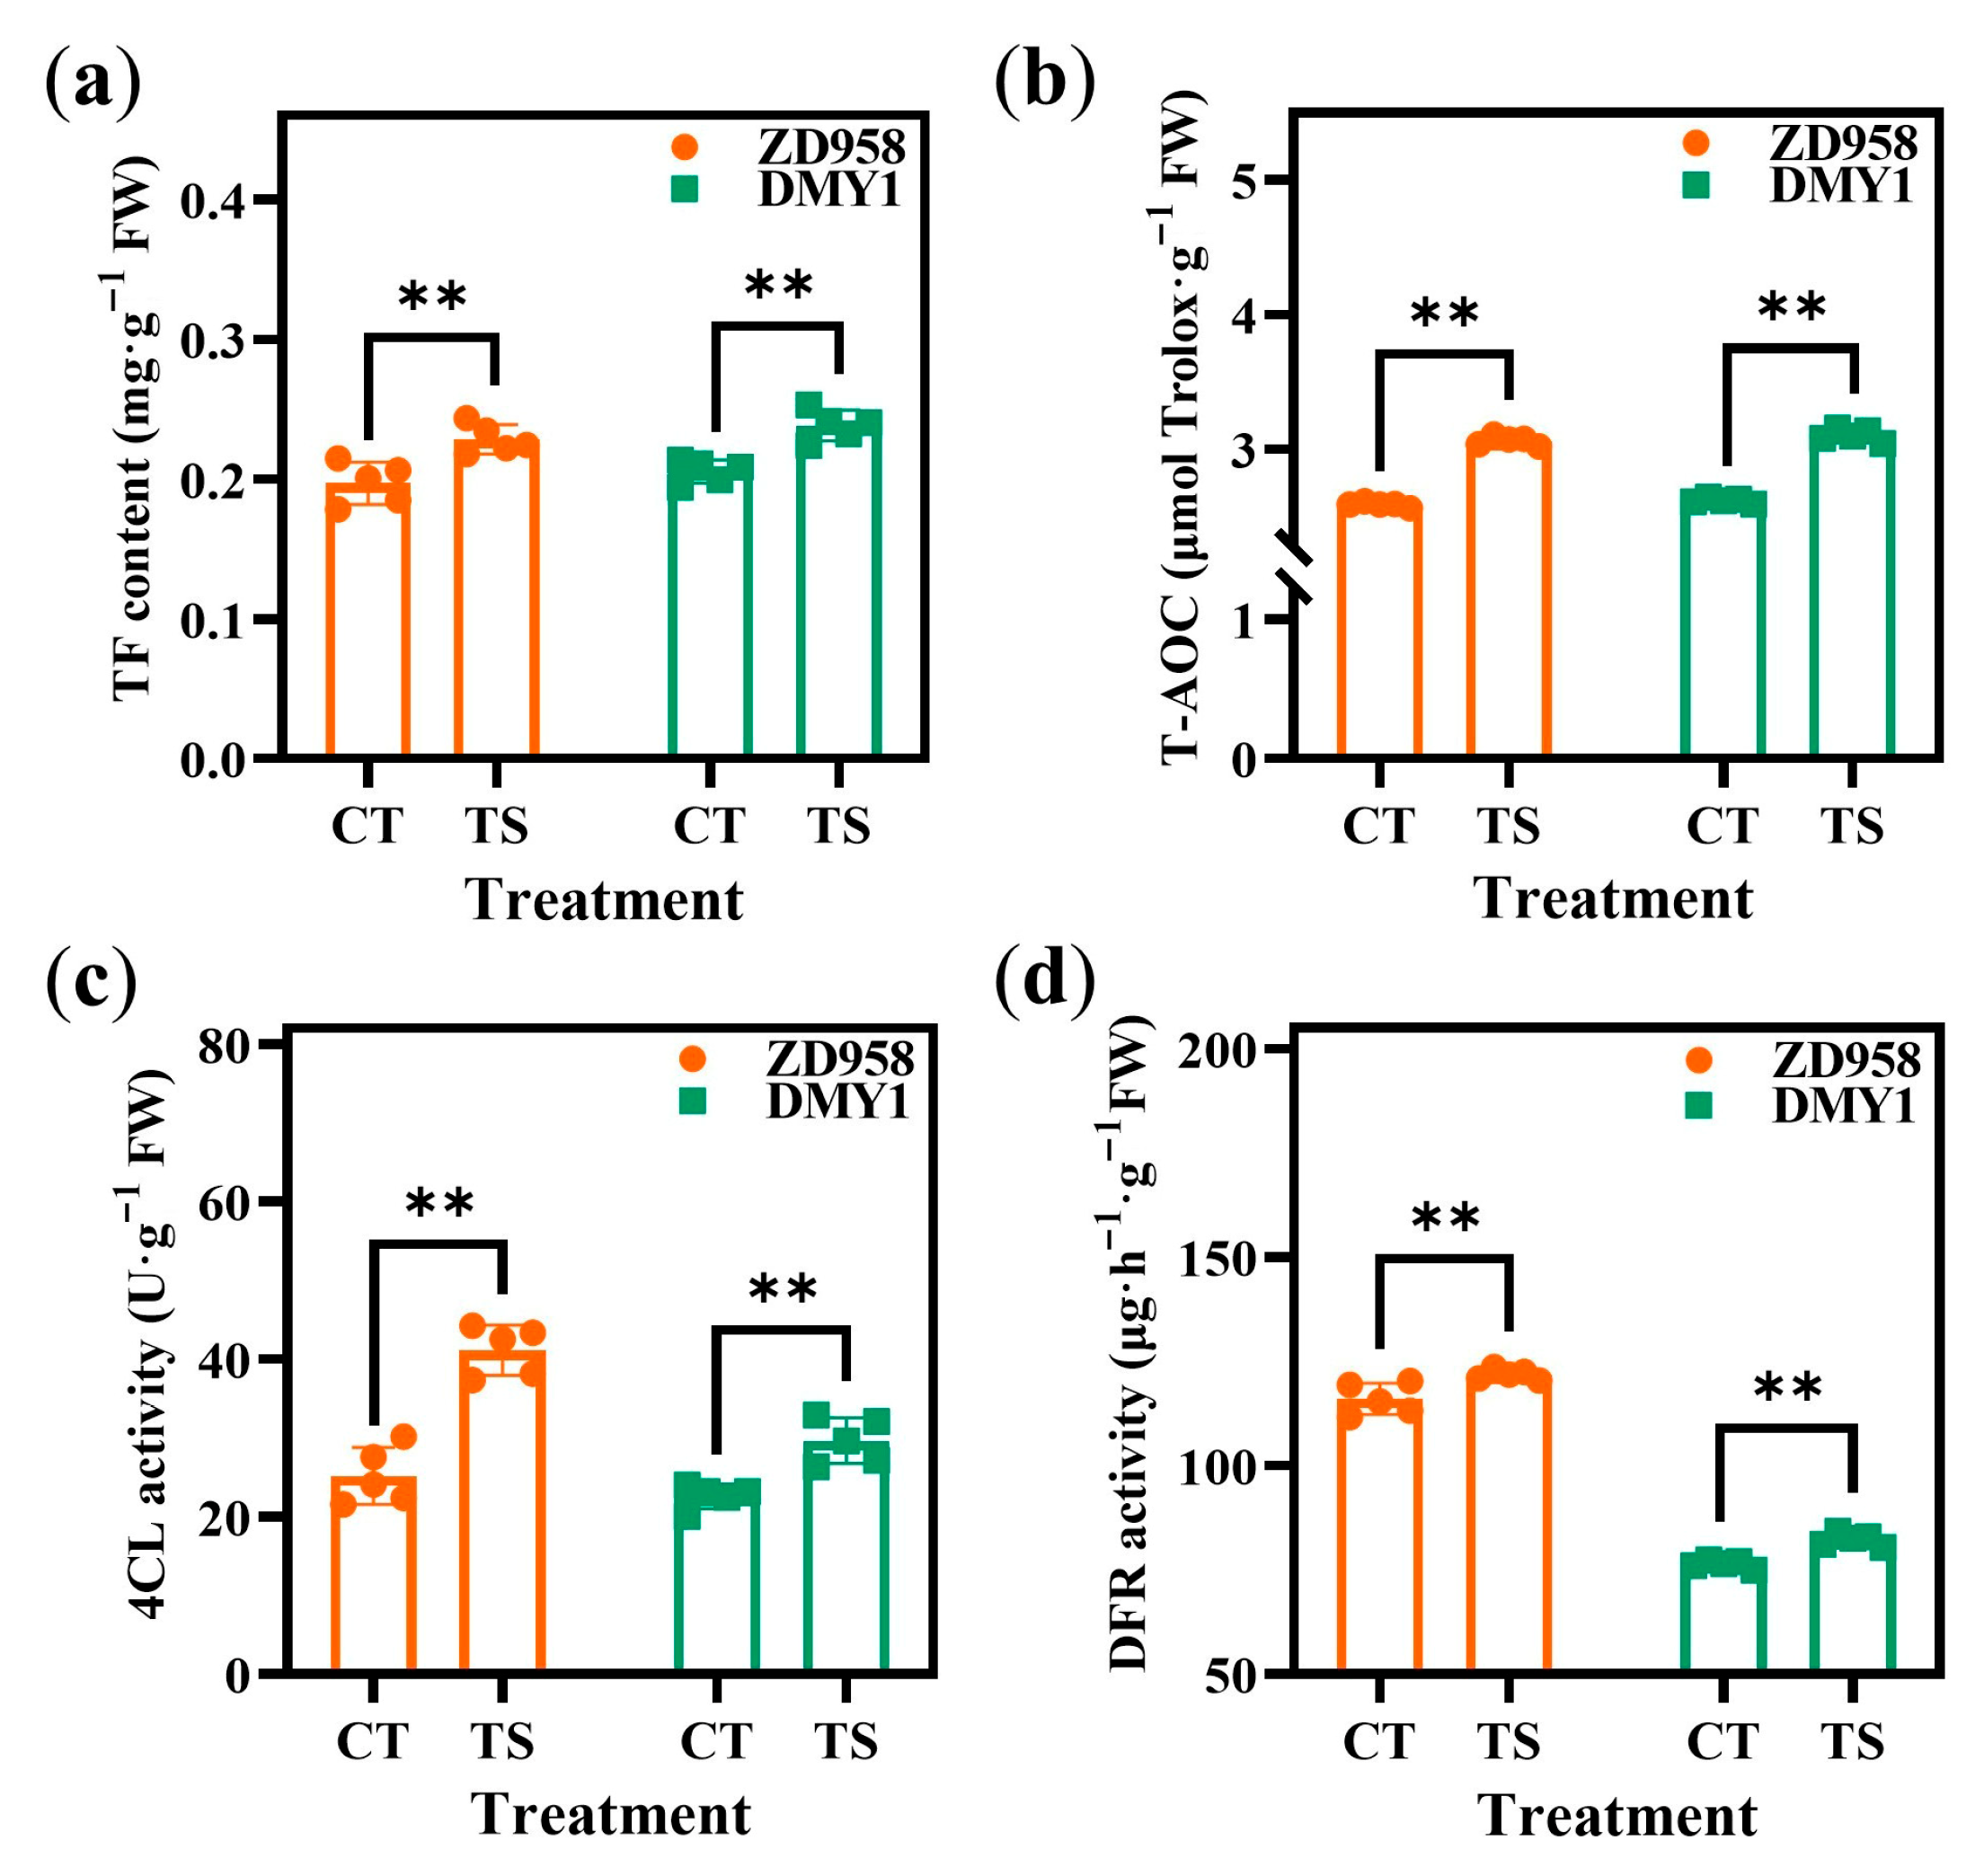
Based on transcriptomic and metabolomic data, this study constructed an integrated pathway of key metabolic regulatory pathways in maize radicles responding to TS, including phenylpropanoid biosynthesis (ko00940), flavonoid biosynthesis (ko00941), isoflavonoid biosynthesis (ko00943), and flavone and flavonol biosynthesis (ko00944). In the phenylpropanoid biosynthesis pathway, genes encoding phenylalanine ammonia-lyase (PAL), trans-cinnamate 4-monooxygenase (C4H), and 4-coumarate-CoA ligase (4CL), such as Zm00001d053619, Zm00001d012510, and Zm00001d018660, were upregulated, which may enhance the activity of the corresponding enzymes and promote phenylalanine (Phe), cinnamic acid, and p-coumaric acid synthesis (Figure 8a,b). Similarly, in the flavonoid biosynthesis pathway, genes encoding chalcone synthase (CHS) and bifunctional dihydroflavonol 4-reductase (DFR), such as Zm00001d052915 and Zm00001d031488, were upregulated, leading to an increase in the metabolic rate of afzelechin. The upregulation of Zm00001d001960 and Zm00001d030548, which encode naringenin 3-dioxygenase (F3H) and flavonol synthase (FLS), induced changes in myricetin and dihydromyricetin content. In addition, the content of metabolites such as quercetin, daidzein 7-O-glucoside, biochanin A 7-O-glucoside, apigenin, and rhoifolin in isoflavonoid biosynthesis, and the flavone and flavonol biosynthesis pathways also changed in response to changes in the expression levels of related enzyme genes induced by TS. However, in the integration pathway, the content changes of 5-O-caffeoyl shikimic acid, apigenin, dihydromyricetin, and myricetin differed between ZD958 and DMY1 radicles, which may be owing to differences in the expression intensity or pattern of these compounds in response to TS between the two maize genotypes. Measuring the antioxidant capacity of maize radicles and the activity differences in key enzymes in the flavonoid metabolic regulation pathway under different treatment conditions indicated that, compared to CT treatment, ZTS and DTS increased total flavonoid (TF) content in radicle by 15.99% and 16.01%, respectively, and total antioxidant capacity (T-AOC) by 18.41% and 18.54%, respectively. 4CL ligase activity increased by 63.54% and 31.16%, respectively, and DFR activity increased by 5.09% and 7.68%, respectively. All differences reached the level of extremely significant difference (p < 0.01; Figure 9).

3. Discussion

This study selected representative corn varieties widely cultivated in the high-latitude cold regions of northeastern China as research subjects. Previous studies [24,28] commonly used 5 °C as the TS treatment condition and used the suitable temperature of 15 °C during germination after spring sowing in the high-latitude cold regions of northeastern China as the CT condition [24,29] to investigate the effects of TS on the growth of maize radicles during germination. In this study, radicle growth in ZD958 and DMY1 was inhibited under TS treatment, specifically manifested by a significant reduction in terminal radicle length, growth increment, total FW, and total DW. Low temperatures [30,31,32], drought [33,34,35], salinity [30,36,37], and waterlogging [38,39,40] are typical adverse environmental conditions in farmland. Zhang et al. [32] conducted low-temperature germination ability assessment tests on 222 maize inbred lines and observed significant differences in the length of maize radicles among different genotypes. They concluded that radicle growth performance can be used as a key indicator for evaluating the low-temperature tolerance of maize. TS treatment led to an increase in the accumulation of ROS, resulting in elevated levels of O2, H2O2, and MDA in maize radicles, as well as an increase in REC. These differences were highly significant compared to CT treatment, consistent with previous studies on flower organs of Pyrus hopeiensis [41], intact seeds of waxy maize during germination [42], and young leaves of Phaseolus vulgaris L. [43].
SOD, POD, CAT, and APX are key indicators for assessing plant cold sensitivity [24,44,45,46]. SOD serves as the first line of defense against ROS damage in plant cells, catalyzing the dismutation of superoxide anion radicals into H2O2 [47]. H2O2 is then catalyzed by CAT [48], POD [49], and APX [50] to form H2O and O2, thereby reducing ROS-induced oxidative damage and enhancing plant stress resistance. In this study, the activities of relevant antioxidant enzymes in the radicles after TS treatment were significantly higher than those after CT treatment. These results indicate that the TS conditions simulated in this study caused metabolic imbalance and oxidative damage of ROS in the radicle cells, inhibiting normal radicle growth. Furthermore, the defense mechanism of the antioxidant system was activated, which can be further used for integrated analysis of transcriptomics and metabolomics to elucidate the regulatory pathways of maize radicle response to TS at the molecular level during germination.
Numerous studies have applied RNA-Seq technology to explore the DEGs and their regulatory mechanisms in different plant tissues, such as the leaf veins and petioles of Broussonetia papyrifera [51], leaves of Camellia sinensis [52], and leaves and roots of Beta vulgaris [53], in response to TS. Candidate genes can be screened for in RNA-Seq data using various methods, including DEG analysis, co-expression trend analysis, and WGCNA [54,55]. GO and KEGG are often used to explore the functions of DEGs [56]. In this study, after TS treatment, significant enrichment of GO terms such as “response to hydrogen peroxide,” “response to reactive oxygen species,” “hydrogen peroxide catabolic process,” “response to oxidative stress,” “oxidation-reduction process,” “oxidoreductase activity,” and “alternative oxidase activity” was observed in the embryonic roots of different maize genotypes. Additionally, KEGG pathways such as phenylpropanoid biosynthesis, flavonoid biosynthesis, and isoflavonoid biosynthesis were significantly enriched. These pathways are also actively involved in cold stress responses in Citrus [57] and Fagopyrum tataricum [58].
Metabolomics provides insights into the entire metabolic process of plants and validates the accuracy of transcriptomics [59]. Flavonoids are important compounds for the cold tolerance and adaptation of Arabidopsis, and their complete loss or significant reduction can impair cold resistance mechanisms [60]. For example, after cold treatment, DAMs in Musa spp. leaves were significantly enriched in the flavone and flavonol biosynthesis and valine, leucine, and isoleucine degradation pathways [61]. Similarly, DAMs in the leaves of Liriope spicata were significantly enriched in pathways related to carbon fixation in photosynthetic organisms, flavone and flavonol biosynthesis, and flavonoid biosynthesis [62]. However, in this study, DAMs were primarily enriched in pathways such as isoflavonoid biosynthesis, flavone and flavonol biosynthesis, and phenylpropanoid biosynthesis, and the levels of DAMs such as quercetin, rhoifolin, and afzelechin also changed significantly. These results indicate that after perceiving changes in ROS levels, the radicle activates the antioxidant defense system, which is manifested in two ways: on the one hand, it enhances the activity of antioxidant enzymes to rapidly clear ROS and alleviate acute oxidative damage; on the other hand, it initiates metabolic enhancement mechanisms, providing raw materials through the phenylpropanoid biosynthesis pathway to continuously synthesize potent antioxidant substances such as flavonoids. These flavonoids enhance the precision of ROS clearance, strengthen oxidative stress-buffering capacity, and synergistically regulate ROS homeostasis with antioxidant enzymes [63]. This process demonstrates that the flavonoid metabolic regulation pathway, including phenylpropanoid biosynthesis, flavonoid biosynthesis, isoflavonoid biosynthesis, and flavone and flavonol biosynthesis, may play a pivotal role in the response of maize radicles to TS.
Based on the integrated pathway constructed according to the key metabolic regulatory pathways of maize radicles in response to TS, this study found that the expression patterns of key enzyme genes involved in flavonoid metabolism differed among different genotypes of maize radicles, which may lead to differences in flavonoid metabolic activity. Under ZCT, flavonoid synthesis was more active, potentially indicating stronger “metabolic reserves.” In contrast, DCT is relatively conservative, reserving more regulatory space in response to low temperatures. As a key pathway in the synthesis of flavonoids, PAL and C4H catalyze the conversion of Phe into cinnamic acid and p-coumaric acid [64], which are then converted into p-coumaroyl-CoA by 4CL and C4H. Under ZTS and DTS conditions, the genes related to PAL, C4H, and 4CL were upregulated, promoting the flow of precursors in the phenylpropanoid biosynthesis pathway and providing sufficient raw materials for flavonoid synthesis. Under ZTS, CHS catalyzes p-coumaroyl-CoA to form naringenin [65], and F3H and FLS are significantly upregulated, directing the conversion of naringenin into flavonols, such as quercetin [66,67]. However, although the CHS gene is also upregulated in DTS, the extent of upregulation is weaker than that in ZTS, and the expression of enzymes related to isoflavone synthesis, such as CHI, is more balanced. This finding suggests that DMY1 radicles do not rely on the high-intensity synthesis of a single flavonol but instead expand antioxidant capacity through multiple isoflavones, helping radicles balance metabolism and adapt to low temperatures, reflecting a different response to low temperatures compared to ZD958 and compensating for the insufficient intensity of flavonol synthesis in DMY1.
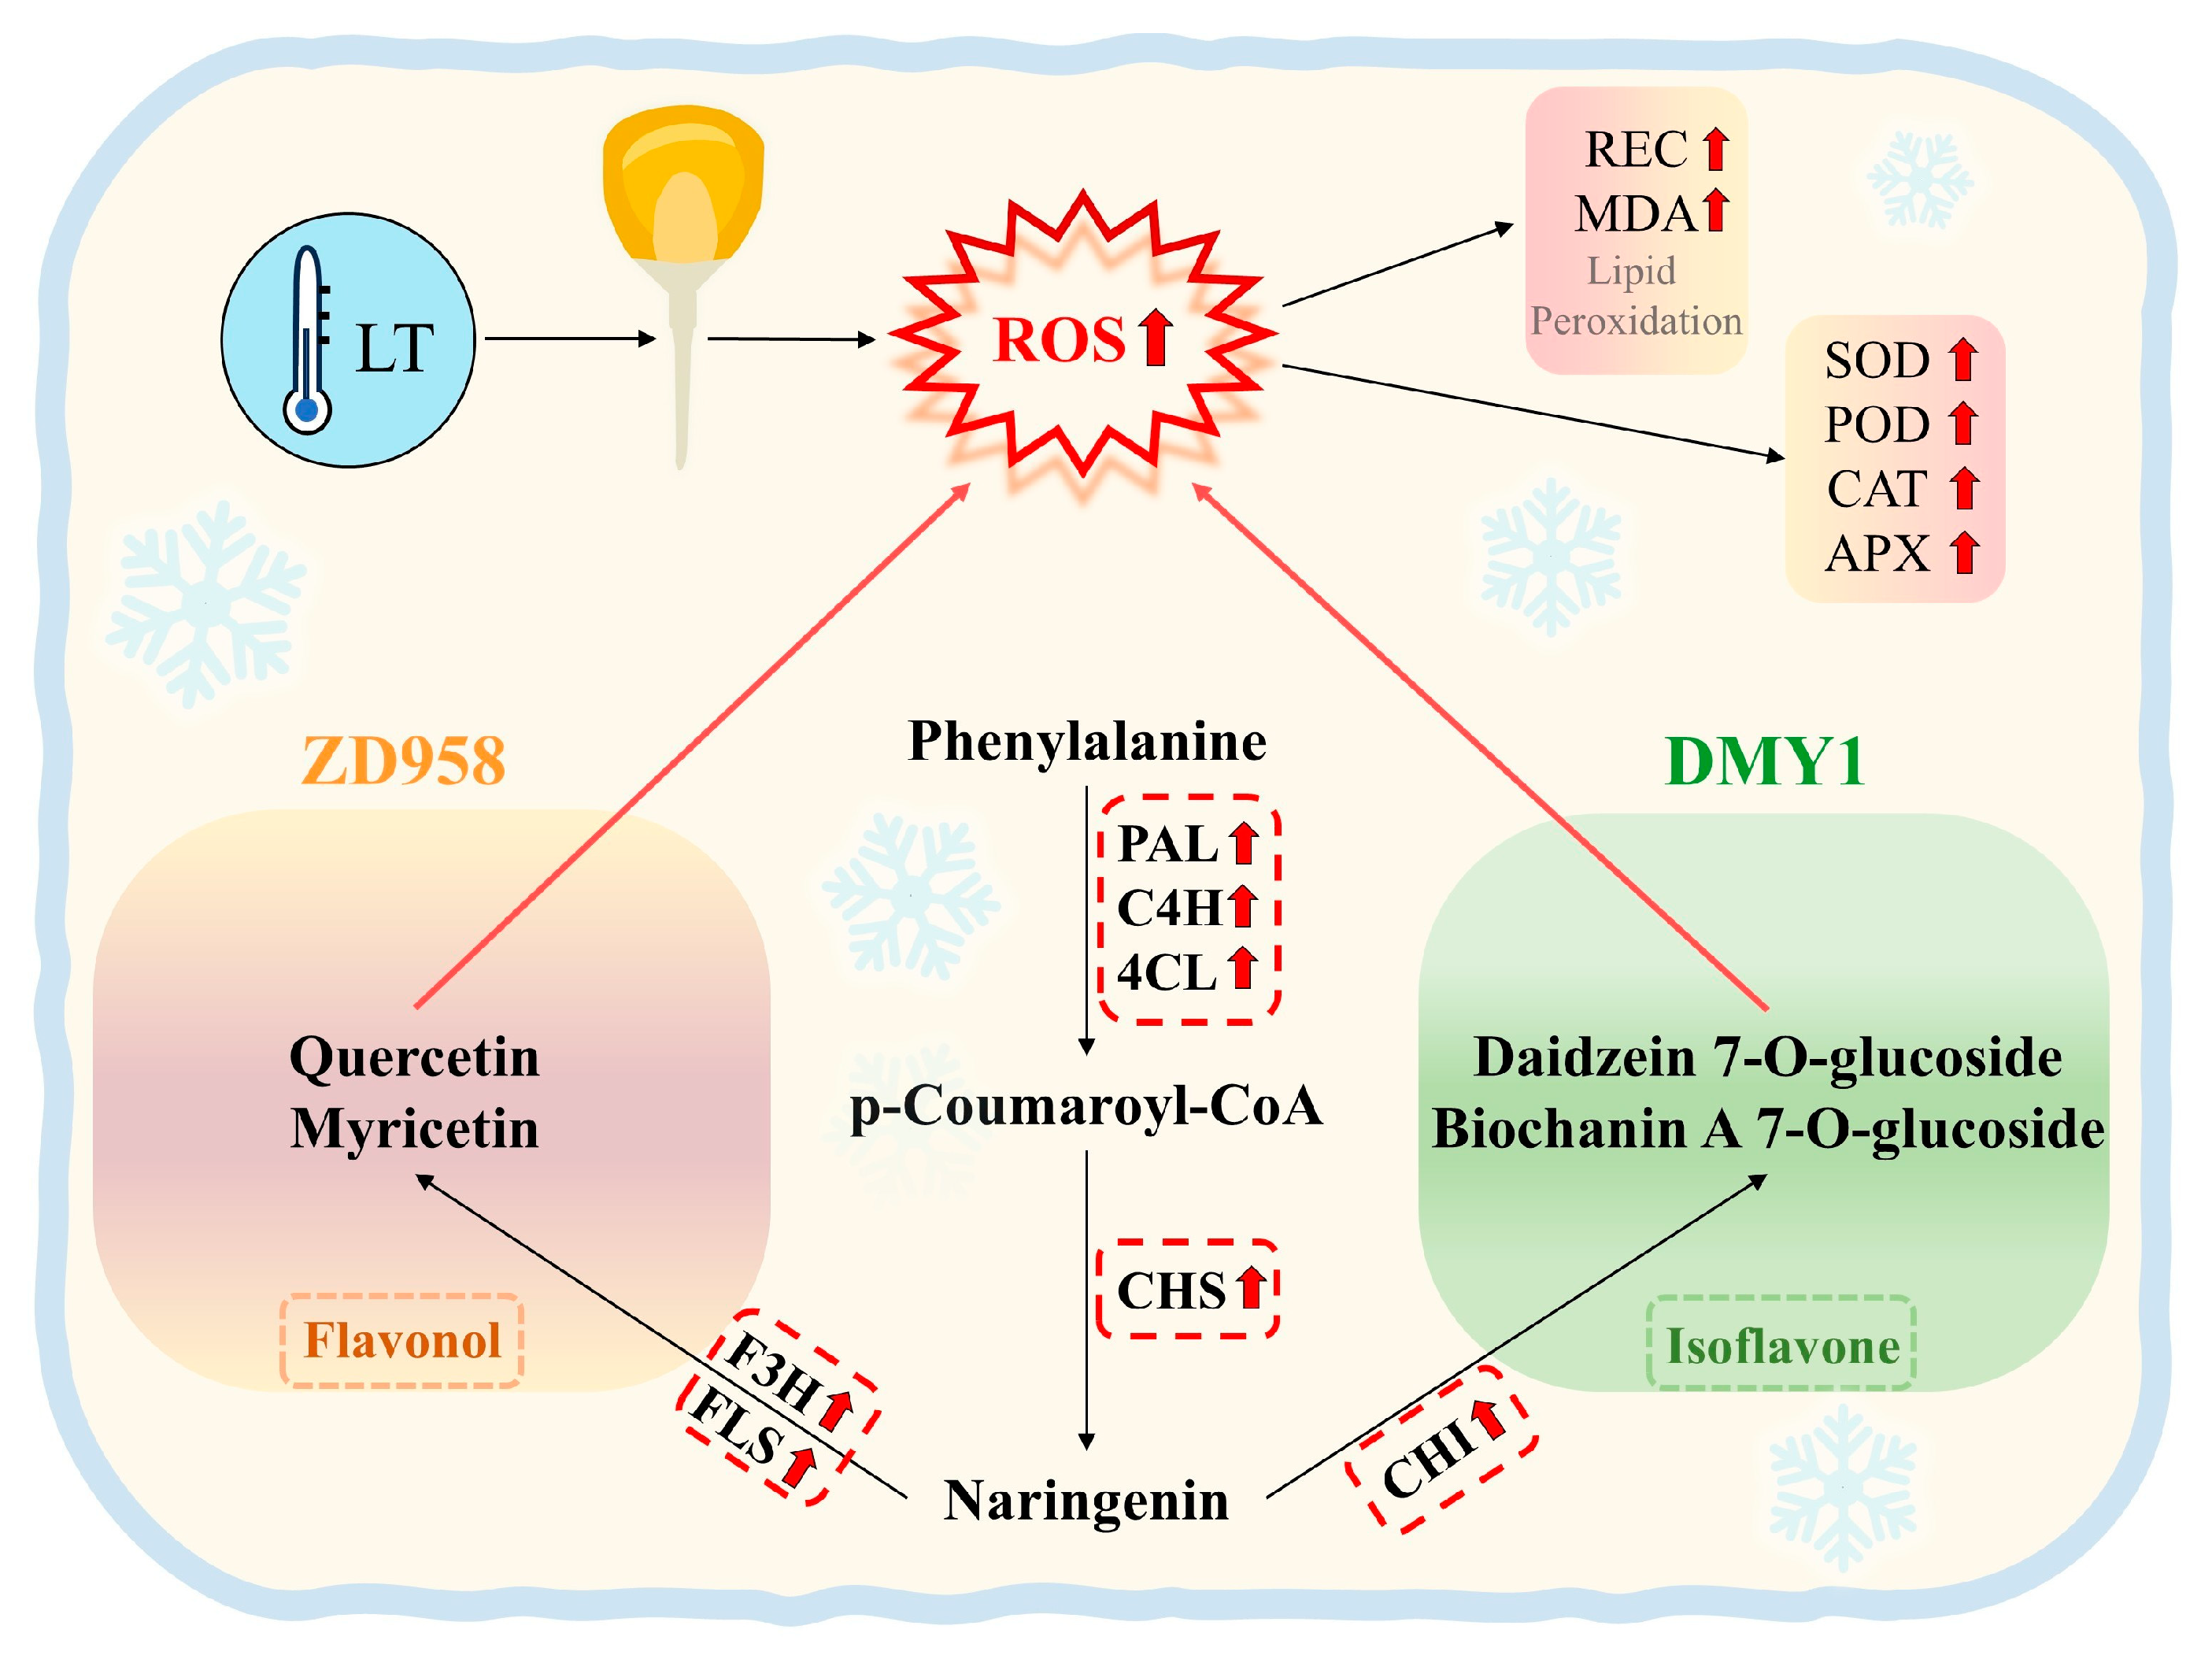
In summary, the maize radicles of ZD958 and DMY1 respond to TS by sensing changes in ROS content, activating the supply of raw materials and core regulation of the flavonoid metabolic pathway, and allocating intermediate metabolites to antioxidant functions. Different genotypes exhibit distinct but equally effective low-temperature response mechanisms, such as “flavonol-dominated (ZD958)” and “isoflavone-coordinated (DMY1).” However, their essence lies in adaptive strategies of the antioxidant system, ultimately enabling ROS scavenging, redox balance maintenance, and the construction of an antioxidant barrier to ensure basal metabolism and growth development of the radicles under low-temperature conditions. This may be one of the key pathways for maize radicles to respond to TS (Figure 10). This study revealed statistically significant correlations between gene expression levels in integrated pathways (e.g., Zm00001d051529) and multiple phenotypic/physiological indicators through combined transcriptome and metabolome analysis of two different genotypes (Figure S9). However, this alone does not directly prove that flavonoid metabolic regulation pathways play a key role in maize radicle responses to TS. Subsequent validation will include targeted enzyme inhibition experiments (screening for the pathway enzyme most strongly correlated with phenotypes and matching specific inhibitors to assess the functional necessity of core pathway enzymes); mutation-based validation experiments (constructing overexpression and knockout lines and comparing pathway and phenotypic differences with wild-type plants to validate genetic necessity and sufficiency of core pathway genes); and multi-varietal field validation trials to further elucidate the regulatory mechanisms of the flavonoid metabolic pathway.

4. Materials and Methods

4.1. Test Varieties and Experimental Design

The maize varieties ZD958 (Zhengdan958, dent maize, developed by the Institute of Grain Crops, Henan Academy of Agricultural Sciences, Zhengzhou, China) and DMY1 (Demeiya1, flint maize, developed by Beidahuang Kenfeng Seed Industry Co., Ltd., Harbin, China), which are primarily cultivated in the high-latitude cold regions of northeastern China, were selected. Seeds were harvested in 2023, dried according to local standard DB23/T 1036-2006, stored under vacuum at 4 °C, and maintained at a germination rate ≥95%. Uniform and consistent seeds across all varieties were selected. Prior to experimenting, all seeds were disinfected in a 1% NaClO solution for 20 min, surface-disinfected in a 75% (v/v) ethanol solution for 60 s, and rinsed with sterile water six times. The disinfected seeds were placed in paper bed germination boxes (14 cm × 14 cm × 6 cm) containing 10 mL of sterile water. Each germination box contained 25 seeds, which were placed in an artificial climate chamber (DRX-330E, Ningbo Dongnan Instrument Co., Ltd., Ningbo, China) at a temperature of 25 ± 0.5 °C and relative humidity of 50 ± 5% for dark cultivation. The climate chamber used was calibrated within 1 week prior to the start of the experiment. After 60 h of germination, seeds with consistent radicle lengths were selected and transplanted into new germination trays (10 seeds per tray). Dark cultivation was continued for 48 h under conditions of 15 ± 0.5 °C (CT) and 5 ± 0.5 °C (TS). For ZD958, the treatments are denoted as ZCT and ZTS, respectively. Similarly, the treatments for DMY are denoted as DCT and DTS, respectively.

4.2. Radicle Length, Growth Increment, FW, and DW Measurement

Before CT or TS treatment, the initial radicle length of all germinating seeds in each germination box was measured, and the average value was recorded as RL1; after 48 h of cultivation under CT or TS treatment conditions, the terminal radicle length of all germinating seeds in each germination box was measured. The average value was recorded as RL2, and radicle growth increment was determined as RG = RL2RL1.
Maize radicles from the two maize varieties were collected after treatment with CT or TS. The total FW of 10 maize radicles in each germination box was measured using a Presica LS120A balance (Sartorius AG, Goettingen, Germany). The radicles were then fixed at 105 °C for 30 min and dried at 80 °C until constant weight, after which the total DW of all radicles in each germination tray was measured.

4.3. Physiological and Biochemical Indicator Measurement

4.3.1. Determination of REC and MDA Content in Maize Radicles

Surgical scissors were used to cut maize radicles along the radicle sheath from the germination boxes of each treatment group, as previously described [68] with slight modifications. A 0.1 g sample was taken as one replicate, with five replicates per treatment. The radicle samples were repeatedly rinsed with distilled water and then transferred to centrifuge tubes containing 5 mL of distilled water. After 24 h, the initial conductivity (denoted as R1) was measured at 25 °C. The centrifuge tubes containing the samples were then placed in a boiling water bath for 30 min, cooled to room temperature, and the final conductivity (denoted as R2) was measured as REC = R1/R2 × 100%. MDA content was determined according to the method of Hodges et al. [69].

4.3.2. Qualitative and Quantitative Analysis of O2 and H2O2

The distribution of O2 was detected using NBT staining [70]. The O2 content was determined using the hydroxylamine oxidation method [71]. 3,3′-diaminobenzidine histochemical staining was performed as previously described [72] with modifications to observe H2O2 accumulation. Quantitative measurement of H2O2 was performed using the colorimetric method as previously described [73], with slight modifications. Maize radicles (0.5 g) were homogenized in pre-chilled ethanol and immediately centrifuged at 12,000× g for 15 min at 4 °C. Concentrated hydrochloric acid and 25% ammonium hydroxide (0.2 mL) were added to 1 mL of the supernatant to precipitate the peroxide-titanium complex; the precipitate was dissolved in 2 mmol/L H2SO4, and the absorbance was measured at 415 nm.

4.3.3. Antioxidant Enzyme Activity Measurement

The antioxidant enzyme activity assay was performed as previously described [74]. SOD [EC 1.15.1.1], POD [EC 1.11.1.7], CAT [EC 1.11.1.6], and APX [EC1.11.1.1] activities were determined separately using the Specord Plus 210 spectrophotometer (Analytik Jena AG, Jena, Germany). The SOD activity was measured using the nitroblue tetrazolium method [75], the POD activity was measured using the guaiacol method [76], the CAT activity was measured as previously described [77], and the APX activity was measured as previously described [78].

4.3.4. Determination of TF Content, T-AOC, and 4CL and DFR Activity

TF content, T-AOC, and 4CL and DFR activities in maize radicles were determined using the TF, T-AOC, 4CL, and DFR assay kits (G0118F, G0142F, G1003F24, G1008F, Grace Biotechnology Co., Ltd., Suzhou, China), respectively.

4.4. RNA Extraction, Library Construction, and RNA-Seq

Three biological replicates of radicle samples were collected from different maize varieties under CT and TS treatments, for a total of 12 samples. Total plant RNA was extracted using the RNAprep Pure Plant Kit (Tiangen Biotech Co., Ltd., Beijing, China) according to the manufacturer’s instructions. cDNA library construction and sequencing were performed at Biomarker Technologies (Beijing, China) for all test samples. All filtered clean reads were aligned to the maize reference genome (B73_RefGen_v4) using HISAT2 [79]. The alignment results were assembled using String Tie [80]. FPKM [81] was used to quantify gene expression levels to validate the transcriptional expression levels of all samples. The FPKM for each gene was calculated based on gene length and the number of reads mapped.
DESeq2 [82] was used to perform differential analysis between groups to identify DEGs between different treatments. Fold change (FC) ≥ 2 and FDR < 0.05 were used as screening criteria. FC refers to the ratio of expression levels between two sample groups. FDR was obtained by correcting the significance p-value and indicated the significance of the difference. DEGs were analyzed using the Cluster Profile R software package (version 3.21) through the GO and KEGG databases [83], and GO and KEGG enrichment pathways were screened using a p < 0.05 standard. WGCNA was performed using a similarity threshold of 0.25 and a minimum gene number of 30 for modules.

4.5. qRT-PCR Analysis

Nine differentially expressed genes were randomly selected for qRT-PCR validation to validate the reliability and reproducibility of the DEGs obtained by RNA-Seq. Total RNA was extracted from each treated root sample using TRIzol® reagent (Invitrogen, Carlsbad, CA, USA). RNA quality was assessed using a NanoDrop spectrophotometer (Thermo Fisher Scientific, Waltham, MA, USA) and 1% agarose gel electrophoresis. Based on the sequences of these nine genes, specific primers for the nine genes were designed using the Primer Design website (https://www.ncbi.nlm.nih.gov) (Supplementary Table S8), with ZmActin [84] as the internal control gene. SYBR qPCR Master Mix (TOYOBO Co., Osaka, Japan) was used. qRT-PCR was performed using the Bio-Rad real-time fluorescent quantitative PCR system (Bio-Rad Laboratories Inc., Hercules, CA, USA) [85]. Each treatment included three biological replicate samples (each biological replicate contained three technical replicates), and gene expression levels were calculated using the 2−∆∆Ct method [81].

4.6. Metabolomics Analysis

Three biological replicates of radicle samples were collected from different maize varieties under CT and TS treatments, yielding a total of 12 samples. These samples were sent to Biomarker Technologies (Beijing, China) for metabolomics analysis. The LC/MS system (Waters Corporation Milford, Massachusetts, USA) used for analysis consists of a Waters Acquity I-Class PLUS ultra-high-performance liquid chromatography system (Waters Corporation Milford, Massachusetts, USA) coupled with a Waters Xevo G2-XS QT high-resolution mass spectrometer (Waters Corporation Milford, Massachusetts, USA). The column used was purchased from Waters Acquity UPLC HSS T3 column [particle size, 1.8 μm; 2.1 mm (i.d.) × 100 mm (length)]. DAMs were screened using the following criteria: variable importance projection (VIP) > 1, |log2FC| ≥ 0.58, and p < 0.05.

4.7. Statistical Analyses

Each phenotypic and physiological indicator was analyzed five times. The average measurement of all germinated seeds (10 seeds) in a germination box was considered one repetition when measuring the terminal radicle length, growth, FW, and DW. During physiological measurements, sampling was conducted using a simple randomization method (randomly selecting radicles from each treatment germination tray), and the assessment of indicators was performed as an open-label trial. Data analysis was performed using SPSS 22.0 software (IBM, Armonk, NY, USA) for one-way analysis of variance. If significant differences were observed between groups (p ≤ 0.05), Duncan’s test was further applied for multiple comparisons. Annotations for extremely significant differences (p ≤ 0.01) are based on the same multiple comparison results. Bivariate Pearson correlation analysis was employed to reveal correlations between genes and physiological indicators, with bilateral t-tests used to assess the significance of these correlations. Data visualization was performed using GraphPad Prism 8.0 (GraphPad Software, Boston, MA, USA), Tbtools v2.012 (https://github.com/CJ-Chen/TBtools/releases, accessed on 20 January 2025), and the Bioinformatics Online Analysis Platform (https://www.bioinformatics.com.cn). Quality control, alignment, and DEG screening of the transcriptomic raw data were performed on the BMKCloud Platform (Biomarker Technologies, Beijing, China). All sequencing data were uploaded to the National Center for Biotechnology Information (login number: PRJNA1050059, Supplementary Table S9).

5. Conclusions

TS conditions cause metabolic imbalance and oxidative damage of ROS in radicle cells, inhibiting normal radicle growth, and activating the defense mechanisms of the antioxidant system. The metabolic regulation pathway of flavonoids (phenylpropanoid biosynthesis, flavonoid biosynthesis, isoflavonoid biosynthesis, and flavone and flavonol biosynthesis) may play a pivotal role in maintaining ROS homeostasis in maize radicles. Although maize radicles of different genotypes adopt differentiated flavonoid metabolic regulation strategies—either “flavonol-dominated” or “isoflavone-coordinated”—in response to TS, they follow the common regulatory logic of “low-temperature signal-driven—antioxidant redirection—functional synergy.” The findings of this study contribute to a deeper understanding of the molecular mechanisms underlying the radicle resistance to TS during maize seed germination and provide a theoretical foundation for enhancing the low-temperature adaptability of maize during germination in cold regions. However, the metabolic regulation mechanisms of flavonoids that account for inter-varietal differences under TS require further investigation.

Supplementary Materials

The following supporting information can be downloaded at https://www.mdpi.com/article/10.3390/plants14192988/s1, Figure S1: PCA between transcriptomic samples. Figure S2: Correlation analysis between transcriptomic samples. Figure S3: DEGs in “ZCT vs. ZTS” treatment comparison groups and their GO and KEGG enrichment analysis. Figure S4: DEGs in “DCT vs. DTS” treatment comparison groups and their GO and KEGG enrichment analysis. Figure S5: Co-expression trend module classification of DEGs in different treatment comparison groups. Figure S6: Correlation between different WGCNA modules. Figure S7: PCA between metabolome samples. Figure S8: Venn diagram of DAMs in two control groups. Figure S9: Heatmap showing correlations between selected genes in the flavonoid metabolic regulation pathway and physiological/phenotypic traits. Table S1: Sequencing quality control. Table S2: Co-expression of DEGs under control and low temperature stress. Table S3: GO enrichment analysis of two comparison groups. Table S4: KEGG enrichment analysis of two comparison groups. Table S5: GO and KEGG enrichment analysis of DEGs in the co-expression module. Table S6: KEGG enrichment analysis of DEGs in different WGCNA modules. Table S7: KEGG enrichment analysis of DAMs in different comparison groups. Table S8: Primer sequences for qPCR validation. Table S9: Raw data of transcriptome uploaded to NCBI database.

Author Contributions

Conceptualization, Y.D., Y.Z. and S.Y.; data curation, Y.D., W.L. (Wenqi Luo) and W.L. (Wangshu Li); formal analysis, Y.D., W.L. (Wenqi Luo), W.L. (Wangshu Li) and C.Z.; funding acquisition, Y.Z.; investigation, Y.D., W.L. (Wenqi Luo) and W.L. (Wangshu Li); methodology, Y.D., X.L., Y.L. and S.Y.; project administration, Y.Z. and C.Z.; resources, Y.Z. and Y.L.; supervision, Y.Z. and C.Z.; validation, Y.D., W.L. (Wenqi Luo), W.L. (Wangshu Li) and X.L.; writing—original draft, Y.D., W.L. (Wenqi Luo) and W.L. (Wangshu Li); writing—review and editing, Y.Z. and S.Y. All authors have read and agreed to the published version of the manuscript.

Funding

This work was supported by National Key Research and Development Program of China (2024YFD2300102), the Postdoctoral Science Foundation Funded General Project of Heilongjiang Province (Grant number: LBH-Z19196), the University Nursing Program for Young Scholars with Creative Talents in Heilongjiang Province (grant number: UNPYSCT-2020037), Graduate Innovation Research Project of Heilongjiang Bayi Agricultural University (grant number: YJSCX2024-Y02).

Data Availability Statement

The data presented in this study are available on request from the corresponding authors. The data are not publicly available due to intellectual property rights.

Conflicts of Interest

The authors declare no conflicts of interest.

Abbreviations

The following abbreviations are used in this manuscript:
4CL4-coumarate-CoA ligase
BPbiological process
C4Htrans-cinnamate 4-monooxygenase
CATcatalase
CCcellular component
CHSchalcone synthase
CTcontrol
DAB3,3′-diaminobenzidine
DAMdifferentially accumulated metabolites
DEGdifferentially expressed gene
DFRbifunctional dihydroflavonol 4-reductase
DMY1Demeiya1
DWdry weight
F3Hnaringenin 3-dioxygenase
FCfold change
FDRfalse discovery rate
FLSflavonol synthase
FPKMfragments per kilobase of exon model per million mapped reads
FWfresh weight
GOGene Ontology
MDAmalondialdehyde
MFmolecular function
NBTnitrotetrazolium blue chloride
PALphenylalanine ammonia-lyase
PCAprincipal component analysis
Phephenylalanine
PODperoxidase
KEGGKyoto Encyclopedia of Genes and Genomes
qRT-PCRquantitative real-time polymerase chain reaction
T-AOCtotal antioxidant capacity
TFtotal flavonoid
TSlow-temperature stress
SODsuperoxide dismutase
RECrelative electrical conductivity
ROSreactive oxygen species
WGCNAweighted gene co-expression network analysis
ZD958Zhengdan958

References

  1. Xu, Y.; Yang, T.; Zhou, Y.; Yin, S.; Li, P.; Liu, J.; Xu, S.; Yang, Z.; Xu, C. Genome-wide association mapping of starch pasting properties in maize using single-locus and multi-locus models. Front. Plant Sci. 2018, 9, 1311. [Google Scholar] [CrossRef]
  2. Zhou, Z.; Shi, H.; Fu, Q.; Li, T.; Gan, T.Y.; Liu, S. Assessing spatiotemporal characteristics of drought and its effects on climate-induced yield of maize in Northeast China. J. Hydrol. 2020, 588, 125097. [Google Scholar] [CrossRef]
  3. Zhang, Y.; Xu, Z.; Li, J.; Wang, R. Optimum planting density improves resource use efficiency and yield stability of rainfed maize in semiarid climate. Front. Plant Sci. 2021, 12, 752606. [Google Scholar] [CrossRef]
  4. Wan, J.; Wang, Q.; Zhao, J.; Zhang, X.; Guo, Z.; Hu, D.; Meng, S.; Lin, Y.; Qiu, X.; Mu, L.; et al. Gene expression variation explains maize seed germination heterosis. BMC Plant Biol. 2022, 22, 301. [Google Scholar] [CrossRef] [PubMed]
  5. Kermode, A.R. Regulatory mechanisms involved in the transition from seed development to germination. Crit. Rev. Plant Sci. 1990, 9, 155–195. [Google Scholar] [CrossRef]
  6. Qi, X.; Wan, C.; Zhang, X.; Sun, W.; Liu, R.; Wang, Z.; Wang, Z.; Ling, F. Effects of histone methylation modification on low temperature seed germination and growth of maize. Sci. Rep. 2023, 13, 5196. [Google Scholar] [CrossRef]
  7. Waqas, M.A.; Wang, X.; Zafar, S.A.; Noor, M.A.; Hussain, H.A.; Azher Nawaz, M.; Farooq, M. Thermal stresses in maize: Effects and management strategies. Plants 2021, 10, 293. [Google Scholar] [CrossRef]
  8. Liu, Z.; Ma, C.; Hou, L.; Wu, X.; Wang, D.; Zhang, L.; Liu, P. Exogenous SA affects rice seed germination under salt stress by regulating Na+/K+ balance and endogenous GAs and ABA homeostasis. Int. J. Mol. Sci. 2022, 23, 3293. [Google Scholar] [CrossRef] [PubMed]
  9. Balabusta, M.; Szafranska, K.; Posmyk, M.M. Exogenous melatonin improves antioxidant defensein cucumber seeds (Cucumis sativus L.) germinated under chilling stress. Front. Plant Sci. 2016, 7, 12. [Google Scholar] [CrossRef]
  10. Elder, J.B.; Broome, J.A.; Bushnell, E.A.C. Computational insights into the regeneration of ovothiol and ergothioneine and their selenium analogues by glutathione. ACS Omega 2022, 7, 31813–31821. [Google Scholar] [CrossRef]
  11. Li, J.; Yu, Q.; Liu, C.; Zhang, N.; Xu, W. Flavonoids as key players in cold tolerance: Molecular insights and applications in horticultural crops. Hortic. Res. 2025, 12, 366. [Google Scholar] [CrossRef] [PubMed]
  12. Wu, D.; Wu, Y.; Gao, R.; Zhang, Y.; Zheng, R.; Fang, M.; Li, Y.; Zhang, Y.; Guan, L.; Gao, Y. Integrated metabolomics and transcriptomics reveal the key role of flavonoids in the cold tolerance of chrysanthemum. Int. J. Mol. Sci. 2024, 25, 7589. [Google Scholar] [CrossRef] [PubMed]
  13. Rychlicka, M.; Rot, A.; Gliszczyńska, A. Biological properties, health benefits and enzymatic modifications of dietary methoxylated derivatives of cinnamic acid. Foods 2021, 10, 1417. [Google Scholar] [CrossRef] [PubMed]
  14. Jiang, N.; Doseff, A.; Grotewold, E. Flavones: From biosynthesis to health benefits. Plants 2016, 5, 27. [Google Scholar] [CrossRef]
  15. He, J.; Yao, L.; Pecoraro, L.; Liu, C.; Wang, J.; Huang, L.; Gao, W. Cold stress regulates accumulation of flavonoids and terpenoids in plants by phytohormone, transcription process, functional enzyme, and epigenetics. Crit. Rev. Biotechnol. 2023, 43, 680–697. [Google Scholar] [CrossRef]
  16. Zhuoma, P.; Tondrob, D.; Qunpei, T.; Fu, J.; Dan, S. Muti-omics revealed the mechanisms of MT-conferred tolerance of Elymus nutans Griseb. to low temperature at XiZang. BMC Plant Biol. 2024, 24, 901. [Google Scholar] [CrossRef]
  17. Zhang, Y.; Yang, L.; Hu, H.; Yang, J.; Cui, J.; Wei, G.; Xu, J. Transcriptome and metabolome changes in Chinese cedar during cold acclimation reveal the roles of flavonoids in needle discoloration and cold resistance. Tree Physiol. 2022, 42, 1858–1875. [Google Scholar] [CrossRef]
  18. Liu, J.; Wang, T.; Weng, Y.; Liu, B.; Gao, Q.; Ji, W.; Wang, Z.; Wang, Y.; Ma, X. Identification and characterization of regulatory pathways controlling dormancy under lower temperature in alfalfa (Medicago sativa L.). Front. Plant Sci. 2022, 13, 872839. [Google Scholar] [CrossRef]
  19. Yang, M.; Yang, J.; Su, L.; Sun, K.; Li, D.; Liu, Y.; Wang, H.; Chen, Z.; Guo, T. Metabolic profile analysis and identification of key metabolites during rice seed germination under low-temperature stress. Plant Sci. 2019, 289, 110282. [Google Scholar] [CrossRef]
  20. Han, L.; Zhong, W.; Qian, J.; Jin, M.; Tian, P.; Zhu, W.; Zhang, H.; Sun, Y.; Feng, J.; Liu, X.; et al. A multi-omics integrative network map of maize. Nat. Genet. 2022, 55, 144–153. [Google Scholar] [CrossRef]
  21. Qu, X.; Huang, Z.; Baskin, J.M.; Baskin, C.C. Effect of temperature, light and salinity on seed germination and radicle growth of the geographically widespread halophyte shrub Halocnemum strobilaceum. Ann. Bot. 2007, 101, 293–299. [Google Scholar] [CrossRef]
  22. Li, W.; Li, J.; Zhang, Y.; Luo, W.; Dou, Y.; Yu, S. Effect of reactive oxygen scavenger N,N′-dimethylthiourea (DMTU) on seed germination and radicle elongation of maize. Int. J. Mol. Sci. 2023, 24, 15557. [Google Scholar] [CrossRef]
  23. Zhao, X.; Wei, Y.; Zhang, J.; Yang, L.; Liu, X.; Zhang, H.; Shao, W.; He, L.; Li, Z.; Zhang, Y.; et al. Membrane lipids’ metabolism and transcriptional regulation in maize roots under cold stress. Front. Plant Sci. 2021, 12, 639132. [Google Scholar] [CrossRef]
  24. Zhang, Y.; Li, J.; Li, W.; Gao, X.; Xu, X.; Zhang, C.; Yu, S.; Dou, Y.; Luo, W.; Yu, L. Transcriptome analysis reveals POD as an important indicator for assessing low-temperature tolerance in maize radicles during germination. Plants 2024, 13, 1362. [Google Scholar] [CrossRef]
  25. Gu, Y.; He, L.; Zhao, C.; Wang, F.; Yan, B.; Gao, Y.; Li, Z.; Yang, K.; Xu, J. Biochemical and transcriptional regulation of membrane lipid metabolism in maize leaves under low temperature. Front. Plant Sci. 2017, 8, 2053. [Google Scholar] [CrossRef] [PubMed]
  26. Fenza, M.D.; Hogg, B.; Grant, J.; Barth, S. Transcriptomic response of maize primary roots to low temperatures at seedling emergence. PeerJ 2017, 5, e2839. [Google Scholar] [CrossRef]
  27. He, F.; Shen, H.; Lin, C.; Fu, H.; Sheteiwy, M.S.; Guan, Y.; Huang, Y.; Hu, J. Transcriptome analysis of chilling-imbibed embryo revealed membrane recovery related genes in maize. Front. Plant Sci. 2016, 7, 1978. [Google Scholar] [CrossRef]
  28. Saltveit, M.E. Heat shocks increase the chilling tolerance of rice (Oryza sativa) seedling radicles. J. Agric. Food Chem. 2002, 50, 3232–3235. [Google Scholar] [CrossRef] [PubMed]
  29. Cheshmi, M.; Khajeh-Hosseini, M. Single count of radicle emergence, DNA replication during seed germination and vigour in alfalfa seed lots. Seed Sci. Technol. 2020, 48, 367–380. [Google Scholar] [CrossRef]
  30. Demir, I.; Kuzucu, C.O.; Ermis, S.; Öktem, G. Radicle emergence as seed vigour test estimates seedling quality of hybrid cucumber (Cucumis sativus L.) cultivars in low temperature and salt stress conditions. Horticulturae 2022, 9, 3. [Google Scholar] [CrossRef]
  31. Massardo, F.; Corcuera, L.; Alberdi, M. Embryo physiological responses to cold by two cultivars of oat during germination. Crop Sci. 2000, 40, 1694–1701. [Google Scholar] [CrossRef]
  32. Zhang, H.; Zhang, J.; Xu, Q.; Wang, D.; Di, H.; Huang, J.; Yang, X.; Wang, Z.; Zhang, L.; Dong, L.; et al. Identification of candidate tolerance genes to low-temperature during maize germination by GWAS and RNA-seq approaches. BMC Plant Biol. 2020, 20, 333. [Google Scholar] [CrossRef]
  33. Velázquez-Márquez, S.; Conde-Martínez, V.; Trejo, C.; Delgado-Alvarado, A.; Carballo, A.; Suárez, R.; Mascorro, J.O.; Trujillo, A.R. Effects of water deficit on radicle apex elongation and solute accumulation in Zea mays L. Plant Physiol. Biochem. 2015, 96, 29–37. [Google Scholar] [CrossRef]
  34. Shi, Y.; Zhang, Y.; Yao, H.; Wu, J.; Sun, H.; Gong, H. Silicon improves seed germination and alleviates oxidative stress of bud seedlings in tomato under water deficit stress. Plant Physiol. Biochem. 2014, 78, 27–36. [Google Scholar] [CrossRef] [PubMed]
  35. Lotfi, N.; Soleimani, A.; Vahdati, K.; Çakmakçı, R. Comprehensive biochemical insights into the seed germination of walnut under drought stress. Sci. Hortic. 2019, 250, 329–343. [Google Scholar] [CrossRef]
  36. Ren, S.; Tan, J.; Zhou, S.; Sun, H.; Li, H.; Li, W.; Li, N.; Wu, J.; Ren, X.; Ci, J.; et al. Germplasm selection and comprehensive evaluation of maize inbred lines at germination and seedling stage for saline–alkali tolerance. Agronomy 2025, 15, 626. [Google Scholar] [CrossRef]
  37. Wei, X.; Wang, J.; Xu, C.; Zhao, Y.; Pu, X.; Wang, W.; Lu, G. Analysis of germination characteristics and metabolome of Medicago ruthenica in response to saline-alkali stress. Front. Plant Sci. 2025, 16, 1592555. [Google Scholar] [CrossRef]
  38. Xu, J.; Qiao, X.; Tian, Z.; Zhang, X.; Zou, X.; Cheng, Y.; Lu, G.; Zeng, L.; Fu, G.; Ding, X.; et al. Proteomic analysis of rapeseed root response to waterlogging stress. Plants 2018, 7, 71. [Google Scholar] [CrossRef]
  39. Shen, C.; Yuan, J.; Qiao, H.; Wang, Z.; Liu, Y.; Ren, X.; Wang, F.; Liu, X.; Zhang, Y.; Chen, X.; et al. Transcriptomic and anatomic profiling reveal the germination process of different wheat varieties in response to waterlogging stress. BMC Genet. 2020, 21, 93. [Google Scholar] [CrossRef]
  40. Fan, Y.; Cui, C.; Liu, Y.; Wu, K.; Du, Z.; Jiang, X.; Zhao, F.; Zhang, R.; Wang, J.; Mei, H.; et al. Physiological and transcriptional responses of sesame (Sesamum indicum L.) to waterlogging stress. Int. J. Mol. Sci. 2025, 26, 2603. [Google Scholar] [CrossRef]
  41. Li, Y.; Zhang, J.; Wang, S.; Zhang, H.; Liu, Y.; Yang, M. Integrative transcriptomic and metabolomic analyses reveal the flavonoid biosynthesis of Pyrus hopeiensis flowers under cold stress. Hortic. Plant J. 2023, 9, 395–413. [Google Scholar] [CrossRef]
  42. Jiang, F.; Lv, S.; Zhang, Z.; Chen, Q.; Mai, J.; Wan, X.; Liu, P. Integrated metabolomics and transcriptomics analysis during seed germination of waxy corn under low temperature stress. BMC Plant Biol. 2023, 23, 190. [Google Scholar] [CrossRef]
  43. Bai, Y.; Dai, Q.; He, Y.; Yan, L.; Niu, J.; Wang, X.; Xie, Y.; Yu, X.; Tang, W.; Li, H.; et al. Exogenous diethyl aminoethyl hexanoate alleviates the damage caused by low-temperature stress in Phaseolus vulgaris L. seedlings through photosynthetic and antioxidant systems. BMC Plant Biol. 2025, 25, 75. [Google Scholar] [CrossRef] [PubMed]
  44. Meng, A.; Wen, D.; Zhang, C. Maize seed germination under low-temperature stress impacts seedling growth under normal temperature by modulating photosynthesis and antioxidant metabolism. Front. Plant Sci. 2022, 13, 843033. [Google Scholar] [CrossRef]
  45. Hodges, D.M.; Andrews, C.J.; Johnson, D.A.; Hamilton, R.I. Antioxidant enzyme and compound responses to chilling stress and their combining abilities in differentially sensitive maize hybrids. Crop Sci. 1997, 37, 857–863. [Google Scholar] [CrossRef]
  46. Ali, M.B.; Hahn, E.J.; Paek, K.Y. Effects of temperature on oxidative stress defense systems, lipid peroxidation and lipoxygenase activity in Phalaenopsis. Plant Physiol. Biochem. 2005, 43, 213–223. [Google Scholar] [CrossRef]
  47. Shin, S.K.; Cho, H.W.; Song, S.E.; Im, S.S.; Bae, J.H.; Song, D.K. Oxidative stress resulting from the removal of endogenous catalase induces obesity by promoting hyperplasia and hypertrophy of white adipocytes. Redox Biol. 2020, 37, 2213–2317. [Google Scholar] [CrossRef] [PubMed]
  48. Kesawat, M.S.; Satheesh, N.; Kherawat, B.S.; Kumar, A.; Kim, H.U.; Chung, S.M.; Kumar, M. Regulation of reactive oxygen species during salt stress in plants and their crosstalk with other signaling molecules—Current perspectives and future directions. Plants 2023, 12, 864. [Google Scholar] [CrossRef] [PubMed]
  49. Kumar, N.; He, J.; Rusling, J.F. Electrochemical transformations catalyzed by cytochrome P450s and peroxidases. Chem. Soc. Rev. 2023, 52, 5135–5171. [Google Scholar] [CrossRef]
  50. Li, S. Novel insight into functions of ascorbate peroxidase in higher plants: More than a simple antioxidant enzyme. Redox Biol. 2023, 64, 102789. [Google Scholar] [CrossRef]
  51. Fu, D.; Qi, J.; Su, L.; Wang, X.; Wang, M.; Chen, B.; Yu, X.; Zhao, X.; Gao, W.; Guo, X.; et al. Chalcone synthase 2 (BpCHS2), a structural gene, was activated by low temperature to promote anthocyanin synthesis in Broussonetia papyrifera to improve its cold tolerance. Plant Physiol. Biochem. 2025, 222, 109656. [Google Scholar] [CrossRef]
  52. Wang, X.; Zhao, Q.; Ma, C.; Zhang, Z.; Cao, H.; Kong, Y.; Yue, C.; Hao, X.; Chen, L.; Ma, J.; et al. Global transcriptome profiles of Camellia sinensis during cold acclimation. BMC Genom. 2013, 14, 415. [Google Scholar] [CrossRef] [PubMed]
  53. Moliterni, V.M.C.; Paris, R.; Onofri, C.; Orrù, L.; Cattivelli, L.; Pacifico, D.; Avanzato, C.; Ferrarini, A.; Delledonne, M.; Mandolino, G. Early transcriptional changes in Beta vulgaris in response to low temperature. Planta 2015, 242, 187–201. [Google Scholar] [CrossRef]
  54. Zhang, Q.; Wang, S.; Qin, B.; Sun, H.; Yuan, X.; Wang, Q.; Xu, J.; Yin, Z.; Du, Y.; Du, J.; et al. Analysis of the transcriptome and metabolome reveals phenylpropanoid mechanism in common bean (Phaseolus vulgaris) responding to salt stress at sprout stage. Food Energy Secur. 2023, 12, e481. [Google Scholar] [CrossRef]
  55. Amrine, K.C.H.; Blanco-Ulate, B.; Cantu, D. Discovery of core biotic stress responsive genes in Arabidopsis by weighted gene co-expression network analysis. PLoS ONE 2015, 10, e0118731. [Google Scholar] [CrossRef] [PubMed]
  56. Li, C.; Cao, S.; Zhao, Y.; Wang, R.; Yin, X. Integrated transcriptomics and metabolomics analyses revealed mechanisms of Trichoderma harzianum-induced resistance to downy mildew in grapevine. Physiol. Mol. Plant Pathol. 2025, 137, 102619. [Google Scholar] [CrossRef]
  57. Xiao, P.; Qu, J.; Wang, Y.; Fang, T.; Xiao, W.; Wang, Y.; Zhang, Y.; Khan, M.; Chen, Q.; Xu, X.; et al. Transcriptome and metabolome atlas reveals contributions of sphingosine and chlorogenic acid to cold tolerance in Citrus. Plant Physiol. 2024, 196, 634–650. [Google Scholar] [CrossRef]
  58. Jeon, J.; Kim, J.K.; Wu, Q.; Park, S.U. Effects of cold stress on transcripts and metabolites in tartary buckwheat (Fagopyrum tataricum). Environ. Exp. Bot. 2018, 155, 488–496. [Google Scholar] [CrossRef]
  59. Dunn, W.B.; Broadhurst, D.; Begley, P.; Zelena, E.; Francis-McIntyre, S.; Anderson, N.; Brown, M.; Knowles, J.D.; Halsall, A.; Haselden, J.N.; et al. Procedures for large-scale metabolic profiling of serum and plasma using gas chromatography and liquid chromatography coupled to mass spectrometry. Nat. Protoc. 2011, 6, 1060–1083. [Google Scholar] [CrossRef]
  60. Shi, H.; Chan, Z. The cysteine2/histidine2-type transcription factor ZINC FINGER OF ARABIDOPSIS THALIANA 6-activated C-REPEAT-BINDING FACTOR pathway is essential for melatonin-mediated freezing stress resistance in Arabidopsis. J. Pineal Res. 2014, 57, 185–191. [Google Scholar] [CrossRef]
  61. Xing, J.; Ye, X.; Huo, K.; Ding, Z.; Tie, W.; Xie, Z.; Li, C.; Meng, F.; Hu, W. Integrated metabolomic and transcriptomic analyses revealed the overlapping response mechanisms of banana to cold and drought stress. Plant Physiol. Biochem. 2025, 222, 109766. [Google Scholar] [CrossRef]
  62. Peng, Z.; Wang, Y.; Zuo, W.; Gao, Y.; Li, R.; Yu, C.; Liu, Z.; Zheng, Y.; Shen, Y.; Duan, L. Integration of metabolome and transcriptome studies reveals flavonoids, abscisic acid, and nitric oxide comodulating the freezing tolerance in Liriope spicata. Front. Plant Sci. 2022, 12, 764625. [Google Scholar] [CrossRef]
  63. Wang, L.; Nan, H.; Zhang, M.; Guang, L.; Meng, J.; Liu, M.; Meng, Y.; Chen, W.; Fan, Y.; Huang, H.; et al. GhADT5 enhances alkali stress tolerance in cotton by regulating phenylalanine-derived flavonoid biosynthesis and antioxidant defense. BMC Plant Biol. 2025, 25, 225. [Google Scholar] [CrossRef]
  64. Kim, J.I.; Hidalgo-Shrestha, C.; Bonawitz, N.D.; Franke, R.B.; Chapple, C. Spatio-temporal control of phenylpropanoid biosynthesis by inducible complementation of a cinnamate 4-hydroxylase mutant. J. Exp. Bot. 2021, 72, 3061–3073. [Google Scholar] [CrossRef] [PubMed]
  65. Zhao, C.; Liu, X.; Gong, Q.; Cao, J.; Shen, W.; Yin, X.; Grierson, D.; Zhang, B.; Xu, C.; Li, X.; et al. Three AP2/ERF family members modulate flavonoid synthesis by regulating type IV chalcone isomerase in citrus. Plant Biotechnol. J. 2021, 19, 671–688. [Google Scholar] [CrossRef] [PubMed]
  66. Hacquard, S.; Wang, E.; Slater, H.; Martin, F. Impact of global change on the plant microbiome. New Phytol. 2022, 234, 1907–1909. [Google Scholar] [CrossRef] [PubMed]
  67. Wang, L.; Sun, X.; Weiszmann, J.; Weckwerth, W. System-level and granger network analysis of integrated proteomic and metabolomic dynamics identifies key points of grape berry development at the interface of primary and secondary metabolism. Front. Plant Sci. 2017, 8, 1066. [Google Scholar] [CrossRef]
  68. Rohde, P.; Hincha, D.K.; Heyer, A.G. Heterosis in the freezing tolerance of crosses between two Arabidopsis thaliana accessions (Columbia-0 and C24) that show differences in non-acclimated and acclimated freezing tolerance. Plant J. 2004, 38, 790–799. [Google Scholar] [CrossRef]
  69. Hodges, D.M.; DeLong, J.M.; Forney, C.F.; Prange, R.K. Improving the thiobarbituric acid-reactive-substances assay for estimating lipid peroxidation in plant tissues containing anthocyanin and other interfering compounds. Planta 1999, 207, 604–611. [Google Scholar] [CrossRef]
  70. Long, Q.; Qiu, S.; Man, J.; Ren, D.; Xu, N.; Luo, R. OsAAI1 increases rice yield and drought tolerance dependent on ABA-mediated regulatory and ROS scavenging pathway. Rice 2023, 16, 35. [Google Scholar] [CrossRef]
  71. Fridovich, I. Superoxide anion radical (O2), superoxide dismutases, and related matters. J. Biol. Chem. 1997, 272, 18515–18517. [Google Scholar] [CrossRef]
  72. Xia, Z.; Wang, M.; Xu, Z. The maize sulfite reductase is involved in cold and oxidative stress responses. Front. Plant Sci. 2018, 9, 1680. [Google Scholar] [CrossRef]
  73. Zhang, Y.; Chen, B.; Xu, Z.; Shi, Z.; Chen, S.; Huang, X.; Chen, J.; Wang, X. Involvement of reactive oxygen species in endosperm cap weakening and embryo elongation growth during lettuce seed germination. J. Exp. Bot. 2014, 65, 3189–3200. [Google Scholar] [CrossRef]
  74. Neto, A.D.d.A.; Prisco, J.T.; Enéas-Filho, J.; Abreu, C.E.B.d.; Gomes-Filho, E. Effect of salt stress on antioxidative enzymes and lipid peroxidation in leaves and roots of salt-tolerant and salt-sensitive maize genotypes. Environ. Exp. Bot. 2006, 56, 87–94. [Google Scholar] [CrossRef]
  75. Giannopolitis, C.N.; Ries, S.K. Superoxide dismutases I. occurrence in higher plants. Plant Physiol. 1977, 59, 309–314. [Google Scholar] [CrossRef]
  76. Maehly, A.C.; Chance, B. The assay of catalases and peroxidases. Methods Biochem. Anal. 1954, 1, 357–424. [Google Scholar] [CrossRef]
  77. Aebi, H. [13] Catalase in vitro. Methods Enzymol. 1984, 105, 121–126. [Google Scholar] [CrossRef] [PubMed]
  78. Nakano, Y.; Asada, K. Hydrogen peroxide is scavenged by ascorbate-specific peroxidase in spinach chloroplasts. Plant Cell Physiol. 1981, 22, 867–880. [Google Scholar] [CrossRef]
  79. Kim, D.; Langmead, B.; Salzberg, S.L. HISAT: A fast spliced aligner with low memory requirements. Nat. Methods 2015, 12, 357–360. [Google Scholar] [CrossRef]
  80. Pertea, M.; Pertea, G.M.; Antonescu, C.M.; Chang, T.C.; Mendell, J.T.; Salzberg, S.L. StringTie enables improved reconstruction of a transcriptome from RNA-seq reads. Nat. Biotechnol. 2015, 33, 290–295. [Google Scholar] [CrossRef] [PubMed]
  81. Trapnell, C.; Williams, B.A.; Pertea, G.; Mortazavi, A.; Kwan, G.; van Baren, M.J.; Salzberg, S.L.; Wold, B.J.; Pachter, L. Transcript assembly and quantification by RNA-Seq reveals unannotated transcripts and isoform switching during cell differentiation. Nat. Biotechnol. 2010, 28, 511–515. [Google Scholar] [CrossRef]
  82. Love, M.I.; Huber, W.; Anders, S. Moderated estimation of fold change and dispersion for RNA-seq data with DESeq2. Genome Biol. 2014, 15, 550. [Google Scholar] [CrossRef] [PubMed]
  83. Xu, S.; Hu, E.; Cai, Y.; Xie, Z.; Luo, X.; Zhan, L.; Tang, W.; Wang, Q.; Liu, B.; Wang, R.; et al. Using clusterProfiler to characterize multiomics data. Nat. Protoc. 2024, 19, 3292–3320. [Google Scholar] [CrossRef] [PubMed]
  84. Li, Z.; Xu, J.; Gao, Y.; Wang, C.; Guo, G.; Luo, Y.; Huang, Y.; Hu, W.; Sheteiwy, M.S.; Guan, Y.; et al. The synergistic priming effect of exogenous salicylic acid and H2O2 on chilling tolerance enhancement during maize (Zea mays L.) seed germination. Front. Plant Sci. 2017, 8, 1153. [Google Scholar] [CrossRef] [PubMed]
  85. Nicot, N.; Hausman, J.F.; Hoffmann, L.; Evers, D. Housekeeping gene selection for real-time RT-PCR normalization in potato during biotic and abiotic stress. J. Exp. Bot. 2005, 56, 2907–2914. [Google Scholar] [CrossRef]
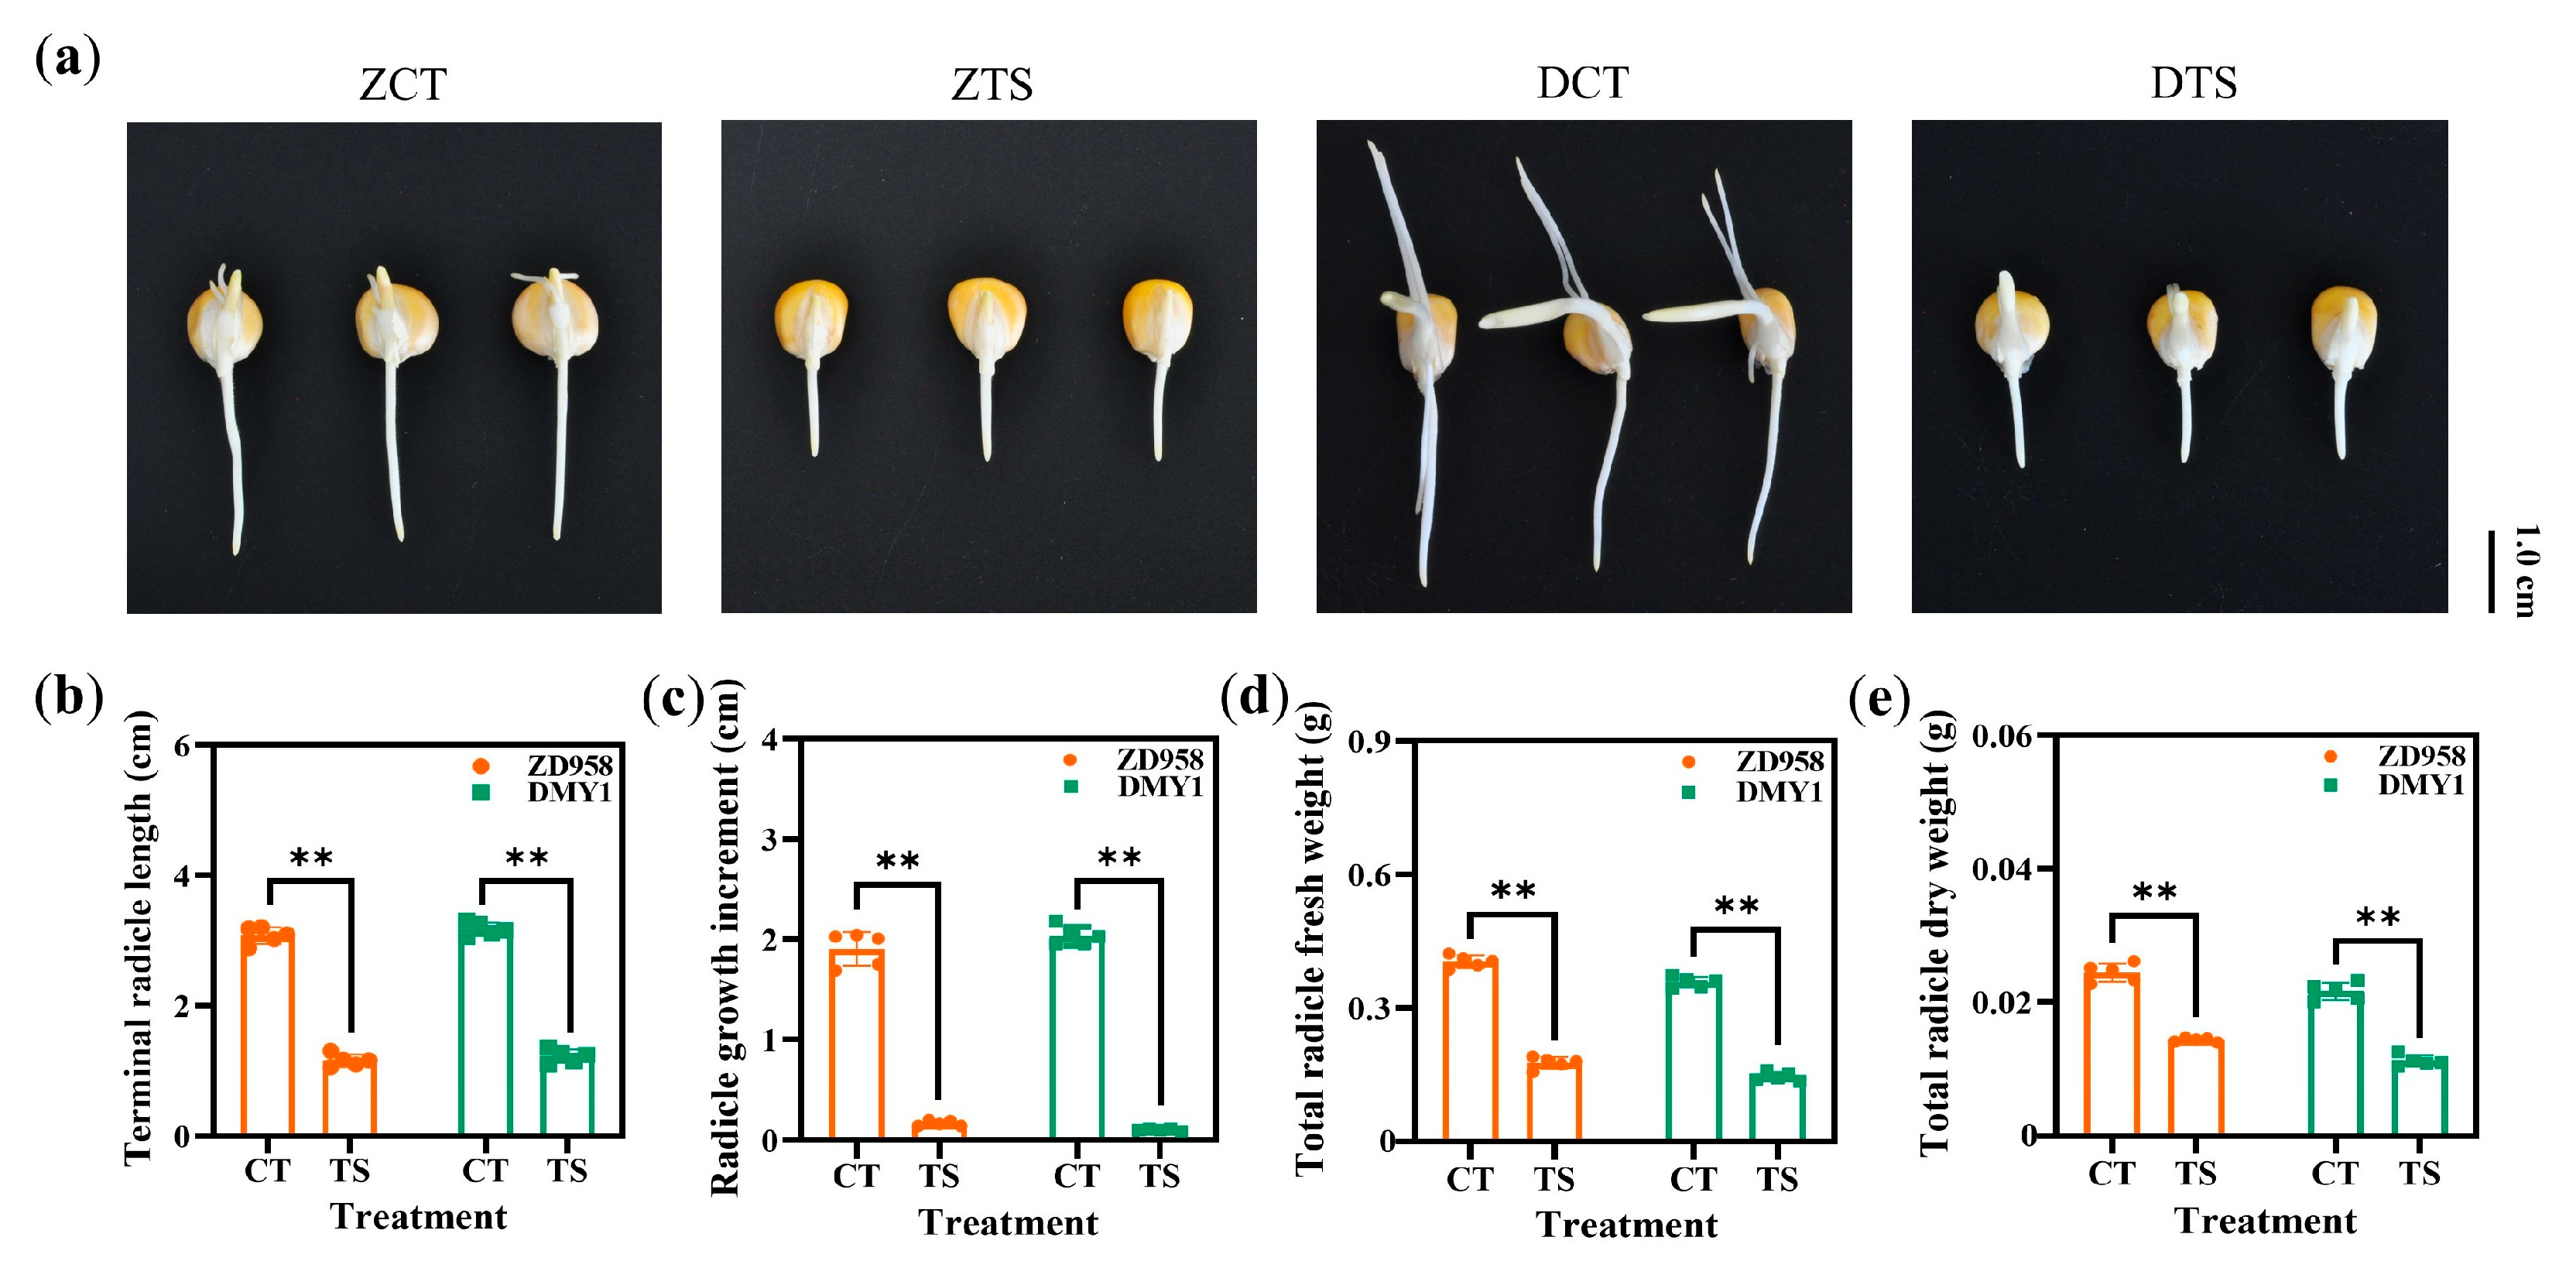
Figure 1. Differences in maize radicle morphology and growth performance under different treatments. (a) Morphological characteristics of ZD958 and DMY1 seeds under CT or TS conditions; (b) terminal length of maize radicles under CT or TS treatment conditions for different genotypes; (c) growth increment of maize radicles under CT or TS treatment conditions for different genotypes; (d) total fresh weight of maize radicles under CT or TS treatment conditions for different genotypes; (e) total dry weight of maize radicles under CT or TS treatment conditions for different genotypes. CT: control treatment; TS: low-temperature stress. Data represent the mean ± standard error (SE) of five replicates (n = 5). **: p < 0.01.
Plants 14 02988 g001
Figure 2. Histochemical staining and physiological index changes in maize radicles under different treatments. (a) Staining of maize radicles of different genotypes under CT or TS treatment conditions using NBT; (b) staining of maize radicles of different genotypes under CT or TS treatment conditions using DAB; (c) O2 content of maize radicles of different genotypes under CT or TS treatment conditions; (d) H2O2 content in maize radicles of different genotypes under CT or TS treatment conditions; (e) MDA content in maize radicles of different genotypes under CT or TS treatment conditions; (f) REC of maize radicles of different genotypes under CT or TS treatment conditions. Data represent the mean ± SE of five replicates (n = 5). **: p < 0.01.
Plants 14 02988 g002
Figure 3. Changes in antioxidant enzyme activity in maize radicles under different treatments. (a) SOD activity; (b) POD activity; (c) CAT activity; and (d) APX activity. SOD: superoxide dismutase; POD: peroxidase; CAT: catalase; APX: ascorbate peroxidase. Data represent the mean ± SE of five replicates (n = 5). **: p < 0.01.
Plants 14 02988 g003
Figure 4. DEGs in different treatment comparison groups and their GO and KEGG enrichment analysis. (a) Number of DEGs in the comparison groups “ZCT vs. ZTS” and “DCT vs. DTS”; (b) Number of unique and common DEGs between “ZCT vs. ZTS” and “DCT vs. DTS”; (c) Top 20 GO terms analysis of common DEGs between “ZCT vs. ZTS” and “DCT vs. DTS”; (d) Top 20 KEGG pathways of the common DEGs between “ZCT vs. ZTS” and “DCT vs. DTS”; In the bubble plot, the x-axis represents the enrichment factor, and the y-axis represents the KEGG pathway, with colors ranging from red to green indicating p-values from small to large. ZCT: control treatment of ZD958; ZTS: TS treatment of ZD958; DCT: control treatment of DMY1; DTS: TS treatment of DMY1; MF: molecular function; CC: cellular component; GO, Gene Ontology; KEGG: Kyoto Encyclopedia of Genes and Genomes.
Plants 14 02988 g004
Figure 5. GO and KEGG enrichment analysis of DEGs in co-expression trend modules across different treatment groups. (a,b) show the GO enrichment analysis of DEGs in the modules of ZCT vs. ZTS” and “DCT vs. DTS”, respectively; (c,d) represent the KEGG enrichment analysis of DEGs in ZCT vs. ZTS” and “DCT vs. DTS”, respectively. In the bubble chart, the x-axis represents the enrichment factor, and the y-axis represents the KEGG pathway. A larger enrichment factor indicates a higher degree of enrichment; a larger point indicates a greater number of DEGs in the pathway; and a redder point indicates more significant enrichment. ZCT: control treatment of ZD958; ZTS: TS treatment of ZD958; DCT: control treatment of DMY1; DTS: TS treatment of DMY1; MF: molecular function; CC: cellular component.
Plants 14 02988 g005
Figure 6. WGCNA and KEGG enrichment analysis of DEGs in different treatment comparison groups. (a) KEGG enrichment analysis of DEGs in the MEblue module of WGCNA; (b) KEGG enrichment analysis of DEGs in the MEturquoise module of WGCNA. In the bubble plot, the x-axis represents the enrichment factor, and the y-axis represents the KEGG pathway. A higher enrichment factor indicates a greater degree of enrichment; larger points indicate a greater number of DEGs in the pathway; and redder points indicate more significant enrichment.
Plants 14 02988 g006
Figure 7. Nine DEGs were randomly selected from the key candidate pathways for qRT-PCR analysis. Relative expression level of (a) Zm00001d053619; (b) Zm00001d012510; (c) Zm00001d018660; (d) Zm00001d051529; (e) Zm00001d043174; (f) Zm00001d052915; (g) Zm00001d001960; (h) Zm00001d030548; and (i) Zm00001d031488. Black represents the FPKM values of DEGs in the transcriptome; gray represents the relative expression levels of DEGs in qRT-PCR. Data represent the mean ± SE from three biological replicates (n = 3), with each biological replicate validated by three technical replicates. ZCT: control treatment of ZD958; ZTS: TS treatment of ZD958; DCT: control treatment of DMY1; DTS: TS treatment of DMY1; FPKM: fragments per kilobase of exon model per million mapped reads; qRT-PCR: quantitative real-time polymerase chain reaction.
Plants 14 02988 g007
Figure 8. Analysis of the metabolic regulation pathways of flavonoids in maize radicles under different treatment conditions. (a) Trends in changes in related metabolites in maize radicles of different genotypes under TS. The gray dashed box indicates phenylpropanoid biosynthesis, the orange dashed box indicates flavonoid biosynthesis, the green dashed box indicates isoflavonoid biosynthesis, and the blue dashed box indicates flavone and flavonol biosynthesis. Red to green indicates DAM content from high to low; (b) transcriptional changes in genes related to flavonoid compound metabolism in maize radicles of different genotypes under TS. Red to blue indicates DEG expression from high to low. PAL: phenylalanine ammonia-lyase; C4H: trans-cinnamate 4-monooxygenase; 4CL: 4-coumarate-CoA ligase; C3′H: 5-O-(4-coumaroyl)-D-quinate 3′-monooxygenase; CHS: chalcone synthase; CHI: chalcone isomerase; F3H: naringenin 3-dioxygenase; FLS: flavonol synthase; DFR: bifunctional flavanone 4-reductase; ZCT: control treatment of ZD958; ZTS: TS treatment of ZD958; DCT: control treatment of DMY1; DTS: TS treatment of DMY1.
Plants 14 02988 g008
Figure 9. Changes in TF content, total antioxidant capacity of maize radicles and the activity of key enzymes in the flavonoid metabolic pathway under different treatments. (a) TF content; (b) T-AOC; (c) 4CL activity; and (d) DFR activity in maize radicles of different genotypes under CT or TS treatment conditions. CT: control treatment; TS: low-temperature stress; TF: total flavonoid; T-AOC: total antioxidant capacity; 4CL: 4-coumarate-CoA ligase; DFR: bifunctional dihydroflavonol 4-reductase. Data represent the mean ± SE of five replicates (n = 3). **: p < 0.01.
Plants 14 02988 g009
Figure 10. Mechanism diagram of flavonoid metabolism regulation in maize radicles under TS. LT: low temperature; ROS: reactive oxygen species, including O2 and H2O2; REC: relative electrolytic conductivity; MDA: malondialdehyde; SOD: superoxide dismutase; POD: peroxisome; CAT: catalase; APX: ascorbate peroxidase; PAL: phenylalanine ammonia-lyase; C4H: trans-cinnamate 4-monooxygenase; 4CL: 4-coumarate-CoA ligase; CHS: chalcone synthase; F3H: naringenin 3-dioxygenase; FLS: flavonol synthase; CHI: chalcone isomerase. Black thin arrows indicate the direction of action or metabolic flux, red short arrows indicate increased content/activity or upregulated related genes, red long arrows emphasize the direction of action, and ZD958 and DMY1 are represented by boxes of different colors to show their varietal differences.
Plants 14 02988 g010
Disclaimer/Publisher’s Note: The statements, opinions and data contained in all publications are solely those of the individual author(s) and contributor(s) and not of MDPI and/or the editor(s). MDPI and/or the editor(s) disclaim responsibility for any injury to people or property resulting from any ideas, methods, instructions or products referred to in the content.