Article

DNA Barcoding Provides Taxonomic Clues for Identifying Five Endangered Phoebe Species in Southern China

1
Bamboo Industry Institute, Zhejiang A & F University, Hangzhou 311300, China
2
Zhejiang Academy of Science and Technology for Inspection and Quarantine, Hangzhou 311202, China
3
State Key Laboratory of Subtropical Silviculture, College of Forestry and Biotechnology, Zhejiang A & F University, Hangzhou 311300, China
4
Zhejiang Academy of Forestry, Hangzhou 310023, China
5
Sichuan Academy of Forestry Sciences, Chengdu 610081, China
6
Technology Center of Hangzhou Customs, Hangzhou 311202, China
*
Authors to whom correspondence should be addressed.
Plants 2025, 14(18), 2895; https://doi.org/10.3390/plants14182895
Submission received: 16 July 2025 / Revised: 12 September 2025 / Accepted: 14 September 2025 / Published: 18 September 2025
(This article belongs to the Section Plant Systematics, Taxonomy, Nomenclature and Classification)

Abstract

Trees in the genus Phoebe of the Lauraceae family are commonly known as “Nanmu” in traditional Chinese culture. As they have offered highly valued timbers for construction, furniture, and coffins since the pre-Qin Dynasty, it is crucial to identify and protect these Phoebe species. However, the accuracy of Phoebe species identification is frequently hampered due to the limitations of traditional morphological and wood anatomy methods as the marker characteristics are very similar between the species, alongside the requirement for specialized expertise. Here, we use DNA barcoding technology for the rapid and accurate identification of five endangered Phoebe species in China, including Phoebe bournei, P. chekiangensis, P. hui, P. sheareri and P. zhennan. Four highly divergent regions (petA-psbJ-psbL-psbF-psbE, Ψycf1-ndhF, rpl32-trnLUAG and ycf1) were identified from a comparison of the 20 Phoebe plastomes downloaded from the database. Furthermore, phylogenetic analysis on 20 Phoebe species showed that rpl32-trnLUAG + ycf1, as well as rpl32-trnLUAG + ycf1 + Ψycf1-ndhF, effectively distinguished the fifteen Phoebe species. We further validated the usefulness of the core 2-locus barcode using wood and leaf samples from multiple sites for five target species. The study confirms the reliability of molecular diagnostics for five Phoebe species. It also establishes critical taxonomic protocols for conserving these endangered Nanmu species in southern China.

1. Introduction

Woody plants are essential to human societies due not only to their ecological functions but also their ornamental and economic value [1]. In China, trees in the genus Phoebe, Lauraceae, provide highly valued timbers that have been used nationwide for constructions, furniture, and coffins since the pre-Qin Dynasty (c.a. 221 BC) [2]. The wood of Phoebe species, along with Machilus in the Lauraceae, are traditionally called “Nanmu” in Chinese culture. Because giant “Nanmu” trees were extensively harvested for palace constructions by imperial families of Ming and Qing Dynasty during the 15th–19th centuries [1,2,3], very few old trees survive in present-day villages and cities [3]. Out of the 34 Phoebe species endemic to China, four species have been frequently identified as vulnerable species in China’s National Key Protected Wild Plant List and The International Union for Conservation of Nature (IUCN) plant red lists (Supplementary Table S1) [4,5], namely Phoebe bournei (Hemsl.) Yen C. Yang, P. chekiangensis C. B. Shang, P. hui W. C. Cheng ex Yen C. Yang, and P. zhennan S. K. Lee & F. N. Wei. Moreover, more than 99% of old Phoebe trees (>100-year old) in China are P. bournei, P. chekiangensis, P. sheareri (Hemsl.) Gamble, and P. zhennan [6]. Therefore, it is crucial to accurately identify and protect these tree species.
Distinguishing Phoebe species from one to another, however, remains a great challenge, especially for non-taxonomists and non-wood anatomists. Both morphological and anatomical traits overlap significantly in this genus and even across several closely related genera [7,8,9]. For example, P. bournei and P. zhennan display very similar leaf morphology [2], a relatively stable feature in comparison to flowers and fruits whose observation is constrained by the season [10,11,12,13,14]. In addition, anatomical structures of Phoebe wood are even similar to those of Machilus (e.g., P. zhennan and M. pingii, the latter is a synonym of M. nanmu (Oliv.) Hemsl.). Because of this, wood anatomy-based techniques have been of little practical use for distinguishing Phoebe species [15], hampering the accurate identification of these species for wood trading.
In recent years, studies have attempted to identify the Lauraceae plants using promising DNA techniques due to their highly similar morphological traits. Numerous studies have focused on complete chloroplast genomes from leaves of the Lauraceae plants [7,16,17,18,19,20]. Although these analyses provide informative taxonomic and evolutionary clues about the Phoebe species, the sequencing of complete chloroplast genomes is generally time-consuming and labor-intensive [21,22,23,24]. Similar cost and labor issues also occur with the extraction of ancient DNA using hybridization, which is particularly important for identifying archeological “Nanmu” wood [1].
Another set of studies employed DNA barcoding, a method based on the analysis of short DNA sequences [10,25]. DNA barcoding can distinguish closely related species with high accuracy and efficiency [25,26,27,28]. Yet, the main challenge of DNA barcoding arises from the difficulty of finding universal barcodes that can be used to identify all plant species [25]. Efforts have suggested the usefulness of chloroplast DNA markers (e.g., maturase K (matK), ribulose-bisphosphate carboxylase (rbcL), and the non-coding spacer psbA-trnH and nuclear ribosomal DNA marker (e.g., Internal Transcribed Spacer (ITS)), or a combination of these markers for plant classification [12,29,30,31,32]. Consequently, additional markers, known as specific barcodes, are still required to increase the taxonomic resolution [25]. However, current DNA barcoding studies on the Phoebe genus have not provided a straightforward approach for distinguishing these five endangered Phoebe species [7].
In this study, we investigate the potential of DNA barcoding methodology for distinguishing the wood of the five protected species in the genus Phoebe, Lauraceae, including P. bournei, P. chekiangensis, P. hui, P. sheareri, and P. zhennan, to complement species identification based on traditional morphology and wood anatomy. In doing so, we first designed specific primers from whole plastomes (widely referred to as complete chloroplast genome sequences [33]) of 20 Phoebe species obtained from National Center for Biotechnology Information (NCBI) platform (https://www.ncbi.nlm.nih.gov/, accessed on 4 July 2024), such that the designed barcodes could be highly species-specific. We then tested the capability of the single barcodes and their combinations to identify the five target Phoebe species and validated the theoretical barcodes using wood and leaf samples collected from multiple sites in southern China.

2. Results

2.1. Comparison of Characteristic and Structure of Plastomes

The 55 plastomes of the 20 Phoebe species showed similar sequence characteristics and shared a typical quadripartite structure (Figure 1, Supplementary Figure S1). The sequence lengths range from 152,654 to 154,169 bp and the GC contents range between 39.10 and 39.20%. The gene count within each plastome includes 81 to 84 coding sequences (CDSs), 6 or 8 rRNAs, and 36 tRNAs (Supplementary Table S2). Despite these similarities, significant variations were found near the boundaries between large single-copy (LSC), small single-copy (SSC), and two inverted repeats (IRa and IRb) within the quadripartite structure, thus influencing the lengths of the coding genes ycf1 and ycf2 (Figure 2). In addition, the distances from the coding gene ndhF to the IR-SSC boundary and trnH to the IR-LSC boundary are different among species, ranging from 15 to 21 bp and 21 to 1009 bp, respectively.

2.2. Candidate Hotspot Regions

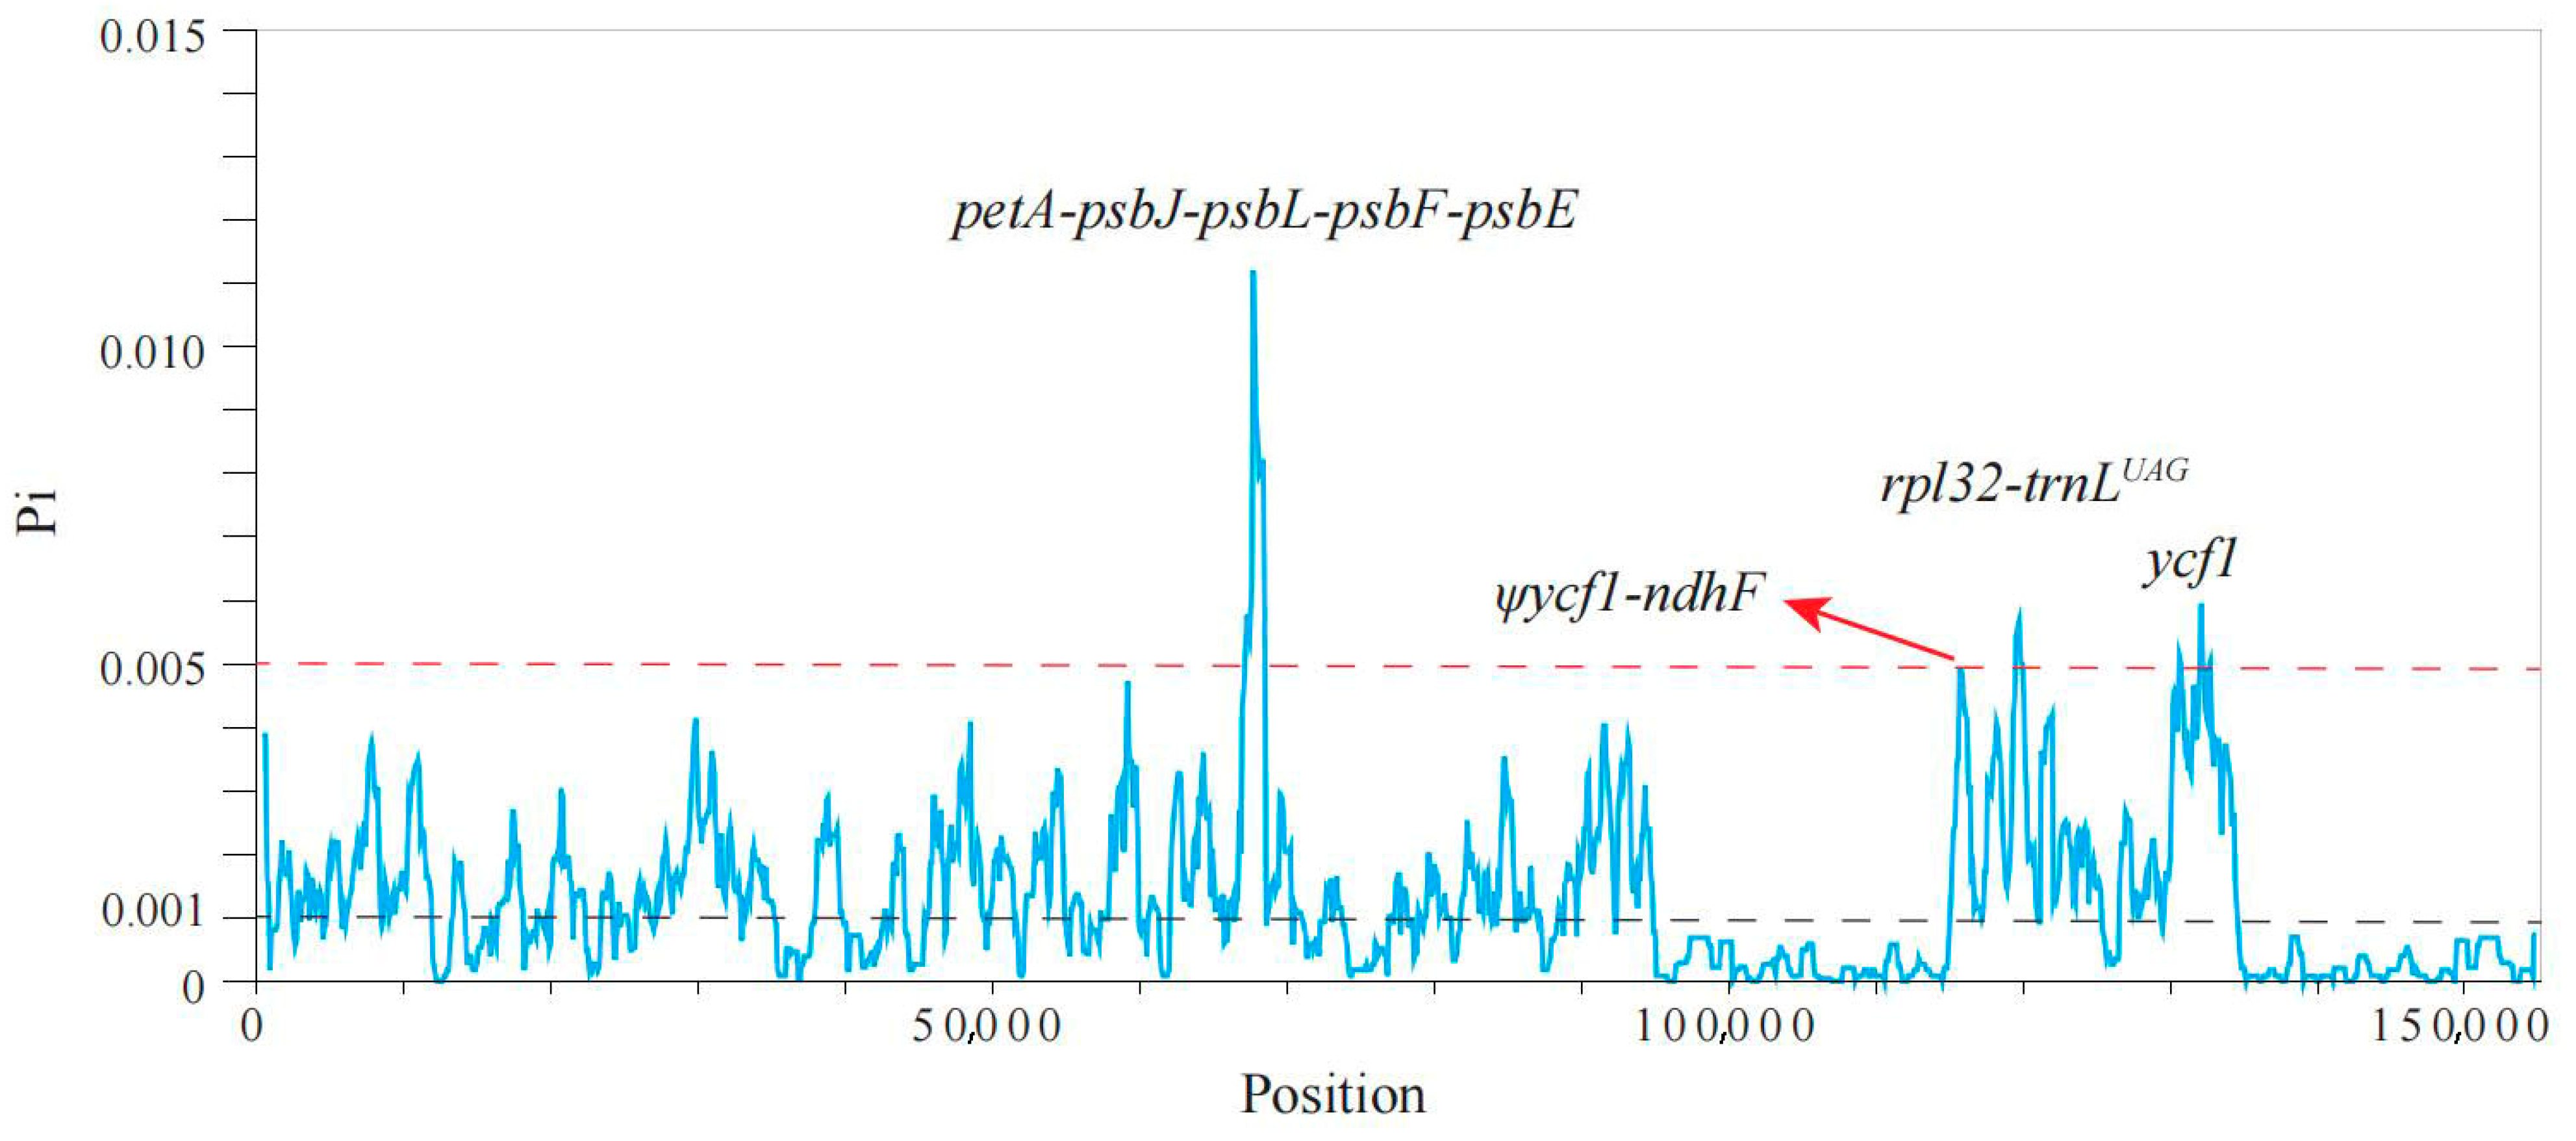
Despite the similarities among the plastome sequences of the 20 Phoebe species (Supplementary Material S2), we identified several candidate hotspot regions showing Pi values greater than 0.005 compared to an averaged Pi value of 0.001 for the whole plastomes. These candidate loci exhibit high variability and may have the potential for species delimitation, including three intergenic regions (petA-psbJ-psbL-psbF-psbE, Ψycf1-ndhF and rpl32-trnLUAG) and one CDS of ycf1 (Figure 3).
We further calculated intra- and inter-specific genetic distance for the four candidate loci and their different combinations (Table 1). The barcodes Ψycf1-ndhF, rpl32-trnLUAG, and ycf1 alone show higher average inter-specific than intra-specific distances, while petA-psbJ-psbL-psbF-psbE resulted in a higher average intra-specific distance and the lowest identification success rate (ISR = 16.36%). This suggests that candidate loci need to be screened for a Pi value of 0.005 or more in order to identify barcodes capable of species distinction among the 20 Phoebe species tested in this study. Although combinations of barcodes do not seem to increase the inter-specific distances substantially, the ISRs are significantly higher, ranging within 49.09–70.91% and 63.64–78.18% for the combinations of two and three loci, respectively. The combination of four loci yielded the same ISR as for the combination of petA-psbJ-psbL-psbF-psbE + rpl32-trnLUAG + ycf1. However, we noticed that none of the single-locus barcodes or their combinations exhibited a higher minimum inter-specific distance compared with the maximum intra-specific distance, most likely due to the high degree of genetic similarity in the Phoebe genus.

2.3. Phylogeny Analysis

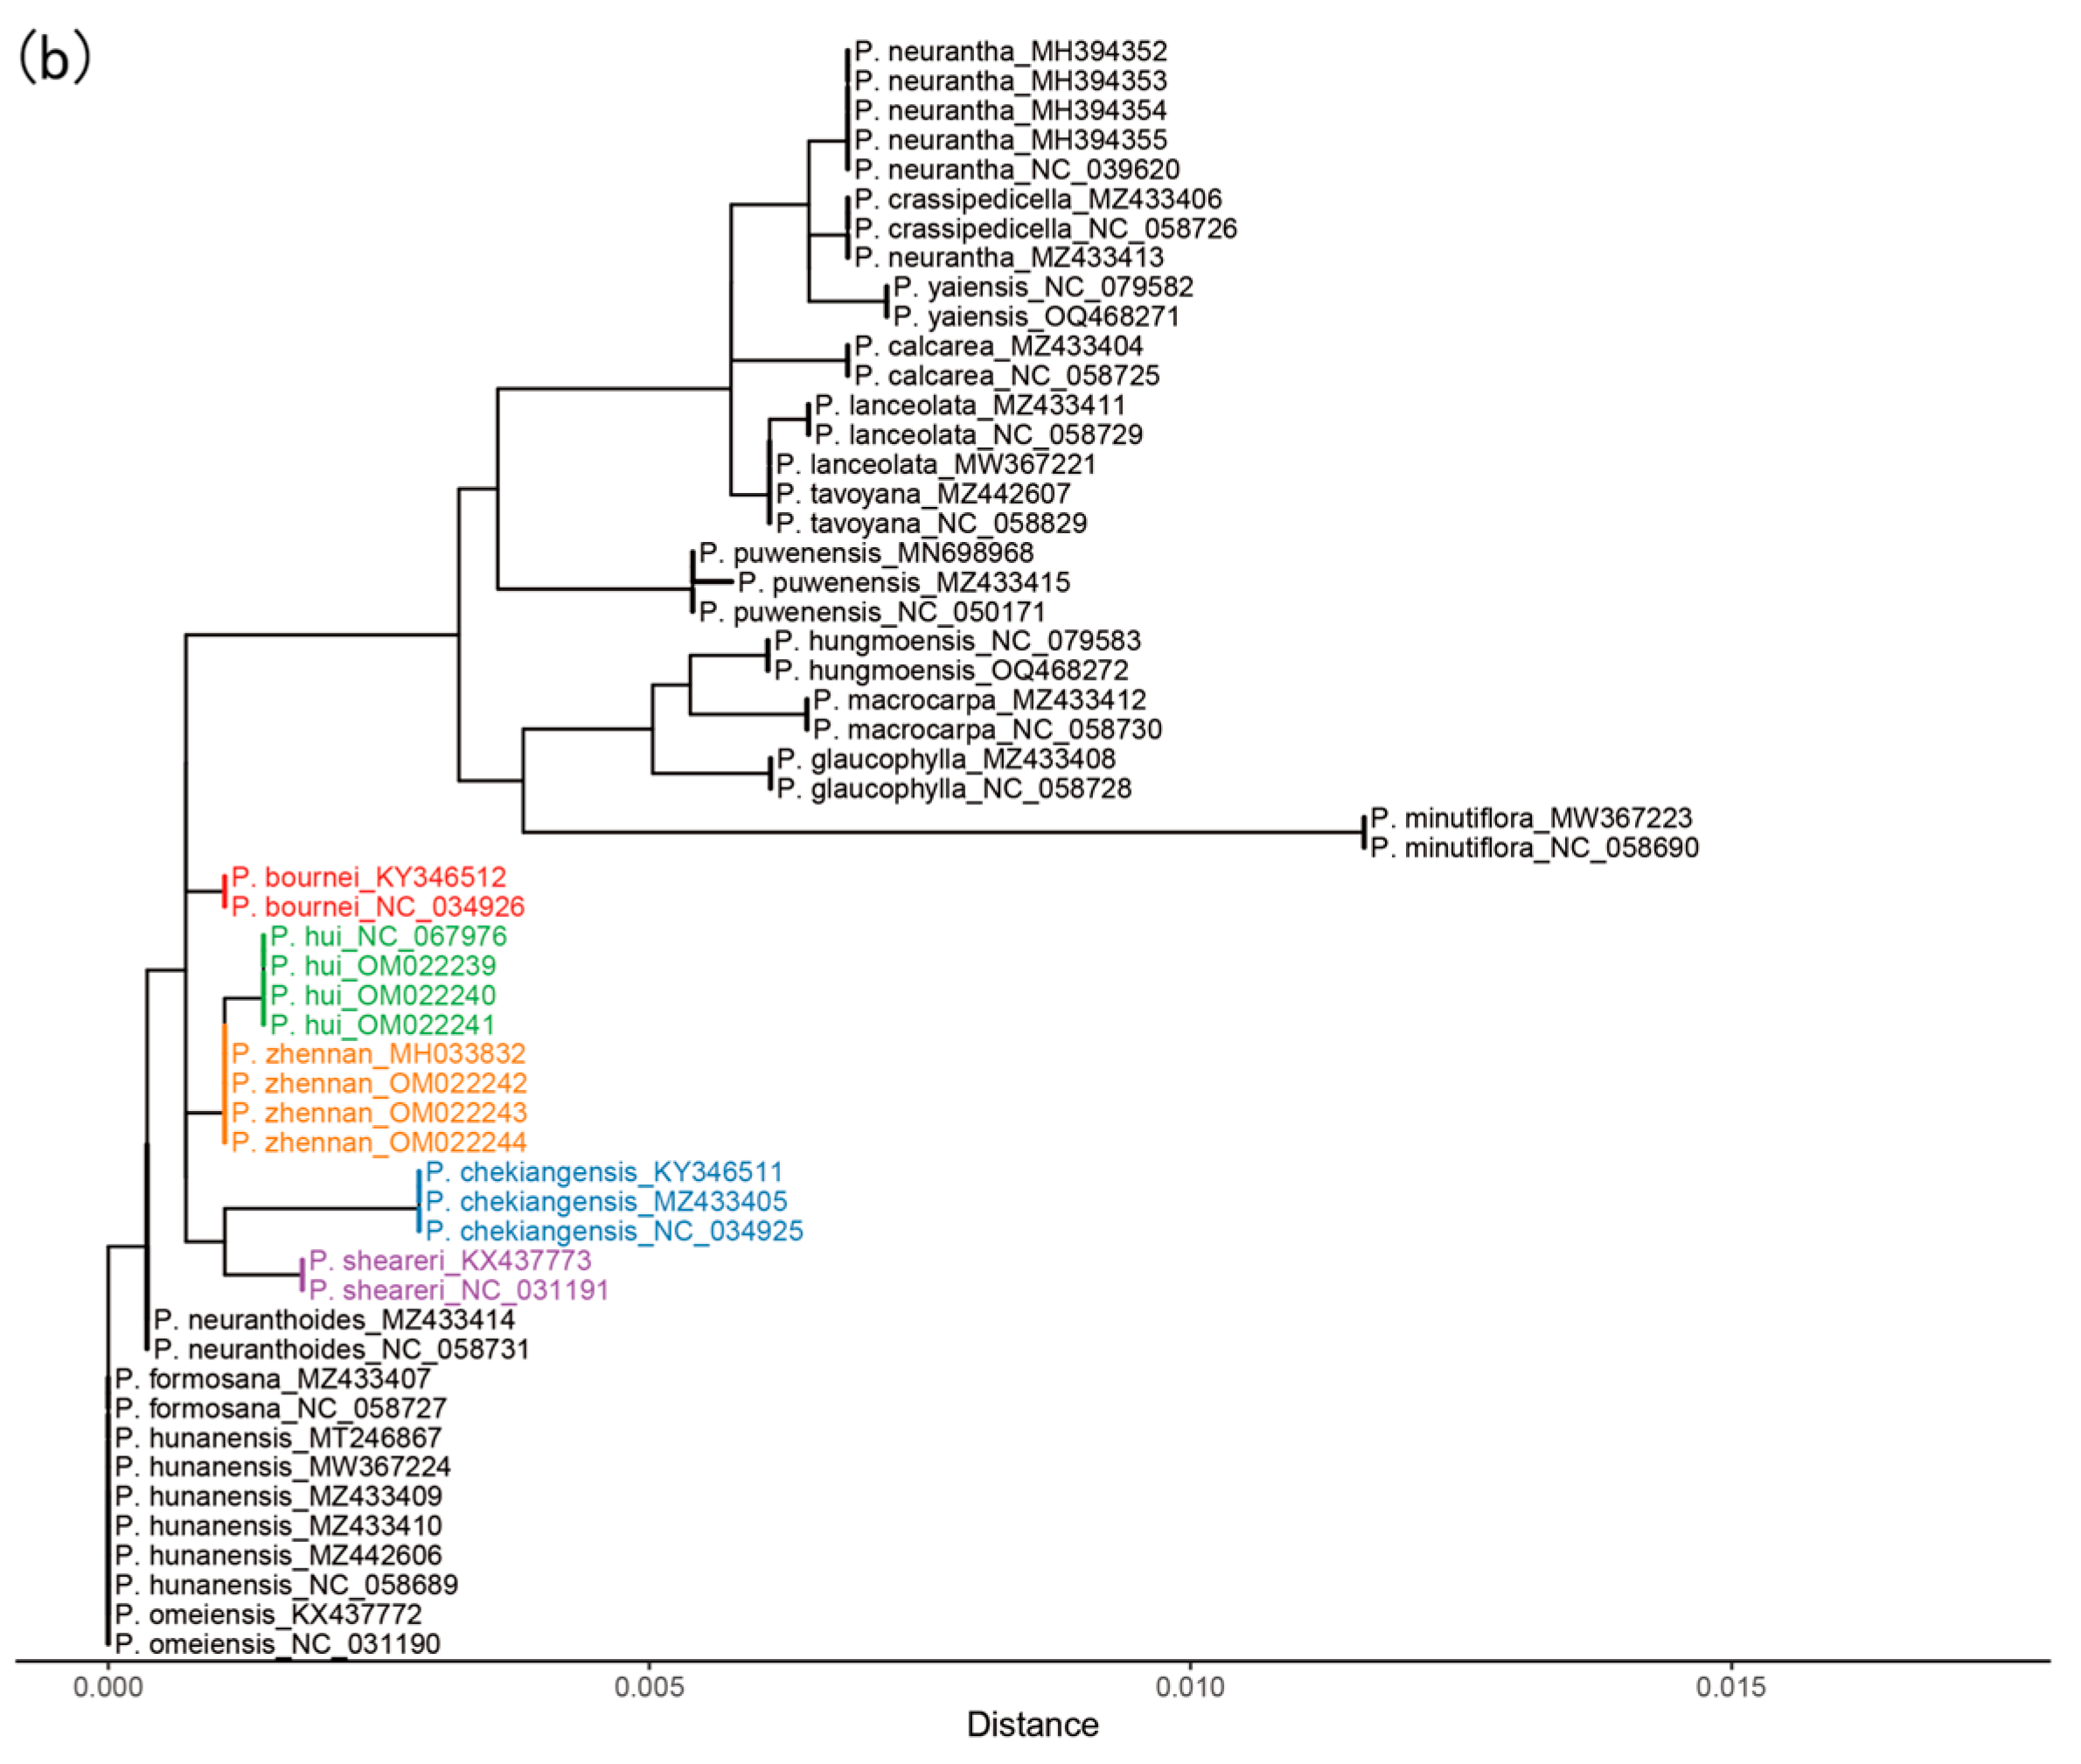
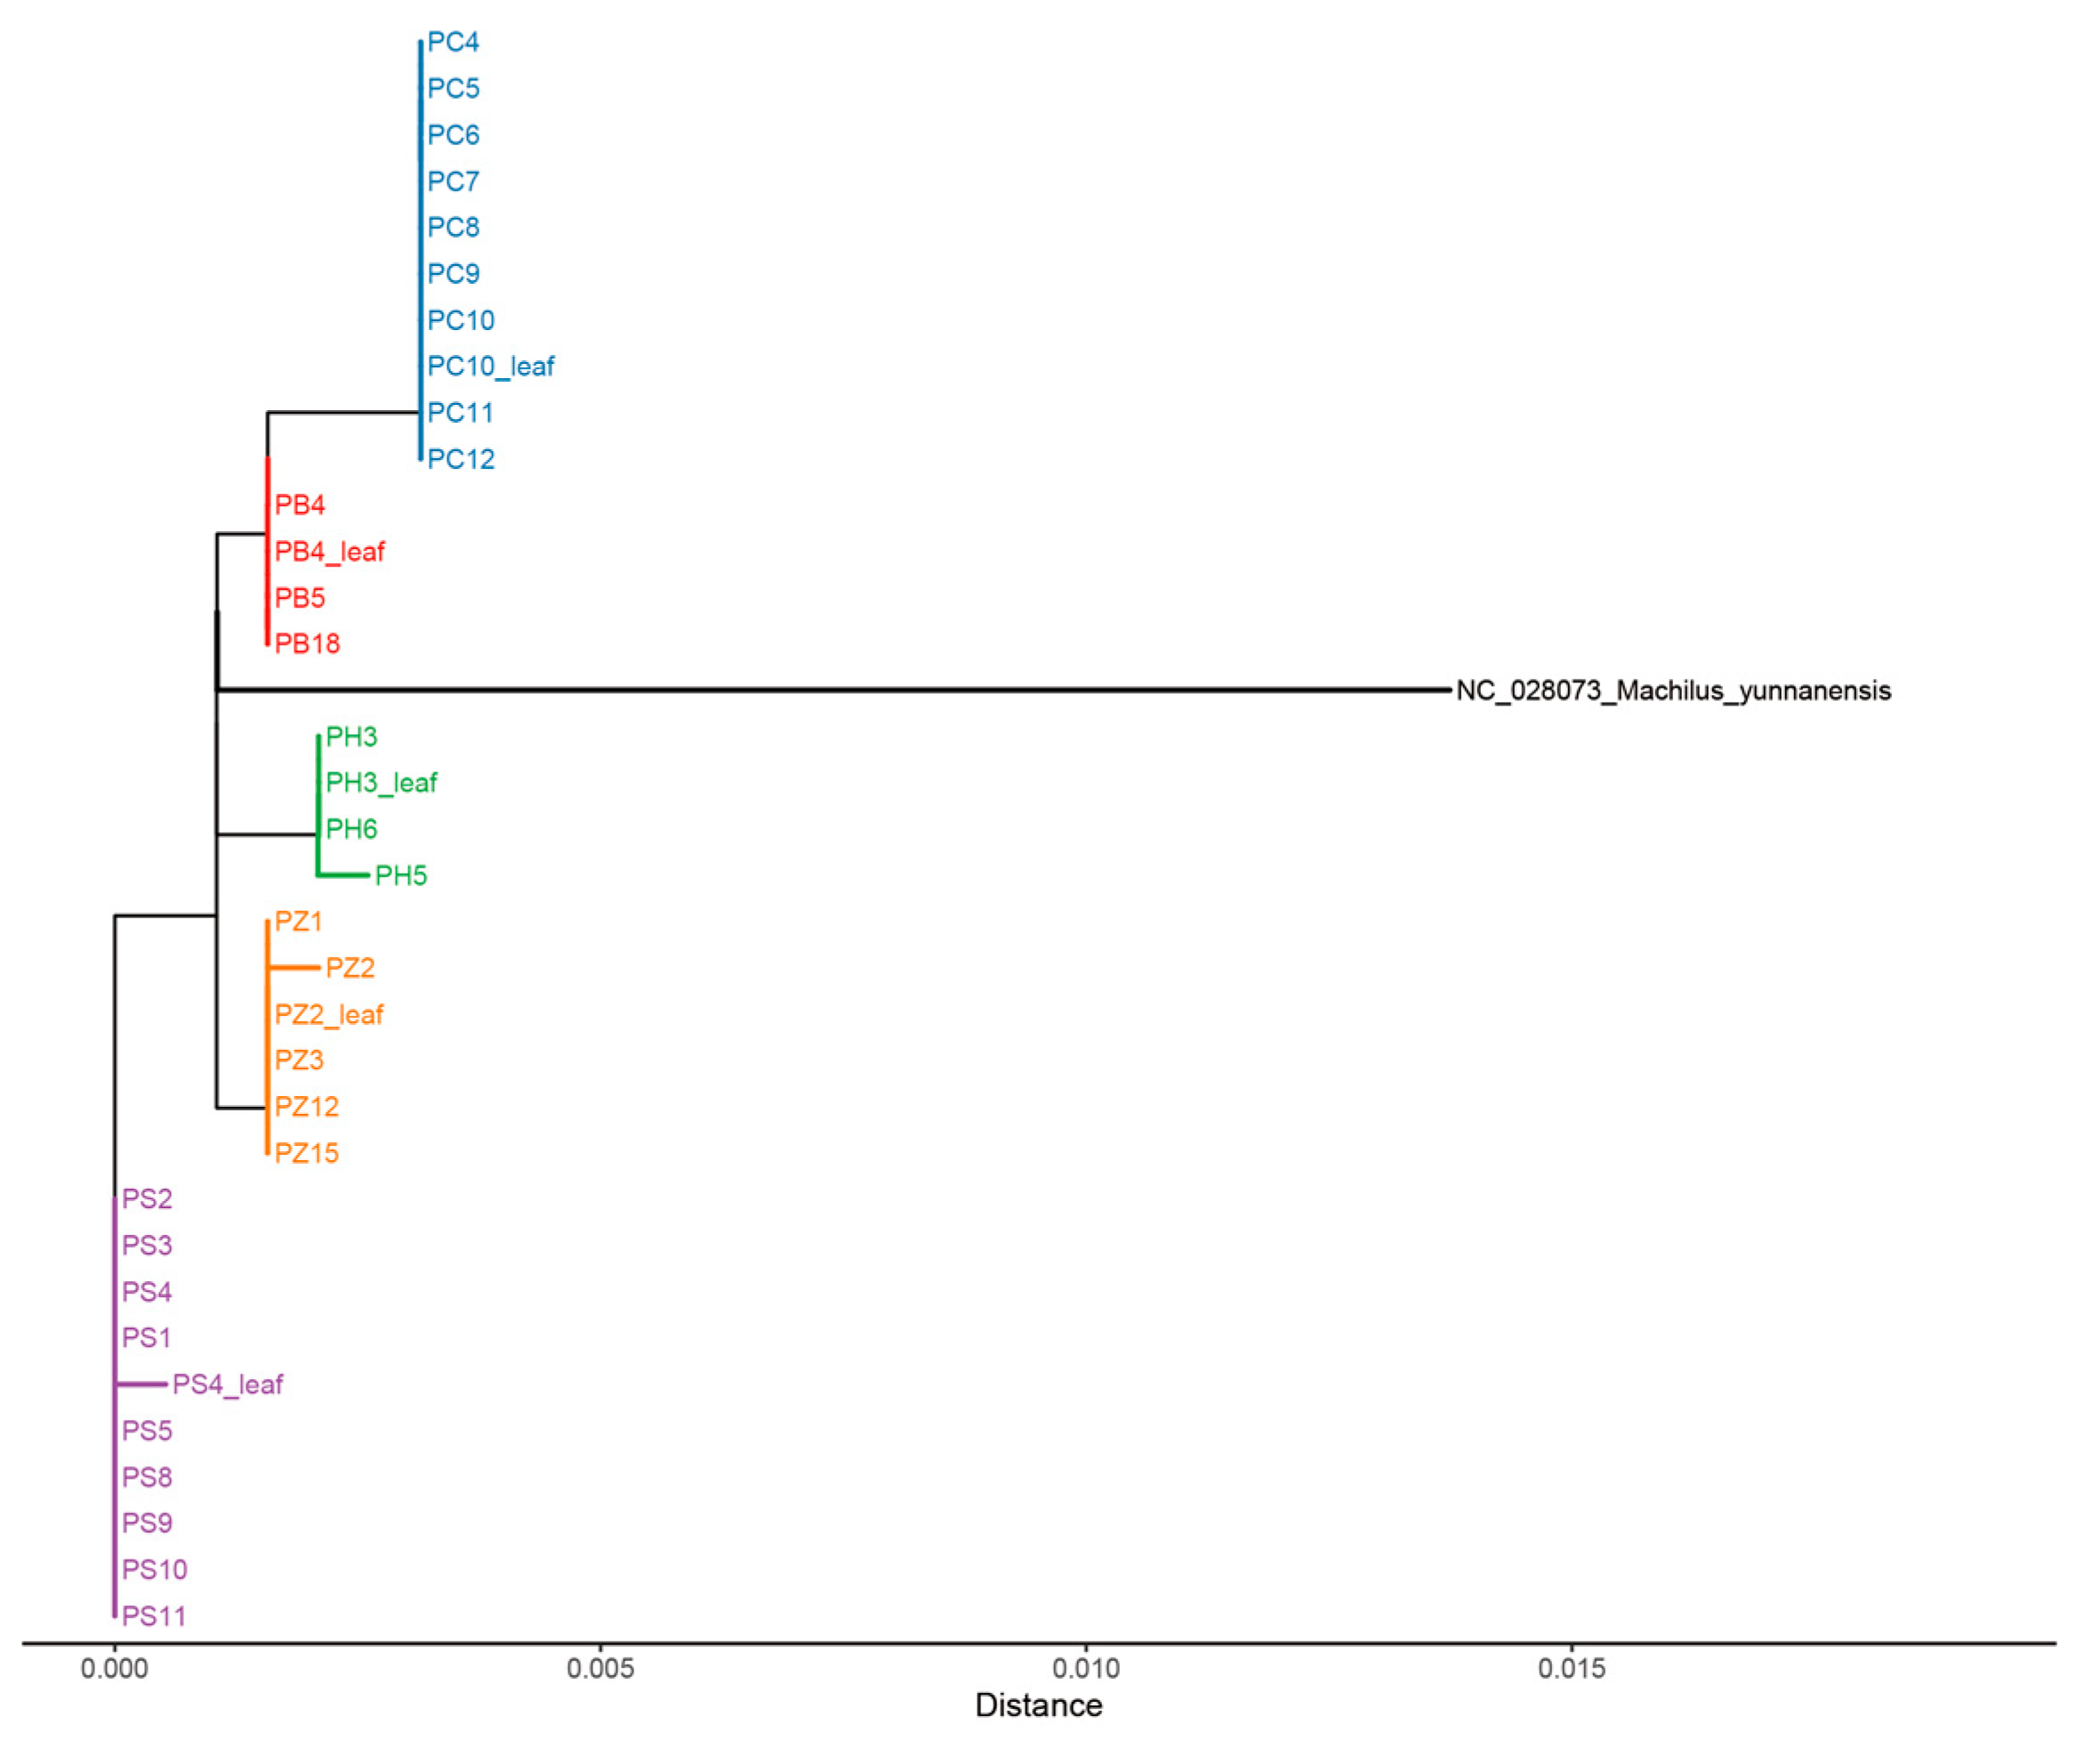
NJ phylogenetic analyses (Supplementary Figure S2a–d) show that all the single locus barcodes fail to distinguish between P. bournei, P. chekiangensis, P. hui, P. sheareri, and P. zhennan completely. In contrast, these five target species are well discriminated when rpl32-trnLUAG is combined with ycf1 and combined with ycf1 and Ψycf1-ndhF (Figure 4a,b and Figure 5). Furthermore, these two combinations both identify ten other species in the genus of Phoebe, leaving only five highly unidentified species remain. This species-level success rate aligns well with the relatively high IRS at the individual level (Table 1). The multi-locus combinations of petA-psbJ-psbL-psbF-psbE + rpl32-trnLUAG + ycf1 and petA-psbJ-psbL-psbF-psbE + Ψycf1-ndhF + rpl32-trnLUAG + ycf1 have even higher IRS (Table 1); however, they do not yield a satisfactory identification result for P. bournei, P. chekiangensis, P. hui, P. sheareri, and P. zhennan, although these combinations can distinguish 16 tree species (Supplementary Figure S3). In addition, the samples we collected confirmed that rpl32-trnLUAG + ycf1 can effectively distinguish the five target species (Figure 5) and implied that DNA from both the wood and the leaves is the same.

3. Discussion

In this study, we show that two sets of combined hotspot regions—rpl32-trnLUAG + ycf1 and Ψycf1-ndhF + rpl32-trnLUAG + ycf1—can accurately distinguish the five endangered Phoebe species (P. bournei, P. chekiangensis, P. hui, P. sheareri, and P. zhennan). This result is supported by the NJ tree analyses on barcodes extracted from the genome sequences of 20 Phoebe species (Figure 4a,b), but also by the wood and leaf samples of the five species (Figure 5). The perfect clustering of the same species from multiple sites in Southern China further indicates that these two-locus combinations are geographically stable and consistent (Figure 5). Moreover, the close genetic relationship of P. bournei, P. chekiangensis, P. hui, P. sheareri, and P. zhennan, in general, aligns well with the genetic relationship based on plastid genomes of Lauraceae species [1,8,34]. This confirms the robustness of these two-locus combinations for differentiating the five species.
Although the mean pi value of ycf1 accounts for half the magnitude of the peak of petA-psbJ-psbL-psbF-psbE (Figure 3), earlier studies have suggested that ycf1 likely represents the most variable region compared to standard barcodes such as rbcL, matK, trnH-psbA, and ITS [19,30,35,36,37,38,39,40,41,42,43,44,45]. We find that ycf1 can identify three target Phoebe species (P. chekiangensis, P. hui, and P. sheareri) and nine other Phoebe species among the twenty Phoebe species (Supplementary Figure S2d). This single-locus barcode still fails to differentiate the five endangered Phoebe species. Between the two ycf1-based combinations leading to a successful identification of the target species, ycf1 and rpl32-trnLUAG is more cost-effective than ycf1 combined with Ψycf1-ndhF and rpl32-trnLUAG [46], while retaining the same ISR (Table 1). rpl32-trnLUAG + ycf1 can additionally identify 10 Phoebe species tested in this study (Figure 4a). Furthermore, the amplification rates of ycf1 and rpl32-trnLUAG reached 93.94% and 87.88% (Supplementary Table S3), respectively, exceeding a commonly accepted rate of 70% [47]. This suggests that the combination of ycf1 and rpl32-trnLUAG can serve as a reliable and realistic marker for the future identification of endangered Phoebe species.
The NJ tree analysis confirms the genetic similarity between wood and leaf tissues (Figure 5), which is consistent with previous studies on species such as Lithocarpus [48], Aquilaria [49,50], and Pterocarpus [51]. The experimental findings of our study demonstrate identical sequences in wood and leaf samples from five Phoebe species, amplified by two markers. The genetic consistency observed between leaves and wood arises from their developmental origins, which begin with protoplasts that differentiate into distinct plastids—chloroplasts in leaves and amyloslasts in wood. Despite these functional differences, the plastids retain identical genetic information [52,53]. This genetic uniformity supports the application of molecular markers for species identification and origin verification in both plant and woody tissues, aligning with previous findings in plant biology [25].
Although the information obtained from plant and woody tissues is consistent, extracting DNA from different plant tissues remains challenging. This depends on several factors, including the low proportion of parenchyma cells in wood tissues [1,54,55,56], which are the primary source of DNA. Another factor is the degradation of DNA due to programmed cell death and environmental factors [49,55,57,58]. In this study, DNA was efficiently extracted from modern wood by our pre-treating methods; however, extracting DNA from archeological wood remains difficult [1,59]. Jiao [1] developed a targeted cell DNA extraction method that enables DNA recovery from a wide range of wood sources. This offers a promising approach for extracting DNA from recalcitrant plant tissues, such as those rich in secondary metabolites or stored for long periods. Alternative amplification strategies, such as two-stage PCR [60], have also been suggested to improve the sensitivity and efficiency of detecting DNA in degraded samples. Together, these developments have expanded the toolkit for wood identification and forensic analysis. When combined with the specific primers used in this study, these tools can effectively differentiation Phoebe species.

4. Materials and Methods

4.1. Sampling of Materials

We collected wood and leaf materials from mature trees (20~130 years) of the five Phoebe species in the Sichuan and Zhejiang provinces, southern China (Figure 6). Since trees of the five species are frequently ancient and protected, it is difficult to collect a large amount of wood material from the tree stem. Thus, the majority of wood samples were either from tree cores (using an increment borer) or large branches, which do not visually show any evidence of decay. Heartwood was used when present in wood samples as this is more frequently used for furniture manufacturing than sapwood, while sapwood was only used when heartwood was not available. In total, 33 wood (one for each of the 33 trees) and 5 leaf samples (one per species) were collected from the five species (see details in Supplementary Table S4). While the leaves were stored in a separate Ziplock in a refrigerator at −20 °C, wood materials were air dried at room temperature (~20 °C).

4.2. Candidate Divergent Hotspot Regions

Although we targeted the five aforementioned species, we first acquired 55 plastomes from a total of 20 Phoebe species endemic to China (Supplementary Table S2; 2–6 sequences per species) from the NCBI platform. This approach helps to identify hotspot regions of divergent sequences that can be used to design primers for PCR markers able to distinguish as many of China’s native Phoebe species as possible. Structural features of these plastomes, including GC content, the count of various types of gene, and the length of different regions, were analyzed using OGDRAW software (Draw Organelle Genome Maps) [61]. The inverted repeat (IR) expansion and contraction [62] were detected from one sample per species using the IRscope program (https://irscope.shinyapps.io/irapp/). The candidate divergent hotspot regions were then identified according to the nucleotide diversity (Pi) of the 55 sequences. The Pi values were calculated using a sliding window method using the DnaSP v.5.10.01 software [63], with a window length of 800 sites and a step size of 100 sites. Species-specific primer regions were determined based on these Pi values (see Section 2.2).

4.3. DNA Extraction

DNA was extracted from wood and leaf samples of the five Phoebe species (Section 4.1; Supplementary Table S4). For wood samples, the surface was first removed using razor blades cleaned with 70% (w/w) ethanol. Then, the remaining fresh wood samples were cut into (~0.5 mm) chips, which were ground to a fine powder using the Mixer Mill MM 400 (Retsch, Haan, Germany, two sequential 3 min grinding cycles at 30 Hz). Leaf samples were homogenized using Precellys Evolution (Bertin Technologies, Montigny-le-Bretonneux, France) with ceramic beads (3 mm diameter). The total DNA of these samples was extracted using the Dneasy Plant Mini Kit (Qiagen, Hilden, Germany) [47,64].

4.4. PCR Amplification and Sequencing

To verify the usefulness of the candidate hotspot regions (see Section 2.2) for practical species identification, we chose the rpl32-trnLUAG and ycf1 primers (their combination is efficient for differentiation of the five Phoebe species) for PCR amplification in 33 samples. PCR amplification was performed in a 20 μL reaction volume, with 2 μL of template DNA (i.e., total DNA) extracted from each sample, 10 μL of 2× Phanta Max Master Mix (Contains Mg2+) (Vazyme, Nanjing, China), 0.4 μL of each designed primer (Table 2), and 7.2 µL of ddH2O (double distilled water). The mixture was subjected to amplification using a Biometra Trio48 thermal cycler Analytik Jena AG, Jena, Germany) using the following protocol: one cycle of initial denaturation for 2 min at 98 °C; followed by 35 cycles of denaturation for 10 s at 98 °C, annealing for 15 s at 57 °C, and an extension step for 30 s at 72 °C; then, it continued in a final cycle of extension for 5 min at 72 °C. Each PCR reaction underwent separation using 1.5% agarose gels, followed by staining with ethidium bromide and examination under ultraviolet light [65]. All PCR products were sequenced in both directions at the Sangon Biotech (Shanghai, China) Co., Ltd.
The forward and reverse sequences were assembled into single contigs using SeqMan version 7.0.0 (DNASTAR, Madison, WI, USA). To confirm the absence of contamination, all sequences were validated via the BLAST analysis platform. Refs. [66,67] against the NCBI nucleotide database. Sequence alignments for each genetic marker were conducted using MEGA7 [68], followed by manual inspection and trimming to generate final sequence matrices.

4.5. Analysis of Phylogeny

We further analyzed the phylogenetic relationships among the 20 Phoebe species, including 55 sequences obtained from NCBI. We first compiled sequence matrices for the four single candidate barcodes (see Results) and their combinations. Distance matrices were subsequently calculated using the “ape” R package (version 5.8-1) [69], using the default method described by Kimura (1980) [70]. Finally, neighbor-joining (NJ) trees were constructed using the “bionj” function in “ape” R package. We similarly used this method to build a family tree for new sequences generated from 38 wood and leaf samples of P. bournei, P. chekiangensis, P. hui, P. sheareri, and P. zhennan (see Section 2.3); additionally, Machilus yunnanensis downloaded from the NCBI Nucleotide database (Accession number: NC_028073) was selected as the outgroup.

5. Conclusions

This study aimed to investigate the potential of barcoding for identifying the five endangered Phoebe species in China, including P. bournei, P. chekiangensis, P. hui, P. sheareri, and P. zhennan. Although the DNA structures are highly similar, we found that combinations of Ψycf1-ndhF and rpl32-trnLUAG and ycf1 can differentiate the five target as well as ten other species in the Phoebe genus, with the same ISR of 70.91%. We also validated the robustness of the ycf1 and rpl32-trnLUAG combination using wood and leaf samples of the five target species collected from multiple sites in China, indicating that the two loci are stable between plant organs and across populations. The other theoretical combination, despite not being tested using newly measured data, may also be used as a reliable barcode. However, this three-locus barcode did not substantially improve the species resolution and is more labor- and cost-intensive than the two-locus barcode. The DNA barcoding technique bridges a critical gap in the quick and accurate identification of Phoebe species in future plant protection and wood trade. Specific barcoding for other Phoebe species still requires future investigation.

Supplementary Materials

The following supporting information can be downloaded at https://www.mdpi.com/article/10.3390/plants14182895/s1. Supplementary Material S1: Figure S1: Gene maps of plastomes of 20 species of Phoebe. Figure S2: Neighbor-joining (NJ) trees based on multi loci. Figure S3: Neighbor-joining (NJ) trees based on multi loci: (a) P + F + R (b) P + F + Y (c) P + R + Y (d) P + F + R + Y. P: petA-psbJ-psbL-psbF-psbE; F: Ψycf1-ndhF; R:rpl32-trnLUAG; Y:ycf1. Table S1: Summary of Phoebe species included in two lists. Table S2: Characteristic of chloroplast genomes of Phoebe. Table S3: The 33 samples used to test primer (rpl32-trnLUAG, ycf1) universality. Table S4: Samples source information. Supplementary Material S2: Sequence identity plots among 55 Phoebe species.

Author Contributions

Conceptualization, C.D., W.Z. and M.Z.; Data curation, W.Y.; Formal analysis, W.Y. and W.W.; Funding acquisition, M.Z. and X.Z.; Investigation, W.Y.; Methodology, C.D. and W.Z.; Project administration, C.D., W.Z. and M.Z.; Resources, W.Y., C.F. and X.X.; Visualization, W.W., J.Z. and F.Y.; Writing—original draft, W.Y.; Writing—review and editing, M.Z., X.Z. and W.W. All authors have read and agreed to the published version of the manuscript.

Funding

This research was funded by the Key Research and Development Program of Zhejiang Province [2024C03258], research projects of the General Administration of Customs the People’s Republic of China [2022HK124], Zhejiang Provincial Natural Science Foundation of China [LTGC23C160001], the National Key Research and Development Program of China [2017YFF0210304], and the Zhejiang Provincial Science and Technology Program [2022SJ052].

Data Availability Statement

The original contributions presented in this study are included in the article/Supplementary Materials. Further inquiries can be directed to the corresponding authors.

Acknowledgments

We are grateful to the Jinqiu Qi of Sichuan Agricultural University and Yanming Wang of Kaihua County Forestry Development Co., Ltd. for their help with collecting samples.

Conflicts of Interest

The authors declare no conflicts of interest.

References

  1. Jiao, L.; Lu, Y.; Zhang, M.; Chen, Y.; Wang, Z.; Guo, Y.; Xu, C.; Guo, J.; He, T.; Ma, L.; et al. Ancient Plastid Genomes Solve the Tree Species Mystery of the Imperial Wood “Nanmu” in the Forbidden City, the Largest Existing Wooden Palace Complex in the World. Plants People Planet 2022, 4, 696–709. [Google Scholar] [CrossRef]
  2. Ding, X.; Xiao, J.H.; Li, L.; Conran, J.G.; Li, J. Congruent Species Delimitation of Two Controversial Gold-thread Nanmu Tree Species Based on Morphological and Restriction Site-associated DNA Sequencing Data. J. Syst. Evol. 2019, 57, 234–246. [Google Scholar] [CrossRef]
  3. Lan, Y. Imperial Wood Procurement in Ming and Qing Dynasties. Hist. Res. 1994, 6, 86–98. [Google Scholar]
  4. IUCN, The Iucn Red List of Threatened Species. Version 2023-1. 2023. Available online: https://www.iucnredlist.org (accessed on 27 March 2024).
  5. National Forestry and Grassland Administration, List of National Key Protected Wild Plants in China. 2021. Available online: https://www.forestry.gov.cn/c/www/gkml/11057.jhtml (accessed on 27 March 2024).
  6. Liu, J.; Lindenmayer, D.B.; Yang, W.; Ren, Y.; Campbell, M.J.; Wu, C.; Luo, Y.; Zhong, L.; Yu, M. Diversity and Density Patterns of Large Old Trees in China. Sci. Total Environ. 2019, 655, 255–262. [Google Scholar] [CrossRef]
  7. Liu, Z.F.; Ci, X.Q.; Li, L.; Li, H.-W.; Conran, J.G.; Li, J. DNA Barcoding Evaluation and Implications for Phylogenetic Relationships in Lauraceae from China. PLoS ONE 2017, 12, e0175788. [Google Scholar] [CrossRef]
  8. Liu, Z.F.; Ma, H.; Ci, X.Q.; Li, L.; Song, Y.; Liu, B.; Li, H.W.; Wang, S.L.; Qu, X.J.; Hu, J.L.; et al. Can Plastid Genome Sequencing Be Used for Species Identification in Lauraceae? Bot. J. Linn. Soc. 2021, 197, 1–14. [Google Scholar] [CrossRef]
  9. Yang, S.; Huang, J.; Qu, Y.; Zhang, D.; Tan, Y.; Wen, S.; Song, Y. Phylogenetic Incongruence in an Asiatic Species Complex of the Genus Caryodaphnopsis (Lauraceae). BMC Plant Biol. 2024, 24, 616. [Google Scholar] [CrossRef]
  10. Hebert, P.D.N.; Cywinska, A.; Ball, S.L.; deWaard, J.R. Biological Identifications through DNA Barcodes. Proc. R. Soc. Lond. B 2003, 270, 313–321. [Google Scholar] [CrossRef] [PubMed]
  11. Julia, S.; Soepadmo, E.; Yahud, W. Problem in the Generic Delimitation between Alseodaphne, Dehaasia and Nothaphoebe (Lauraceae) in Borneo. Blumea-Biodivers. Evol. Biogeogr. Plants 2009, 54, 192–197. [Google Scholar] [CrossRef]
  12. Li, L.; Li, J.; Rohwer, J.G.; Van Der Werff, H.; Wang, Z.; Li, H. Molecular Phylogenetic Analysis of the Persea Group (Lauraceae) and Its Biogeographic Implications on the Evolution of Tropical and Subtropical Amphi-pacific Disjunctions. Am. J. Bot. 2011, 98, 1520–1536. [Google Scholar] [CrossRef] [PubMed]
  13. Song, Y.; Yu, W.; Tan, Y.; Jin, J.; Wang, B.; Yang, J.; Liu, B.; Corlett, R.T. Plastid Phylogenomics Improve Phylogenetic Resolution in the Lauraceae. J. Syst. Evol. 2020, 58, 423–439. [Google Scholar] [CrossRef]
  14. Van Der Werff, H.; Richter, H.G. Toward an Improved Classification of Lauraceae. Ann. Mo. Bot. Gard. 1996, 83, 409. [Google Scholar] [CrossRef]
  15. Xu, B.; Zhu, T.; Li, J.; Liu, S. Identification of Wood between Phoebe Zhennan and Machilus Pingii Using the Gas Chromatography-Mass Spectrometry Direct Injection Technique. Eur. J. Mass. Spectrom. 2013, 19, 187–193. [Google Scholar] [CrossRef]
  16. Li, Y.; Xu, W.; Zou, W.; Jiang, D.; Liu, X. Complete Chloroplast Genome Sequences of Two Endangered Phoebe (Lauraceae) Species. Bot. Stud. 2017, 58, 37. [Google Scholar] [CrossRef]
  17. Liu, C.; Chen, H.H.; Tang, L.Z.; Khine, P.K.; Han, L.H.; Song, Y.; Tan, Y.H. Plastid Genome Evolution of a Monophyletic Group in the Subtribe Lauriineae (Laureae, Lauraceae). Plant Divers. 2022, 44, 377–388. [Google Scholar] [CrossRef] [PubMed]
  18. Shi, W.; Song, W.; Chen, Z.; Cai, H.; Gong, Q.; Liu, J.; Shi, C.; Wang, S. Comparative Chloroplast Genome Analyses of Diverse Phoebe (Lauraceae) Species Endemic to China Provide Insight into Their Phylogeographical Origin. PeerJ 2023, 11, e14573. [Google Scholar] [CrossRef] [PubMed]
  19. Song, Y.; Yao, X.; Tan, Y.; Gan, Y.; Yang, J.; Corlett, R.T. Comparative Analysis of Complete Chloroplast Genome Sequences of Two Subtropical Trees, Phoebe Sheareri and Phoebe Omeiensis (Lauraceae). Tree Genet. Genomes 2017, 13, 120. [Google Scholar] [CrossRef]
  20. Liu, B.; Yang, Y.; Ferguson, D.K. Phylogeny and Taxonomy of Cinnamomum (Lauraceae). Ecol. Evol. 2022, 12, e9378. [Google Scholar] [CrossRef]
  21. Cai, C.; Ma, H.; Ci, X.; Conran, J.G.; Li, J. Comparative Phylogenetic Analyses of Chinese Horsfieldia (Myristicaceae) Using Complete Chloroplast Genome Sequences. J. Syst. Evol. 2021, 59, 504–514. [Google Scholar] [CrossRef]
  22. Tian, Y.; Zhou, J.; Zhang, Y.; Wang, S.; Wang, Y.; Liu, H.; Wang, Z. Research Progress in Plant Molecular Systematics of Lauraceae. Biology 2021, 10, 391. [Google Scholar] [CrossRef]
  23. Xiong, Y.; Xiong, Y.; Jia, S.; Ma, X. The Complete Chloroplast Genome Sequencing and Comparative Analysis of Reed Canary Grass (Phalaris arundinacea) and Hardinggrass (P. aquatica). Plants 2020, 9, 748. [Google Scholar] [CrossRef]
  24. Li, X.; Yang, Y.; Henry, R.J.; Rossetto, M.; Wang, Y.; Chen, S. Plant DNA Barcoding: From Gene to Genome. Biol. Rev. 2015, 90, 157–166. [Google Scholar] [CrossRef]
  25. Lowe, A.J.; Cross, H.B. The Application of DNA Methods to Timber Tracking and Origin Verificat Ion. IAWA J. 2011, 32, 251–262. [Google Scholar] [CrossRef]
  26. Hajibabaei, M.; Janzen, D.H.; Burns, J.M.; Hallwachs, W.; Hebert, P.D.N. DNA Barcodes Distinguish Species of Tropical Lepidoptera. Proc. Natl. Acad. Sci. USA 2006, 103, 968–971. [Google Scholar] [CrossRef]
  27. Hu, J.; Ci, X.; Liu, Z.; Dormontt, E.E.; Conran, J.G.; Lowe, A.J.; Li, J. Assessing Candidate DNA Barcodes for Chinese and Internationally Traded Timber Species. Mol. Ecol. Resour. 2022, 22, 1478–1492. [Google Scholar] [CrossRef]
  28. Lendvay, B.; Hartmann, M.; Brodbeck, S.; Nievergelt, D.; Reinig, F.; Zoller, S.; Parducci, L.; Gugerli, F.; Büntgen, U.; Sperisen, C. Improved Recovery of Ancient DNA from Subfossil Wood—Application to the World’s Oldest Late Glacial Pine Forest. New Phytol. 2018, 217, 1737–1748. [Google Scholar] [CrossRef]
  29. Chen, Z.; Gao, L.; Wang, H.; Feng, S. Molecular Identification and Phylogenetic Analysis of Cymbidium Species (Orchidaceae) Based on the Potential DNA Barcodes matK, rbcL, psbA-trnH, and Internal Transcribed Spacer. Agronomy 2024, 14, 933. [Google Scholar] [CrossRef]
  30. China Plant BOL Group; Li, D.Z.; Gao, L.M.; Wang, H.; Ge, X.J.; Liu, J.Q.; Chen, Z.D.; Zhou, S.L.; Chen, S.L.; Yang, J.B.; et al. Comparative Analysis of a Large Dataset Indicates That Internal Transcribed Spacer (ITS) Should Be Incorporated into the Core Barcode for Seed Plants. Proc. Natl. Acad. Sci. USA 2011, 108, 19641–19646. [Google Scholar] [CrossRef] [PubMed]
  31. Du, Z.; Qimike, A.; Yang, C.; Chen, J.; Wang, Q. Testing Four Barcoding Markers for Species Identification of Potamogetonaceae. J. Syst. Evol. 2011, 49, 246–251. [Google Scholar] [CrossRef]
  32. Fu, Y.; Jiang, W.; Fu, C. Identification of Species within Tetrastigma (Miq.) Planch. (Vitaceae) Based on DNA Barcoding Techniques. J. Syst. Evol. 2011, 49, 237–245. [Google Scholar] [CrossRef]
  33. Li, L.; Li, J.; Li, X.W. Taxonomic Revision of Five Species of the Genus Phoebe (Lauraceae) from China. Plant Divers. 2011, 33, 157–160. [Google Scholar]
  34. Xu, J.; Zhang, H.; Yang, F.; Zhu, W.; Li, Q.; Cao, Z.; Song, Y.; Xin, P. Phylogeny of Camphora and Cinnamomum (Lauraceae) Based on Plastome and Nuclear Ribosomal DNA Data. Int. J. Mol. Sci. 2025, 26, 1370. [Google Scholar] [CrossRef] [PubMed]
  35. Chen, S.; Yao, H.; Han, J.; Liu, C.; Song, J.; Shi, L.; Zhu, Y.; Ma, X.; Gao, T.; Pang, X.; et al. Validation of the ITS2 Region as a Novel DNA Barcode for Identifying Medicinal Plant Species. PLoS ONE 2010, 5, e8613. [Google Scholar] [CrossRef] [PubMed]
  36. Ford, C.S.; Ayres, K.L.; Toomey, N.; Haider, N.; Van Alphen Stahl, J.; Kelly, L.J.; Wikström, N.; Hollingsworth, P.M.; Duff, R.J.; Hoot, S.B.; et al. Selection of Candidate Coding DNA Barcoding Regions for Use on Land Plants. Bot. J. Linn. Soc. 2009, 159, 1–11. [Google Scholar] [CrossRef]
  37. Hernández-León, S.; Gernandt, D.S.; Pérez De La Rosa, J.A.; Jardón-Barbolla, L. Phylogenetic Relationships and Species Delimitation in Pinus Section Trifoliae Inferrred from Plastid DNA. PLoS ONE 2013, 8, e70501. [Google Scholar] [CrossRef]
  38. Kress, W.J.; Wurdack, K.J.; Zimmer, E.A.; Weigt, L.A.; Janzen, D.H. Use of DNA Barcodes to Identify Flowering Plants. Proc. Natl. Acad. Sci. USA 2005, 102, 8369–8374. [Google Scholar] [CrossRef]
  39. Kress, W.J.; Erickson, D.L.; Jones, F.A.; Swenson, N.G.; Perez, R.; Sanjur, O.; Bermingham, E. Plant DNA Barcodes and a Community Phylogeny of a Tropical Forest Dynamics Plot in Panama. Proc. Natl. Acad. Sci. USA 2009, 106, 18621–18626. [Google Scholar] [CrossRef] [PubMed]
  40. Little, D.P.; Knopf, P.; Schulz, C. DNA Barcode Identification of Podocarpaceae—The Second Largest Conifer Family. PLoS ONE 2013, 8, e81008. [Google Scholar] [CrossRef]
  41. Pang, X.; Liu, C.; Shi, L.; Liu, R.; Liang, D.; Li, H.; Cherny, S.S.; Chen, S. Utility of the trnHpsbA Intergenic Spacer Region and Its Combinations as Plant DNA Barcodes: A Meta-Analysis. PLoS ONE 2012, 7, e48833. [Google Scholar] [CrossRef]
  42. Yao, H.; Song, J.; Liu, C.; Luo, K.; Han, J.; Li, Y.; Pang, X.; Xu, H.; Zhu, Y.; Xiao, P.; et al. Use of ITS2 Region as the Universal DNA Barcode for Plants and Animals. PLoS ONE 2010, 5, e13102. [Google Scholar] [CrossRef]
  43. Zhang, C.; Wang, F.; Yan, H.; Hao, G.; Hu, C.; Ge, X. Testing DNA Barcoding in Closely Related Groups of Lysimachia L. (Myrsinaceae). Mol. Ecol. Resour. 2012, 12, 98–108. [Google Scholar] [CrossRef] [PubMed]
  44. Wang, X.C.; Liu, C.; Huang, L.; Bengtsson-Palme, J.; Chen, H.; Zhang, J.H.; Cai, D.; Li, J.Q. ITS1: A DNA Barcode Better than ITS2 in Eukaryotes? Mol. Ecol. Resour. 2015, 15, 573–586. [Google Scholar] [CrossRef] [PubMed]
  45. Dong, W.; Cheng, T.; Li, C.; Xu, C.; Long, P.; Chen, C.; Zhou, S. Discriminating Plants Using the DNA Barcode rbcLb: An Appraisal Based on a Large Data Set. Mol. Ecol. Resour. 2014, 14, 336–343. [Google Scholar] [CrossRef]
  46. Group, C.P.W. A DNA Barcode for Land Plants. Proc. Natl. Acad. Sci. USA 2009, 106, 12794–12797. [Google Scholar] [CrossRef]
  47. Yu, M.; Jiao, L.; Guo, J.; Wiedenhoeft, A.C.; He, T.; Jiang, X.; Yin, Y. DNA Barcoding of Vouchered Xylarium Wood Specimens of Nine Endangered Dalbergia Species. Planta 2017, 246, 1165–1176. [Google Scholar] [CrossRef]
  48. Cannon, C.H.; Manos, P.S. Phylogeography of the Southeast Asian Stone Oaks (Lithocarpus). J. Biogeogr. 2003, 30, 211–226. [Google Scholar] [CrossRef]
  49. Jiao, L.; Yin, Y.; Cheng, Y.; Jiang, X. DNA Barcoding for Identification of the Endangered Species Aquilaria Sinensis: Comparison of Data from Heated or Aged Wood Samples. Holzforschung 2014, 68, 487–494. [Google Scholar] [CrossRef]
  50. Tanaka, S.; Ito, M. DNA Barcoding for Identification of Agarwood Source Species Using trnL-trnF and matK DNA Sequences. J. Nat. Med. 2020, 74, 42–50. [Google Scholar] [CrossRef]
  51. Jiao, L.; Yu, M.; Wiedenhoeft, A.C.; He, T.; Li, J.; Liu, B.; Jiang, X.; Yin, Y. DNA Barcode Authentication and Library Development for the Wood of Six Commercial Pterocarpus Species: The Critical Role of Xylarium Specimens. Sci. Rep. 2018, 8, 1945. [Google Scholar] [CrossRef]
  52. Ohyama, M.; Baba, K.; Itoh, T. Wood Identification of Japanese Cyclobalanopsis Species (Fagaceae) Based on DNA Polymorphism of the Intergenic Spacer between trnT and trnL 5′ Exon. J. Wood Sci. 2001, 47, 81–86. [Google Scholar] [CrossRef]
  53. Pizzolato, T.D. A Tannic Acid-Ferric Chloride-Toluidine Blue Stain for Wood Amyloplasts Embedded in Epoxy Resin. For. Sci. 1978, 24, 49–51. [Google Scholar]
  54. Deguilloux, M.; Pemonge, M.; Petit, R. Novel Perspectives in Wood Certification and Forensics: Dry Wood as a Source of DNA. Proc. R. Soc. Lond. B 2002, 269, 1039–1046. [Google Scholar] [CrossRef]
  55. Jiao, L.; Lu, Y.; He, T.; Guo, J.; Yin, Y. DNA Barcoding for Wood Identification: Global Review of the Last Decade and Future Perspective. IAWA J. 2020, 41, 620–643. [Google Scholar] [CrossRef]
  56. Winter, H.; Robinson, D.G.; Heldt, H.W. Subcellular Volumes and Metabolite Concentrations in Spinach Leaves. Planta 1994, 193, 530–535. [Google Scholar] [CrossRef]
  57. Abe, H.; Watanabe, U.; Yoshida, K.; Kuroda, K.; Zhang, C. Changes in Organelle and DNA Quality, Quantity, and Distribution in the Wood of Cryptomeria Japonica over Long-Term Storage. IAWA J. 2011, 32, 263–272. [Google Scholar] [CrossRef]
  58. Jiao, L.; Yin, Y.; Xiao, F.; Sun, Q.; Song, K.; Jiang, X. Comparative Analysis of Two DNA Extraction Protocols from Fresh and Dried Wood of Cunninghamia Lanceolata (Taxodiaceae). IAWA J. 2012, 33, 441–456. [Google Scholar] [CrossRef]
  59. Lu, Y.; Jiao, L.; Sun, G.; Wang, J.; Liu, S.; Li, R.; Zhang, Y.; Guo, Y.; Guo, J.; Jiang, X.; et al. Preservation Status and Microbial Community of Waterlogged Archaeological Woods over 7800 Years Old at the Jingtoushan Site, China. Wood Sci. Technol. 2023, 57, 537–556. [Google Scholar] [CrossRef]
  60. Rogers, S.O.; Kaya, Z. DNA from Ancient Cedar Wood from King Midas’ Tomb, Turkey, and al-Aksa Mosque, Israel. Silvae Genet. 2006, 55, 54–62. [Google Scholar] [CrossRef]
  61. Greiner, S.; Lehwark, P.; Bock, R. OrganellarGenomeDRAW (OGDRAW) Version 1.3.1: Expanded Toolkit for the Graphical Visualization of Organellar Genomes. Nucleic Acids Res. 2019, 47, W59–W64. [Google Scholar] [CrossRef]
  62. Amiryousefi, A.; Hyvönen, J.; Poczai, P. IRscope: An Online Program to Visualize the Junction Sites of Chloroplast Genomes. Bioinformatics 2018, 34, 3030–3031. [Google Scholar] [CrossRef] [PubMed]
  63. Librado, P.; Rozas, J. DnaSP v5: A Software for Comprehensive Analysis of DNA Polymorphism Data. Bioinformatics 2009, 25, 1451–1452. [Google Scholar] [CrossRef]
  64. Lee, S.Y.; Ng, W.L.; Mahat, M.N.; Nazre, M.; Mohamed, R. DNA Barcoding of the Endangered Aquilaria (Thymelaeaceae) and Its Application in Species Authentication of Agarwood Products Traded in the Market. PLoS ONE 2016, 11, e0154631. [Google Scholar] [CrossRef]
  65. Rachmayanti, Y.; Leinemann, L.; Gailing, O.; Finkeldey, R. Extraction, Amplification and Characterization of Wood DNA from Dipterocarpaceae. Plant Mol. Biol. Rep. 2006, 24, 45–55. [Google Scholar] [CrossRef]
  66. Altschul, S.F.; Gish, W.; Miller, W.; Myers, E.W.; Lipman, D.J. Basic Local Alignment Search Tool. J. Mol. Biol. 1990, 215, 403–410. [Google Scholar] [CrossRef]
  67. Camacho, C.; Boratyn, G.M.; Joukov, V.; Vera Alvarez, R.; Madden, T.L. ElasticBLAST: Accelerating Sequence Search via Cloud Computing. BMC Bioinform. 2023, 24, 117. [Google Scholar] [CrossRef] [PubMed]
  68. Kumar, S.; Stecher, G.; Tamura, K. MEGA7: Molecular Evolutionary Genetics Analysis Version 7.0 for Bigger Datasets. Mol. Biol. Evol. 2016, 33, 1870–1874. [Google Scholar] [CrossRef] [PubMed]
  69. Paradis, E.; Claude, J.; Strimmer, K. APE: Analyses of Phylogenetics and Evolution in R Language. Bioinformatics 2004, 20, 289–290. [Google Scholar] [CrossRef] [PubMed]
  70. Kimura, M. A Simple Method for Estimating Evolutionary Rates of Base Substitutions through Comparative Studies of Nucleotide Sequences. J. Mol. Evol. 1980, 16, 111–120. [Google Scholar] [CrossRef]
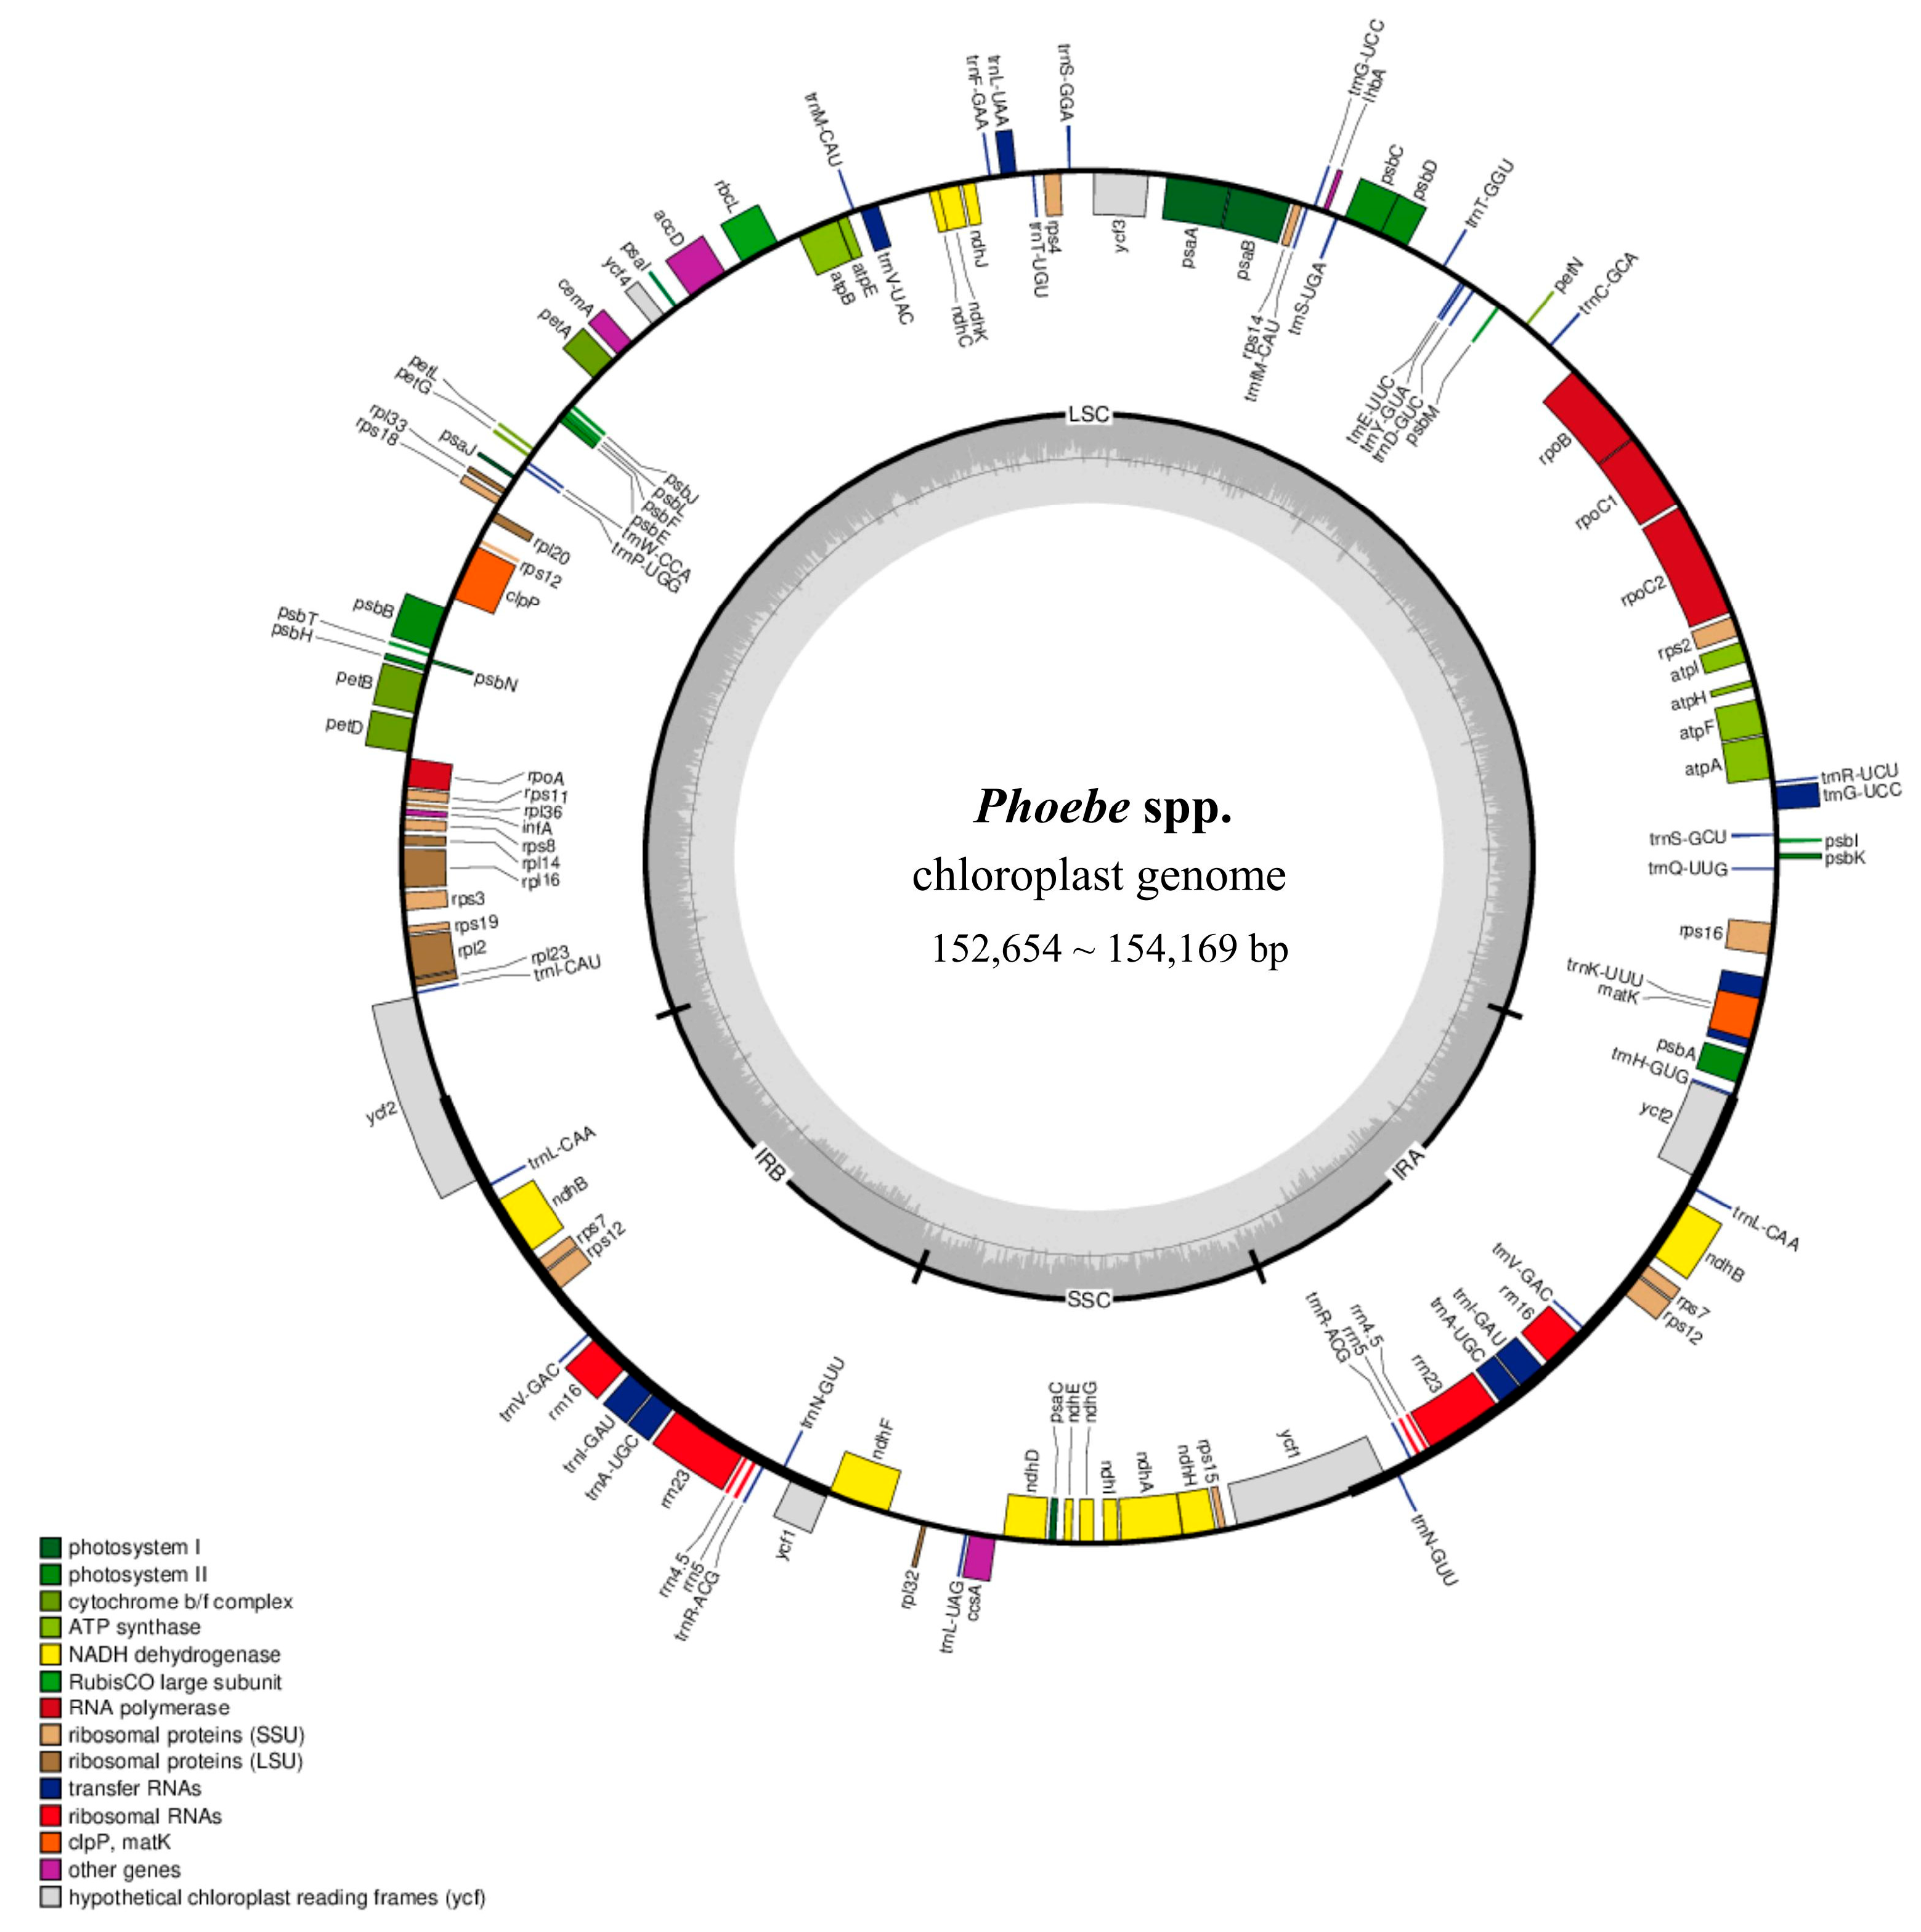
Figure 1. Gene maps based on the chloroplast genomes of 20 Phoebe species. The quadripartite structure comprises the large single copy (LSC), small single copy (SSC), and two inverted repeat (IRA and IRB) regions. Genes are shown in different colors at the outer ring according to functional groups, with clockwise-transcribed genes outsides and counterclockwise-transcribed genes insides. GC content is shown in darker gray shade while AT content is lighter at the inner ring.
Plants 14 02895 g001
Figure 2. Comparison of the inverted repeat/single copy in the chloroplast genomes of 20 Phoebe species. SSC: short single copy; LSC: large single copy.
Plants 14 02895 g002
Figure 3. Nucleotide diversity (Pi) of chloroplast genomes in the 20 Phoebe species. The black and red dashed lines represent the Pi values of 0.001 and 0.005, respectively.
Plants 14 02895 g003
Figure 4. Neighbor-joining (NJ) trees based on multi loci: (a) rpl32-trnLUAG + ycf1 (b) Ψycf1-ndhF + rpl32-trnLUAG + ycf1.
Plants 14 02895 g004aPlants 14 02895 g004b
Figure 5. The NJ tree of the Phoebe-specific barcode-tested datasets based on rpl32-trnLUAG + ycf1, rooted with Machilus yunnanensis. The same colors represent the same species with more than one individual, PB: P. bournei, PC: P. chekiangensis, PH: P. hui, PS: P. sheareri, PZ: P. zhennan; the leaf samples are indicated by “_leaf”, and other samples are from wood.
Plants 14 02895 g005
Figure 6. Sampling sites and leaf of five Phoebe species. Colored points indicate the location of samples and shaded areas show province-level distribution of corresponding species according to IPLANT (https://www.iplant.cn/).
Plants 14 02895 g006
Table 1. Intra- and inter-specific genetic distance (Material and Methods) and identification success rate (ISR) for the four candidate loci and their combinations. Min. and Max. represent minimum and maximum distances, respectively. P: petA-psbJ-psbL-psbF-psbE; F: Ψycf1-ndhF; R: rpl32-trnLUAG; Y: ycf1.
DNA BarcodesIntraspecific DistanceInterspecific DistanceISR
MinMaxMeanMinMaxMean
P0.0000 0.0083 0.0011 0.0000 0.0077 0.0007 16.36%
R0.0000 0.0000 0.0000 0.0000 0.0109 0.0015 40.00%
Y0.0000 0.0010 0.0002 0.0000 0.0106 0.0012 56.36%
F0.0000 0.0030 0.0005 0.0000 0.0089 0.0013 67.27%
P + R0.0000 0.0045 0.0006 0.0000 0.0102 0.0014 50.91%
P + Y0.0000 0.0042 0.0007 0.0000 0.0096 0.0014 69.09%
P + F0.0000 0.0048 0.0007 0.0000 0.0075 0.0009 49.09%
R + Y0.0000 0.0005 0.0001 0.0000 0.0112 0.0015 70.91%
F + R0.0000 0.0006 0.0001 0.0000 0.0087 0.0011 49.09%
F + Y0.0000 0.0011 0.0002 0.0000 0.0091 0.0010 56.36%
P + R + Y0.0000 0.0029 0.0005 0.0000 0.0110 0.0016 78.18%
P + F + R0.0000 0.0032 0.0005 0.0000 0.0094 0.0013 65.45%
P + F + Y0.0000 0.0031 0.0005 0.0000 0.0090 0.0012 63.64%
F + R + Y0.0000 0.0007 0.0001 0.0000 0.0097 0.0013 70.91%
P + F + R + Y0.0000 0.0023 0.0004 0.0000 0.0102 0.0014 78.18%
Table 2. Phoebe primers used for amplification.
Phoebe PrimersTypePrimer Sequences (5′–3′)
rpl32-trnLUAGForwardGCGAGATGGGGGTTGTAACT
ReverseAGTATCATGGCAGGGGGTCA
ycf1ForwardTGACCCCTTAACCAGTTTTTCCA
ReverseCTGAAACCCTGGCGCAAATC
Disclaimer/Publisher’s Note: The statements, opinions and data contained in all publications are solely those of the individual author(s) and contributor(s) and not of MDPI and/or the editor(s). MDPI and/or the editor(s) disclaim responsibility for any injury to people or property resulting from any ideas, methods, instructions or products referred to in the content.