Article

Group 1 LEA Proteins in Durum Wheat: Evolution, Expression, and Roles in Abiotic Stress Tolerance

Biotechnology and Plant Improvement Laboratory, Centre of Biotechnology of Sfax, P.O. Box 1177, Sfax 3018, Tunisia
*
Authors to whom correspondence should be addressed.
Plants 2025, 14(18), 2817; https://doi.org/10.3390/plants14182817
Submission received: 24 June 2025 / Revised: 9 August 2025 / Accepted: 21 August 2025 / Published: 9 September 2025
(This article belongs to the Special Issue Applications of Bioinformatics in Plant Science)

Abstract

Group 1 LEA proteins are involved in embryo water dynamics during the maturation stage of seed development and contribute to desiccation stress protection in vegetative and embryonic tissues. Nevertheless, their roles in durum wheat remain largely unexplored. This study represents the first comprehensive survey of group 1 LEA proteins and their encoding genes in Triticum turgidum ssp. Durum (durum wheat). Eight group 1 LEA (TtEM1 to TtEM8) genes were identified in the durum wheat genome, which were named according to their chromosomal location. Analyses of the physiochemical characteristics and subcellular location revealed that all TtEM proteins exhibited a highly disordered structure (more than 90% of tendency of disorder) and were located in the nucleus. Evolutionary analysis between the durum wheat family and all other known group 1 LEA proteins from Arabidopsis thaliana, rice (Oryza sativa), barley (Hordeum vulgare), and barrel medic (Medicago truncatula) showed four phylogenetic groups; each group shares the same conserved motifs and gene structure. Interestingly, almost TtEM genes harbor cis-elements related to hormone regulation, stress response, and growth regulation, indicating their function in stress tolerance and developmental control. Subsequently, Expression analysis of two homoeologous genes, TtEM1 and TtEM4, demonstrated that the two genes exhibited distinct expression profiles across different tissues and in response to various stress treatments, suggesting that these genes may be involved in regulating growth, development, and stress adaptation in durum wheat. TtEM1 and TtEM4 purified proteins act as molecular chaperones and protect LDH activity against desiccation, cold, and heat treatments. Moreover, TtEM1 and TtEM4 genes were proved to enhance heat, cold, oxidative, and drought tolerance in yeast. These results clearly described the characteristics and the evolutionary dynamics of the EM gene family in wheat, and unveiled their role in wheat development and response to abiotic stress.

1. Introduction

Durum wheat (Triticum turgidum ssp. durum) is a major food crop, especially in the Mediterranean region, where it is largely produced and exploited [1]. Nevertheless, as sessile organism, Durum wheat is frequently exposed to different stress conditions such as high temperatures, drought, salinity, and cold during its development and its growth, thus impacting global wheat production. To cope with these adverse conditions, plants have developed a variety of molecular and physiological defense mechanisms to survive in hostile environments [2]. LEA (Late Embryogenesis Abundant) proteins are among the crucial stress-responsive proteins [3]. LEA proteins were first identified during the late stages of embryonic development in cotton seeds [4]. They constitute a multifaceted family of small (10–30 kDa) hydrophilic and intrinsically disordered proteins, and they undergo a disorder-to-order structure when interacting with specific molecules or under stress conditions that is considered to be essential for their protective role [5]. This group of proteins was recognized to be involved in abiotic stress tolerance. As demonstrated, LEA proteins play a crucial role in stabilizing membranes by interacting with phospholipids under stress, preserving their structure and maintaining physical membrane integrity [6]. Furthermore, these proteins have been regarded as preventing the inactivation of different enzymes, such as lactate dehydrogenase, malate dehydrogenase, citrate synthase, or catalase, under stress conditions [7]. In addition, some LEA proteins scavenge reactive oxygen species and bind different metal ions, thereby reducing ion toxicity and oxidative damage under stress [8]. Recently, LEA proteins from different organisms have been observed to undergo LLPS (liquid-liquid phase separation) to promote water stress tolerance [9]. According to their conserved motifs, LEA proteins are classified into eight families in the PFAM database: dehydrin, LEA_1, LEA_2, LEA_3, LEA_4, LEA_5, LEA_6, and seed maturation proteins (SMP), corresponding to eight PFAMs (PF00257, PF03760, PF03168, PF03242, PF02987, PF00477, PF10714, and PF04927) [10]. The LEA_5 family members are clearly distinct from other LEA proteins. They are found in organisms from all three domains of life, namely eukarya, archaea, and bacteria, and they are very hydrophilic and highly conserved through the whole length of the proteins [11]. They are also considered with the LEA_2 and LEA_4 families as true LEA proteins, including most members of the protein family [12].
Group1 (LEA_5, Dur-19, Em (Early methionine), PF00477) LEA proteins, were initially identified as major embryonic proteins when poly A RNA was isolated from a dry wheat embryo and translated in vitro in the presence of 35S-methionine [13]. Over 100 Em genes have been characterized in different species, including plants, bacteria, and brine shrimp [14]. In plants, Em genes have been identified in different plant species like Arabidopsis, rice, maize, soybean, black locust, lettuce, papaya, castor bean, cassava, and tigernut [15]. It has been demonstrated that Em proteins contain a conserved 20-amino acid motif (TRKEQ [L/M]G[T/E]EGY[Q/K]EMGRKGG[L/E]) present as tandem repeats from one to four copies in plant species and from one to seven copies in other organisms, Em proteins also present two other conserved regions, an N-terminal sequence and C-terminal sequence [16]. The observation of Em proteins having a high proportion of Gly, Glu, and Gln amino acids, and the absence of tryptophan and cysteine residues offer insight into their disordered structure and their role to mitigate stress damage caused by freezing, desiccation, and osmotic stress [11]. Expression analyses have shown that Em genes are strongly regulated and are mainly induced in mature embryos, as well as in vegetative tissues in response to abscisic acid (ABA) and osmotic stress [17]. In lettuce, the LsEm1 gene was accumulated during the flowering and mature stage, and also in response to cold, salt, dehydration, and ABA in young seedlings [18]. OsEm1gene has been shown to be responsive to different abiotic stresses, such as drought, salinity, cold, and ABA treatment, at vegetative stages in rice [14]. CeLEA5 genes from tigernut exhibit predominant expression in tubers and display a seed desiccation-like accumulation throughout tuber maturation [19]. Evidence from different studies revealed that overexpression of Em genes can enhance tolerance to abiotic stresses. For instance, the expression of OsEm1 in rice enhances tolerance to drought stress [14]. Likewise, overexpression of the Arabidopsis AtEm6 gene improved salt tolerance in transgenic rice cell lines [20]. Additionally, overexpressing LsEm1 in rice enhances drought and salt tolerance by improving stress-related physiological traits and upregulating key genes like OsCDPKs and rab21, reducing yield loss under stress [18]. Given the critical role of Em genes in plants’ abiotic stress resistance, it is necessary to study Em in major crops like wheat. In this study, we identified and characterized eight group 1 LEA genes (TtEM) in durum wheat, distributed across four chromosomes. Using prediction tools, we analyzed their phylogenetic relationships, physicochemical properties, gene structures, conserved motifs, and upstream cis-regulatory elements. Furthermore, we investigated the expression profiles of two representative genes, TtEM1 and TtEM4, across different tissues and under various stress conditions. Their potential function was further evaluated through assays measuring the protection of lactate dehydrogenase (LDH) activity and the enhanced stress tolerance of transformed yeast cells under osmotic, oxidative, and thermal stress conditions. The genome-wide characterization presented here provides a critical resource for engineering resistant wheat cultivars.

2. Results

2.1. Identification and Characterization of TtEM (LEA_5) Genes in Durum Wheat

Based on their IDs from the Pfam protein family database Pfam (PF00477), we identified eight genes encoding group 1 LEA proteins in durum wheat (Triticum turgidum ssp. Durum) and named according to their chromosomal locations (Table S1). The TtEM proteins share three conserved motifs, as shown by protein sequence alignment using ClustalW (Figure S1). A first motif corresponding to the N-terminal part, a second motif corresponding to the C-terminal part, and a third motif of twenty amino acids specific for EM proteins (representing the PF00477 domain) repeated two to three times in tendency. Analysis of the physicochemical properties showed that the LEA proteins studied from group 1 in durum wheat share the same characteristics as LEA proteins (Table 1). In fact, the number of amino acids varies between 93 and 133 aa, and the molecular weight is between 9.9 and 14.6 KDa, indicating a low molecular weight, one of the characteristics of LEA proteins. According to the predicted pI values, which vary between 5.17 and 5.57, these proteins are acidic. The negative grand average of the hydropathy index suggested that TtEM proteins were hydrophilic. LEA proteins are predominantly disordered in the native state and are capable of acquiring secondary structures in the form of an alpha helix, which is shown by the SPOMA prediction tool, from 33 to 45% of predicted α-helical content, and the results obtained by the PONDR prediction tool show that approximately 98–100% of the residues that form these proteins are disordered. Analysis of their subcellular localization shows that all TtEM proteins can be localized in the nucleus, which provides some indications of the function of this group of proteins.

2.2. Chromosome Distribution and Phylogenetic Analysis

The eight TtEM genes are unevenly distributed across four chromosomes: two on chromosome 1A, four on chromosome 1B, only one gene on chromosome 3A, and only one on chromosome 3B (Figure 1A). In order to investigate their evolutionary relationships, a phylogenetic tree was generated with their homologous from barley (Hordeum vulgare), rice (Oryza sativa), Medicago truncatula, and Arabidopsis thaliana (Figure 1B). Their phylogenetic analysis revealed four distinctive groups, with durum wheat genes distributed across them, indicating evolutionary diversity. The fourth clade showed strong phylogenetic between barley and wheat genes, suggesting a common evolutionary history or similar selective pressures, as supported by the bootstrap values. The third clade consisted exclusively of Arabidopsis thaliana and Medicago truncatula genes, indicating greater divergence of the dicotyledons compared with the monocotyledons (represented by durum wheat and barley). The second clade contained only wheat and barley genes, consistent with their classification to the Triticeae tribe. Finally, the first clade demonstrated closer relationships with rice genes, suggesting another evolutionary pathway or conserved functions specific to these genes in durum wheat.

2.3. Gene Structure and Conserved Motif Analyses of EM Genes

In order to gain a better picture about the relationships of the durum wheat EM genes with the other EM genes, the exon–intron structure of TtEM genes was analyzed (Figure 1B). All of the EM genes contained one intron, except for one EM gene (HvEM3 gene), which contained no intron. Additionally, the HvEM3 gene contained one exon, while the remainder of the EM genes had two exons. Generally, the exon–intron structures of EM genes within the same group were similar, supporting their classification and phylogenetic relationships. A total of 10 conserved motifs were obtained from the MEME database (Table 2). Members of the same group had same composition and arrangement of motifs, and some motifs were detected in only one group (Figure 1B). For example, motif 9 and motif 6 were only identified in the fourth group of EM genes. All members contained motif 3. In addition, motif 1, motif 2, and motif 3 were also found in most members. Group 1 displays a highly conserved structure composed of three motifs: motif 2, motif 1, and motif 3. Notably, motif 1 and motif 3 are almost present in all the protein sequences analyzed, suggesting a degree of conservation either within group 1 of LEA proteins or within the LEA protein family. Motif 2 is also found in most of the protein sequences. The similarity in motif composition within each group implies potential function similarity among the proteins in the same group.

2.4. Analysis of Cis-Acting Elements in Promoters of TtEM Genes

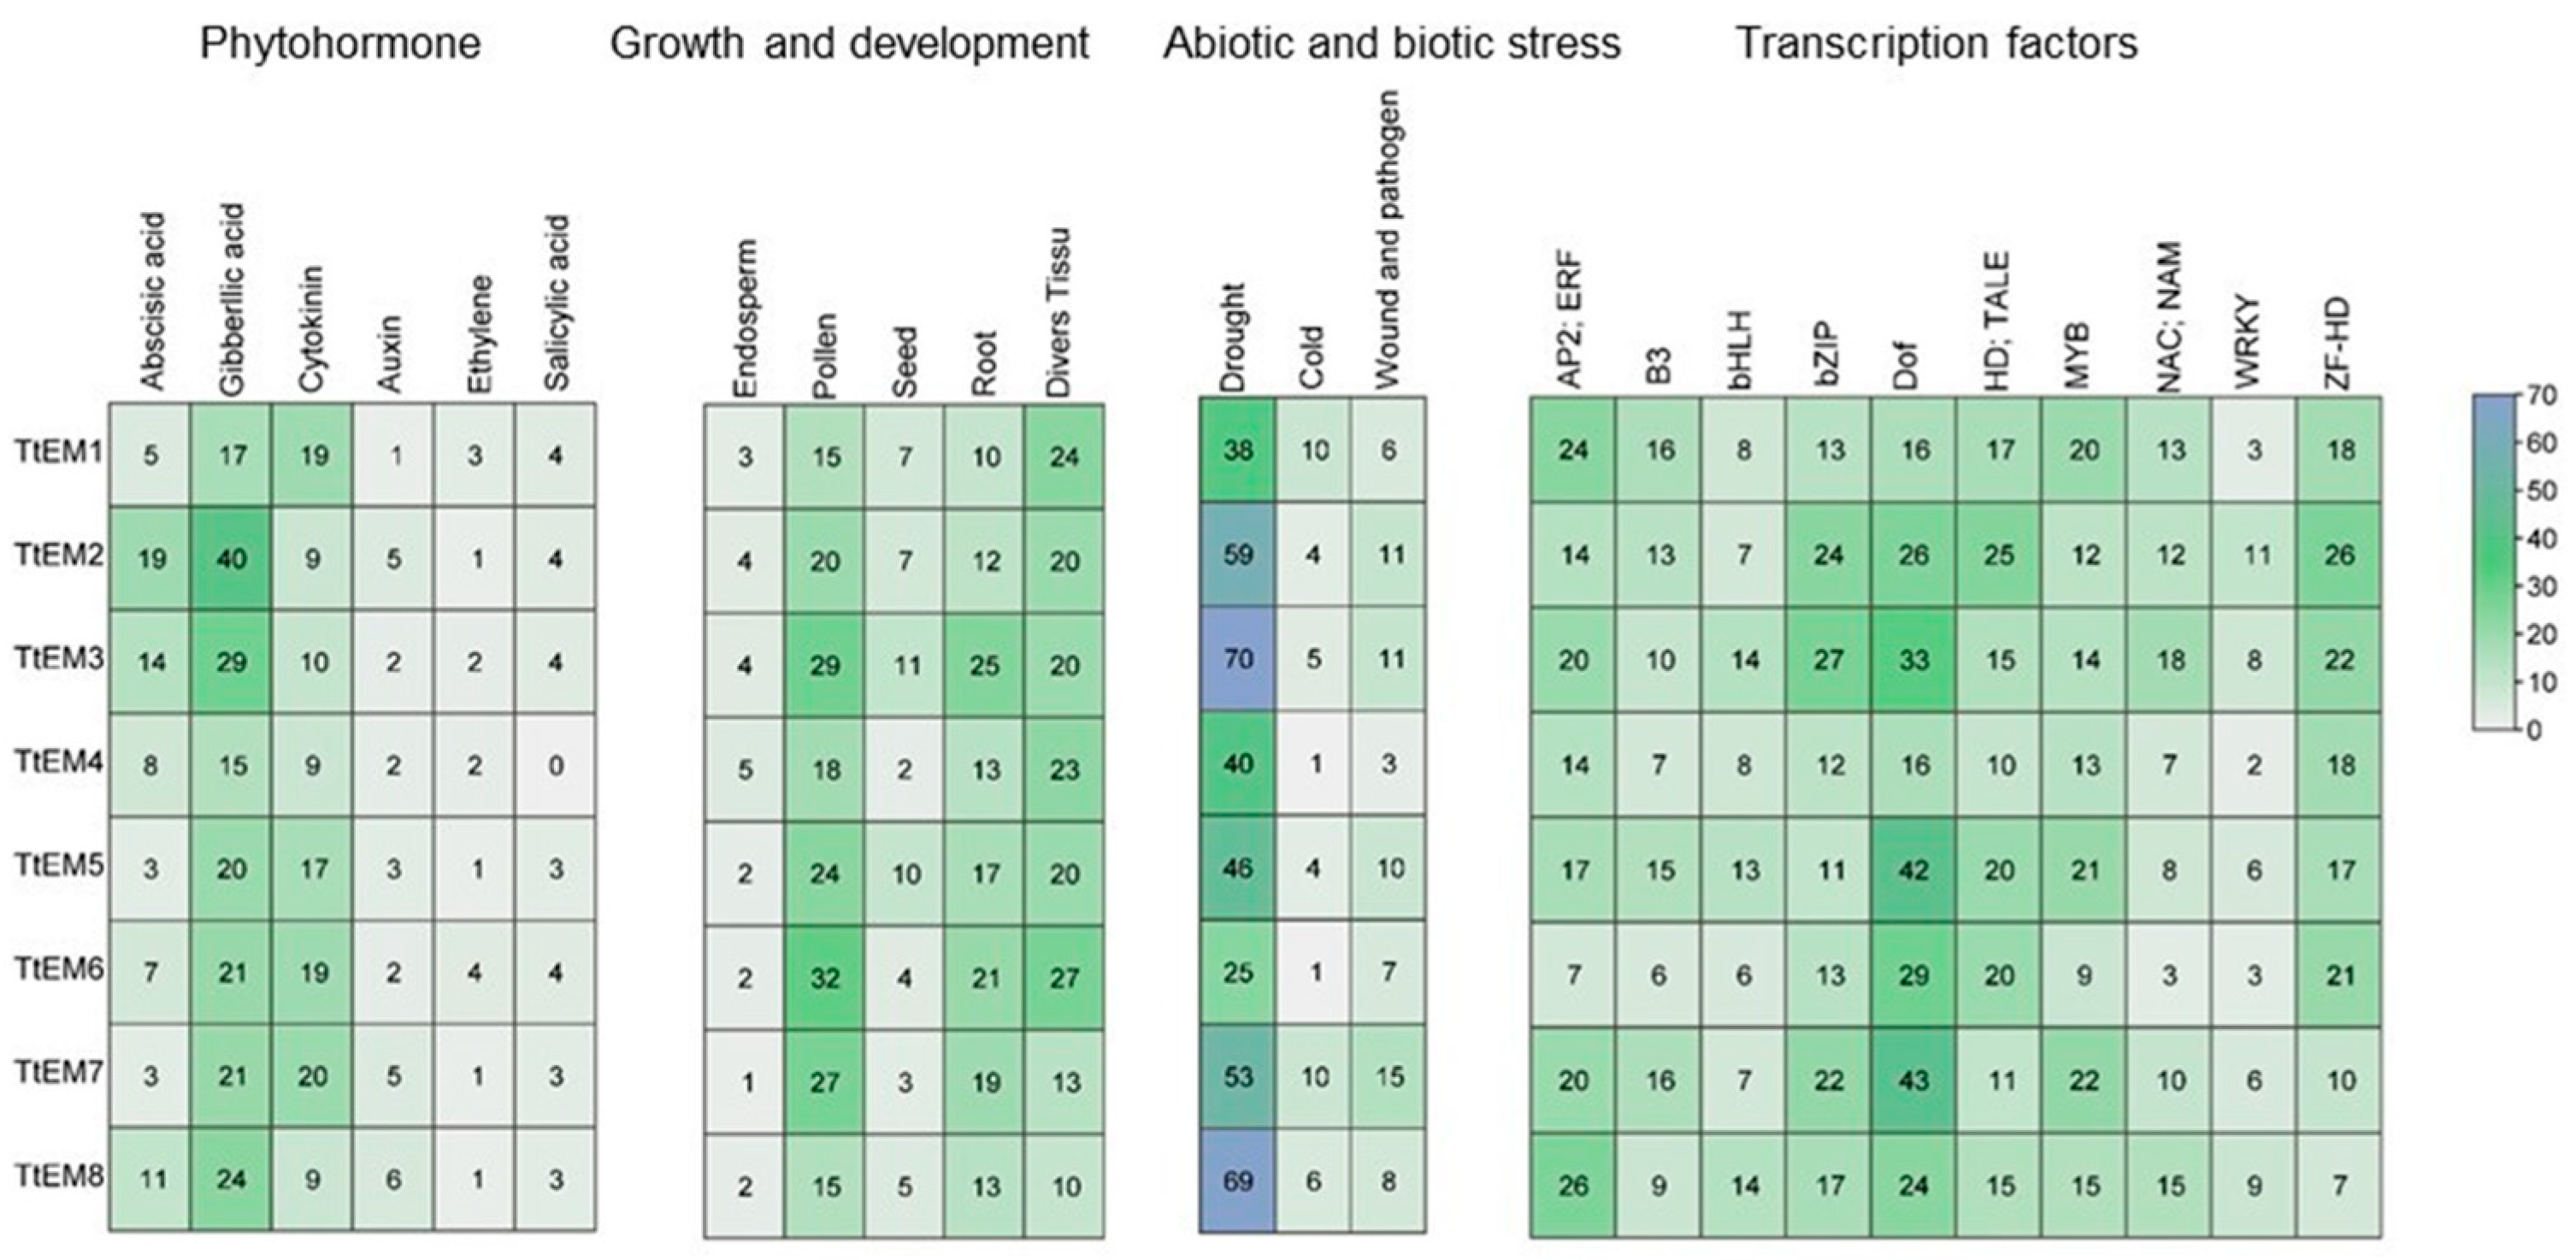
To explore the potential functions of TtEM genes, we extracted the 2 kb upstream promoter sequences of each TtEM gene and analyzed them using the PLACE database to identify and quantify the cis-regulatory elements (Figure 2). Additionally, we used the Plant Promoter Analysis Navigator (PlantPAN) to identify transcription factors binding sites within these promoter regions. The identified cis-regulatory elements were classified into three main categories. The first category includes elements related to the hormone signaling pathway, mainly involved in plant growth and development processes, from seed germination to flowering, such as those responsive to gibberellin, abscisic acid, cytokinin, auxin, salicylic acid, and ethylene. The second category comprises stress-related cis-regulatory elements, particularly those associated with drought, low temperature, wounding, and pathogen responses. The third category includes elements related to plant growth and development, such as those involved in endosperm expression, pollen, and seed-specific regulation elements, indicating a strong relationship between the TtEM gene and seed expression patterns. Moreover, some cis-elements are linked to root- and tissue-specific expression (more details in Table S2). This classification indicates that TtEM genes can be involved in multiple biological processes, although some elements are more relevant than others. For instance, among phytohormone-responsive elements, those associated with gibberellic acid and cytokinin are the most widespread compared with the others. Similarly, within the development-related elements, those involved in pollen and root-specific expression are more frequent. Among the stress-responsive elements, drought-related elements are the most common, indicating a potential role for TtEM proteins in drought tolerance mechanisms in wheat. Furthermore, analysis of TtEM promoters revealed several transcription factors binding sites associated with plant development and stress responses. These include APETALA2/Ethylene Responsive Factor (AP2/ERF), B3, the Basic helix–loop–helix (bHLH), basic leucine zipper (bZIP), DNA binding with one finger (Dof), transcription activator-like effector (TALE), myeloblastosis (MYB), and Zinc finger homeodomain (ZF-HD) transcription factors. These regulators play crucial roles in signaling networks that modulate plant growth, development, and response to biotic and abiotic stresses.

2.5. Expression Patterns of TtEM1 and TtEM4 Genes in Different Tissues and Under Stress Treatments

To elucidate the stress-responsive and organ-specific expression profiles of TtEM genes, we analyzed the expression profiles of two TtEM genes under abiotic stress conditions and across different tissues. In the embryo at 14 days after anthesis (Em1), TtEM1 and TtEM4 genes were highly expressed; however, TtEM1 showed a 2-fold higher expression level compared to TtEM4. At 21 days after anthesis (Em2), TtEM1 maintained a significantly higher expression (5-fold relative to TtEM4), suggesting that TtEM1 is more actively transcribed in these tissues. In the endosperm (Ed1), the expression of TtEM1 was approximately 20-fold higher than TtEM4. In the other tissues, both genes showed very low expression levels (<5-fold change). This was evident in seeds at two (Sd2) and three days (Sd3) after anthesis, as well as in anthers. In the remaining tissues, expression of both genes was either extremely low or absent, such as seeds at one day after anthesis (Sd1), in the spike one day (Sp1) and two days (Sp2) after anthesis, in leaves (OL), and in stems (St) (Figure 3A). These results suggest that TtEM1 and TtEM4 genes exhibit tissue-specific expression, which may be linked to their specific roles in development or in response to specific stimuli. TtEM1 and TtEM4 genes were generally upregulated in leaves in response to the different stress treatments, including ABA, heat, mannitol, and PEG, with varying expression levels depending on the stress type and exposure duration (4 h or 24 h). Under ABA treatment, TtEM1 exhibited a higher induction, showing a 5-fold increase after 4 h, compared to a 1.4-fold increase for TtEM4. In contrast, under heat stress, the expression level of TtEM4 (5-fold) was higher than that of TtEM1 (0.2-fold). Mannitol treatment led to the upregulation of TtEM1 and TtEM4 genes at 4 h and 24 h of treatments, with the TtEM4 gene displaying a significantly higher induction at 24 h (28-fold) compared to TtEM1 (21-fold). Under PEG treatment, both genes were significantly induced at 4 h of treatment, but the TtEM4 gene showed a slightly higher induction (12-fold) compared to TtEM1 (9-fold). Under cold and salinity conditions, expression of TtEM1 and TtEM4 genes remained near control levels (≤1-fold; Figure 3B). In roots, TtEM4 gene expression was consistently higher than that of TtEM1. Notably, under ABA treatment, TtEM4 expression was strongly induced, showed a ~98-fold change at 4 h, and then decreased to 24-fold at 24 h, while TtEM1 showed a 4-fold increase at 4 h, and 6-fold at 24. Similarly, under salt stress, TtEM4 exhibited a notable induction (7.7-fold at 4 h and 3.1-fold at 24 h), whereas TtEM1 showed negligible induction (0.6-fold at 4 h and nearly undetectable at 24 h). Although cold, heat, mannitol, and PEG treatments slightly induced the expression of TtEM4 gene in roots, its transcript levels remained higher than the expression of TtEM1 under the same conditions. For instance, under cold stress, TtEM4 showed a 4.4-fold increase at 4 h and 3.3-fold at 24 h, whereas TtEM1 exhibited minimal expression (0.3-fold at 4 h and only 0.02-fold at 24 h). Similarly, in response to mannitol, TtEM4 was upregulated to 2.9-fold at 4 h and 1.8-fold at 24 h, while TtEM1 displayed lower expression levels (0.3-fold and 0.7-fold, respectively; Figure 3C). Overall, TtEM1 and TtEM4 display different expression profiles in leaves and roots in response to different stresses. TtEM4 appears to be more responsive to different abiotic stresses than TtEM1, showing higher expression levels, particularly after 4 h of treatment. These differences suggest that TtEM1 and TtEM4 may play distinct roles in the response of wheat to abiotic stresses.

2.6. Expression, Purification, and Structural Characterization of TtEM1 and TtEM4 Proteins

The TtEM1 and TtEM4 proteins were overexpressed in a bacterial host system to enable their expression and characterization. Following IPTG induction, two distinct bands corresponding to recombinant TtEM1 and TtEM4 were detected in the supernatant fraction (I) by SDS-PAGE that were absent before induction (BI; Figure 4A(a,b)). The proteins were subsequently purified, and their identities were confirmed by Western blot analysis using an anti-HIS antibody. The TtEM1 protein migrated at an apparent molecular weight of 17 kDa, while its predicted size is 12.3 kDa. Similarly, TtEM4 protein migrated at approximately 20 kDa, although its predicted size is 14.6 kDa; this abnormal migration is characteristic of intrinsically disordered proteins, which tend to exhibit abnormal SDS-PAGE behavior due to their low affinity for SDS (Figure 4A). The heat stability of the proteins was assessed by heating them at 100 °C. Both TtEM1 and TtEM2 remained in the supernatant after 30 min and even after 1 h of incubation, whereas the BSA and lysozyme used as structured proteins denatured and disappeared from the supernatant (Figure 4B(a,b)). Due to their lack of stable structure, intrinsically disordered proteins have more accessible and flexible regions, making them more susceptible to proteolytic cleavage. Consistent with this, both TtEM1 and TtEM4 exhibited sensitivity to thermolysin, as shown by SDS-PAGE analysis. Degradation began immediately upon the addition of thermolysin and was complete after 24 h, while lysozyme remained intact even after 24 h of treatment (Figure 4C(a–c)). To assess the impact of dehydration-mimicking conditions, 25% of glycerol was added. Under these conditions, TtEM1 and TtEM4 proteins showed increased resistance to thermolysin digestion. Although some degradation fragments were observed after 3 h of incubation, the proteins were largely protected, with complete degradation observed only after 24 h of treatment (Figure 4C(a,b)). These results suggest that glycerol-induced dehydration may promote structural transitions that enhance the protease resistance of TtEM1 and TtEM4.

2.7. Preservation of LDH Activity Under Different Stress Treatments

We evaluated the ability of TtEM1 and TtEM4 to prevent damage to LDH activity under desiccation, heat, and freezing stress. BSA was used as a positive control. Under desiccation conditions, LDH completely lost its enzymatic activity. However, in the presence of TtEM1 and TtEM4, approximately 34% and 55% of LDH activity was retained, respectively (Figure 5A). After incubation at 45 °C, LDH retained only 8% of its initial activity, but in the presence of TtEM1 and TtEM4, 52% and 31% of its activity was retained, respectively (Figure 5B). In addition, we studied the effect of cold by freezing and thawing the samples. LDH activity decreased to around 12%, but with the addition of TtEM1 and TtEM4, 56% and 82% of LDH activity was retained, respectively (Figure 5C). The results suggest that TtEM1 and TtEM4 proteins confer differential protective effects on LDH activity, particularly under cold and desiccation stress, and they are more effective than BSA under these conditions.

2.8. Overexpression of TtEM1 and TtEM4 Enhanced Yeast Cell Tolerance to Abiotic Stress

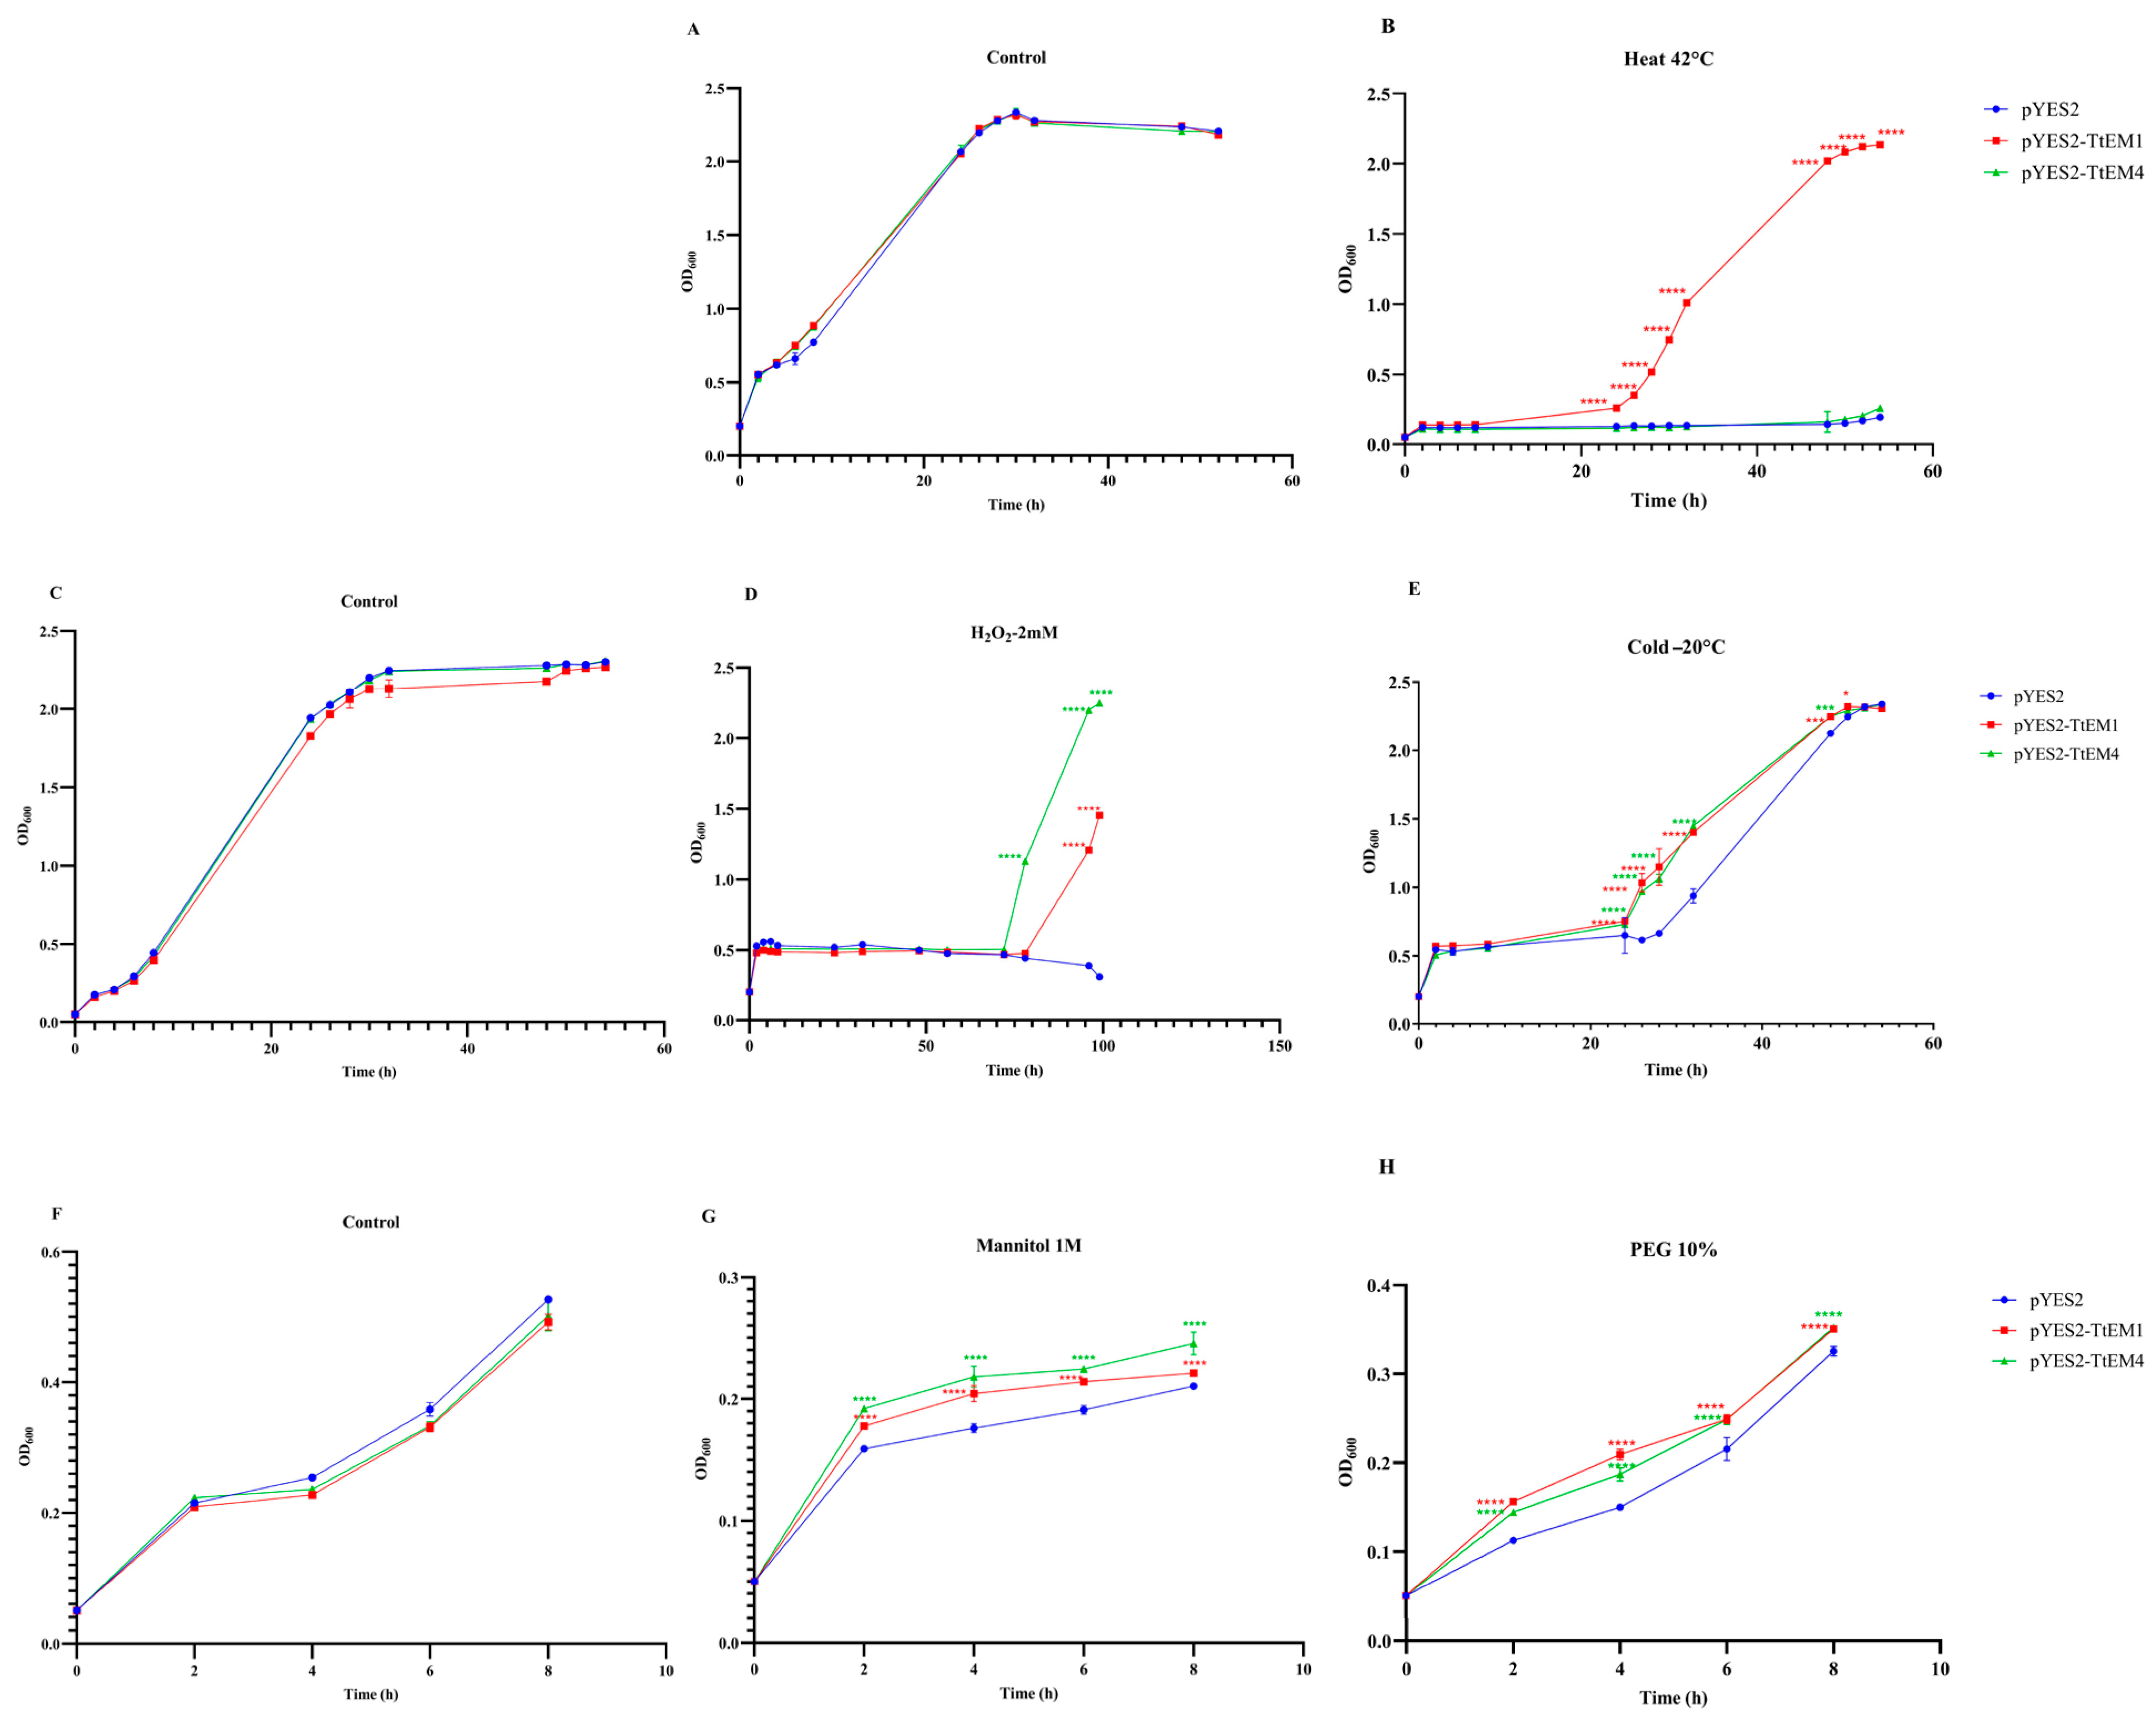
The stress-responsiveness of the TtEM1 and TtEM4 in wheat and its in vitro protective role led us to examine the potential of these proteins to enhance stress tolerance in yeast. In this regard, the TtEM1 and TtEM4 genes were cloned into the pYES2 vector and transformed into BY4741 yeast cells. Growth curves of yeast transformed with pYES2-TtEM1, pYES2-TtEM4, and the empty vector under control and stress conditions were measured. Under optimal conditions, there was no significant difference in growth between the yeast cells transformed with the empty vector and the yeast cells transformed with pYES2-TtEM1 or pYES2-TtEM4. The OD600 values of the transformed strains were nearly identical throughout the time course. For example, at 24 h, OD600 values were 2.06 ± 0.008 for the empty vector, 2.05 ± 0.018 for TtEM1, and 2.07 ± 0.018 for TtEM4 (Figure 6A,C,F). Nevertheless, under stress conditions, cells expressing TtEM1 and TtEM4 exhibited significantly enhanced tolerance compared to the empty vector. When exposed to oxidative stress (H2O2), TtEM1- and TtEM4-expressing yeast exhibited enhanced growth (OD600 values at 52 h were 1.45 ± 0.005 and 2.24 ± 0.007, respectively) compared to the cells expressing empty vector (0.31 ± 0.002; Figure 6D). During low-temperature stress (−20 °C), at 32 h, cell viability was significantly higher for yeast cells transformed with TtEM1 or TtEM4 (56% and 60%, respectively; Figure 6E). Under mannitol treatment, the transformed yeast cells with pYES2-TEM1 or pYES2-TtEM4 exhibited a 18% and 28% higher OD600 at 4 h than the control (Figure 6G). Under PEG-induced water deficit, at 4 h, OD600 values for TtEM1- or TtEM4-overexpressed stains were 0.2 ± 0.006 and 0.18 ± 0.007, respectively, whereas control cells reached only 0.15± 0.005 (Figure 6H). Notably, under high-temperature stress, only yeast cells expressing pYES2-TtEM1 (OD600 at 54 h was 2.1 ± 0.06) were able to grow, while yeast cells expressing pYES2-TtEM4 and the empty vector showed a low growth (OD600 values at 54 h were 0.2 ± 0.006 and 0.19 ± 0.003, respectively) (Figure 6B). These results suggest that overexpression of TtEM1 and TtEM4 differentially improves the tolerance of transgenic yeast to abiotic stress, indicating that the two genes may function through distinct mechanisms in wheat.

3. Discussion

Group 1 LEA genes, also known as Em genes, have been identified in a wide range of organisms, including plants, bacteria, and animals, highlighting the functional importance of these genes [21]. In this study, we performed the first genome-wide characterization of the EM gene family (group 1 LEA) in durum wheat, identifying a relatively high number of eight members compared to those identified in two well-studied model plants, rice and Arabidopsis. Analysis of 60 fully sequenced genomes revealed a total of 153 EM genes. Currently, a number of EM genes have been found in many species. For instance, two EM genes were identified in maize (Zea mays), in rice, in Arabidopsis thaliana, and in Medicago truncatula, while six were detected in barley [22]. The number of EM genes in wheat was relatively high compared to these species. These findings suggest that differences in the number of EM genes might be associated with plants and their ploidy levels [23].
TtEM genes were unevenly distributed across the four chromosomes, suggesting a differential gene duplication and loss events, implicated in the expansion of EM genes, a major mechanism for gene family expansion in polyploid species like durum wheat [24]. Analysis of their motifs revealed that members of each LEA phylogenetic group contained specific conserved motifs shared with their homologues in other species, such as A. thaliana, M. truncatula, H. vulgare, and O. sativa, suggesting that EM proteins probably have specific functions. These results are consistent with previous studies in peanut [25] and brassica species [26], where proteins within the same group exhibited similar motif composition.
Usually, stress responsive-genes have a low intron content [27]; corroborating this hypothesis, all the eight TtEM genes contain one intron. This structural feature seems to be a common characteristic among several stress-related gene families. For instance, the trehalose-6-phosphate synthase gene family, which plays an important role in stress response, also exhibited low numbers of introns [28]. Similarly, ASR genes in wheat [29] and barley typically contain one intron [30]. Our findings suggest that the compact gene structure of TtEMs genes could be an adaptative feature that facilitates rapid transcriptional activation during stress, as explained by the authors of [31], who state that introns can retard regulatory responses by increasing the length of the nascent transcript, leading to an additional energetic burden due to the increase in transcript length.
According to the analysis of physiochemical proprieties, it was found that all the TtEM genes encode small proteins with molecular weight ranging between 9.9 and 14.6 kDa, which was consistent with previous finding in other species such as strawberry (4–10 kDa) [32] and [33] tea. In addition, TtEM proteins are notably enriched with polar and charged amino acids and depleted of hydrophobic amino acids, a typical feature of intrinsically disordered proteins [34]. Consistent with this, prediction of disordered features of TtEM proteins using the PONDOR website tool revealed that the average proportion of disordered structures was higher than 98% for all TtEM proteins. These characteristics enable LEA proteins to stabilize and prevent aggregation of the proteins, thereby contributing to various biological roles in response to different environmental conditions [35]. In this current study, TtEM1 and TtEM4 proteins were found to be heat-stable proteins and sensitive to protease-meditated proteolysis, revealing their disordered nature. Additionally, both proteins were able to protect LDH activity under different stress conditions, supporting their functional role in stress tolerance. For several LEA proteins, it has been demonstrated that they are unstructured in hydrate solution, but they adopt an α-helix structure during stress [36]. For instance, COR15A, a LEA protein from Arabidopsis thaliana, folds into an α-helix in the presence of high concentrations of glycerol [37]. Here, the addition of glycerol results in decreased susceptibility to proteolysis for TtEM1 and TtEM4 proteins, suggesting that the two proteins may adopt a predominantly α-helical structure, as indicated by in silico analysis (41.59% and 45.13 of predicted α-helical content for TtEM1 and TtEM4, respectively), likely contributing to their stability under proteolytic treatment.
Previously, many in vitro and in vivo studies have been conducted to investigate the function of the LEA gene under abiotic stress [38]. For example, LsEm1 from lettuce (Lactuca sativa) [18] and EhEm1 from salt cress (Eutrema halophilum) [18] have been shown to protect the LDH enzyme from desiccation treatment. Additionally, overexpression of RhDHN4 from barley, TsLEA1 from Thellungiella salsuginea, and ZmLEA5C from maize has been demonstrated to improve abiotic stress tolerance, such as salt, drought, and oxidative stress, when expressed in yeast systems [39,40,41]. Here, we demonstrated that recombinants expressing TtEM1 or TtEM4 proteins grew better under heat, cold, oxidative, and drought stress than yeast not expressing TtEM1 or TtEM4 proteins, thus suggesting a functional redundancy between these genes in conferring general stress tolerance. However, a differential stress-specific response has been observed, especially the exclusive high-temperature tolerance conferred by TtEM1, suggesting functional divergence between the two genes under high-temperature stress. Such differences enable each gene to contribute to specific aspects of the plant’s stress response. These findings highlight a complementary or specialized role for TtEM1 or TtEM4 genes in stress adaptation.
LEA proteins have been predicted to localize in various subcellular compartments and are associated with a range of functions related to stress response, desiccation tolerance, and development [42]. Interestingly, TtEM proteins were predicted to localize exclusively in the nucleus, suggesting their role in maintaining the integrity of nuclear structures during stress.
The majority of LEA proteins are upregulated in response to various abiotic stresses [19]. This regulation is largely driven by specific cis-regulatory elements in their promoters. In several plant species, including Sorghum (Sorghum bicolor) [43], tomato [44], rye [45], and poplar [46], LEA gene promoters have been reported to contain numerous stress-responsive elements, as well as cis-regulatory elements related to plant growth and development. Consistent with these findings, our analysis of the promoter regions of TtEM genes revealed the presence of a lot of stress-responsive and growth and development cis-element in durum wheat. This reinforces the notion that TtEM gene expression is regulated by stress conditions, as shown in previous studies that demonstrate that the expression of LEA genes is frequently induced at different development stages and tissues of plants and by different abiotic stresses, such as salt, drought, temperature, and hormonal treatment [47]. Moreover, our data expand on previous reports by showing that these elements are not only conserved across species but are also functionally relevant in durum wheat, where TtEM1 and TtEM4 genes showed a strong transcriptional responses to dehydration and ABA treatment. Interestingly, expression profiling revealed that TtEM1 and TtEM4 genes were predominantly expressed in embryos, with markedly lower expression in the other tissues under standard conditions. This tissue-specific expression pattern, combined with their inducibility by abiotic stress, suggests that TtEM1 and TtEM4 play critical roles at the intersection of stress adaptation and developmental regulation. Taken together, our study highlights the distinct expression profiles of TtEM1 and TtEM4, providing valuable insights into their potential divergence within the group1 LEA family.

4. Materials and Methods

4.1. Identification and Analysis of LEA_5 Family Members in Durum Wheat

Group 1 LEA protein members in Durum Wheat were detected using the Ensembl Plants database (https://plants.ensembl.org/index.html, accessed on 24 April 2025) for Triticum turgidum (svevo. v1), based on their Pfam IDs (PF00477). Their orthologous genes in Arabidopsis thaliana, Medicago truncatula, Hordeum vulgare, and Oryza sativa Japonica were retrieved using the BioMart, along with their nucleotide sequences, protein sequences, and promoter sequences. The chromosomal distribution of these genes was visualized using the MG2C tool (http://mg2c.iask.in/mg2c_v2.1/, accessed on 24 April 2025). Biochemical parameters were analyzed by the ProtParam tool (http://web.expasy.org/protparam/, accessed on 24 April 2025), while secondary structure predictions were performed with the SOPMA tool https://npsa-prabi.ibcp.fr/cgi-bin/npsa_automat.pl?page=/NPSA/npsa_sopma.html (accessed on 26 April 2025). Intrinsic disorder predictions, as well as charge and hydropathy analysis, were conducted using PONDR (http://www.pondr.com, accessed on 24 April 2025). The subcellular localization of the TtEM proteins was predicted using the WOLFPSORT tool (https://wolfpsort.hgc.jp/, accessed on 27 April 2025).

4.2. Analysis of Phylogeny, Genes Structures, and Conserved Motifs

A multiple-sequence alignment of full-length amino acid sequences of EM proteins from Triticum turgidum (TtEM), Arabidopsis thaliana (AtEM), Medicago truncatula (MtEM), Hordeum vulgare (HvEM), and Oryza sativa (OsEM) was performed using the ClustalW algorithm. The genes were renamed according to their chromosomal locations. A phylogenetic tree was constructed using the neighbor-joining method with 1000 bootstrap replicates in MEGA11 software. Gene structures were visualized using the Gene Structure Display Server (GSDS; http://gsds.cbi.pku.edu.cn/, accessed on 28 April 2025) based on coding sequences (CDSs) and corresponding genomic DNA sequences. Conserved motifs were identified by the Multiple EM for Motif Elicitation (MEME) (https://meme-suite.org/meme/tools/meme, accessed on 29 April 2025).

4.3. Cis-Acting Elements and Transcription Factors Analysis

The 2kb upstream sequences of the TtEM genes were analyzed using the New PLACE database (https://www.dna.affrc.go.jp/PLACE/?action=newplace, accessed on 29 April 2025) to identify cis-acting regulatory elements. Additionally, the Plant Promoter Analysis Navigator (PlantPAN 4.0; http://plantpan.itps.ncku.edu.tw/plantpan4/index.html, accessed on 30 April 2025) was employed to predict transcription factor families. The results were visualized using TBtools-II v.323 software.

4.4. Plant Material, Growth Conditions, and Stress Treatments

The Tunisian durum wheat cultivar Triticum turgidum ssp. durum, cv. Om Rabiaa, obtained from the National Institute of Agricultural Research of Tunis (Tunisia), was used to analyze the expression of TtEM1 and TtEM4 genes. Seeds were surface-sterilized with 0.5% sodium chloride (NaOCl) for 15 min, rinsed three times with sterile distilled water, and placed on Petri dishes containing a single sheet of Whatman paper for germination. After germination, seedlings were transferred to hydroponic boxes containing nutrient solution and grown under controlled conditions (25 ± 2 °C, 16 h light/8 h dark photoperiod). Twelve-day-old seedlings were subjected to various abiotic stress treatments, 100 μM abscisic acid (ABA), cold stress (4 °C), heat stress (42 °C), 200 mM NaCl (salt stress), osmotic stress (100 mM mannitol), and drought stress (20% PEG 6000). Roots and leaves were collected at two time points (4 h and 24 h post-treatment) for RNA extraction. Additionally, the expression profiles of the TtEM1 and TtEM4 genes were analyzed in different tissues after anthesis: ear (Sp1, after 2 days; Sp2, after 4 days; and Sp3, after 7 days), seeds (Sd1, after 4 days; Sd2, after 7 days; and Sd3, after 14 days), endosperm (Ed1, after 14 days), embryo (Em1, after 14 days; and Em2, after 21 days), leaves (OL), stems (St), and anthers (Ant).

4.5. RNA Isolation, cDNA Synthesis, and qRT-PCR Analysis

Total RNA was extracted from various tissues of wheat seedlings (cv. Om Rabiaa) using TRIzol reagent (Invitrogen, Carlsbad, CA, USA), according to the manufacturer’s protocol. The extracted RNA was treated with DNase (Thermo Fisher Scientific, Waltham, MA, USA) at 37 °C for 30 min. M-MLV reverse transcriptase (Thermo Fisher Scientific) was used for complementary DNA (cDNA) synthesis. qRT-PCR analysis was conducted to assess TtEM1 and TtEM4 expression in Om Rabiaa wheat variety subjected to various stress conditions. qRT-PCR reactions were performed using Bio-Star qPCR-Master mix SYBR blue (GeneON, GroB-Rohrheim, Hesse, Germany) on a Bio-Rad CFX96 real-time PCR detection system. The thermal cycling conditions were as follows: an initial denaturation for 3 min at 95 °C, followed by 40 cycles of 30 sec at 95 °C, and 1 min at 72 °C. Each sample type was analyzed in triplicate and normalized using the cell division control protein (AAA-superfamily of ATPases) (CDC, Ta54227), which has previously been reported as the most stable reference gene for normalizing gene expression in developmental stages and different tissues of wheat [48]. The expression level was determined by applying the 2−ΔΔCT method described by [49].

4.6. Expression and Purification of TtEM1 and TtEM4 Proteins

The TtEM1 and TtEM4 genes were inserted into the pET28a+ vector, resulting in fusion constructs with an N-terminal his-tag. These genes are placed under the control of an IPTG-inducible T7 promoter to allow for the production of recombinant his-tagged proteins. The resulting constructs, pET28a (+)-TtEM1, and pET28a (+)-TtEM4, were transformed into E. coli BL21 cells. Cultures were grown at 37 °C until reaching an OD of 0.8, followed by induction with 1 mM IPTG overnight at 28 °C. Recombinant proteins were purified using HisPur™ Ni-NTA resin (ThermoFisher, Inc., USA), according to recommended protocols. Protein patterns were then analyzed by SDS-PAGE, using Bio Basic Prestained protein ladders as molecular-weight markers. Immunoblot analysis of purified His-TtEM1/TtEM4 proteins was performed using an anti-6x-His Tag monoclonal antibody (Invitrogen), according to the method described by [50]. Protein concentrations were determined using the Bradford assay [51].

4.7. Evaluation of Heat Stability and Protease Sensitivity of TtEM1 and TtEM4 Proteins

In order to determine their heat stability, the purified proteins TtEM1, TtEM4 (0.5 mg. mL−1), and BSA (0.2 mg. mL−1, as a control) were incubated for 30 min and 1 h at 100 °C, centrifuged for 5 min at 10,000 rpm, and the supernatants were then analyzed by SDS-PAGE. For protease sensitivity analysis, equal protein concentrations for TtEM1, TtEM4, and lysozyme (used as control due to its stability in the presence of protease) were subjected to thermolysin treatment. Aliquots were collected after 30 s, 3 h, and 24 h in the presence of 25% glycerol. Reactions were stopped by the addition of SDS-PAGE loading buffer, followed by incubation at 100 °C for 5 min before electrophoresis on a 15% SDS-PAGE gel.

4.8. Lactate Dehydrogenase (LDH) Protection Assays

The Lactate Dehydrogenase Bovine heart (Sigma-Aldrich Inc., St. Louis, MO, USA) was diluted to a final concentration of 20 µg/mL in sodium phosphate buffer (10 mM, pH = 7). The purified TtEM1 and TtEM4 or BSA were also diluted to a final concentration of 20 µg/mL in the same buffer. The mixture of LDH and TtEM proteins in a molar ratio of 1:20 was totally dehydrated in the speed vac and then rehydrated in the same initial volume. For thermic treatment, the samples were subjected to 45 °C for 30 min or two freeze–thaw cycles (2 min in liquid nitrogen, followed by 5 min at room temperature). After each treatment, the mixture of enzymes and proteins was added to a reaction buffer containing 25 mM Tris-HCl pH 7.5, 2 mM pyruvate (Biomaghreb, Ariana, Tunisia), and 0.15 mM NADH for a final volume of 1 mL. An initial absorbance was measured at 340 nm, and then another measurement was made after 2 min. Each trial was repeated three times, with three technical replicates each, and statistically significant differences were analyzed with GraphPad Prism 9 ANOVA Two-way test with p value < 0.0001.

4.9. Evaluation of Stress Tolerance in Yeast Cells Expressing TtEM1 or TtEM4

TtEM1-pYES2, TtEM4-pYES2, and pYES2 were transformed into the yeast host BY4741 strain (Mat a his3Δ1 leu2Δ met15Δ ura3Δ) using the lithium acetate method [52]. Growth of the transformed yeast cells was monitored in standard YNB(Gal)-URA medium at 30 °C, under shaking, for the control. For oxidative stress treatment, the medium was supplemented with 2 mM hydrogen peroxide. Osmotic and drought stress were induced by the addition of 1 M mannitol and 10% PEG, respectively. To assess thermal stress tolerance, yeast cells were incubated at 42 °C and −20 °C for 24 h, and then they were transferred to YNB(Gal)-URA medium and incubated at 30 °C. Growth was evaluated with a spectrophotometer by measuring OD600.

4.10. Statistical Analysis

All experiments and analyses were performed in triplicate. GraphPad Prism version 9.0.0 (121) was used for the graphical representation and analysis of the data using two-way ANNOVA test p < 0.05.

5. Conclusions

The current study provides a comprehensive analysis of the EM gene family in durum wheat. Eight genes were identified and classified into four phylogenetic groups, sharing conserved motifs with their homologues in rice, barley, Arabidopsis thaliana, and Medicago truncatula. They were unevenly distributed on chromosomes, and their promoter regions harbored a high number of cis-acting elements related to biotic and abiotic response and plant development processes. Among them, TtEM1 and TtEM4 were highly expressed in embryos during development in the Om Rabiaa durum wheat variety, and they showed differential expression in leaves and roots under stress conditions. Functional assays demonstrated their ability to preserve LDH activity and improve the growth of transformed yeast during the stress. These findings highlight the role of the EM gene family in durum wheat and putative functions of TtEM genes in stress and developmental regulation, paving the way for further functional characterization and genetic improvement in wheat and related species.

Supplementary Materials

The following supporting information can be downloaded at https://www.mdpi.com/article/10.3390/plants14182817/s1, Figure S1. Amino acid sequence alignments of TtEM proteins. The motif outlined in blue represents the N-terminal region of the sequences, the C-terminal region is highlighted in green, and the orange border indicates the specific motif characteristic of group 1 LEA proteins. Table S1. Chromosomal locations of EM genes. Table S2. Cis-regulatory elements on TtEM promoters.

Author Contributions

Conceptualization, N.S., I.Z. and F.B.; methodology, N.S. and I.Z.; software, N.S. and M.N.S.; validation, I.Z. and F.B.; formal analysis, N.S. and I.Z.; investigation, N.S.; resources, F.B.; data curation, I.Z.; writing—original draft preparation, N.S.; writing—review and editing, I.Z., M.N.S. and F.B.; visualization, F.B.; supervision, F.B.; project administration, I.Z.; funding acquisition, F.B. All authors have read and agreed to the published version of the manuscript.

Funding

This research was supported by grant from the Ministry of Higher Education and Scientific Research, Tunisia, under “CP2023-2026”.

Data Availability Statement

The data are contained within the article and the Supplementary Materials.

Conflicts of Interest

The authors declare no conflicts of interest.

References

  1. Martínez-Moreno, F.; Solís, I.; Noguero, D.; Blanco, A.; Özberk, İ.; Nsarellah, N.; Elias, E.; Mylonas, I.; Soriano, J.M. Durum Wheat in the Mediterranean Rim: Historical Evolution and Genetic Resources. Genet. Resour. Crop Evol. 2020, 67, 1415–1436. [Google Scholar] [CrossRef]
  2. Saharan, B.S.; Brar, B.; Duhan, J.S.; Kumar, R.; Marwaha, S.; Rajput, V.D.; Minkina, T. Molecular and Physiological Mechanisms to Mitigate Abiotic Stress Conditions in Plants. Life 2022, 12, 1634. [Google Scholar] [CrossRef]
  3. Li, S.; Meng, H.; Yang, Y.; Zhao, J.; Xia, Y.; Wang, S.; Wang, F.; Zheng, G.; Li, J. Overexpression of AtruLEA1 from Acer Truncatum Bunge Enhanced Arabidopsis Drought and Salt Tolerance by Improving ROS-Scavenging Capability. Plants 2025, 14, 117. [Google Scholar] [CrossRef]
  4. Dure, L.; Greenway, S.C.; Galau, G.A. Developmental Biochemistry of Cottonseed Embryogenesis and Germination: Changing Messenger Ribonucleic Acid Populations As Shown by in Vitro and in Vivo Protein Synthesis. Biochemistry 1981, 20, 4162–4168. [Google Scholar] [CrossRef]
  5. LeBlanc, B.M.; Hand, S.C. Target Enzymes Are Stabilized by AfrLEA6 and a Gain of α-Helix Coincides with Protection by a Group 3 LEA Protein during Incremental Drying. Biochim. Biophys. Acta—Proteins Proteom. 2021, 1869, 140642. [Google Scholar] [CrossRef]
  6. Amara, I.; Zaidi, I.; Masmoudi, K.; Ludevid, M.D.; Pagès, M.; Goday, A.; Brini, F. Insights into Late Embryogenesis Abundant (LEA) Proteins in Plants: From Structure to the Functions. Am. J. Plant Sci. 2014, 05, 3440–3455. [Google Scholar] [CrossRef]
  7. Celik Altunoglu, Y.; Baloglu, M.C.; Baloglu, P.; Yer, E.N.; Kara, S. Genome-Wide Identification and Comparative Expression Analysis of LEA Genes in Watermelon and Melon Genomes. Physiol. Mol. Biol. Plants 2017, 23, 5–21. [Google Scholar] [CrossRef]
  8. Wang, R.; Yan, S.J.; Liu, C.; Guo, H.; Cui, Y.N. Comparative Physiological and Gene Expression Analyses Reveal Mechanisms Involved in Maintaining Photosynthesis Capacity, Alleviating Ion Toxicity and Oxidative Stress of Kentucky Bluegrass under NaCl Treatment. Plants 2024, 13, 2107. [Google Scholar] [CrossRef]
  9. Janis, B.; Belott, C.; Brockman, T.; Menze, M.A. Functional and Conformational Plasticity of an Animal Group 1 LEA Protein. Biomolecules 2022, 12, 425. [Google Scholar] [CrossRef]
  10. Hunault, G.; Jaspard, E. LEAPdb: A Database for the Late Embryogenesis Abundant Proteins. BMC Genom. 2010, 11, 221. [Google Scholar] [CrossRef]
  11. Soulages, J.L.; Kim, K.; Walters, C.; Cushman, J.C. Temperature-Induced Extended Helix/Random Coil Transitions in a Group 1 Late Embryogenesis-Abundant Protein from Soybean. Plant Physiol. 2002, 128, 822–832. [Google Scholar] [CrossRef]
  12. Raga-Carbajal, E.; Espin, G.; Ayala, M.; Rodríguez-Salazar, J.; Pardo-López, L. Evaluation of a Bacterial Group 1 LEA Protein as an Enzyme Protectant from Stress-Induced Inactivation. Appl. Microbiol. Biotechnol. 2022, 106, 5551–5562. [Google Scholar] [CrossRef]
  13. Futers, T.S.; Vaugha, T.J.; Sharp, P.J.; Cuming, A.C. Molecular Cloning and Chromosomal Location of Genes Encoding the “Early-Methionine-Labelled” (Em) Polypeptide of Triticum aestivum L. Var. Chinese Spring. Theor. Appl. Genet. 1990, 80, 43–48. [Google Scholar] [CrossRef]
  14. Yu, J.; Lai, Y.; Wu, X.; Wu, G.; Guo, C. Overexpression of OsEm1 Encoding a Group I LEA Protein Confers Enhanced Drought Tolerance in Rice. Biochem. Biophys. Res. Commun. 2016, 478, 703–709. [Google Scholar] [CrossRef]
  15. Zou, Z.; Fu, X.; Yi, X.; Li, C.; Huang, J.; Zhao, Y. Integrative Analysis Provides Insights into Genes Encoding LEA_5 Domain-Containing Proteins in Tigernut (Cyperus esculentus L.). Plants 2025, 14, 762. [Google Scholar] [CrossRef]
  16. Shih, M.D.; Huang, L.T.; Wei, F.J.; Wu, M.T.; Hoekstra, F.A.; Hsing, Y.I.C. OsLEA1a, a New Em-like Protein of Cereal Plants. Plant Cell Physiol. 2010, 51, 2132–2144. [Google Scholar] [CrossRef]
  17. Miyoshi, K.; Kagaya, Y.; Ogawa, Y.; Nagato, Y.; Hattori, T. Temporal and Spatial Expression Pattern of the OSVP1 and OSEM Genes during Seed Development in Rice. Plant Cell Physiol. 2002, 43, 307–313. [Google Scholar] [CrossRef]
  18. Xiang, D.J.; Man, L.L.; Zhang, C.L.; Peng, L.; Li, Z.G.; Zheng, G.C. A New Em-like Protein from Lactuca sativa, LsEm1, Enhances Drought and Salt Stress Tolerance in Escherichia coli and Rice. Protoplasma 2018, 255, 1089–1106. [Google Scholar] [CrossRef]
  19. Zhou, C.; Niu, S.; El-Kassaby, Y.A.; Li, W. Genome-Wide Identification of Late Embryogenesis Abundant Protein Family and Their Key Regulatory Network in Pinus Tabuliformis Cold Acclimation. Tree Physiol. 2023, 43, 1964–1985. [Google Scholar] [CrossRef]
  20. Tang, W.; Page, M. Overexpression of the Arabidopsis AtEm6 Gene Enhances Salt Tolerance in Transgenic Rice Cell Lines. Plant Cell. Tissue Organ Cult. 2013, 114, 339–350. [Google Scholar] [CrossRef]
  21. Campos, F.; Cuevas-Velazquez, C.; Fares, M.A.; Reyes, J.L.; Covarrubias, A.A. Group 1 LEA Proteins, an Ancestral Plant Protein Group, Are Also Present in Other Eukaryotes, and in the Archeae and Bacteria Domains. Mol. Genet. Genom. 2013, 288, 503–517. [Google Scholar] [CrossRef]
  22. Artur, M.A.S.; Zhao, T.; Ligterink, W.; Schranz, E.; Hilhorst, H.W.M. Dissecting the Genomic Diversification of Late Embryogenesis Abundant (LEA) Protein Gene Families in Plants. Genome Biol. Evol. 2019, 11, 459–471. [Google Scholar] [CrossRef]
  23. Meilong, X.; Tong, Q.; Wang, Y.; Wang, Z.; Xu, G.; Elias, G.K.; Li, S.; Liang, Z. Transcriptomic Analysis of the Grapevine Lea Gene Family in Response to Osmotic and Cold Stress Reveals a Key Role for Vamdhn3. Plant Cell Physiol. 2020, 61, 775–786. [Google Scholar] [CrossRef]
  24. Xu, J.; Hu, P.; Tao, Y.; Song, P.; Gao, H.; Guan, Y. Genome-Wide Identification and Characterization of the Lateral Organ Boundaries Domain (Lbd) Gene Family in Polyploid Wheat and Related Species. PeerJ 2021, 9, e11811. [Google Scholar] [CrossRef]
  25. Huanhuan, J.; Qiangbin, C.; Tong, W.; Gang, C. Genome-Wide Analysis and Stress-Responsive Expression Profiling of the LEA (Late Embryogenesis Abundant) Gene Family in Wild Peanut. Oil Crop Sci. 2025, 10, 100–108. [Google Scholar] [CrossRef]
  26. Ashfaq, L.; Iqbal, S.; Rasheed, S.; Munir, H.; Niazi, A.K.; Khan, R.S.A. Genome-Wide Identification and Functional Characterization of LEA4-5 Genes in Response to Drought Stress in Brassica Species. J. Plant Growth Regul. 2025, 44, 4678–4704. [Google Scholar] [CrossRef]
  27. Liu, H.; Xing, M.; Yang, W.; Mu, X.; Wang, X.; Lu, F.; Wang, Y.; Zhang, L. Genome-Wide Identification of and Functional Insights into the Late Embryogenesis Abundant (LEA) Gene Family in Bread Wheat (Triticum aestivum). Sci. Rep. 2019, 9, 1–11. [Google Scholar] [CrossRef]
  28. Xie, D.W.; Wang, X.N.; Fu, L.S.; Sun, J.; Zheng, W.; Li, Z.F. Identification of the Trehalose-6-Phosphate Synthase Gene Family in Winter Wheat and Expression Analysis under Conditions of Freezing Stress. J. Genet. 2015, 94, 55–65. [Google Scholar] [CrossRef]
  29. Zan, T.; Li, L.; Li, J.; Zhang, L.; Li, X. Genome-Wide Identification and Characterization of Late Embryogenesis Abundant Protein-Encoding Gene Family in Wheat: Evolution and Expression Profiles during Development and Stress. Gene 2020, 736, 144422. [Google Scholar] [CrossRef]
  30. Ren, J.; Cai, K.; Song, X.; Yue, W.; Liu, L.; Ge, F.; Wang, Q.; Wang, J. Genome-Wide Identification and Expression Profiling of ABA-Stress-Ripening (ASR) Gene Family in Barley (Hordeum vulgare L.). Plants 2025, 14, 970. [Google Scholar] [CrossRef]
  31. Jeffares, D.C.; Penkett, C.J.; Bähler, J. Rapidly Regulated Genes Are Intron Poor. Trends Genet. 2008, 24, 375–378. [Google Scholar] [CrossRef]
  32. Lin, Y.; She, M.; Zhao, M.; Yu, H.; Xiao, W.; Zhang, Y.; Li, M.; Chen, Q.; Zhang, Y.; Wang, Y.; et al. Genome-Wide Analysis and Functional Validation Reveal the Role of Late Embryogenesis Abundant Genes in Strawberry (Fragaria × Ananassa) Fruit Ripening. BMC Genom. 2024, 25, 228. [Google Scholar] [CrossRef]
  33. Jin, X.; Cao, D.; Wang, Z.; Ma, L.; Tian, K.; Liu, Y.; Gong, Z.; Zhu, X.; Jiang, C.; Li, Y. Genome-Wide Identification and Expression Analyses of the LEA Protein Gene Family in Tea Plant Reveal Their Involvement in Seed Development and Abiotic Stress Responses. Sci. Rep. 2019, 9, 1–15. [Google Scholar] [CrossRef]
  34. Graether, S.P. Methods for Recombinant Production and Purification of Intrinsically Disordered Proteins. Adv. Protein Mol. Struct. Biol. Methods 2022, 41–48. [Google Scholar] [CrossRef]
  35. Cuevas-Velazquez, C.L.; Reyes, J.L.; Covarrubias, A.A. Group 4 Late Embryogenesis Abundant Proteins as a Model to Study Intrinsically Disordered Proteins in Plants. Plant Signal. Behav. 2017, 12, e1343777. [Google Scholar] [CrossRef]
  36. Bremer, A.; Wolff, M.; Thalhammer, A.; Hincha, D.K. Folding of Intrinsically Disordered Plant LEA Proteins Is Driven by Glycerol-Induced Crowding and the Presence of Membranes. FEBS J. 2017, 284, 919–936. [Google Scholar] [CrossRef]
  37. Thalhammer, A.; Bryant, G.; Sulpice, R.; Hincha, D.K. Disordered Cold Regulated15 Proteins Protect Chloroplast Membranes during Freezing through Binding and Folding, But Do Not Stabilize Chloroplast Enzymes in Vivo. Plant Physiol. 2014, 166, 190–201. [Google Scholar] [CrossRef]
  38. Huang, R.L.; Xiao, D.; Wang, X.; Zhan, J.; Wang, A.Q.; He, L.F. Genome-Wide Identification, Evolutionary and Expression Analyses of LEA Gene Family in Peanut (Arachis hypogaea L.). BMC Plant Biol. 2022, 22, 155. [Google Scholar] [CrossRef]
  39. Zaidi, I.; Hanin, M.; Saidi, M.N.; Soltani, N.; Brini, F. The Barley Dehydrin 4 and Stress Tolerance: From Gene to Function. Environ. Exp. Bot. 2024, 224, 105802. [Google Scholar] [CrossRef]
  40. Zhang, Y.; Li, Y.; Lai, J.; Zhang, H.; Liu, Y.; Liang, L.; Xie, Q. Ectopic Expression of a LEA Protein Gene TsLEA1 from Thellungiella Salsuginea Confers Salt-Tolerance in Yeast and Arabidopsis. Mol. Biol. Rep. 2012, 39, 4627–4633. [Google Scholar] [CrossRef]
  41. Liu, Y.; Wang, L.; Jiang, S.; Pan, J.; Cai, G.; Li, D. Group 5 LEA Protein, ZmLEA5C, Enhance Tolerance to Osmotic and Low Temperature Stresses in Transgenic Tobacco and Yeast. Plant Physiol. Biochem. 2014, 84, 22–31. [Google Scholar] [CrossRef]
  42. Piyatissa, S.; Bandupriya, D. Genome-Wide Identification and Analysis of Late Embryogenesis Abundant (LEA) Genes in Musa Acuminata. Trop. Plant Biol. 2021, 14, 295–312. [Google Scholar] [CrossRef]
  43. Nagaraju, M.; Anil Kumar, S.; Reddy, P.S.; Kumar, A.; Manohar Rao, D.; Kavi Kishor, P.B. Genome-Scale Identification, Classification, and Tissue Specific Expression Analysis of Late Embryogenesis Abundant (LEA) Genes under Abiotic Stress Conditions in Sorghum bicolor L. PLoS ONE 2019, 14, e0209980. [Google Scholar] [CrossRef]
  44. Cao, J.; Li, X. Identification and Phylogenetic Analysis of Late Embryogenesis Abundant Proteins Family in Tomato (Solanum lycopersicum). Planta 2015, 241, 757–772. [Google Scholar] [CrossRef]
  45. Ding, M.; Wang, L.; Zhan, W.; Sun, G.; Jia, X.; Chen, S.; Ding, W.; Yang, J. Genome-Wide Identification and Expression Analysis of Late Embryogenesis Abundant Protein-Encoding Genes in Rye (Secale cereale L.). PLoS ONE 2021, 16, e0249757. [Google Scholar] [CrossRef]
  46. Lan, T.; Gao, J.; Zeng, Q.Y. Genome-Wide Analysis of the LEA (Late Embryogenesis Abundant) Protein Gene Family in Populus Trichocarpa. Tree Genet. Genomes 2013, 9, 253–264. [Google Scholar] [CrossRef]
  47. Singh, C.M.; Kumar, M.; Pratap, A.; Tripathi, A.; Singh, S.; Mishra, A.; Kumar, H.; Nair, R.M.; Singh, N.P. Genome-Wide Analysis of Late Embryogenesis Abundant Protein Gene Family in Vigna Species and Expression of VrLEA Encoding Genes in Vigna Glabrescens Reveal Its Role in Heat Tolerance. Front. Plant Sci. 2022, 13, 843107. [Google Scholar] [CrossRef]
  48. Giménez, M.J.; Pistón, F.; Atienza, S.G. Identification of Suitable Reference Genes for Normalization of QPCR Data in Comparative Transcriptomics Analyses in the Triticeae. Planta 2011, 233, 163–173. [Google Scholar] [CrossRef]
  49. Livak, K.J.; Schmittgen, T.D. Analysis of Relative Gene Expression Data Using Real-Time Quantitative PCR and the 2-ΔΔCT Method. Methods 2001, 25, 402–408. [Google Scholar] [CrossRef]
  50. Zaïdi, I.; Ebel, C.; Touzri, M.; Herzog, E.; Evrard, J.L.; Schmit, A.C.; Masmoudi, K.; Hanin, M. TMKP1 Is a Novel Wheat Stress Responsive MAP Kinase Phosphatase Localized in the Nucleus. Plant Mol. Biol. 2010, 73, 325–338. [Google Scholar] [CrossRef]
  51. Bradford, M.M. A Rapid and Sensitive Method for the Quantitation of Microgram Quantities of Protein Utilizing the Principle of Protein-Dye Binding. Anal. Biochem. 1976, 72, 248–254. [Google Scholar] [CrossRef]
  52. Zaidi, I.; González, A.; Touzri, M.; Alvarez, M.C.; Ramos, J.; Masmoudi, K.; Ariño, J.; Hanin, M. The Wheat MAP Kinase Phosphatase 1 Confers Higher Lithium Tolerance in Yeast. FEMS Yeast Res. 2012, 12, 774–784. [Google Scholar] [CrossRef]
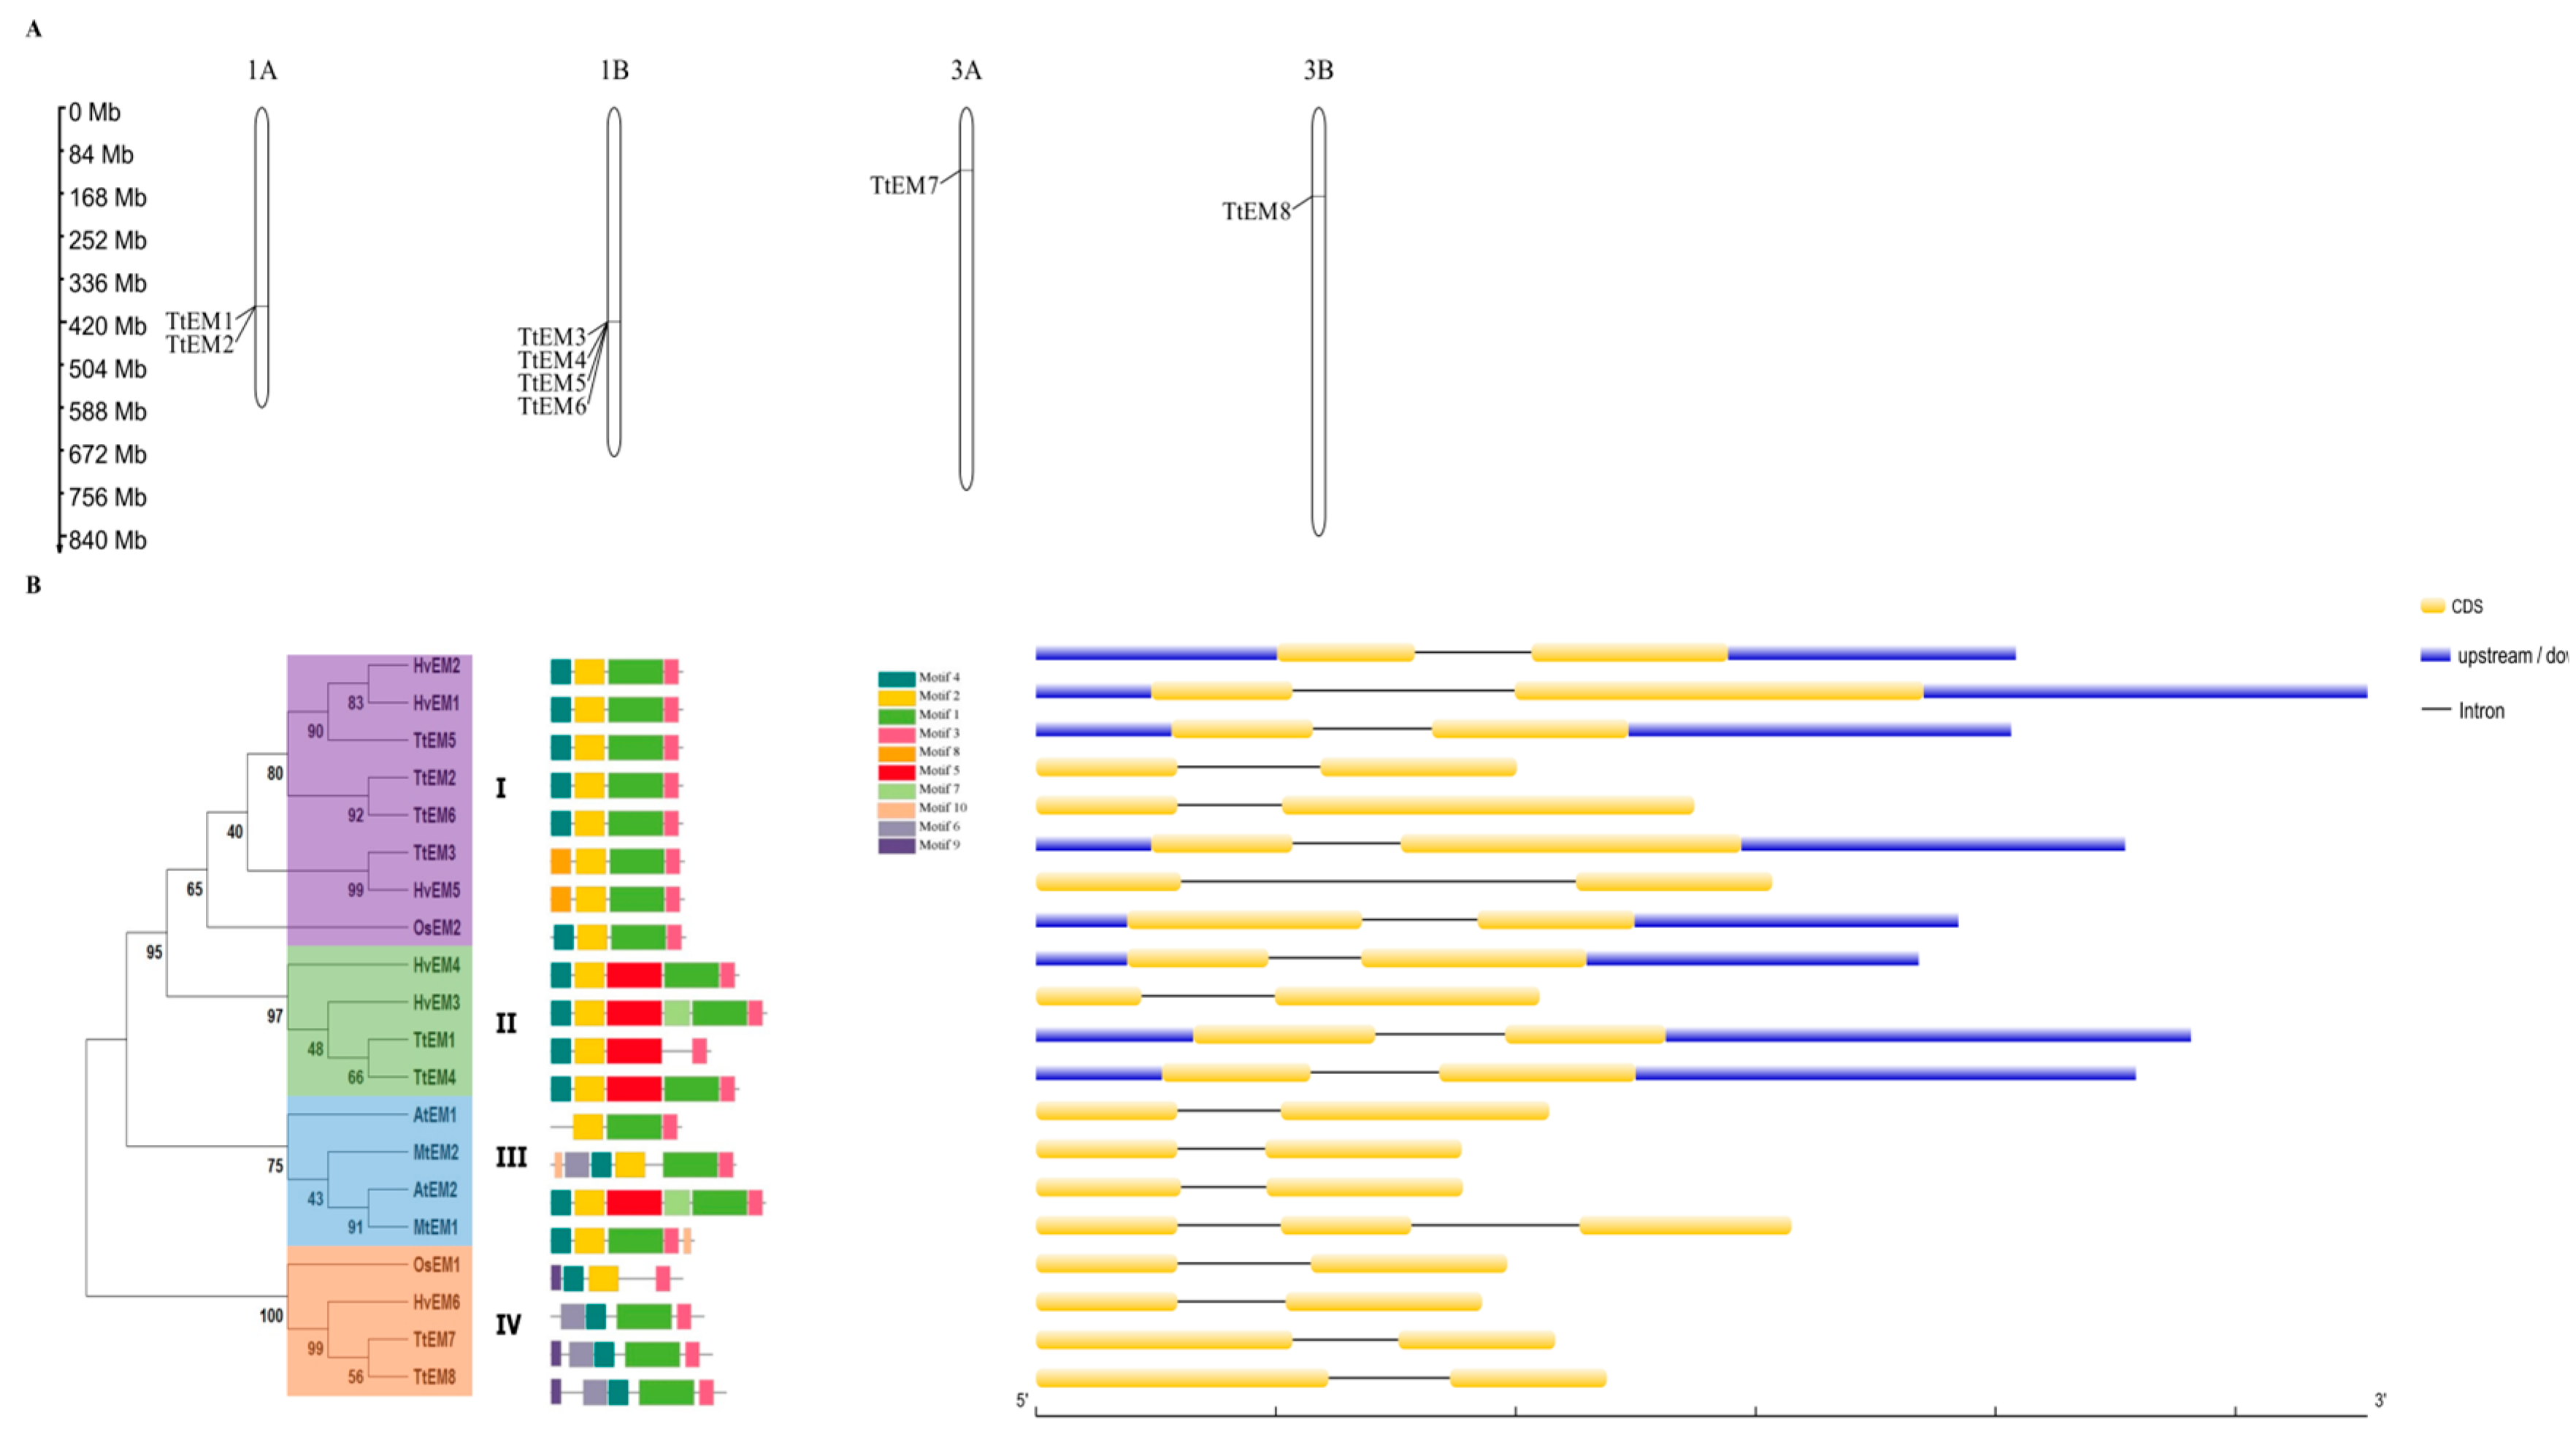
Figure 1. Chromosomal distribution and phylogenetic relationships. (A) Chromosome distributions of TtEM genes in Triticum turgidum. The scale of the chromosome is in millions of bases (Mb). (B) phylogenetic tree, conserved motifs, and gene structures of TtEM genes (Triticum turgidum), HvEM genes (Hordeum vulgare), AtEM genes (Arabidopsis thaliana), and MtEM genes (Medicago truncatula). The phylogenetic tree on the left side was constructed using MEGA.11. Four clades are represented in four different colors. Conserved motifs are counted and marked in colored boxes.
Plants 14 02817 g001
Figure 2. Predicted hormone response, abiotic and biotic stress response, transcription factors biding site, and growth- and development-related cis-elements within the promoter regions of TtEM genes. The values in the box represent the numbers of cis-elements.
Plants 14 02817 g002
Figure 3. Relative expression levels of TtEM1 and TtEM4 genes. (A) Analysis of the expression patterns of TtEM1 and TtEM4 across different organs of Om Rabiaa variety after anthesis, ear (Sp1, after 2 days; Sp2, after 4 days; and Sp3, after 7 days), seeds (Sd1, after 4 days; Sd2, after 7 days; and Sd3, after 14 days), endosperm (Ed1, after 14 days), embryo (Em1, after 14 days; and Em2, after 21 days), leaves (OL), stems (St), and anthers (Ant). (B) Expression patterns of TtEM1 and TtEM4 in leaves of Om Rabiaa variety. (C) Expression profiles of TtEM1 and TtEM4 in roots of Om Rabiaa variety. (Ct) without treatment, after 4 h and 24 h of stress treatments with 100 μM ABA, cold (4 °C), heat (42 °C), 200 mM NaCl, 100 mM mannitol, and 20% PEG6000. Each bar value represents the mean ± SD based on triplicate experiments. Statistical significance of the difference was determined by two-way ANOVA: **** p < 0.0001, *** p < 0.001, ** p < 0.01, and * p < 0.05.
Plants 14 02817 g003
Figure 4. Analysis of the intrinsically disordered nature of TtEM1 and TtEM4 proteins. (A) SDS-PAGE analysis of TtEM1 (a) and TtEM4 (b) overexposed in E. coli BL21strain and Western blot analysis using a specific antibody anti-His (c). M, protein marker. BI, cells transformed with pET28a (+)-TtEM1or TtEM4 before induction; AI, cells transformed with pET28a (+)-TtEM1orTtEM4 after induction; P, purified TtEM1 or TtEM4 protein. (B) Heat stability of TtEM1 and TtEM4: TtEM1, TtEM4, BSA, and lysozyme were (+) or were not (−) incubated at 100 °C for 30 min (a) and for one hour (b). The supernatants were run on SDS-PAGE after centrifugation. (C) Limited proteolysis of TtEM1 (a) or TtEM4 (b) and lysozyme (c) with thermolysin (T). Incubation was performed for 30 s, 3 h, and 24 h, (−) without treatment, (T) incubated with thermolysin, and (+T+G) incubated with thermolysin and glycerol (25%). The reactions were stopped by adding SDS-PAGE loading buffer and heating for 5 min at 100 °C.
Plants 14 02817 g004
Figure 5. Protection of lactate dehydrogenase (LDH) by TtEM1 and TtEM4 proteins under stress treatment. (A) LDH activity measured after desiccation in presence and absence of TtEM1 and TtEM4 proteins. (B) After 30 min of heat treatment in 45 °C. (C) After two freeze–thaw cycles. BSA was used as positive control, and the enzymatic activity of non-treated LDH is referred to as 100%. Each column represents the mean of three replicates, and error bars indicate the standard deviation. Statistical significance of the difference was determined by two-way ANOVA: **** p < 0.0001, *** p < 0.001, and ns is p > 0.05.
Plants 14 02817 g005
Figure 6. Overexpression enhances tolerance to abiotic stress in recombinant yeast cells. (A,C,F) Growth curves of yeast transformed by the empty vector pYES2, pYES2-TtEM1, and pYES2-TtEM4 under standard conditions. (B,D,E,G,H) Growth curves of yeast transformed by the empty vector pYES2, pYES2-TtEM1, and pYES2-TtEM4 after treatment to the heat (42 °C), oxidative stress (H2O2 2 mM), cold (−20 °C), osmotic stress (mannitol 1 M), and drought stress PEG (10%), respectively. Growth is measured at a wavelength of 600 nm. Each data point represents an average of three replicates, and error bars represent standard deviations. Statistical significance of the difference was determined by two-way ANOVA: **** p < 0.0001, *** p < 0.001, and * p < 0.05.
Plants 14 02817 g006
Table 1. Physiochemical proprieties of TtEM proteins.
NameNumber of Amino AcidsMolecular Weight (kDa)Theoretical pIGrand Average of Hydropathicity (GRAVY)Predicted α-Helical Content (%) (SOPMA)Tendency of Disorder (%) (PONDR)Predicted Subcellular Localization
TtEM111312.3335.23−1.38841.5999.23Nucleus
TtEM29310.0175.57−1.40333.3398.92Nucleus
TtEM39410.0025.29−1.32837.2398.94Nucleus
TtEM413314.6045.56−1.47445.1399.25Nucleus
TtEM5939.9625.56−1.37536.5698.92Nucleus
TtEM6939.9485.25−1.36334.4198.92Nucleus
TtEM711412.5755.27−1.36142.98100Nucleus
TtEM812413.6945.17−1.30845.16100Nucleus
Table 2. Conserved motifs detected by MEME tools in TtEM proteins.
MotifLogo
1Plants 14 02817 i001
2Plants 14 02817 i002
3Plants 14 02817 i003
4Plants 14 02817 i004
5Plants 14 02817 i005
6Plants 14 02817 i006
7Plants 14 02817 i007
8Plants 14 02817 i008
9Plants 14 02817 i009
10Plants 14 02817 i010
Disclaimer/Publisher’s Note: The statements, opinions and data contained in all publications are solely those of the individual author(s) and contributor(s) and not of MDPI and/or the editor(s). MDPI and/or the editor(s) disclaim responsibility for any injury to people or property resulting from any ideas, methods, instructions or products referred to in the content.