Article

An Investigation into the Evolutionary Characteristics and Expression Patterns of the Basic Leucine Zipper Gene Family in the Endangered Species Phoebe bournei Under Abiotic Stress Through Bioinformatics

1
College of Forestry, Fujian Agriculture and Forestry University, Fuzhou 350002, China
2
Fujian Provincial Key Laboratory of Haixia Applied Plant Systems Biology, Synthetic Biology Center, Haixia Institute of Science and Technology, Fujian Agriculture and Forestry University, Fuzhou 350002, China
3
College of Life Sciences, Fujian Agriculture and Forestry University, Fuzhou 350002, China
4
Department of Agrifood, Environmental and Animal Sciences, Università degli Studi di Udine, Via Palladio, 8, 33100 Udine, UD, Italy
*
Authors to whom correspondence should be addressed.
These authors contributed equally to this work.
Plants 2025, 14(15), 2292; https://doi.org/10.3390/plants14152292
Submission received: 19 June 2025 / Revised: 20 July 2025 / Accepted: 24 July 2025 / Published: 25 July 2025
(This article belongs to the Special Issue Advances in Forest Tree Genetics and Breeding)

Abstract

The bZIP gene family play a crucial role in plant growth, development, and stress responses, functioning as transcription factors. While this gene family has been studied in several plant species, its roles in the endangered woody plant Phoebe bournei remain largely unclear. This study comprehensively analyzed the PbbZIP gene family in P. bournei, identifying 71 PbbZIP genes distributed across all 12 chromosomes. The amino acid count in these genes ranged from 74 to 839, with molecular weights varying from 8813.28 Da to 88,864.94 Da. Phylogenetic analysis categorized the PbbZIP genes into 12 subfamilies (A-K, S). Interspecific collinearity analysis revealed homologous PbbZIP genes between P. bournei and Arabidopsis thaliana. A promoter cis-acting element analysis indicated that PbbZIP genes contain various elements responsive to plant hormones, stress signals, and light. Additionally, expression analysis of public RNA-seq data showed that PbbZIP genes are distributed across multiple tissues, exhibiting distinct expression patterns specific to root bark, root xylem, stem bark, stem xylem, and leaves. We also performed qRT-PCR analysis on five representative PbbZIP genes (PbbZIP14, PbbZIP26, PbbZIP32, PbbZIP67, and PbbZIP69). The results demonstrated significant differences in the expression of PbbZIP genes under various abiotic stress conditions, including salt stress, heat, and drought. Notably, PbbZIP67 and PbbZIP69 exhibited robust responses under salt or heat stress conditions. This study confirmed the roles of the PbbZIP gene family in responding to various abiotic stresses, thereby providing insights into its functions in plant growth, development, and stress adaptation. The findings lay a foundation for future research on breeding and enhancing stress resistance in P. bournei.

1. Introduction

Adverse environmental factors, such as drought, salinity, and extreme temperatures, significantly impact plant growth and yield [1]. To cope with these stresses, plants have evolved complex defense mechanisms, including signaling pathways mediated by receptor-like kinases (RLKs), phosphatases, protein kinases, and transcription factors [2]. RLKs play a crucial role in initiating downstream signaling cascades. They regulate gene expression and metabolic processes, enabling plants to adapt to and survive under adverse conditions [3]. In the signaling pathways, protein phosphorylation acts as a molecular switch, modulating the activity of various proteins associated with stress responses [4]. In addition, transcription factors enhance plant tolerance to harsh environments by coordinating the expression of stress-responsive genes [5,6].
The basic leucine zipper (bZIP) transcription factor family is widely found in eukaryotes. bZIP proteins consist of two domains: a basic region (N-x7-R/K-x9) for sequence-specific DNA binding and a leucine zipper domain for protein dimerization [7]. This unique structure allows bZIP transcription factors to form homodimers or heterodimers with other transcription factors. They can then recognize and bind to specific cis-acting elements in the promoters of target genes, such as the ACGT core sequence (A-box, C-box, and G-box), and regulate gene expression accordingly [8,9]. Researchers have successfully identified members of the bZIP transcription factor family in various plant species, including Arabidopsis thaliana (L.) [9], Oryza sativa L. [7], Zea mays L. [10], Juglans regia L. [11], Populus L. [12], Ziziphus jujuba Mill. [13], and Carthamus tinctorius L. [14]. As indicated by numerous studies, putative bZIP genes are categorized into several groups based on the sequence similarity of their basic regions and conserved motifs. While the AtbZIP gene family in A. thaliana is classified into 13 subfamilies, the bZIP proteins in rice are divided into 11 groups based on DNA-binding specificity and amino acid sequence prediction. Despite the difference in the number of groups within the bZIP gene family between rice (11 groups) and A. thaliana (13 groups), the membership of these groups shows similarity. bZIP transcription factors are crucial regulatory elements in plants’ responses to abiotic stresses such as salt, drought, and temperature [15,16,17,18]. For example, studies on O. sativa and A. thaliana have demonstrated that specific bZIP genes are up-regulated in response to salt stress, thereby enhancing stress tolerance through ion homeostasis and antioxidant mechanisms [19,20]. In Arabidopsis, bZIP37 (ABF3) directly induces the expression of late embryo abundant (LEA) genes by participating in stomatal closure and reprogramming metabolic processes. It also accumulates intracellular protective osmoregulatory substances, thereby protecting cellular water supply, reducing water evaporation, and adapting to drought-stressed environments [21].
Additionally, the subcellular localization of bZIPs is also regulated by abiotic stress. For example, it has been shown that bZIP52 and bZIP18 play a significant repressive role in the nucleus, and their mutations result in nearly twice as many down-regulated differentially expressed genes as up-regulated differentially expressed genes [22]. Arabidopsis bZIP52 and bZIP18 proteins are dephosphorylated, rendering them incapable of interacting with 14-3-3 proteins and causing their dissociation and subsequent translocation to the nucleus. This enables them to enter the nucleus and co-regulate the expression of many genes, thereby adapting to changes in the heat stress environment [22]. Additionally, bZIP transcription factors from A. thaliana, including bZIP16, bZIP68, and GBF1, are reported to regulate the formation of photosynthetically active chloroplasts in response to light. These proteins modulate gene expression that is critical for plant development across various environmental conditions. Notably, their function is influenced by the redox state of a conserved cysteine residue, acting as a molecular switch for regulating light-responsive genes [23].
Phoebe bournei (Hemsl.), a precious evergreen tree in the Lauraceae family, is distributed across southern Chinese provinces, including Fujian, Jiangxi, and Guangdong [24]. Its high-quality timber is used in furniture, construction, and traditional Chinese medicine [25,26]. However, it is now endangered due to over-exploitation and habitat loss, prompting significant conservation and afforestation efforts [27,28]. Like many plants, it faces various abiotic stresses, including drought, extreme temperatures, and salinity [29,30,31,32,33]. For example, salt stress can significantly reduce plant growth, productivity, and survival rates through the effects of ion toxicity, osmotic stress, and oxidative damage. To adapt to these conditions, plants must activate complex internal regulatory networks, including transcriptional-level changes [34,35,36].
Given the key role of bZIP genes in plant abiotic stress tolerance, studying the P. bournei bZIP gene family is highly significant. It can clarify the molecular mechanisms of stress resistance, offering theoretical support for conservation and breeding. Identifying and analyzing this gene family can also reveal its functions in growth, development, and stress responses, providing valuable genetic resources to enhance P. bournei’s stress tolerance.
This study aims to identify P. bournei bZIP transcription factors and analyze their gene structure, chromosomal location, duplication events, expression patterns, and response to abiotic stresses (salt, high temperature, and osmotic stress). It will also compare them with Arabidopsis bZIP genes to explore their evolutionary and functional relationships across species. The findings will provide a theoretical basis for enhancing P. bournei’s tolerance to abiotic stress and offer valuable resources for its breeding and conservation strategies.

2. Materials and Methods

2.1. Plant Material, Data Sources, and Conditions for Growth

The genome sequence data and annotation information of P. bournei were downloaded from the sequence archive of the China National Gene Bank Database (Accession Number: CNA0029376 (https://db.cngb.org/search/assembly/CNA0029376/ (accessed on 4 May 2024))). The A. thaliana genome sequence file was obtained from EnsemblPlants (https://plants.ensembl.org/Arabidopsis_thaliana/Info/Index/ (accessed on 4 May 2024)). We conducted the experiments at the Fujian Academy of Forestry in China, where the seedlings were grown outdoors for ten months in red soil with a pH of 5 and a soil organic matter content of 2.57% to 6.07%. The growing area had an average annual temperature of 16–20 °C, with an average yearly precipitation of 900–2100 mm and a relative humidity of about 77%.

2.2. The PbbZIP Gene Identification and Physicochemical Characteristics

To identify the bZIP gene family members in P. bournei, we first obtained the protein sequences of A. thaliana bZIP genes from the TAIR database (https://www.arabidopsis.org/ (accessed on 6 May 2024)). Subsequently, using the TBtools-II v 2.10 software, we accurately extracted CDS sequences from the genome annotation information of P. bournei and simplified them into protein files. Then, we compared the protein sequences of the bZIP gene family from A. thaliana with the corresponding sequences of P. bournei and conducted a BLASTP search on NCBI to consult the annotation information of P. bournei. We then preliminarily screened out the bZIP family protein sequences of P. bournei. To further verify and identify bZIP gene family members, we downloaded the HMM of the bZIP conserved domain (PF00170, PF03131, PF07716) from the Pfam database and used HMMER-3.2.1 (https://www.ncbi.nlm.nih.gov/Structure/bwrpsb/bwrpsb.cgi (accessed on 8 May 2024)) for the search. The expected value was set to less than 10−5, and all other parameters were kept as their default values. By comparing the protein sequences obtained via BLASTp and HMMER, we selected the consistent sequences for subsequent analysis [37,38]. The physical and chemical properties of the identified bZIP gene family were calculated using the ExPASy website (https://www.expasy.org/ (accessed on 10 May 2024)), with indicators such as isoelectric point, number of amino acid residues, and molecular weight. Subcellular localization prediction analysis was also performed using the WOLF PSORT website (https://wolfpsort.hgc.jp/ (accessed on 10 May 2024)) [39].

2.3. PbbZIP Gene Family Chromosomal Distribution

Chromosomal distribution and gene density information for bZIP family members were extracted from the P. bournei GFF file using TBtools-IIv2.10, and a chromosomal distribution map of bZIP genes was constructed.

2.4. Construction and Analysis of Evolutionary Tree and Collinearity Analysis

To gain an in-depth understanding of the differences and evolutionary relationships among bZIP sequences across various species, this study utilized MEGA7.0 software for a comparative analysis of bZIP sequences from P. bournei and A. thaliana. During the process, default parameters were applied, with the bootstrap value set to 1000 replicates. The neighbor-joining method and p-distance model were selected for constructing the phylogenetic tree, ensuring the reliability of the findings. Subsequently, we made changes to the phylogenetic tree and assigned nodes using the Evolview website (https://evolgenius.info/evolview-v2/ (accessed on 28 August 2024)) for a more intuitive and clear presentation of the research outcomes. The TBtools program was used to determine their relationship. The plant genome database provided the whole-genome sequences and gene annotation files of two species, which were used to identify the standard features of the homologous bZIP gene family in P. borynei and A. thaliana. The Commonality Analysis Atlas was created using TBtools-v2.10 software. To examine selection pressure, we used the Ka/Ks_Calculator tool within TBtools to calculate the nonsynonymous substitution rate (Ka), the synonymous substitution rate (Ks), and their ratio (Ka/Ks). The calculation utilized the YN model implemented in the Ka/Ks_Calculator, with a threshold of Ka/Ks = 1 set to indicate positive selection [40]. TBtools was used for grepping the chromosomal location information of the PbbZIP genes from the genome (FASTA) file and the annotation (GFF) file of P. bournei. Gene duplication and syntenic relationships of PbbZIP were determined using MCScanX (https://smart.embl.de/ (accessed on 12 July 2025)) with default parameters and plotted using TBtools-v2.10.

2.5. Motif Analysis and Gene Structure of the PbbZIPs

We found the conserved motifs in PbbZIP proteins using the online tool MEME Suite 5.4.1 (http://meme-suite.org/ (accessed on 28 August 2024)). The maximum number of motifs was set to 25, and the motif sites corresponded to a ZOOPS (Zero or One Occurrence Per Sequence) model [41]. GFF (Generic Feature Format) annotation files from the P. bournei genome were used to determine the intron–exon location of the PbbZIP genes. TBtools were used to visualize the gene structure and motifs [42].

2.6. Examination of Cis-Elements in the Promoters of PbbZIP Genes

In P. bournei, TBtools was used to extract the promoter sequences of bZIP genes, where the sequence 2000 bp upstream of the transcription start site was designated as the target for analysis. These promoter sequences were then submitted to the PlantCARE website (http://bioinformatics.psb.ugent.be/webtools/plantcare/html, accessed on 28 August 2024) for analysis. The output data underwent filtering and processing, during which the exact start and end positions of the promoters were determined. Finally, TBtools was employed once more to visualize the analysis results.

2.7. Transcriptome Data Acquisition and Abiotic Stress Treatment of Different Plant Tissues

In this study, we searched the P. bournei gene PRJNA628065 in the European Bioinformatics Institute (EBI) database (https://www.ebi.ac.uk (accessed on 28 August 2024) and successfully retrieved transcriptomic expression data for five different tissues of P. bournei. The TBtools were used to evaluate gene expression data and create a gene expression heat map using annual seedlings purchased from the Fujian Academy of Forestry. The seedlings were cultivated in an artificial climate box with various treatments. P. bournei seedlings with comparable growth potential were selected for treatment. These P. bournei seedlings were then subjected to specific treatment regimens. Among them, three P. bournei seedlings were designated as the control group, while the remaining materials were divided into two groups: a control group and a stress treatment group. After the treatments, leaf samples were collected and stored in liquid nitrogen at −80 °C for RNA extraction. The seedlings in the treatment group were soaked in a nutrient solution containing 10% PEG to simulate drought. The control group seedlings were soaked in distilled water. A 10% NaCl nutrient solution was applied to the group receiving the salt treatment. For temperature treatment, the treatment group was incubated at 40 °C, while the control group remained at room temperature. All samples were incubated in an artificial climate incubator set at a temperature of 25 °C and a relative humidity of 75%. The control group was sampled at 0 h, and the treatment groups were sampled at 6 h, 12 h, and 24 h.

2.8. Abiotic Stress Experiment and qRT-PCR Analysis

RNA was extracted from the collected plant samples, and the levels of target gene expression were monitored using a quantitative reverse transcriptase PCR (RT-qPCR) assay. A heat map labeled with correlation clusters was created using the Spearman correlation algorithm to represent the relationships between patterns of gene expression [43]. Total RNA was extracted from both the stress-treated samples and the control samples using an RNA extraction kit (Omega Bio-TEK, Shanghai, China). According to the manufacturer’s instructions, cDNA was synthesized using EasyScript® One-Step gDNA Removal and cDNA Synthesis SuperMix (Transgen, Beijing, China). TransStart® top green qPCR SuperMix (Transgen, Beijing, China) was used for RT-qPCR. The internal reference gene used was PbEF1α (GenBank No. KX682032), and Table 1 lists the primers used. The comparative delta–delta Ct approach was utilized to determine the relative transcript levels. Subsequently, a one-way ANOVA, accompanied by Duncan’s multiple range tests at a 95% confidence interval, was performed using the GraphPad Prism 10.12 software. (https://www.graphpad.com/ (accessed on 28 August 2024)) [44,45]. Three biological replicates and three technical replicates are used for each quantitative PCR [46].

3. Results

3.1. Identification and Physicochemical Characteristics of the PbbZIP Gene

According to the results, 71 PbbZIP genes were identified. PbbZIP1 was renamed to PbbZIP71 due to its gene distribution on chromosome 12 of P. bournei. Among these, the physical and chemical properties are integrated, as shown in Table 2. The number of amino acids ranged from 74 residues in PbbZIP15 to 839 residues in PbbZIP71, and the relative molecular weight varied from 8813.28 Da (PbbZIP15) to 88,864.94 Da (PbbZIP71). The theoretical isoelectric point (PI) was between 4.78 (PbbZIP26) and 11.45 (PbbZIP48). Based on the principle that amphiphilic proteins have a hydrophilicity index between −0.5 and +0.5 (negative values of the Grand Average of Hydropathy, GRAVY, indicate hydrophilicity, and positive values indicate hydrophobicity), it was found that the entire PbbZIP gene family showed negative GRAVY values, suggesting that most of them were amphiphilic proteins (Table 2). In addition, the predicted subcellular localizations of all the PbbZIPs were expected to be in the nucleus.

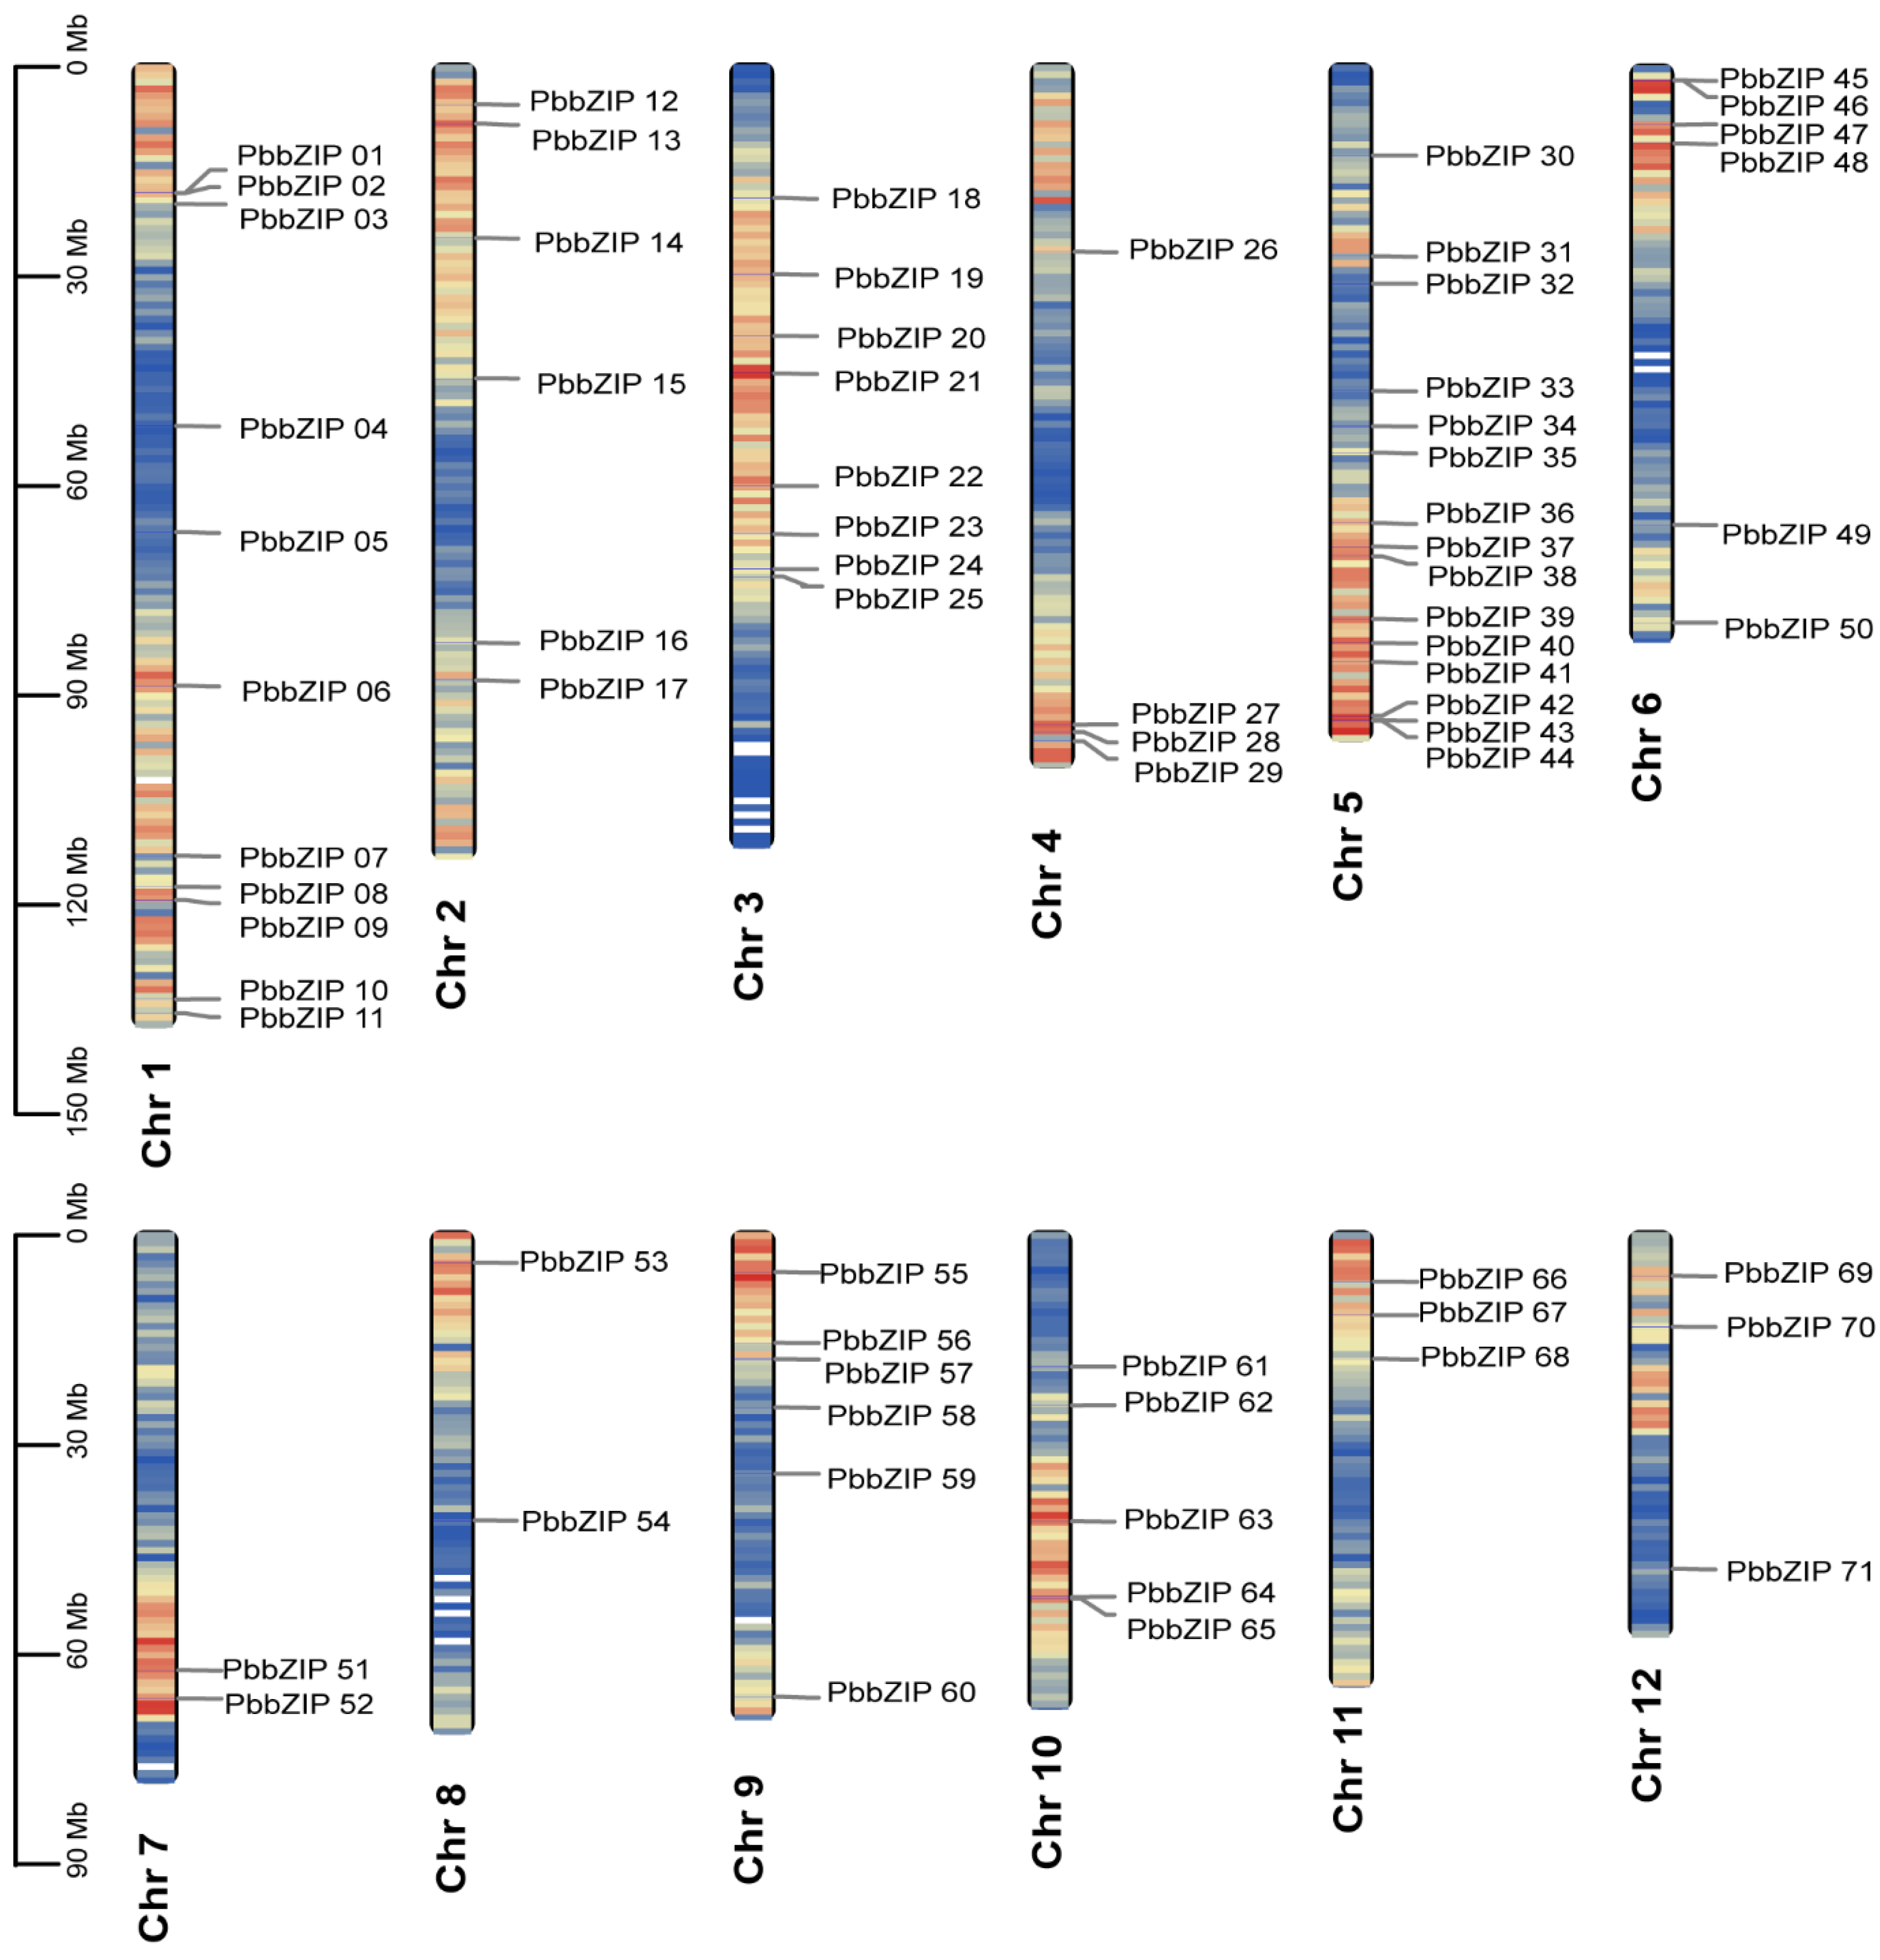
3.2. Chromosomal Localization of bZIP Genes in P. bournei

The chromosomal locations of the 71 PbbZIP genes identified in P. bournei are depicted in Figure 1. All observed genes were mapped to all 12 chromosomes, but were not evenly distributed. Each chromosome contained two to fifteen PbbZIP genes. For instance, chromosomes 7 and 8 had the fewest number of genes, with only two genes each: PbbZIP51 and PbbZIP52 on chromosome 7, and PbbZIP53 to PbbZIP54 on chromosome 8. In contrast, chromosome 5 had the most significant number of genes, ranging from PbbZIP30 to PbbZIP44. Additionally, chromosomes 1, 2, 3, 6, and 9 had more than five PbbZIP genes, respectively, with from PbbZIP1 to PbbZIP11 on chromosome 1, from PbbZIP12 to PbbZIP17 on chromosome 2, from PbbZIP18 to PbbZIP25 on chromosome 3, from PbbZIP45 to PbbZIP50 on chromosome 6, and from PbbZIP55 to PbbZIP60 on chromosome 9. Furthermore, PbbZIP26 to PbbZIP29 were located on chromosome 4. PbbZIP61 to PbbZIP65 were situated on chromosome 10, and PbbZIP66 to PbbZIP68 were positioned on chromosome 11, while PbbZIP69 to PbbZIP71 were positioned on chromosome 12. Such a distribution may be conducive to the functional diversification and synergistic interactions among the members of the gene family.

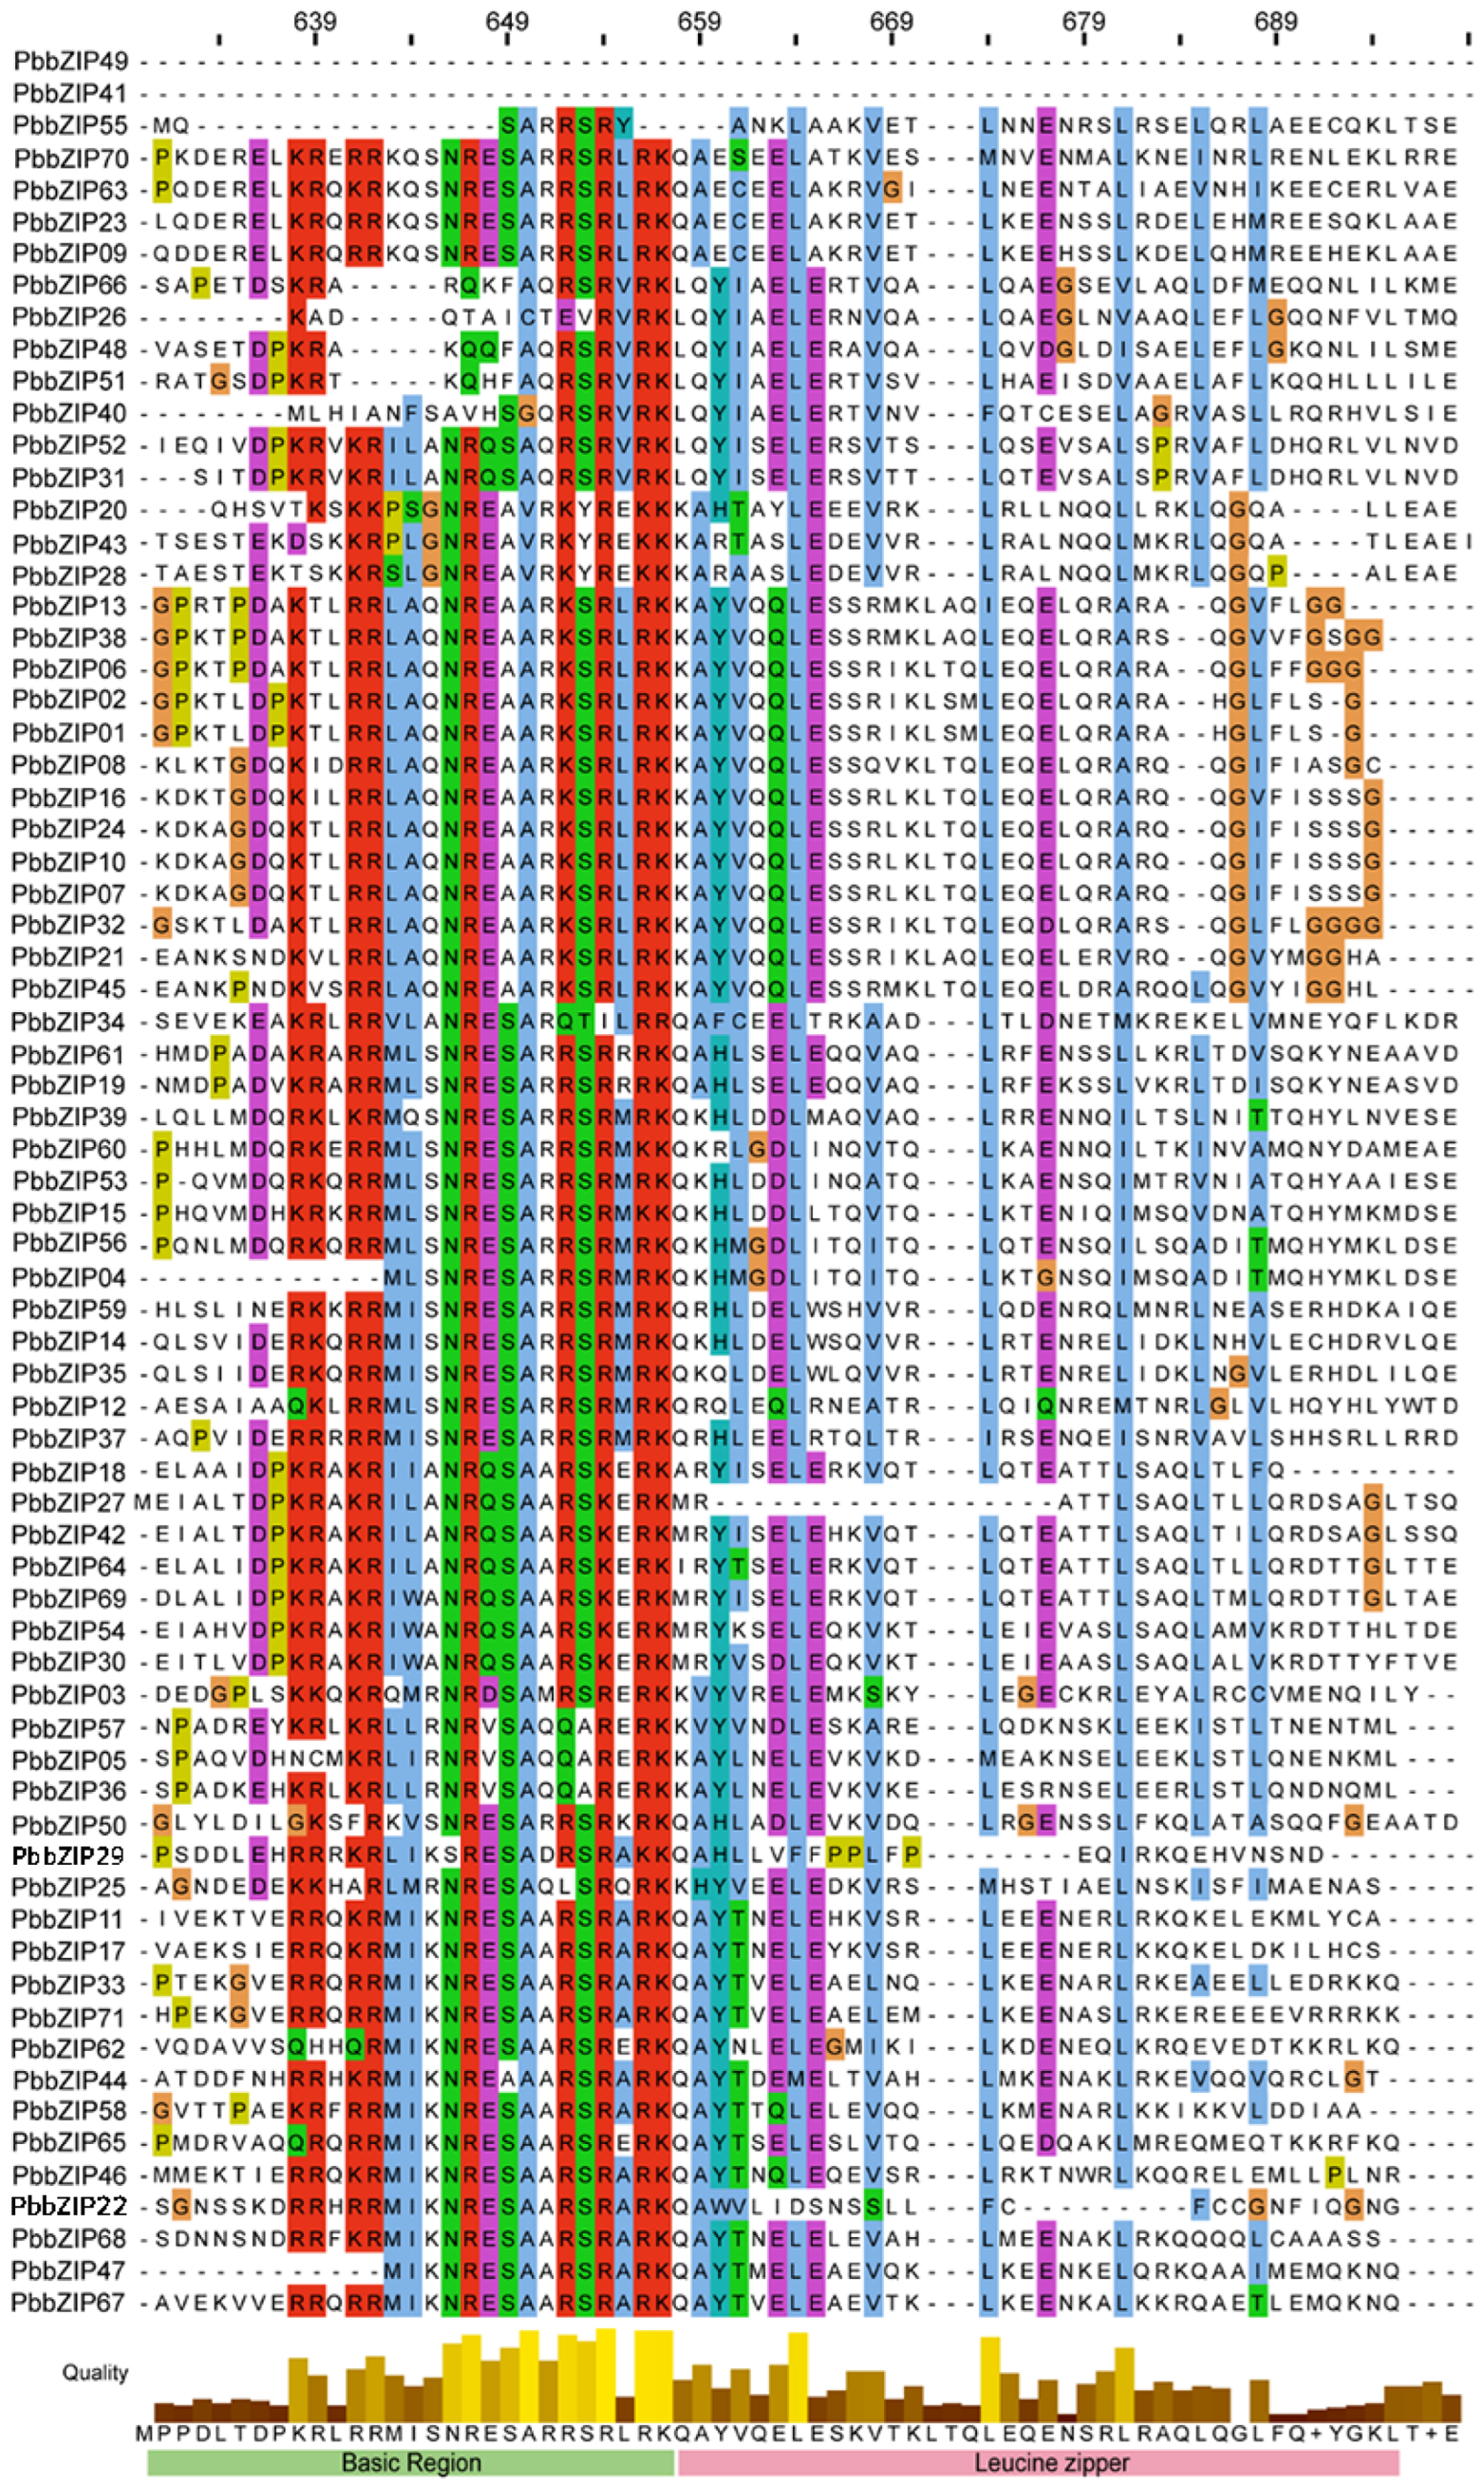
3.3. Multiple Sequence Alignment Analysis of the PbbZIP Gene Family

To further clarify the evolutionary relationships of bZIPs, we also conducted a multiple sequence alignment analysis. As demonstrated by our Pfam and SMART analyses, the 71 P. bournei proteins all possessed the bZIP domain, which was in line with our initial hypothesis. Consequently, after translating them into the amino acid sequences of each member from the bZIP-conserved domain [47,48], we carried out multiple sequence alignments. The results are displayed in Figure 2. The bZIP domain comprises a fundamental DNA-binding region and an adjacent leucine zipper structure. The NRxSA[R/K]RSRxRK motif is consistently present within the basic area. Intriguingly, a comparable conserved motif, “RHx[R/H]SxS”, has been recently reported in Arabidopsis and demonstrated to be a conserved phosphorylation motif [49]. Meanwhile, the leucine zipper domain consists of a heptapeptide repeat of leucine (L) or a related hydrophobic amino acid. These domains were also found in P. bournei bZIP proteins.

3.4. Phylogenetic and Co-Linearity Analysis of the PbbZIP Genes

By performing multiple sequence alignments of the 78 bZIP proteins from A. thaliana and the 71 bZIP proteins from P. bournei, a maximum likelihood phylogenetic tree was constructed using MEGA7.0 to depict the affinity and evolutionary relationship between species and genes. Based on the bZIP gene family classification system of A. thaliana, the P. bournei bZIP gene family was divided into 12 major subgroups, namely from Group A to group K, and Group S (Figure 3A) [9]. Among them, Group A was a fairly large family, forming an independent branch and consisting of 14 group members, including PbbZIP33, PbbZIP71, PbbZIP4, PbbZIP46, PbbZIP11, PbbZIP17, PbbZIP67, PbbZIP65, PbbZIP62, PbbZIP58, PbbZIP29, PbbZIP22, PbbZIP44, and PbbZIP68. In addition, Group D (PbbZIP38, PbbZIP01, PbbZIP02, PbbZIP08, PbbZIP13, PbbZIP06, PbbZIP24, PbbZIP45, PbbZIP21, PbbZIP32, PbbZIP10, PbbZIP07, and PbbZIP16) was also a relatively large group, and its members were in the same branch as Group F (PbbZIP20, PbbZIP43, and PbbZIP28), indicating they shared similarities. There was only one gene in Group B (PbbZIP25), which was positioned on a single branch by itself. Groups K (PbbZIP03) and H (PbbZIP36, PbbZIP05, and PbbZIP57) were small assemblages and possessed relatively high sequence identity. Groups I and E were large groups and were genetically conserved, including Group I with seven members (PbbZIP64, PbbZIP42, PbbZIP27, PbbZIP18, PbbZIP69, PbbZIP30, and PbbZIP54) and Group E with seven members (PbbZIP66, PbbZIP48, PbbZIP26, PbbZIP51, PbbZIP40, PbbZIP31, and PbbZIP52). Groups C, S, J, and G were situated within the same large branch, implying that they shared certain homologies. They were Group C (3 members) PbbZIP19, PbbZIP61, and PbbZIP50, S (12 members) PbbZIP35, PbbZIP14, PbbZIP59, PbbZIP37, PbbZIP12, PbbZIP49, PbbZIP39, PbbZIP60, PbbZIP53, PbbZIP15, PbbZIP04, and PbbZIP56, G (6 members) PbbZIP23, PbbZIP09, PbbZIP41, PbbZIP55, PbbZIP63, and PbbZIP70, and J with a single member PbbZIP34. To gain deeper insights our research revealed that, excluding chromosome 12, 11 of P. bournei’s 12 chromosomes exhibited collinearity with A. thaliana genes within the chromosomal position range of 003076.8 to 003071.7. Moreover, synteny analysis revealed 45 collinear gene pairs between the P. bournei PbbZIPs and the A. thaliana AtbZIPs (Figure 3B); notably, both members of each pair belong to the identical subfamily (Table 3). It suggests that the bZIP proteins of A. thaliana and P. bournei may share a common ancestor in their evolutionary history or follow similar evolutionary patterns in maintaining gene function and genomic structure.
In addition, to gain deeper insights into the evolutionary history of the PbbZIP gene family an intraspecific covariance analysis was performed (Figure 4). The results of this analysis revealed one tandem duplication event (involving PbbZIP56 and PbbZIP60) and twenty-one segmental duplication events (including gene pairs such as PbbZIP1 and PbbZIP38, PbbZIP5 and PbbZIP36, PbbZIP6 and PbbZIP13, PbbZIP24 with PbbZIP7 and PbbZIP10, PbbZIP9 and PbbZIP23, PbbZIP11 and PbbZIP17, PbbZIP12 and PbbZIP37, PbbZIP14 and PbbZIP35, PbbZIP15 with PbbZIP53 and PbbZIP56, PbbZIP19 and PbbZIP61, PbbZIP21 and PbbZIP45, PbbZIP22 with PbbZIP44 and PbbZIP68, PbbZIP26 with PbbZIP48 and PbbZIP66, PbbZIP28 and PbbZIP43, PbbZIP29 and PbbZIP44, PbbZIP31 and PbbZIP52, PbbZIP48 and PbbZIP66, and PbbZIP56 and PbbZIP60). The PbbZIP genes in Figure 4 that were not generated by duplication events may have originated from diverse mechanisms such as gene loss, independent origination, and transposition events. Our analysis suggests that some PbbZIP genes may have lost their homologous genes during evolution, thereby developing unique functions. Others may have emerged independently without clear duplication events. Additionally, some PbbZIP genes may have migrated within the genome through transposition mechanisms, leading to the formation of new genomic locations. These findings suggest that the PbbZIP transcription factor family is primarily composed of genes generated by large-scale segmental duplication events, with some genes arising from small-scale tandem duplication events. Furthermore, the distribution of these duplicated genes indicates potential functional or evolutionary connections between PbbZIP genes located on different chromosomes.

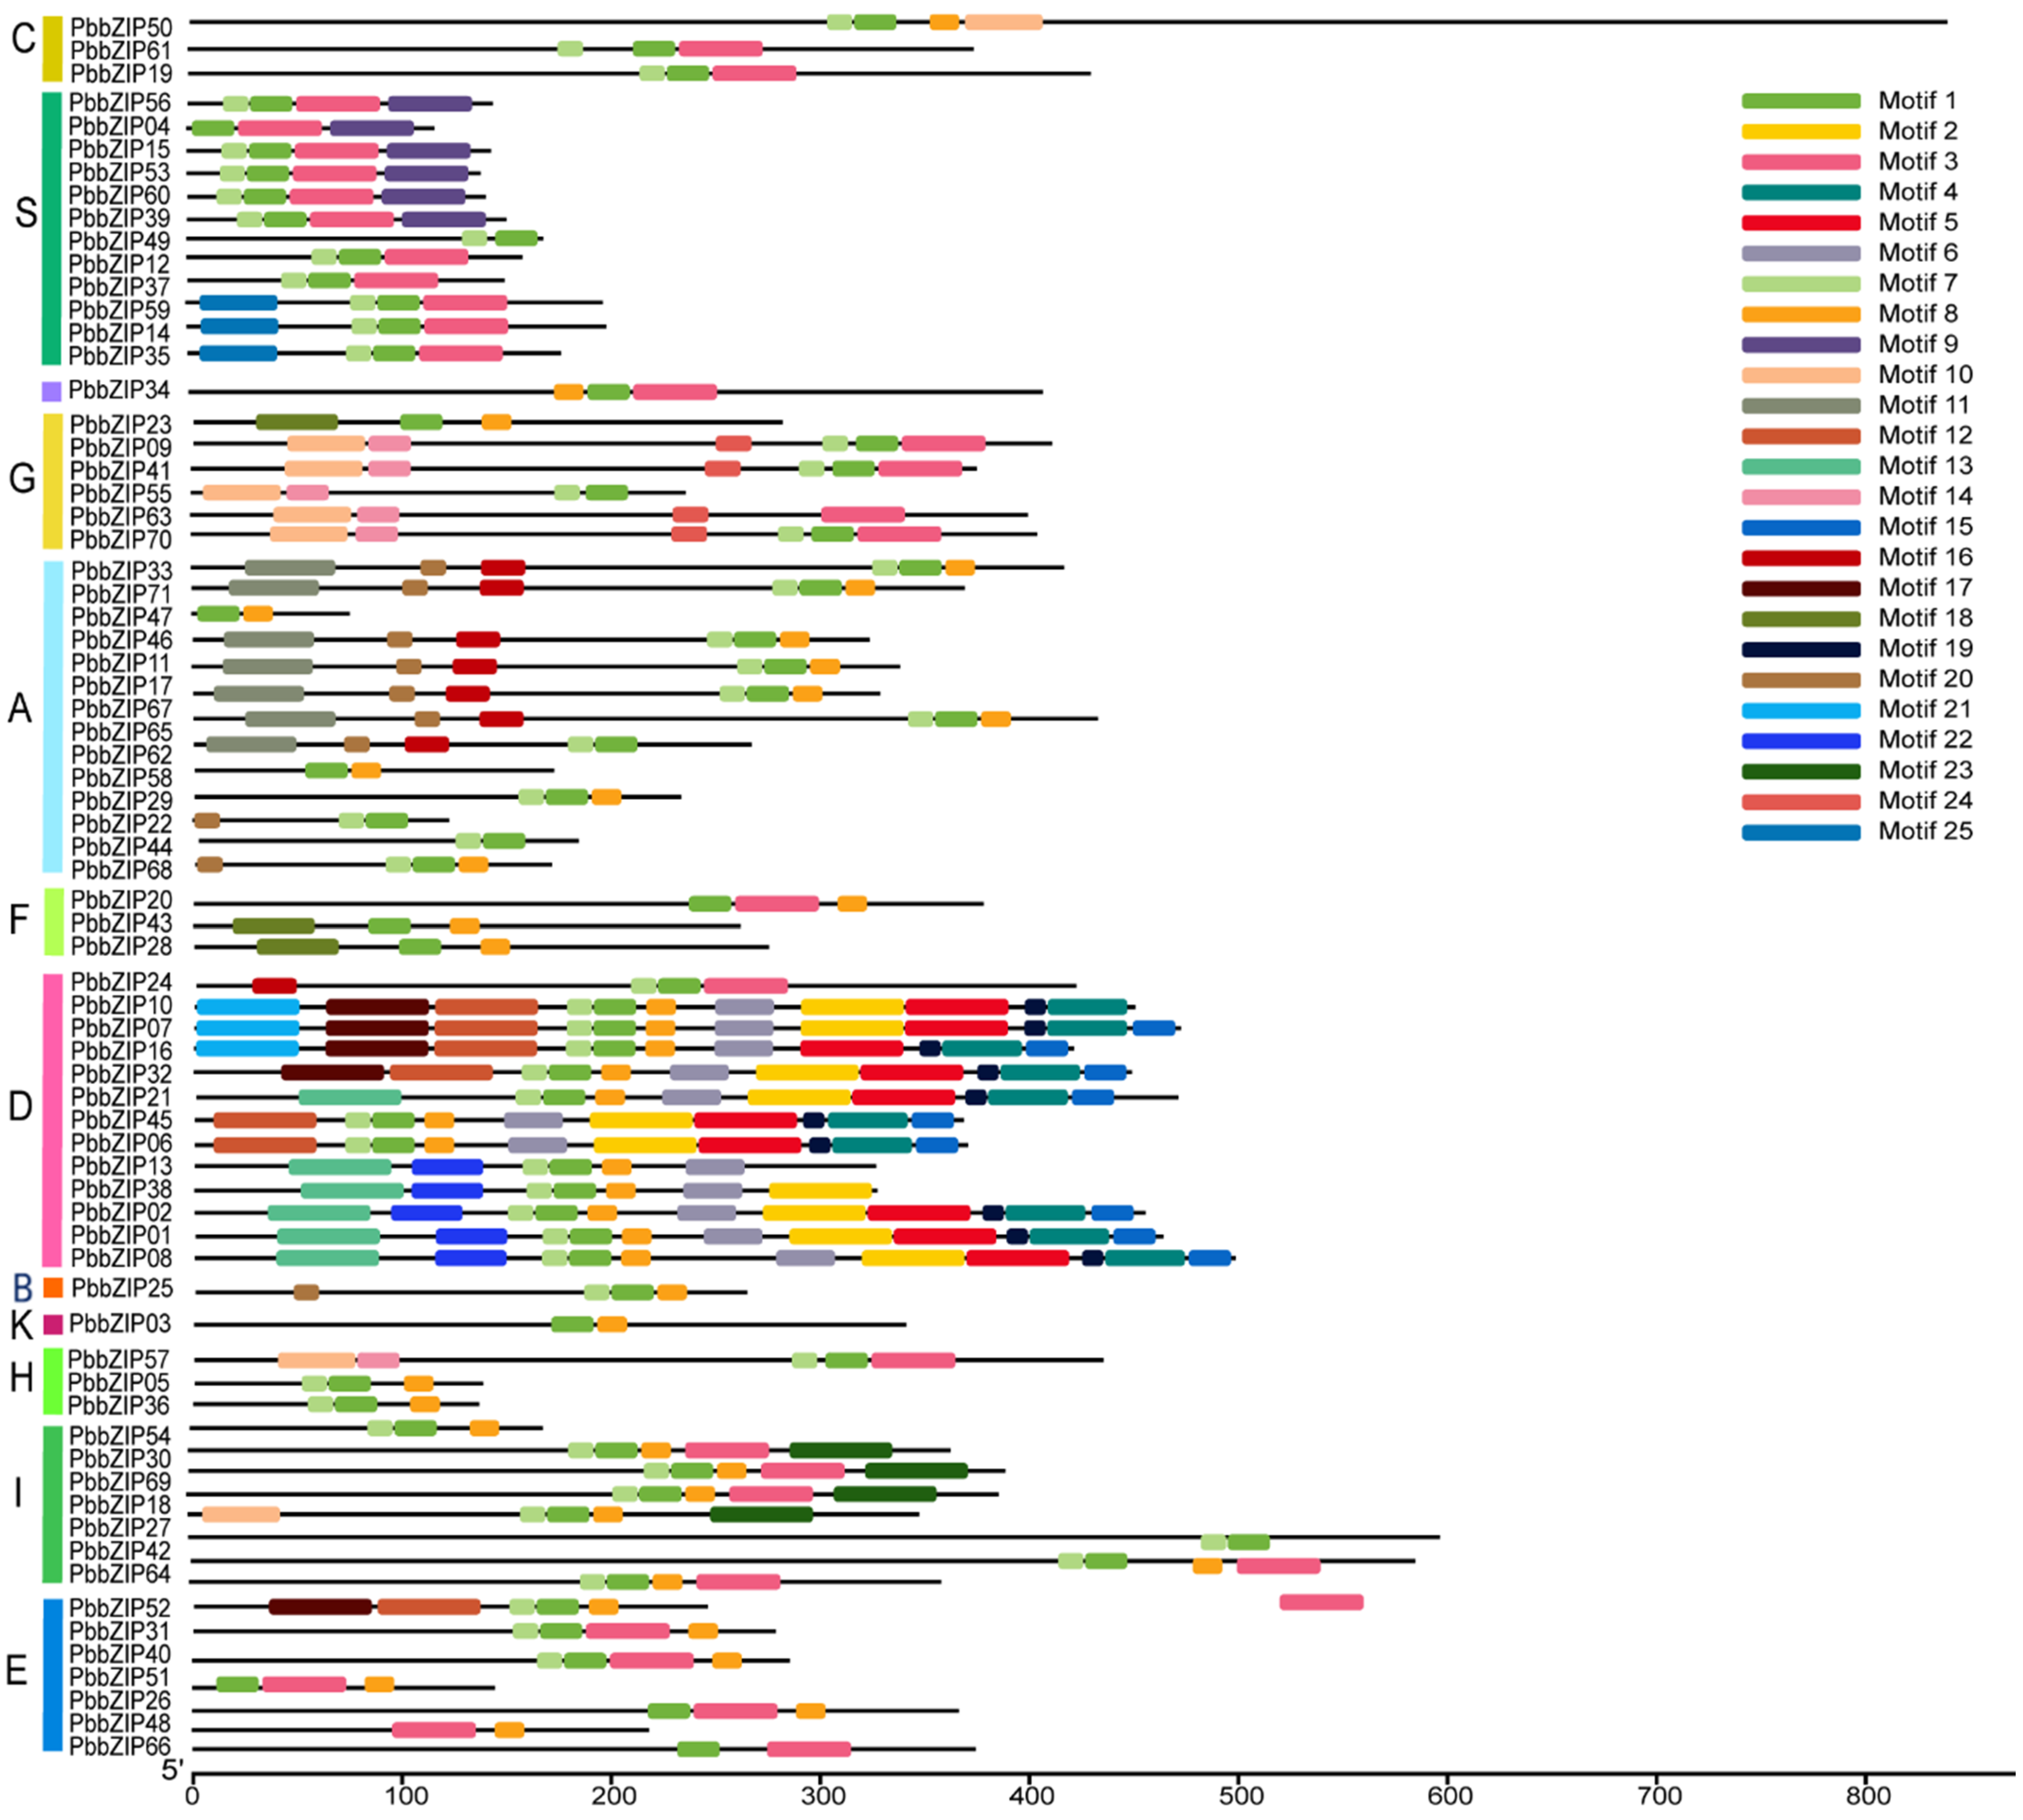
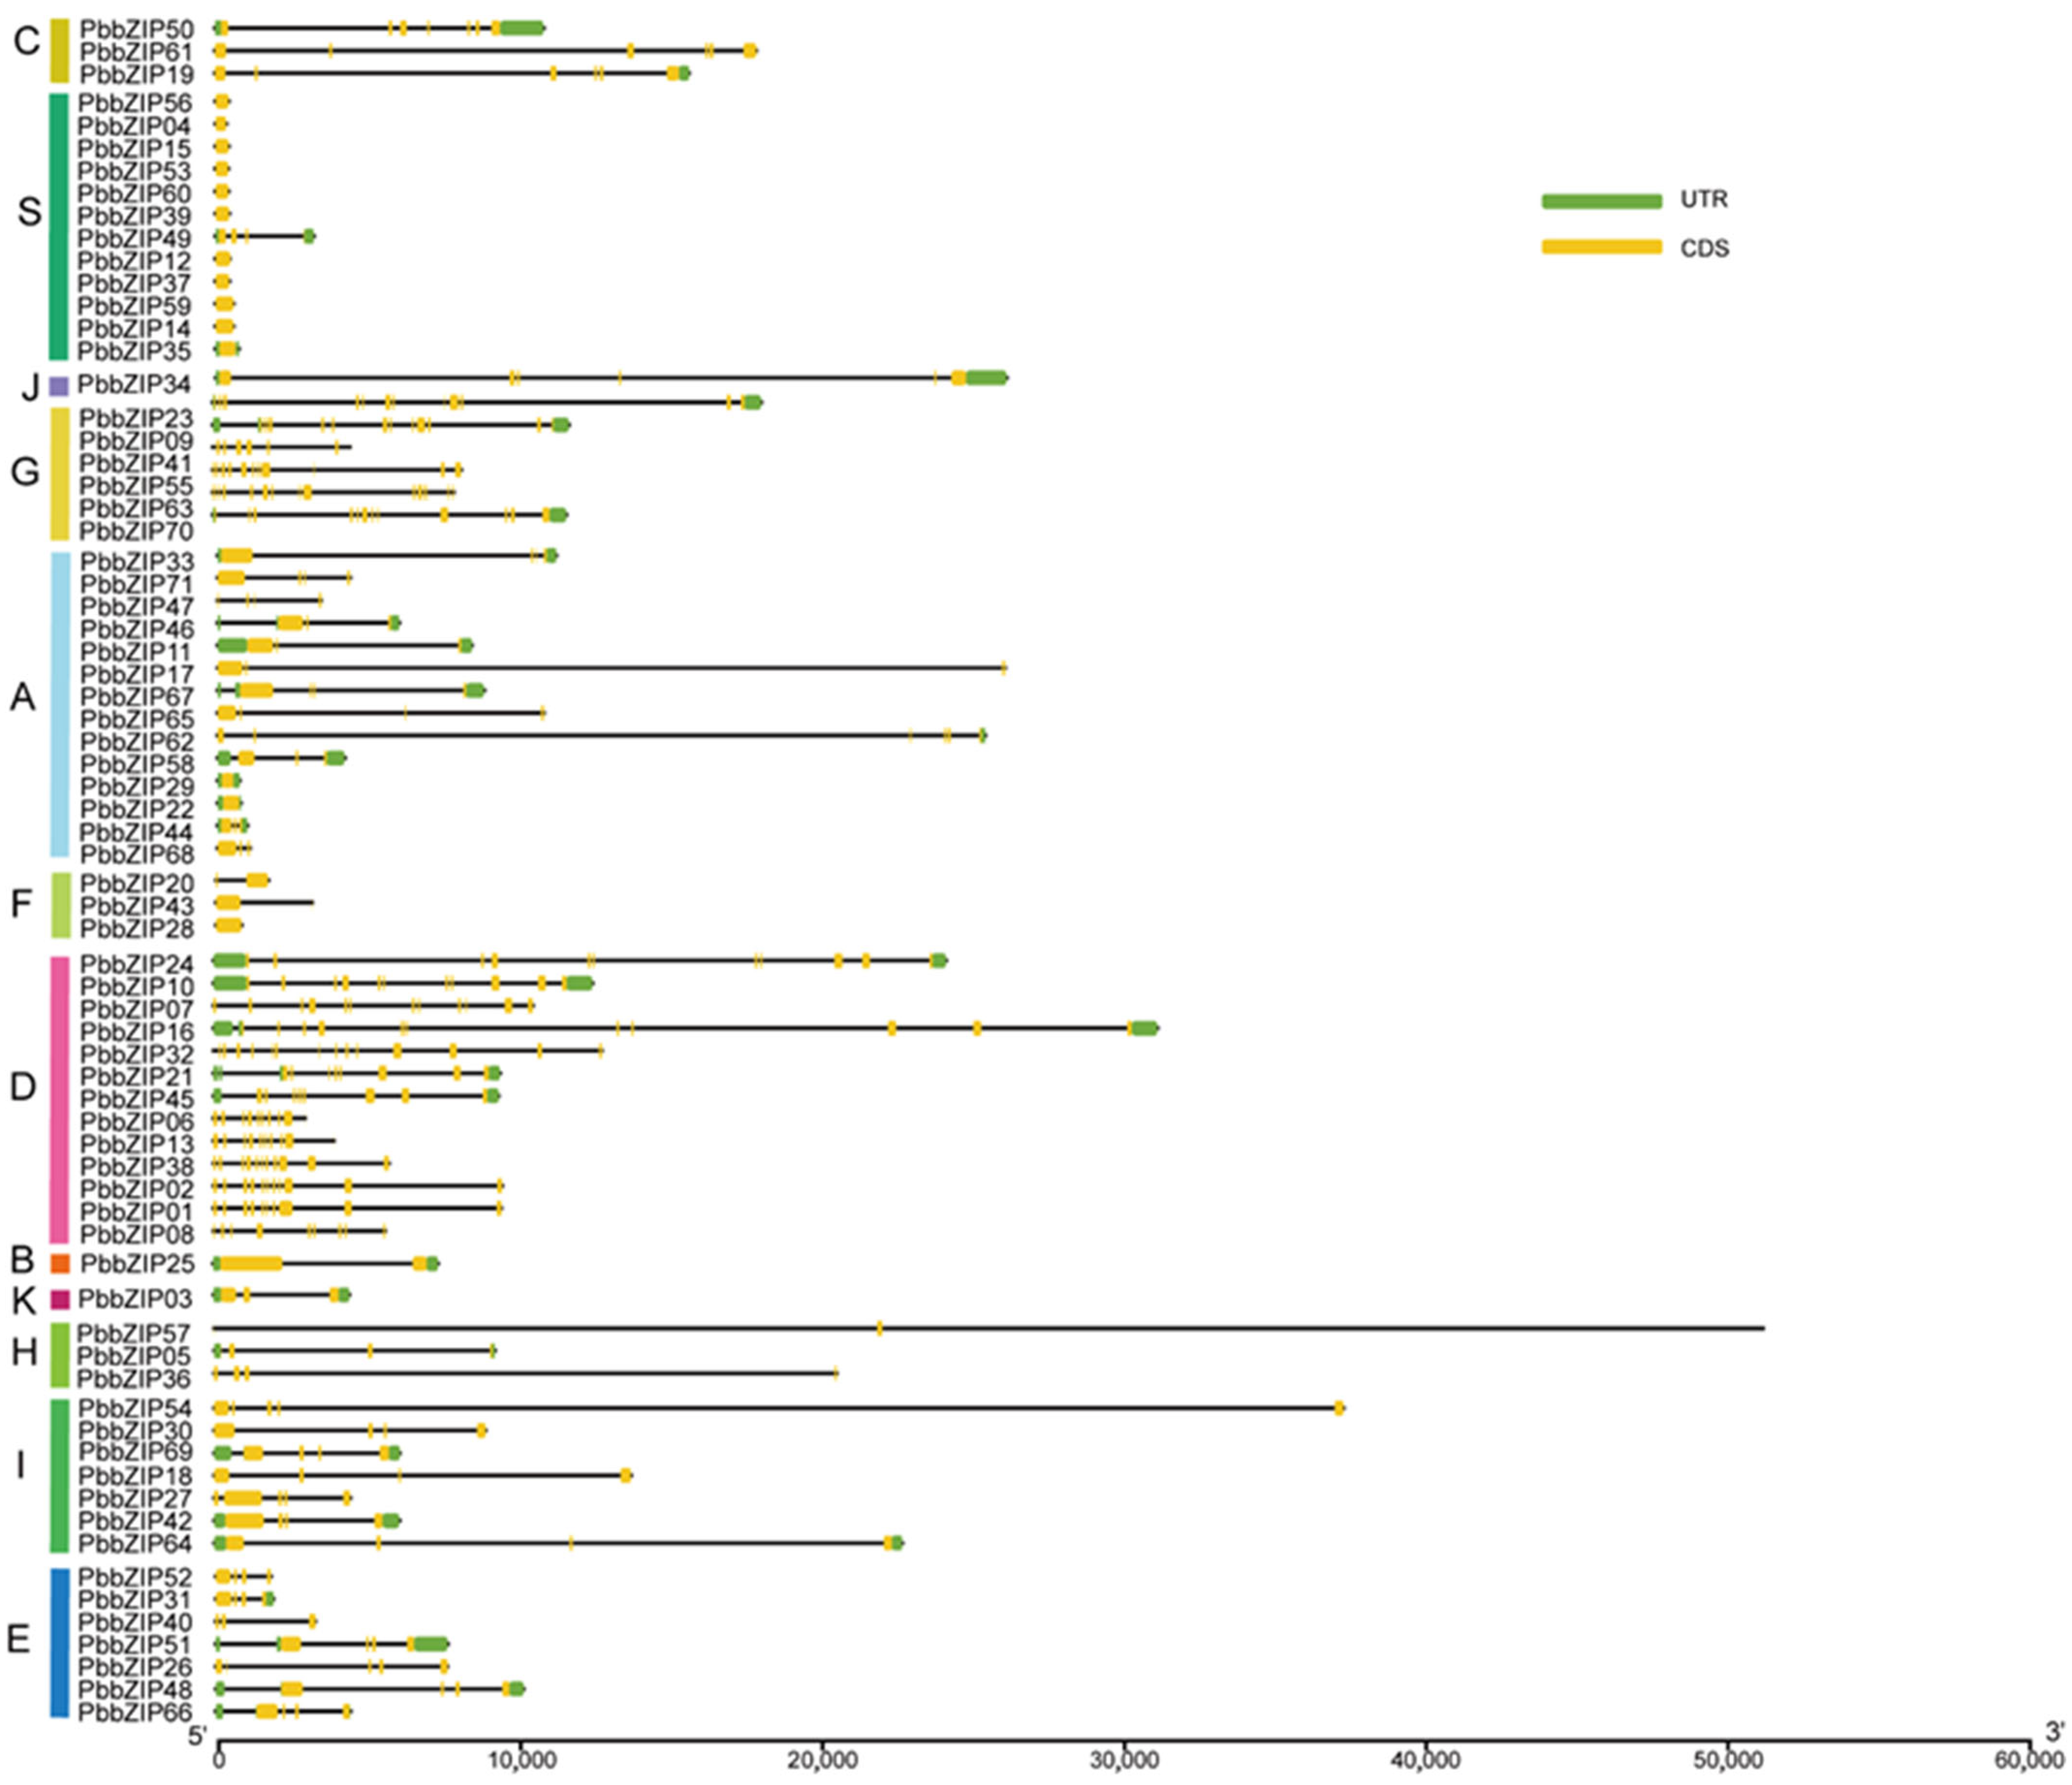
3.5. Protein Motif and Exon–Intron Structure Analysis of the PbbZIP Genes

To track the evolutionary footprints and disclose the features of gene structures, as well as to provide references for revealing the potential functional characteristics and action mechanisms of proteins, we conducted analyses on protein domains and intron–exon structures. Notably, members of the same subfamily showed consistent motif composition and sequential arrangement (Figure 5). Among the 71 identified members, it was demonstrated that motifs 1 and 7 tended to emerge concurrently and were present in the majority of genes (Figure 5). Group D encompassed the most incredible diversity of domains, nearly covering all the domain types. Moreover, a significant portion of the genes within this group possessed motifs such as 1, 2, 4, 5, 6, 7, 8, 11, 15, and 19 (Figure 5). The genomes of members in Group S were generally relatively small, but were rich in multiple conserved motifs, such as motif 1, motif 7, and motif 14 (Figure 5).
In plants, introns are known to play a crucial role in regulating gene expression [44,50]. Consequently, it is significant to elucidate gene function through the analysis of the intron–exon structure. The gene architecture of PbbZIP family members (Figure 6) revealed that the number of exons varied from 1 to 14, and the number of introns ranged from 3 to 13. Some genes are larger because of the presence of large introns, such as PbbZIP54 and PbbZIP57. PbbZIP17 and PbbZIP54 lack untranslated regions (UTRs), which may be attributed to the limitations of genome annotation, whereas all other PbbZIP genes have 5′ UTRs. The UTR of a gene sequence is crucial for mRNA stability. Significant differences were observed in the position and number of exons, as well as the length of introns, among different family members.

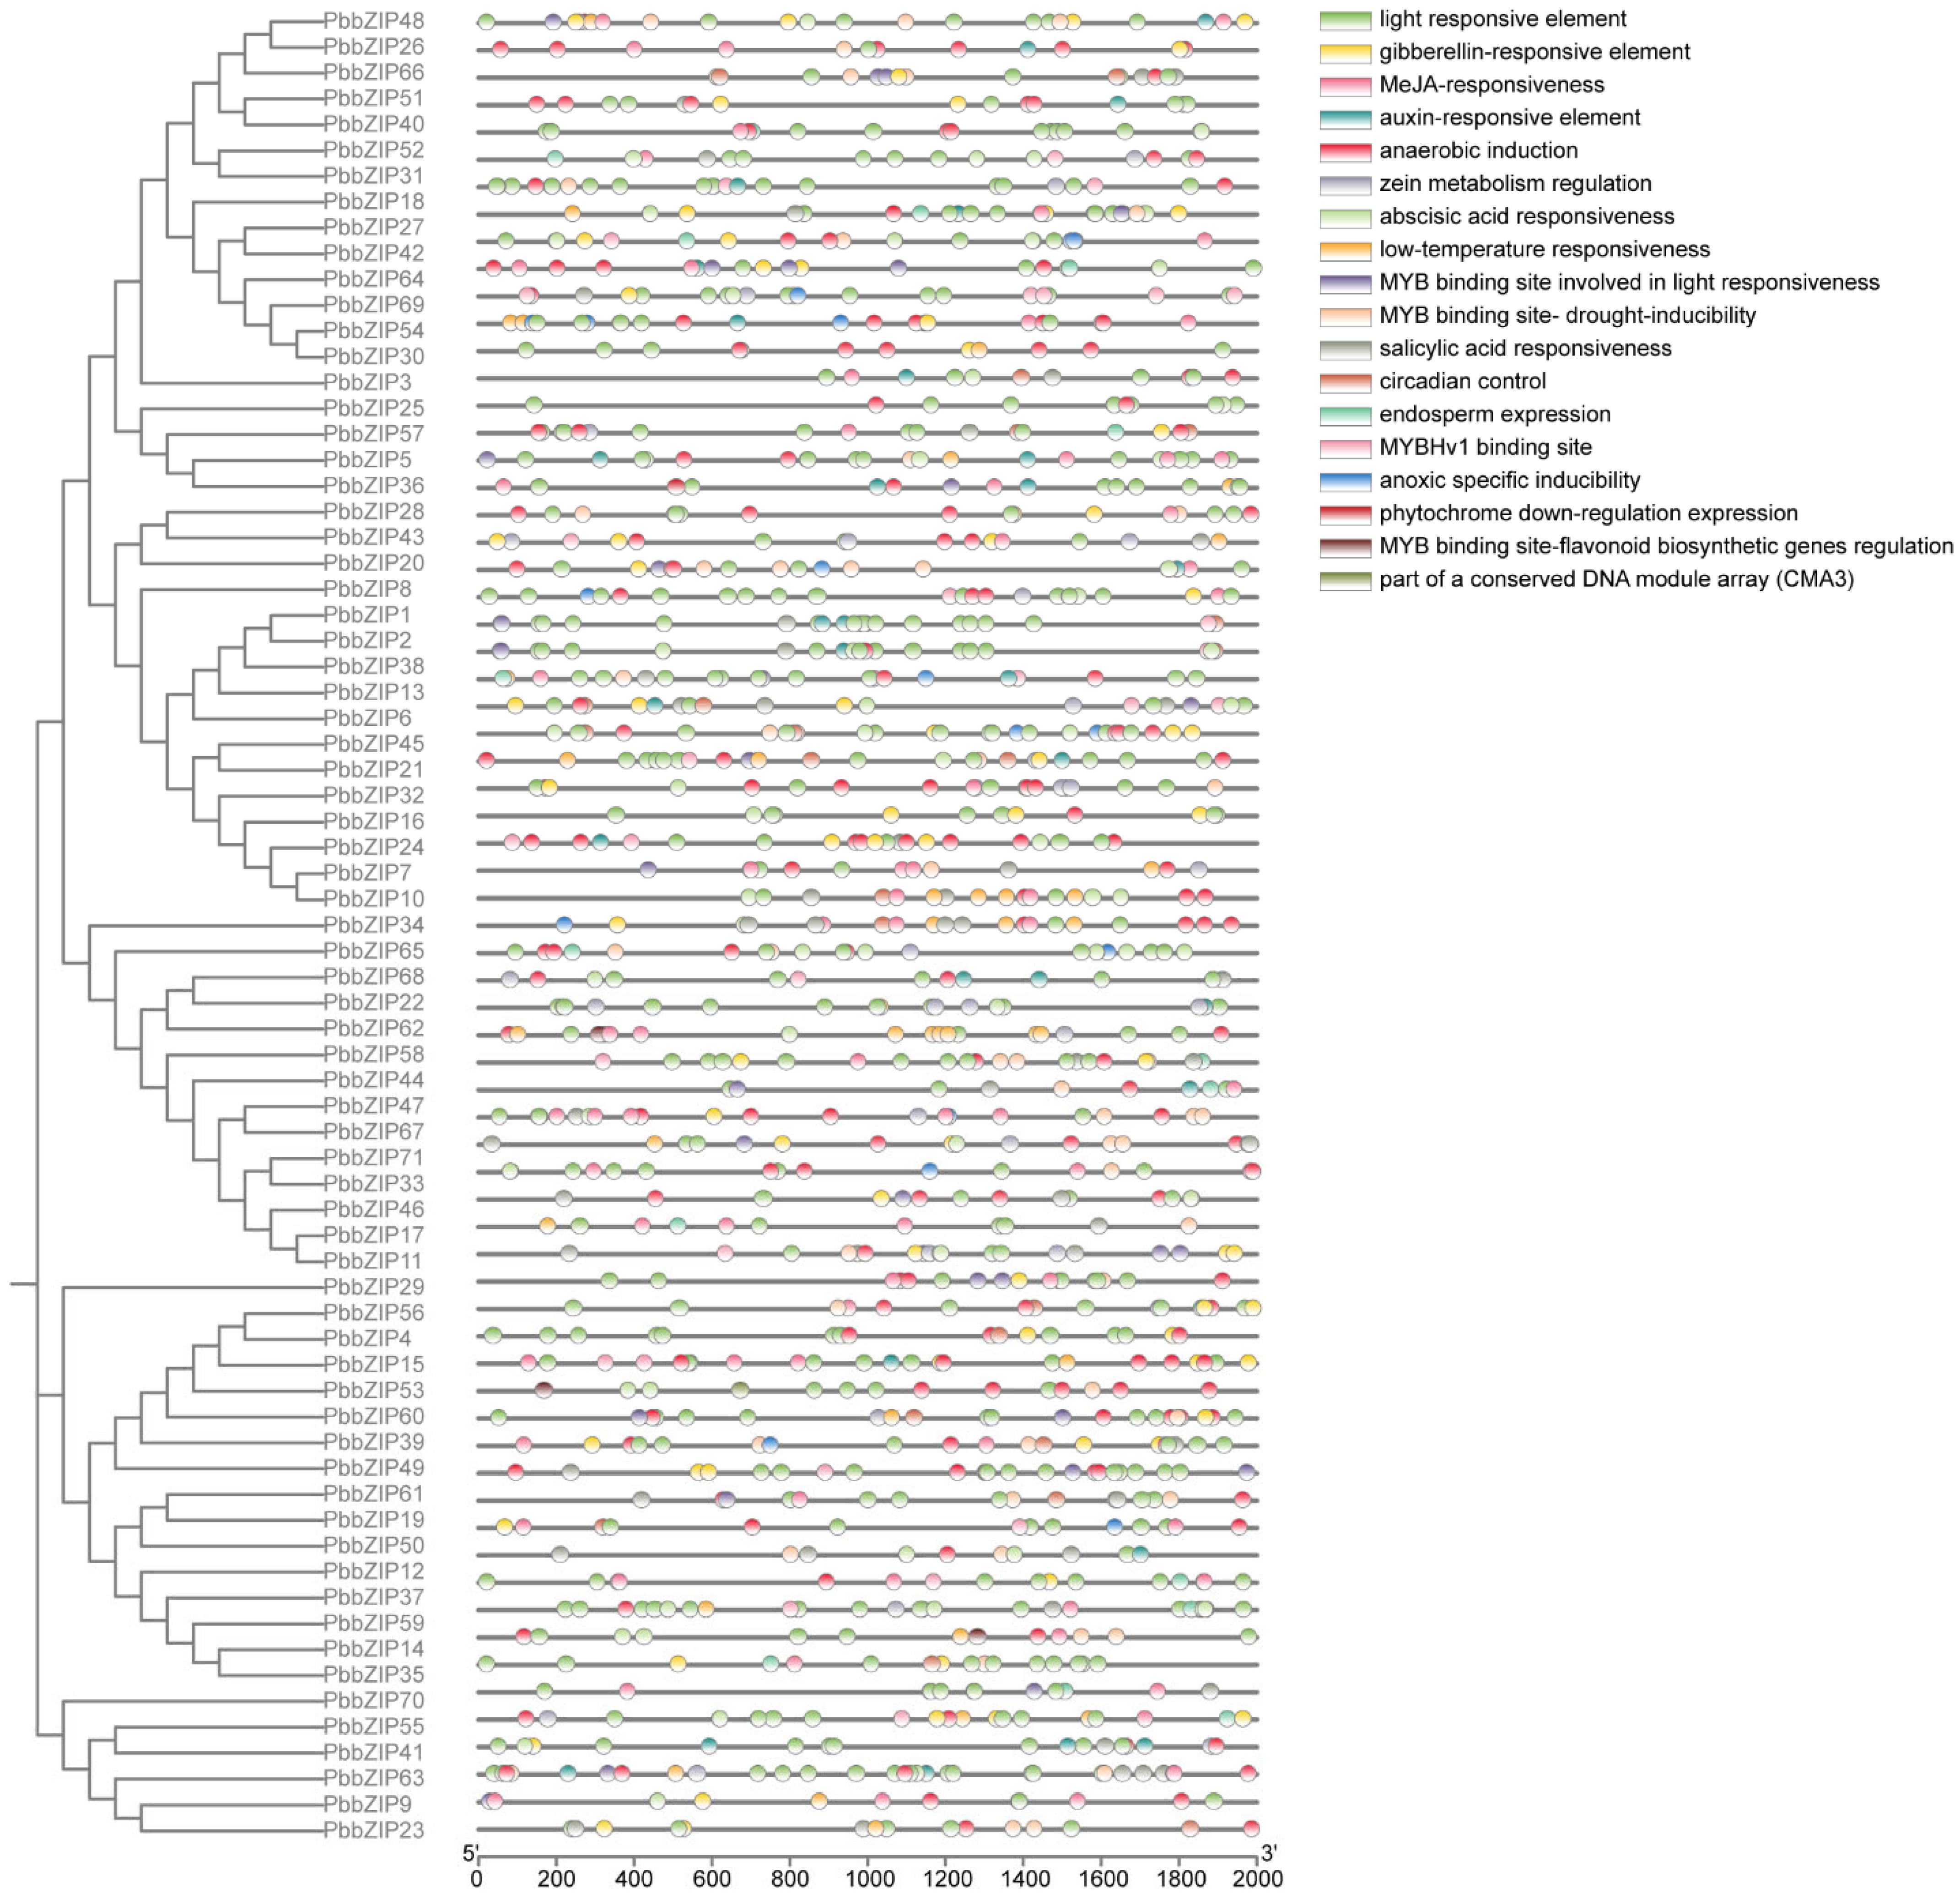
3.6. Cis-Acting Elements Analysis of PbbZIP Genes

To elucidate the biological functions and regulatory mechanisms of PbbZIP genes in P. bournei, we conducted an in-depth analysis of the promoter regions of these genes, with a focus on their cis-acting elements. Our study concentrated on the promoter regions within 2000 bp upstream of the PbbZIP genes. It revealed that these genes possess diverse cis-acting elements, indicating their involvement in various plant functions. A total of 18 distinct cis-acting elements were identified, most of which are related to hormone regulation, light responses, abiotic stress resistance, and control of the circadian rhythm. For instance, these elements include ones that respond to hormones such as gibberellins, methyl jasmonate (MeJA), auxin, and abscisic acid. Notably, the promoters of PbbZIP genes exhibit a high frequency of light-responsive elements, which are present in most members of the gene family. Other common elements include those that respond to abscisic acid, hypoxia, and drought. The enrichment of these elements suggests that PbbZIP genes play significant roles in plant growth and development, hormone signal transduction, and responses to abiotic stresses.
In this study, most of these genes contain MYB-binding sites. The MYB-binding site is implicated in light responsiveness and possesses several properties, such as drought inducibility, circadian control, salicylic acid responsiveness, light responsiveness, auxin responsiveness, and endosperm-specific expression. The MYBHv1-binding site, light reactivity, phytochrome down-regulation expression, anoxic-specific inducibility, light-reactive module, and light response elements are all cis-acting elements. The regulation of MYB-binding site flavonoid biosynthesis genes and members of a conserved DNA module array (CMA3) also contains one or more cis-acting element. These factors suggest that the expression of PbbZIP is linked to these abiotic stresses. (See Figure 7).

3.7. Expression Analysis of PbbZIP Genes in Different Tissues

To gain a more comprehensive understanding of the role and regulatory mechanism that PbbZIPs play in the growth and development of P. bournei, we investigated the expression patterns of the 71 PbbZIP genes (Figure 8). An analysis of gene expression heat maps revealed gene expression patterns specific to diverse tissues. PbbZIPs could be categorized into five distinct groups, which were highly expressed in root bark, root xylem, stem bark, stem xylem, and leaves (Figure 8). A greater number of bZIP genes were highly expressed in both root bark and stem bark, while relatively fewer were highly expressed in root xylem, stem xylem, and leaves. For instance, at least 24 bZIPs in the root bark group and 23 genes in the stem bark group predominantly exhibited elevated expression levels in root bark or stem bark. In contrast, there were considerably fewer genes, specifically only 14 or 15 bZIPs, which were highly expressed in the root xylem and stem xylem groups, respectively. Moreover, only 12 genes were highly expressed in leaves.

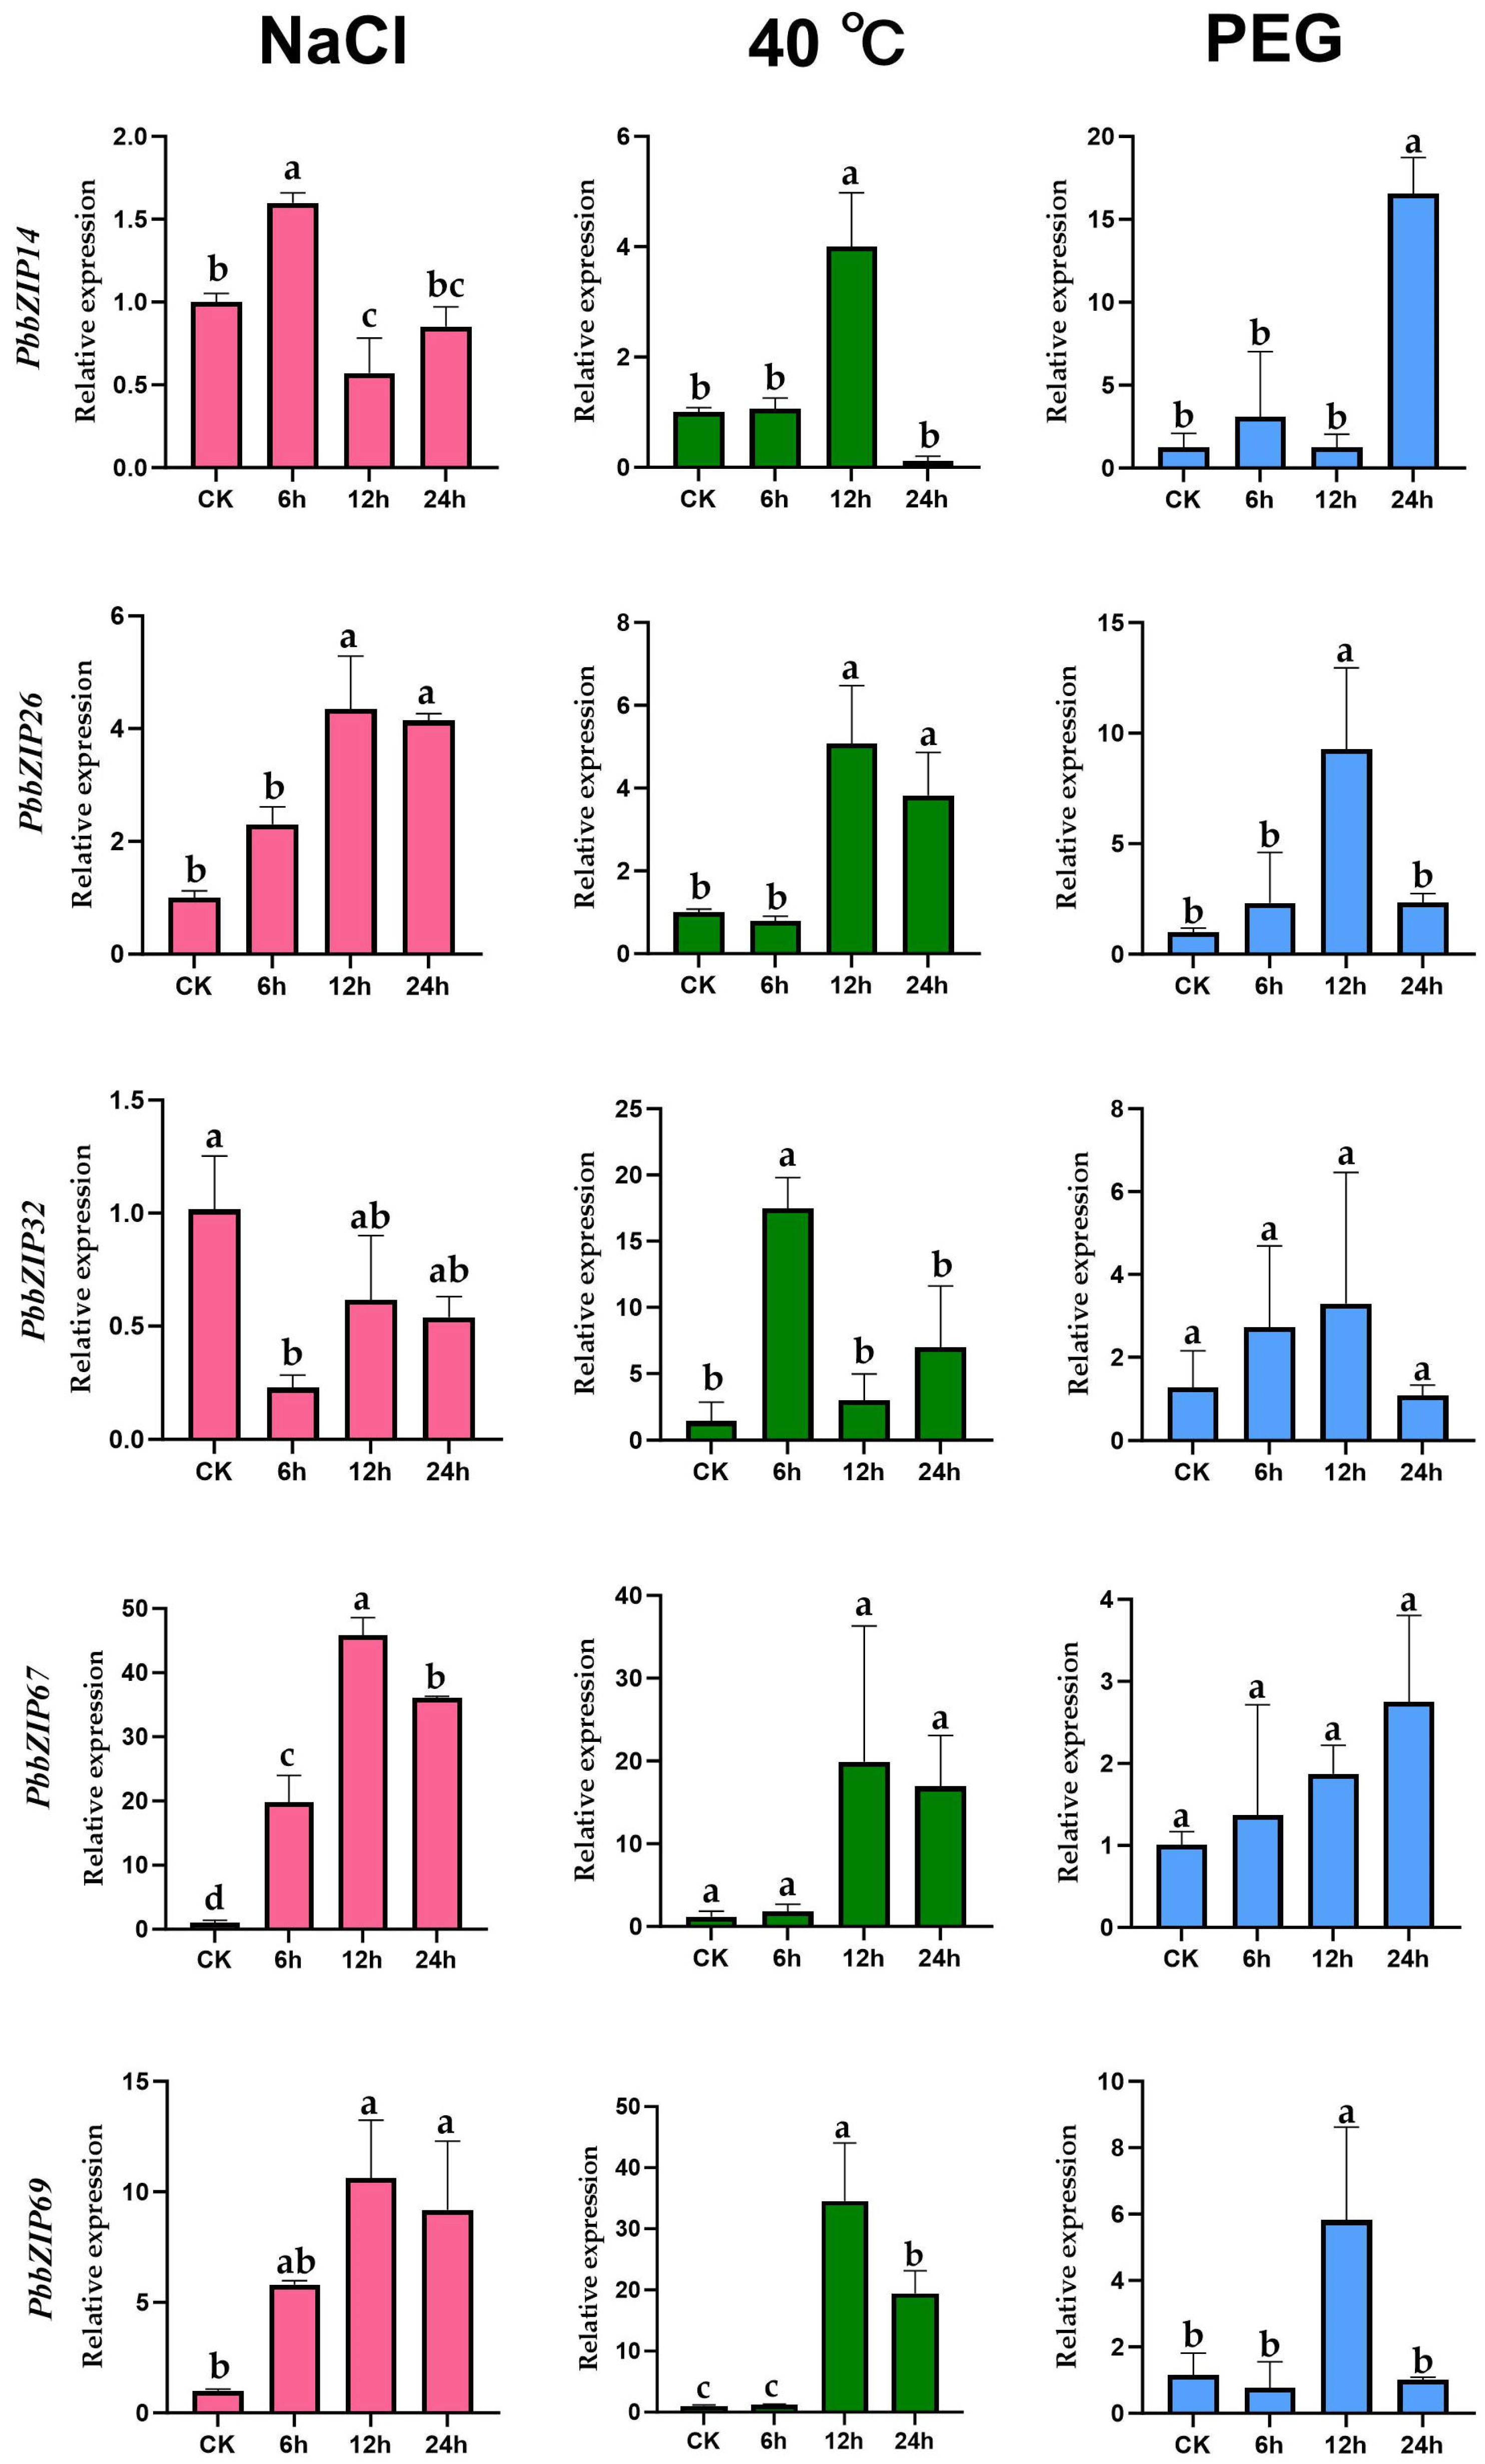
3.8. The Expression Profile of PbbZIP Genes Under Abiotic Stress

To explore how the PbbZIP gene family responds to non-biotic stresses such as salt, temperature, and drought, we selected five genes (PbbZIP32, PbbZIP14, PbbZIP26, PbbZIP67, and PbbZIP69) from the five PbbZIP subfamilies (A, D, E, I, and S) with the most members. These genes contain the highest number of adversity-related cis-acting elements in their respective subfamilies. Transcriptional analysis had verified that there were variable levels of transient expression in response to different stresses. Based on the results, PbbZIP32, PbbZIP26, PbbZIP67, and PbbZIP69 exhibited significant up-regulation in response to salt stress induced by 10% NaCl. Specifically, the expression levels of PbbZIP67 and PbbZIP69 increased by more than 10-fold after salt treatment. In addition, the expression pattern of the RT-qPCR results indicated that the PbbZIP genes were subject to either up-regulation or down-regulation under the high temperature of 40 °C (Figure 9). More precisely, PbbZIP32 reached its peak at 6 h, with its expression increasing by more than 15-fold. Analogous to its response to salt, the expression levels of PbbZIP67 and PbbZIP69 demonstrated a robust reaction to heat, with increases of nearly 20-fold or greater. Meanwhile, PbbZIP14, PbbZIP67, and PbbZIP69 peaked at 12 h, while PbbZIP26 peaked at 24 h. After attaining their respective peaks, all of these began to decline. Surprisingly, PbbZIP14, PbbZIP67, and PbbZIP69 also showed similar patterns with significantly elevated expression under drought stress induced by 10% PEG. PbbZIP14 demonstrated a robust response to PEG-induced drought stress, as its expression increased by more than 15-fold.

4. Discussion

In this study, we systematically analyzed the bZIP gene family in P. bournei, revealing its crucial role in mitigating environmental stress. P. bournei, a subtropical evergreen tree of ecological and economic importance, is highly vulnerable to temperature changes and water scarcity in terms of growth and metabolism [51]. Under drought stress, it activates defense mechanisms, such as regulating osmotic substances and protective enzymes [36]. Previous research results indicate that the bZIP transcription factor family plays a crucial role in regulating both plant growth and development, as well as in response to abiotic stress [17,18,52]. Unlike the well-studied bZIP family in model plants such as Arabidopsis [9,53], the P. bournei bZIP family has been less explored. This study bridges this knowledge gap and offers fresh perspectives on how P. bournei adapts to stress. It also highlights the significance of gene regulation as a plant adaptation mechanism to environmental stress [54], laying a solid foundation for future research.
The number of bZIP genes varies among different plant species. For example, 78, 89, 125, 88, 86, 45, and 52 bZIP genes have been identified in A. thaliana, O. sativa, Z. mays, J. regia, poplar, Z. jujuba, and C. tinctorius, respectively. These genes may exhibit similar or diverse responses to various stresses. Based on the phylogenetic reconstruction (Figure 3A) using the Arabidopsis classification as a standard, PbbZIPs were divided into 12 subfamilies (A-K, S). Protein structure analysis also supported this classification. Notably, no PbbZIP proteins were found in the M subfamily, which may indicate that these proteins were lost during the evolution of P. bournei. The PbbZIP proteins exhibited a wide variety of physicochemical properties, which underscored their potential role in adapting to stresses, particularly under conditions such as salt stress, high temperature, and drought in P. bournei. These proteins varied in size, with the number of amino acid residues ranging from 74 to 839, leading to molecular weights ranging from 8813.28 Da to 88,864.94 Da. Their predicted subcellular localization, which was predominantly in the nucleus, was consistent with their function as transcription factors, indicating that they were involved in gene regulatory processes. The theoretical isoelectric points of these proteins ranged from 4.78 to 11.45, indicating diverse acidic and basic properties that could impact their stability and interactions with different cellular environments. The aliphatic index values, ranging from 47 to 94, reflected the various levels of thermostability of these proteins. The negative values of the Grand Average of Hydropathy (GRAVY) indicated their hydrophilic nature, which is closely related to their function in the aqueous cellular environments. Collectively, these diverse biophysical properties suggest that the PbbZIP genes likely play distinct regulatory roles in response to abiotic stresses. Similarly to the findings in other plant species, these results were consistent with those reported in a previous study [55], which found that 62 bZIP genes in Chinese pear have evolved through duplication, possess stress-responsive cis-elements, and exhibit differential hormonal expression under hormonal regulation.
Additionally, the alignment of PbbZIP protein sequences offers profound insights into their functional similarities and evolutionary relationships. By highlighting both the conserved regions and the variances within the protein sequences of the PbbZIP family, it enables a more in-depth understanding of these aspects (Figure 2). Interestingly, a conserved phosphorylation motif, “RHx[R/H]SxS”, has been shown to play a crucial role in the Arabidopsis response to abiotic stress [22,49,56]. Likewise, a conserved “NRxSA[R/K]RSRxRK” motif contains potential phosphorylation sites “S” as well. The research on bZIPs in Arabidopsis offers significant clues for uncovering the molecular mechanism through which bZIPs in P. bournei respond to external stimuli. The phylogenetic and homologous analyses of the bZIP transcription factor family in P. bournei and A. thaliana focus on their conservation and cross-species divergence, revealing the evolutionary relationships among bZIP proteins in these species. The collinearity suggested that the bZIP transcription factors that mediated stress responses in plant species were functionally similar and that the bZIP genes of these species were evolutionarily conserved [57]. Our results were identical to those of Tian [58], who demonstrated through phylogenetic analysis of NtNF-Y genes that revealed stress-responsive expression and diverse gene structures in tobacco.
During gene-family evolution, duplication events—whole-genome duplication (WGD), tandem duplication (TD), segmental duplication (SD), and retrotransposition (TRD)—serve as the primary engines of genomic innovation [59]. Among these, TD and SD are the dominant forces that shape family size and functional diversity [60,61]. Subsequent gene loss and selective amplification further sculpt divergent family architectures between herbaceous and woody lineages [62,63]. In Arabidopsis, for example, SD has been a major driver of bZIP expansion [8,9]. A comparable pattern is evident in P. bournei, where widespread SD has significantly increased the number of PbbZIP loci. Comparative synteny identified 45 high-confidence orthologous pairs between P. bournei and Arabidopsis, implying an unexpectedly close evolutionary relationship. This pronounced collinearity contrasts with the anticipated divergence between monocots and eudicots and likely reflects lineage-specific loss of bZIP genes in P. bournei after the shared paleopolyploidy events.
Members of the same subfamily exhibit a consistent pattern in motif composition and arrangement (Figure 4), consistent with their evolutionary characteristics. However, they show significant variation in exon–intron structures (Figure 6), implying divergent expression regulation mechanisms [44,50]. Notably, genes such as PbbZIP17 and PbbZIP54 lack a 5′-UTR. This is likely due to limitations in genome annotation. Tissue expression analysis revealed that 71 PbbZIP genes showed significant differences in expression intensity across the root periderm, root xylem, stem periderm, stem xylem, and leaves (Figure 8), indicating that they have tissue-specific functions and roles in regulating growth and development. This aligns with findings from research on the LBD gene family in P. bournei [53], where 38 family members were identified with tissue-specific functions related to root formation, light response, and stress adaptation.
Our findings align with the research of Guo [64] and Manzoor [55], who indicate that the bipartite network architecture helps stabilize intracellular protein concentration. This study analyzed the cis-acting elements in PbbZIP gene promoters and identified numerous regulatory motifs associated with hormone response, stress signaling, light reactions, and growth-related processes (e.g., auxin, abscisic acid, gibberellins, MeJA, low temperature, and anaerobic induction) (Figure 7). Notably, MYB-binding sites, which are key to light response, regulate circadian rhythms, drought resistance, salicylic acid response, and flavonoid biosynthesis via the CMA3 module, as well as phytochrome signaling. This finding is similar to those of Tang et al. [65] on 19 bZIP transcription factors in Magnaporthe oryzae, underscoring the conserved yet diverse roles of the bZIP family in stress responses and developmental regulation.
Previous studies have demonstrated that the bZIP gene family plays a crucial role in responding to various stressors, including salt and drought. For example, in Glycine max, overexpression of bZIP2 enhances drought and salt tolerance by activating the transcription of GmMYB48, GmWD40, GmDHN15, and GmLEA [66]. In maize, bZIP transcription factors (TFs) interact with HsF08 to regulate responses to salt and drought stress, and activate genes such as ZmDREB2A, ZmNCED, ZmERD1, ZmRD20, and ZmRAB18 [67]. Through qRT-PCR analysis, we have provided strong evidence of the regulatory role of PbbZIP genes in mitigating the adverse effects of salt stress. When salt stress was imposed using a 10% NaCl treatment, genes such as PbbZIP32, PbbZIP26, PbbZIP67, and PbbZIP69 showed significant up-regulation. Notably, the expression levels of PbbZIP67 and PbbZIP69 increased more than ten-fold following treatment. This substantial induction of gene expression suggests that they may be involved in the activation of stress-response pathways.
In this study, we conducted a systematic analysis of the bZIP gene family in P. bournei, employing qRT-PCR to determine and validate the expression of PbbZIP genes under various abiotic stress conditions. Our findings not only shed light on the potential roles of PbbZIP in the physiological responses of P. bournei to heat, salt, and drought stresses but also provide fundamental insights into the molecular mechanisms underlying these responses. By revealing the involvement of PbbZIP genes in stress tolerance, this study lays the groundwork for future research aimed at enhancing the stress resilience of P. bournei through genetic engineering approaches.

5. Conclusions

In this study, we comprehensively investigated the PbbZIP genes in P. bournei, identifying 71 members through genomic data and computational methods. Primarily located in the nucleus of the cell, these genes play crucial roles in plant growth, development, and responses to stress. Our analysis of the physicochemical properties of PbbZIP proteins revealed a wide range of isoelectric points and conserved motifs, which indicated functional diversification within the family. This suggests that different members may perform distinct functions in plant biological processes. The chromosomal distribution of PbbZIP genes revealed frequent gene clusters in specific regions, with tandem and segmental duplications making a significant contribution to the family’s expansion. The expression patterns of these genes, particularly in stem and root tissues, indicate their essential role in plant development. RT-qPCR analyses demonstrated that the expression levels of PbbZIP67 and PbbZIP69 increased significantly under saline conditions, highlighting their role in salt stress tolerance. Additionally, five genes—PbbZIP14, PbbZIP26, PbbZIP32, PbbZIP67, and PbbZIP69—showed enhanced expression in response to both salinity and heat stress. Although PbbZIP67 and PbbZIP69 seem to be specifically involved in salt and heat stress tolerance, other genes also respond to heat and salt stress, although the effect is relatively small under drought stress. These findings provide a solid foundation for further research. For instance, gene knockout experiments could further clarify the specific roles of PbbZIP genes in stress adaptation and resilience. This study provides valuable insights into P. bournei breeding and identifies key bZIP genes that can enhance resistance to temperature fluctuations, drought, and salinity. Overall, our results lay the foundation for future investigations into the impacts of abiotic stress on woody plants.

Author Contributions

Conceptualization, Z.Z. and S.C.; formal analysis, H.G. and M.X.; funding acquisition, Z.Z.; methodology, Y.F.; software, L.Z. and J.W.; supervision, S.C.; writing—original draft, Y.F. and A.B.; writing—review and editing, Z.Z., S.C., Y.F. and M.N. All authors have read and agreed to the published version of the manuscript.

Funding

The National Natural Science Foundation of China grant (No. 32470372 to Zhenzhen Zhang).

Data Availability Statement

Data are contained within the article.

Conflicts of Interest

The authors declare that the research was conducted in the absence of any commercial or financial relationships that could be construed as a potential conflict of interest.

References

  1. Zhang, H.M.; Zhu, J.H.; Gong, Z.Z.; Zhu, J.K. Abiotic stress responses in plants. Nat. Rev. Genet. 2022, 23, 104–119. [Google Scholar] [CrossRef]
  2. Lamalakshmi Devi, E.; Kumar, S.; Basanta Singh, T.; Sharma, S.K.; Beemrote, A.; Premabati Devi, C.; Chongtham, S.K.; Singh, C.H.; Yumlembam, R.A.; Haribhushan, A.; et al. Adaptation Strategies and Defence Mechanisms of Plants During Environmental Stress; Springer International Publishing: Berlin/Heidelberg, Germany, 2017; pp. 359–413. [Google Scholar] [CrossRef]
  3. Ye, Y.Y.; Ding, Y.F.; Jiang, Q.; Wang, F.J.; Sun, J.W.; Zhu, C. The role of receptor-like protein kinases (RLKs) in abiotic stress response in plants. Plant Cell Rep. 2017, 36, 235–242. [Google Scholar] [CrossRef]
  4. Zhang, W.J.; Zhou, Y.W.; Zhang, Y.; Su, Y.H.; Xu, T.D. Protein phosphorylation: A molecular switch in plant signaling. Cell Rep. 2023, 42, 112729. [Google Scholar] [CrossRef] [PubMed]
  5. Song, L.; Huang, S.S.C.; Wise, A.; Castanon, R.; Nery, J.R.; Chen, H.M.; Watanabe, M.; Thomas, J.; Bar-Joseph, Z.; Ecker, J.R. A transcription factor hierarchy defines an environmental stress response network. Science 2016, 354, aag1550. [Google Scholar] [CrossRef] [PubMed]
  6. Cao, X.Y.; Chen, M.; Xu, Z.S.; Chen, Y.F.; Li, L.C.; Yu, Y.H.; Liu, Y.N.; Ma, Y.Z. Isolation and Functional Analysis of the bZIP Transcription Factor Gene TaABP1 from a Chinese Wheat Landrace. J. Integr. Agric. 2012, 11, 1580–1591. [Google Scholar] [CrossRef]
  7. Nijhawan, A.; Jain, M.; Tyagi, A.K.; Khurana, J.P. Genomic survey and gene expression analysis of the basic leucine zipper transcription factor family in rice. Plant Physiol. 2008, 146, 333–350. [Google Scholar] [CrossRef]
  8. Jakoby, M.; Weisshaar, B.; Dröge-Laser, W.; Vicente-Carbajosa, J.; Tiedemann, J.; Kroj, T.; Parcy, F. bZIP transcription factors in Arabidopsis. Trends Plant Sci. 2002, 7, 106–111. [Google Scholar] [CrossRef]
  9. Dröge-Laser, W.; Snoek, B.L.; Snel, B.; Weiste, C. The Arabidopsis bZIP transcription factor family—An update. Curr. Opin. Plant Biol. 2018, 45, 36–49. [Google Scholar] [CrossRef]
  10. Wei, K.; Chen, J.; Wang, Y.; Chen, Y.; Chen, S.; Lin, Y.; Pan, S.; Zhong, X.J.; Xie, D. Genome-Wide Analysis of bZIP-Encoding Genes in Maize. DNA Res. 2012, 19, 463–476. [Google Scholar] [CrossRef]
  11. Zhang, Z.R.; Quan, S.W.; Niu, J.X.; Guo, C.H.; Kang, C.; Liu, J.M.; Yuan, X. Genome-Wide Identification, Classification, Expression and Duplication Analysis of bZIP Family Genes in Juglans regia L. Int. J. Mol. Sci. 2022, 23, 5961. [Google Scholar] [CrossRef]
  12. Zhao, K.; Chen, S.; Yao, W.J.; Cheng, Z.H.; Zhou, B.R.; Jiang, T.B. Genome-wide analysis and expression profile of the bZIP gene family in poplar. BMC Plant Biol. 2021, 21, 122. [Google Scholar] [CrossRef]
  13. Zhang, Y.; Gao, W.L.; Li, H.T.; Wang, Y.K.; Li, D.K.; Xue, C.L.; Liu, Z.G.; Liu, M.J.; Zhao, J. Genome-wide analysis of the bZIP gene family in Chinese jujube (Ziziphus jujuba Mill.). BMC Genom. 2020, 21, 483. [Google Scholar] [CrossRef] [PubMed]
  14. Li, H.Y.; Li, L.X.; ShangGuan, G.D.; Jia, C.; Deng, S.N.; Noman, M.; Liu, Y.L.; Guo, Y.X.; Han, L.; Zhang, X.M.; et al. Genome-wide identification and expression analysis of bZIP gene family in Carthamus tinctorius L. Sci. Rep. 2020, 10, 15521. [Google Scholar] [CrossRef]
  15. Joo, H.; Baek, W.; Lim, C.W.; Lee, S.C. Post-translational Modifications of bZIP Transcription Factors in Abscisic Acid Signaling and Drought Responses. Curr. Genom. 2021, 22, 4–15. [Google Scholar] [CrossRef]
  16. Gao, J.; Wang, M.J.; Wang, J.J.; Lu, H.P.; Liu, J.X. bZIP17 regulates heat stress tolerance at reproductive stage in Arabidopsis. aBIOTECH 2021, 3, 1–11. [Google Scholar] [CrossRef]
  17. Guo, Z.L.; Dzinyela, R.; Yang, L.M.; Hwarari, D. bZIP Transcription Factors: Structure, Modification, Abiotic Stress Responses and Application in Plant Improvement. Plants 2024, 13, 2058. [Google Scholar] [CrossRef]
  18. Souza, C.R.B.; Serrão, C.P.; Barros, N.L.F.; Reis, S.P.D.; Marques, D.N. Plant bZIP Proteins: Potential use in Agriculture-A Review. Curr. Protein Pept. Sci. 2023, 25, 107–119. [Google Scholar] [CrossRef]
  19. Chu, Y.L.; Xu, N.; Wu, Q.; Yu, B.; Li, X.X.; Chen, R.R.; Huang, J.L. Rice transcription factor OsMADS57 regulates plant height by modulating gibberellin catabolism. Rice 2019, 12, 38. [Google Scholar] [CrossRef]
  20. Narsai, R.; Castleden, I.; Whelan, J. Common and distinct organ and stress responsive transcriptomic patterns in Oryza sativa and A. thaliana. BMC Plant Biol. 2010, 10, 262. [Google Scholar] [CrossRef]
  21. Inukai, S.; Kock, K.H.; Bulyk, M.L. Transcription factor–DNA binding: Beyond binding site motifs. Curr. Opin. Genet. Dev. 2017, 43, 110–119. [Google Scholar] [CrossRef]
  22. Wiese, A.J.; Steinbachová, L.; Timofejeva, L.; Čermák, V.; Klodová, B.; Ganji, R.S.; Limones-Mendez, M.; Bokvaj, P.; Hafidh, S.; Potěšil, D.; et al. Arabidopsis bZIP18 and bZIP52 Accumulate in Nuclei Following Heat Stress where They Regulate the Expression of a Similar Set of Genes. Int. J. Mol. Sci. 2021, 22, 530. [Google Scholar] [CrossRef]
  23. Lindbäck, L.N.; Ji, Y.; Cervela-Cardona, L.; Jin, X.; Pedmale, U.V.; Strand, Å. An interplay between bZIP16, bZIP68, and GBF1 regulates nuclear photosynthetic genes during photomorphogenesis in Arabidopsis. New Phytol. 2023, 240, 1082–1096. [Google Scholar] [CrossRef]
  24. Shi, W.; Song, W.; Chen, Z.; Cai, H.; Gong, Q.; Liu, J.; Shi, C.; Wang, S. Comparative chloroplast genome analyses of diverse Phoebe (Lauraceae) species endemic to China provide insight into their phylogeographical origin. PeerJ 2023, 11, e14573. [Google Scholar] [CrossRef]
  25. Wu, J.B.; Liang, J.Y.; Chen, M.Y.; Zheng, S.Q.; Xu, J.Y. Study on the Structural Characteristics and Physical and Mechanical Properties of P. bournei Thinning Wood. J. Renew. Mater. 2022, 10, 3025–3039. [Google Scholar] [CrossRef]
  26. Ge, Y.J.; Liu, Y.J.; Shen, A.H.; Lin, X.C. Fengshui forests conserve genetic diversity: A case study of P. bournei (Hemsl.) Yang in southern China. Genet. Mol. Res. GMR 2015, 14, 1986–1993. [Google Scholar] [CrossRef] [PubMed]
  27. Wang, D.M.; Li, J.P.; Tang, T. Determining the Optimal Density of P. bournei Plantations Based on Dynamic Programming under Close-to-Nature Management Measures. Sustainability 2022, 14, 847. [Google Scholar] [CrossRef]
  28. Wang, Y.; Ma, X.H.; Lu, Y.F.; Hu, X.G.; Lou, L.H.; Tong, Z.K.; Zhang, J.H. Assessing the current genetic structure of 21 remnant populations and predicting the impacts of climate change on the geographic distribution of Phoebe sheareri in southern China. Sci. Total Environ. 2022, 846, 157391. [Google Scholar] [CrossRef]
  29. Waadt, R.; Seller, C.A.; Hsu, P.K.; Takahashi, Y.; Munemasa, S.; Schroeder, J.I. Plant hormone regulation of abiotic stress responses. Nat. Rev. Mol. Cell Biol. 2022, 23, 680–694. [Google Scholar] [CrossRef]
  30. Bartas, M. Abiotic Stresses in Plants: From Molecules to Environment. Int. J. Mol. Sci. 2024, 25, 8072. [Google Scholar] [CrossRef]
  31. Xiang, L.; Liu, L.L.; Sun, S.X.; Li, Y.M.; Jia, L.; Ye, S.L.; Yu, Y.X.; Dossa, K.; Luan, Y.P. Leaf-transcriptome profiles of P. bournei provide insights into temporal drought stress responses. Front. Plant Sci. 2022, 13, 1010314. [Google Scholar] [CrossRef]
  32. Yu, J.J.; Yin, K.; Liu, Y.; Li, Y.H.; Zhang, J.H.; Han, X.; Tong, Z.K. Co-expression network analysis reveals PbTGA4 and PbAPRR2 as core transcription factors of drought response in an important timber species P. bournei. Front. Plant Sci. 2024, 14, 1297235. [Google Scholar] [CrossRef]
  33. Fu, N.N.; Wang, L.; Sun, Q.L.; Wang, Q.G.; Zhang, Y.T.; Han, X.; Yang, Q.; Ma, W.J.; Tong, Z.K.; Zhang, J.H. Genome-wide identification of the bHLH transcription factor family and the regulatory roles of PbbHLH74 in response to drought stress in P. bournei. Int. J. Biol. Macromol. 2024, 262, 123–145. [Google Scholar] [CrossRef]
  34. Liao, W.H.; Tang, X.H.; Li, J.S.; Zheng, Q.M.; Wang, T.; Cheng, S.Z.; Chen, S.P.; Cao, S.J.; Cao, G.Q. Genome wide investigation of Hsf gene family in P bournei: Identification, evolution, and expression after abiotic stresses. J. For. Res. 2023, 35, 11. [Google Scholar] [CrossRef]
  35. Yin, Z.Y.; Liao, W.H.; Li, J.S.; Pan, J.X.; Yang, S.J.; Chen, S.P.; Cao, S.J. Genome-Wide Identification of GATA Family Genes in P. bournei and Their Transcriptional Analysis under Abiotic Stresses. Int. J. Mol. Sci. 2023, 24, 10342. [Google Scholar] [CrossRef] [PubMed]
  36. Zheng, K.H.; Li, M.; Yang, Z.C.; He, C.Y.; Wu, Z.K.; Tong, Z.K.; Zhang, J.H.; Zhang, Y.Z.; Cao, S.J. The Vital Role of the CAMTA Gene Family in P. bournei in Response to Drought, Heat, and Light Stress. Int. J. Mol. Sci. 2024, 25, 9767. [Google Scholar] [CrossRef]
  37. Letunic, I.; Doerks, T.; Bork, P. SMART: Recent updates, new developments and status in 2015. Nucleic Acids Res. 2015, 43, D1, D257–D260. [Google Scholar] [CrossRef] [PubMed]
  38. El-Gebali, S.; Mistry, J.; Bateman, A.; Eddy, S.R.; Luciani, A.; Potter, S.C.; Qureshi, M.; Richardson, L.J.; Salazar, G.A.; Smart, A.; et al. The Pfam protein families database in 2019. Nucleic Acids Res. 2019, 47, D427–D432. [Google Scholar] [CrossRef]
  39. Ye, Q.; Shamloo, S.; Butler, G. TportHMM: Predicting the substrate class of transmembrane transport proteins using profile Hidden Markov Models. In Proceedings of the 2000 IEEE International Conference on Bioinformatics and Biomedicine, Seoul, Republic of Korea, 16–19 December 2020. [Google Scholar] [CrossRef]
  40. Zhang, Z.; Li, J.; Zhao, X.Q.; Wang, J.; Wong, G.K.S.; Yu, J. KaKsCalculator: Calculating Ka and Ks Through Model Selection and Model Averaging. Genom. Proteom. Bioinform. 2006, 4, 259–263. [Google Scholar] [CrossRef]
  41. Bailey, T.L.; Williams, N.; Misleh, C.; Li, W.W. MEME: Discovering and analyzing DNA and protein sequence motifs. Nucleic Acids Res. 2006, 34, W369–W373. [Google Scholar] [CrossRef]
  42. Brito, J.J.; Mosqueiro, T.; Rotman, J.; Xue, V.; Chapski, D.J.; Hoz, J.D.; Matias, P.; Martin, L.S.; Zelikovsky, A.; Pellegrini, M.; et al. Telescope: An interactive tool for managing large-scale analysis from mobile devices. GigaScience 2020, 9, giz163. [Google Scholar] [CrossRef]
  43. Zhao, S.L.; Guo, Y.; Sheng, Q.H.; Shyr, Y. Advanced heat map and clustering analysis using heatmap3. BioMed. Res. Int. 2014, 2014, 986048. [Google Scholar] [CrossRef] [PubMed]
  44. Pfaffl, M.W. A new mathematical model for relative quantification in real-time RT–PCR. Nucleic Acids Res. 2001, 29, e45. [Google Scholar] [CrossRef]
  45. Livak, K.J.; Schmittgen, T.D. Analysis of relative gene expression data using real-time quantitative PCR and the 2(-Delta Delta C(T)) Method. Methods 2001, 25, 402–408. [Google Scholar] [CrossRef] [PubMed]
  46. Mravec, J.; Skůpa, P.; Bailly, A.; Hoyerová, K.; Krecek, P.; Bielach, A.; Petrásek, J.; Zhang, J.; Gaykova, V.; Stierhof, Y.D.; et al. Subcellular homeostasis of phytohormone auxin is mediated by the ER-localized PIN5 transporter. Nature 2009, 459, 1136–1140. [Google Scholar] [CrossRef] [PubMed]
  47. Thompson, J.D.; Gibson, T.J.; Plewniak, F.; Jeanmougin, F.; Higgins, D.G. The CLUSTAL_X windows interface: Flexible strategies for multiple sequence alignment aided by quality analysis tools. Nucleic Acids Res. 1997, 25, 4876–4882. [Google Scholar] [CrossRef]
  48. Zhou, Y.; Xu, D.X.; Jia, L.D.; Huang, X.H.; Ma, G.Q.; Wang, S.X.; Zhu, M.C.; Zhang, A.X.; Guan, M.W.; Lu, K.; et al. Genome-Wide Identification and Structural Analysis of bZIP Transcription Factor Genes in Brassica napus. Genes 2017, 8, 288. [Google Scholar] [CrossRef]
  49. Li, F.Q.; Wang, J.Y.; Wang, P.C.; Li, L. Dephosphorylation of bZIP59 by PP2A ensures appropriate shade avoidance response in Arabidopsis. Dev. Cell 2025, 60, 551–566.e6. [Google Scholar] [CrossRef]
  50. Le Hir, H.; Nott, A.; Moore, M.J. How introns influence and enhance eukaryotic gene expression. Trends Biochem. Sci. 2003, 28, 215–220. [Google Scholar] [CrossRef]
  51. Ahluwalia, O.; Singh, P.C.; Bhatia, R. A review on drought stress in plants: Implications, mitigation and the role of plant growth promoting rhizobacteria. Resour. Environ. Sustain. 2021, 1, 100032. [Google Scholar] [CrossRef]
  52. Ma, Y.M.; Zhong, M.C.; Li, J.S.; Jiang, Y.M.; Zhou, X.R.; Justice Ijeoma, C.; Tang, X.H.; Chen, S.P.; Cao, S.J. Genome Identification and Evolutionary Analysis of LBD Genes and Response to Environmental Factors in P. bournei. Int. J. Mol. Sci. 2023, 24, 12581. [Google Scholar] [CrossRef]
  53. Wang, H.; Zhang, Y.T.; Norris, A.; Jiang, C.Z. S1-bZIP Transcription Factors Play Important Roles in the Regulation of Fruit Quality and Stress Response. Front. Plant Sci. 2022, 12, 802802. [Google Scholar] [CrossRef]
  54. Abdulraheem, M.I.; Xiong, Y.; Moshood, A.Y.; Cadenas-Pliego, G.; Zhang, H.; Hu, J. Mechanisms of Plant Epigenetic Regulation in Response to Plant Stress: Recent Discoveries and Implications. Plants 2024, 13, 163. [Google Scholar] [CrossRef]
  55. Manzoor, M.A.; Manzoor, M.M.; Li, G.H.; Abdullah, M.; Han, W.; Wenlong, H.; Shakoor, A.; Riaz, M.W.; Rehman, S.; Cai, Y.P. Genome-wide identification and characterization of bZIP transcription factors and their expression profile under abiotic stresses in Chinese pear (Pyrus bretschneideri). BMC Plant Biol. 2021, 21, 413. [Google Scholar] [CrossRef] [PubMed]
  56. Takeo, K.; Ito, T. Subcellular localization of VIP1 is regulated by phosphorylation and 14-3-3 proteins. FEBS Lett. 2017, 591, 1972–1981. [Google Scholar] [CrossRef]
  57. Duan, L.L.; Mo, Z.J.; Fan, Y.; Li, K.Y.; Yang, M.F.; Li, D.C.; Ke, Y.Z.; Zhang, Q.; Wang, F.Y.; Fan, Y.; et al. Genome-wide identification and expression analysis of the bZIP transcription factor family genes in response to abiotic stress in Nicotiana tabacum L. BMC Genom. 2022, 23, 318. [Google Scholar] [CrossRef]
  58. Tian, Y.; Song, K.K.; Li, B.; Song, Y.R.; Zhang, X.H.; Li, H.Z.; Yang, L. Genome-wide identification and expression analysis of NF-Y gene family in tobacco (Nicotiana tabacum L.). Sci. Rep. 2024, 14, 5257. [Google Scholar] [CrossRef] [PubMed]
  59. Moore, R.C.; Purugganan, M.D. The early stages of duplicate gene evolution. Proc. Natl. Acad. Sci. USA 2003, 100, 15682–15687. [Google Scholar] [CrossRef] [PubMed]
  60. Emanuel, B.S.; Shaikh, T.H. Segmental duplications: An ‘expanding’ role in genomic instability and disease. Nat. Rev. Genet. 2001, 2, 791–800. [Google Scholar] [CrossRef]
  61. Gemayel, R.; Vinces, M.D.; Legendre, M.; Verstrepen, K.J. Variable tandem repeats accelerate evolution of coding and regulatory sequences. Annu. Rev. Genet. 2010, 44, 445–477. [Google Scholar] [CrossRef]
  62. Tuskan, G.A.; Difazio, S.; Jansson, S.; Bohlmann, J.; Grigoriev, I.; Hellsten, U.; Putnam, N.; Ralph, S.; Rombauts, S.; Salamov, A.; et al. The genome of black cottonwood, Populus trichocarpa (Torr. & Gray). Science 2006, 313, 1596–1604. [Google Scholar] [CrossRef]
  63. Vision, T.J.; Brown, D.G.; Tanksley, S.D. The origins of genomic duplications in Arabidopsis. Science 2000, 290, 2114–2117. [Google Scholar] [CrossRef] [PubMed]
  64. Guo, Y.P.; Amir, A. Exploring the effect of network topology, mRNA and protein dynamics on gene regulatory network stability. Nat. Commun. 2021, 12, 130. [Google Scholar] [CrossRef] [PubMed]
  65. Tang, W.; Ru, Y.Y.; Hong, L.; Zhu, Q.; Zuo, R.F.; Guo, X.X.; Wang, J.Z.; Zhang, H.F.; Zheng, X.B.; Wang, P.; et al. System-wide characterization of bZIP transcription factor proteins involved in infection-related morphogenesis of Magnaporthe oryzae. Environ. Microbiol. 2015, 17, 1377–1396. [Google Scholar] [CrossRef] [PubMed]
  66. He, Q.; Cai, H.Y.; Bai, M.Y.; Zhang, M.; Chen, F.Q.; Huang, Y.M.; Priyadarshani, S.V.G.N.; Chai, M.N.; Liu, L.P.; Liu, Y.H.; et al. A Soybean bZIP Transcription Factor GmbZIP19 Confers Multiple Biotic and Abiotic Stress Responses in Plant. Int. J. Mol. Sci. 2020, 21, 4701. [Google Scholar] [CrossRef] [PubMed]
  67. Wang, J.; Chen, L.; Long, Y.; Si, W.N.; Cheng, B.J.; Jiang, H.Y. A Novel Heat Shock Transcription Factor (ZmHsf08) Negatively Regulates Salt and Drought Stress Responses in Maize. Int. J. Mol. Sci. 2021, 22, 11922. [Google Scholar] [CrossRef]
Figure 1. Chromosomal location of the identified PbbZIP genes in P. bournei. The chromosomal location of the 71 mapped PbbZIP genes is depicted from top to bottom. The scale bar is in megabases (Mb). Chromosome numbers are counted from the left side of the corresponding chromosomes. The colors red and blue indicate gene distribution within a chromosome, with red signifying a high distribution.
Plants 14 02292 g001
Figure 2. The multiple sequence alignment of the DNA binding domain in the PbbZIP protein sequence using Jalview-2.11.3.0 software.
Plants 14 02292 g002
Figure 3. (A) Phylogenetic analysis of complete bZIP protein sequences from P. bournei (Pb) and A. thaliana (At). The number on the branch signifies the reliability of the node based on 1000 iterations of bootstrap analysis. Asterisks (*) indicate strong statistical support (bootstrap value > 90) for specific nodes. Branches of different colors represent different subfamilies. Key divergence points are marked with diamonds (♦), illustrating significant evolutionary and speciation events within the PbbZIP gene family in response to stress conditions. (B) Homology analysis between the P. bournei genome and the A. thaliana genome. The gray lines represent the aligned blocks between paired genomes, and the red lines denote collinear PbbZIP gene pairs.
Plants 14 02292 g003
Figure 4. The genome map of Phoebe bournei is displayed as a circle. The outer segments of the circle correspond to the 12 assembled chromosomes, which are labeled sequentially from chromosome 1 (Chr01) to chromosome 12 (Chr12). Looking inward from the outermost edge of each chromosome segment, the first circle presents nucleotide positions measured in megabases (Mb), which scale the genetic map. Immediately adjacent to this is a visual display of gene density, where the peaked portions imply regions of denser genes. The gray lines in the innermost circle represent all replicated gene pairs in the Phoebe bournei genome, while the blue lines indicate the co-located gene pairs of PbbZIP.
Plants 14 02292 g004
Figure 5. Distribution of conserved motifs of the PbbZIP protein.
Plants 14 02292 g005
Figure 6. Exon–intron structure of the PbbZIP genes. Green boxes indicate exons (CDS), black lines indicate introns, and yellow boxes indicate 5′ and 3′ untranslated regions.
Plants 14 02292 g006
Figure 7. Predicted cis-acting elements in the promoter regions of PbbZIP genes. The one on the left is the promoter position (−2000 bp). The cis-acting regulatory elements in the promoter were categorized into 22 types, each represented by a different color. The lower axis denotes the quantity of each cis-acting element.
Plants 14 02292 g007
Figure 8. Tissue-specific gene expression patterns of 71 PbbZIP genes. The expression patterns of genes in the root bark, root xylem, stem bark, stem xylem, and leaf. The red and blue colors indicate the high and low transcript abundance, respectively.
Plants 14 02292 g008
Figure 9. The relative expression levels of PbbZIP genes responding to abiotic stresses, as determined by RT-qPCR, were represented by pink for high salt, green for high temperature, and blue for drought stress, under each treatment at the same time points (0, 6, 12, and 24 h). Significances were indicated by different letters according to one-way ANOVA and Tukey’s multiple range tests (p < 0.05).
Plants 14 02292 g009
Table 1. List of internal reference genes and primers used.
Gene NameForward Primer (5′-3′)Reverse Primer (5′-3′)
PbZIP14GCAGCCTGGTGAGGTAGCGTGGACGTGGGGTAAGGC
PbZIP26AGAGGTCCGAGTCCGCAACGTTCAACCCTTCCGCCT
PbZIP32GACGAGCACCACAGGCATTCGGACTTGGCGGCAATT
PbZIP67TCGGCATGCCTGATGGTGTGACTCAGAGTCCGCGGA
PbZIP69CATGGCCCCTGCAAGTGTGGCACCACTCCACTTGCT
PbEF1αCATTCAAGTATGCGTGGGTACGGTGACCAGGAGCA
Table 2. Detailed information on 71 PbbZIP Genes of P. bournei and their encoded proteins.
Gene AccessionIDAA/aa MW/DaTheoretical pI Aliphatic IndexGRAVYSubcellular
Localization
OF19974-RAPbbZIP139941,600.655.8951.93−0.67Nucleus
OF19973-RAPbbZIP214416,506.956.2882.64−0.585Nucleus
OF19914-RAPbbZIP313615,566.319.5255.96−1.396Nucleus
OF10270-RAPbbZIP423125,909.158.558.74−0.698Nucleus
OF18209-RAPbbZIP519822,954.66.7172.47−0.855Nucleus
OF02523-RAPbbZIP614116,414.997.882.34−0.684Nucleus
OF11694-RAPbbZIP715918,344.7210.2976.73−0.76Nucleus
OF11818-RAPbbZIP832536,545.429.2569.05−0.674Nucleus
OF11930-RAPbbZIP919923,154.876.0579.4−0.855Nucleus
OF28301-RAPbbZIP1014416,675.16.1975.83−0.704Nucleus
OF28225-RAPbbZIP1144749,195.236.2878.68−0.46Nucleus
OF04812-RAPbbZIP1232736,606.148.6864.68−0.878Nucleus
OF04669-RAPbbZIP1336841,352.86.7380.92−0.451Nucleus
OF06905-RAPbbZIP1432235,902.667.9679.97−0.577Nucleus
OF08770-RAPbbZIP15748813.2810.3459.46−1.295Nucleus
OF03422-RAPbbZIP1637341,747.126.8863.06−0.914Nucleus
OF22080-RAPbbZIP1716919,451.179.2370.89−0.337Nucleus
OF12918-RAPbbZIP1837441,217.75.5170.43−0.613Nucleus
OF09866-RAPbbZIP1938742,269.256.3861.4−0.716Nucleus
OF05546-RAPbbZIP2043345,888.299.0164.09−0.659Nucleus
OF25842-RAPbbZIP2136840,364.28.7457.61−0.713Nucleus
OF24005-RAPbbZIP2236541,331.58.3783.64−0.368Nucleus
OF23680-RAPbbZIP2327731,093.665.5176.03−0.716Nucleus
OF23482-RAPbbZIP2449655,948.956.4281.47−0.393Nucleus
OF23448-RAPbbZIP2546152,301.175.7876.68−0.558Nucleus
OF10424-RAPbbZIP2633938,460.284.7881.36−0.556Nucleus
OF01790-RAPbbZIP2711713,424.646.7290.85−0.318Nucleus
OF01865-RAPbbZIP2813515,1576.1967.19−0.977Nucleus
OF01905-RAPbbZIP2932435,867.177.1965.12−0.762Nucleus
OF01159-RAPbbZIP3041945,724.987.8374.61−0.562Nucleus
OF00429-RAPbbZIP3124426,831.465.5167.99−0.641Nucleus
OF29773-RAPbbZIP3237439,382.745.9647.83−0.74Nucleus
OF27741-RAPbbZIP3347051,343.316.8976.47−0.514Nucleus
OF15721-RAPbbZIP3433737,502.447.0368.31−0.788Nucleus
OF15812-RAPbbZIP3521724,620.47.0376.45−0.745Nucleus
OF11162-RAPbbZIP3659765,168.158.8356.52−0.898Nucleus
OF10986-RAPbbZIP3728029,704.175.4567.93−0.514Nucleus
OF10903-RAPbbZIP3812114,142.058.5457.27−1.001Nucleus
OF09410-RAPbbZIP3913916,192.436.8373.74−0.831Nucleus
OF09226-RAPbbZIP4036339,949.876.1974.71−0.599Nucleus
OF07945-RAPbbZIP4138942,749.745.9768.71−0.666Nucleus
OF05157-RAPbbZIP4228431,775.426.5169.75−0.744Nucleus
OF05208-RAPbbZIP4346852,189.656.5274.49−0.58Nucleus
OF05212-RAPbbZIP4441645,1108.7859.59−0.779Nucleus
OF19397-RAPbbZIP4540746,959.18.763.51−0.926Nucleus
OF19394-RAPbbZIP4617720,625.176.4480.96−0.801Nucleus
OF18693-RAPbbZIP4716718,448.379.7460.78−1.117Nucleus
OF18548-RAPbbZIP4815017,606.1911.4594.87−0.687Nucleus`
OF28795-RAPbbZIP4945350,318.036.5578.9−0.482Nucleus
OF26318-RAPbbZIP5015117,332.696.5979.47−0.643Nucleus
OF26807-RAPbbZIP5114316,152.739.7183.15−0.45Nucleus
OF24581-RAPbbZIP5223525,001.19.5657.74−0.487Nucleus
OF06079-RAPbbZIP5358464,394.126.6558.18−0.9Nucleus
OF29662-RAPbbZIP5427329,723.976.5562.89−0.756Nucleus
OF16038-RAPbbZIP5516919,301.849.6261.83−0.872Nucleus
OF02992-RAPbbZIP5637642,234.627.6860.51−0.903Nucleus
OF03083-RAPbbZIP5743146,862.339.6163.34−0.757Nucleus
OF03232-RAPbbZIP5826229,182.169.5947.33−0.919Nucleus
OF01374-RAPbbZIP5943046,845.645.5764.02−0.78Nucleus
OF10634-RAPbbZIP6017020,349.27.7468.82−1.127Nucleus
OF29018-RAPbbZIP6140343,556.636.6156.23−0.771Nucleus
OF28905-RAPbbZIP6235839,138.266.562.23−0.794Nucleus
OF18055-RAPbbZIP6326529,261.846.3860.75−0.774Nucleus
OF20655-RAPbbZIP6434838,339.975.8962.61−0.615Nucleus
OF20635-RAPbbZIP6541945,891.115.3963.56−0.692Nucleus
OF14232-RAPbbZIP6626028,706.326.8271.69−0.58Nucleus
OF17740-RAPbbZIP6736641,515.218.3980.25−0.485Nucleus
OF17491-RAPbbZIP6818019,918.458.6871.56−0.411Nucleus
OF12212-RAPbbZIP6940943,379.936.1849.24−0.838Nucleus
OF07610-RAPbbZIP7044848,779.587.1878.04−0.485Nucleus
OF26090-RAPbbZIP7183988,864.946.4168.1−0.464Nucleus
Note: AA/aa: number of amino acids; MW/Da: molecular weight; pI: theoretical isoelectric point; Aliphatic Index: aliphatic index; GRAVY: grand average of hydropathicity.
Table 3. Synteny information and subfamily classification of bZIP genes in 45 groups of P. bournei and A. thaliana.
A. Thaliana Gene IDA. Thaliana Gene NameCLASSP. bournei Gene IDP. bournei Gene NameCLASS
AT5G49450ATbZIP1SOF08770-RAPbbZIP15S
AT5G49450ATbZIP1SOF06079-RAPbbZIP53S
AT2G18160ATbZIP2SOF09410-RAPbbZIP39S
AT5G15830ATbZIP3SOF15812-RAPbbZIP35S
AT3G49760ATbZIP5SOF04812-RAPbbZIP12S
AT3G49760ATbZIP5SOF10986-RAPbbZIP37S
AT2G22850ATbZIP6SOF04812-RAPbbZIP12S
AT2G22850ATbZIP6SOF10986-RAPbbZIP37S
AT4G37730ATbZIP7SOF04812-RAPbbZIP12S
AT4G37730ATbZIP7SOF10986-RAPbbZIP37S
AT4G34590ATbZIP11SOF09410-RAPbbZIP39S
AT4G35900ATbZIP14AOF24005-RAPbbZIP22A
AT4G35900ATbZIP14AOF05212-RAPbbZIP44A
AT4G35900ATbZIP14AOF17491-RAPbbZIP68A
AT5G42910ATbZIP15AOF17740-RAPbbZIP67A
AT2G40950ATbZIP17BOF23448-RAPbbZIP25B
AT2G40620ATbZIP18IOF12918-RAPbbZIP18I
AT4G35040ATbZIP19FOF01865-RAPbbZIP28F
AT4G35040ATbZIP19FOF05208-RAPbbZIP43F
AT5G06950ATbZIP20DOF10903-RAPbbZIP38D
AT1G22070ATbZIP22DOF25842-RAPbbZIP21D
AT2G16770ATbZIP23FOF01865-RAPbbZIP28F
AT2G16770ATbZIP23FOF05208-RAPbbZIP43F
AT2G17770ATbZIP27AOF24005-RAPbbZIP22A
AT2G17770ATbZIP27AOF17491-RAPbbZIP68A
AT4G38900ATbZIP29IOF01790-RAPbbZIP27I
AT4G38900ATbZIP29IOF05157-RAPbbZIP42I
AT2G21230ATbZIP30IOF01790-RAPbbZIP27I
AT2G21230ATbZIP30IOF05157-RAPbbZIP42I
AT2G42380ATbZIP34EOF00429-RAPbbZIP31E
AT3G19290ATbZIP38AOF17740-RAPbbZIP67A
AT4G36730ATbZIP41GOF16038-RAPbbZIP55H
AT1G75390ATbZIP44SOF09410-RAPbbZIP39S
AT5G65210ATbZIP47DOF19397-RAPbbZIP45D
AT3G56660ATbZIP49BOF23448-RAPbbZIP25B
AT1G77920ATbZIP50DOF19397-RAPbbZIP45D
AT3G62420ATbZIP53SOF08770-RAPbbZIP15S
AT3G62420ATbZIP53SOF06079-RAPbbZIP53S
AT3G62420ATbZIP53SOF10634-RAPbbZIP60S
AT5G11260ATbZIP56HOF11162-RAPbbZIP36H
AT5G10030ATbZIP57DOF25842-RAPbbZIP21D
AT3G17609ATbZIP64HOF03083-RAPbbZIP57H
AT5G06839ATbZIP65DOF02523-RAPbbZIP6D
AT5G06839ATbZIP65DOF19974-RAPbbZIP1D
AT1G32150ATbZIP68GOF18055-RAPbbZIP63G
Disclaimer/Publisher’s Note: The statements, opinions and data contained in all publications are solely those of the individual author(s) and contributor(s) and not of MDPI and/or the editor(s). MDPI and/or the editor(s) disclaim responsibility for any injury to people or property resulting from any ideas, methods, instructions or products referred to in the content.

