


Influence and Optimization of Landscape Elements on Outdoor Thermal Comfort in University Plazas in Severely Cold Regions


Abstract

1. Introduction
- (1)
- To determine the outdoor thermal benchmarks for plaza users during summer and winter;
- (2)
- To quantify the impact, significance, and contribution of different landscape elements on thermal comfort;
- (3)
- To identify the optimal design scheme for thermal comfort across both summer and winter seasons;
- (4)
- To propose nature-based solutions tailored for severely cold regions.
2. Methodology
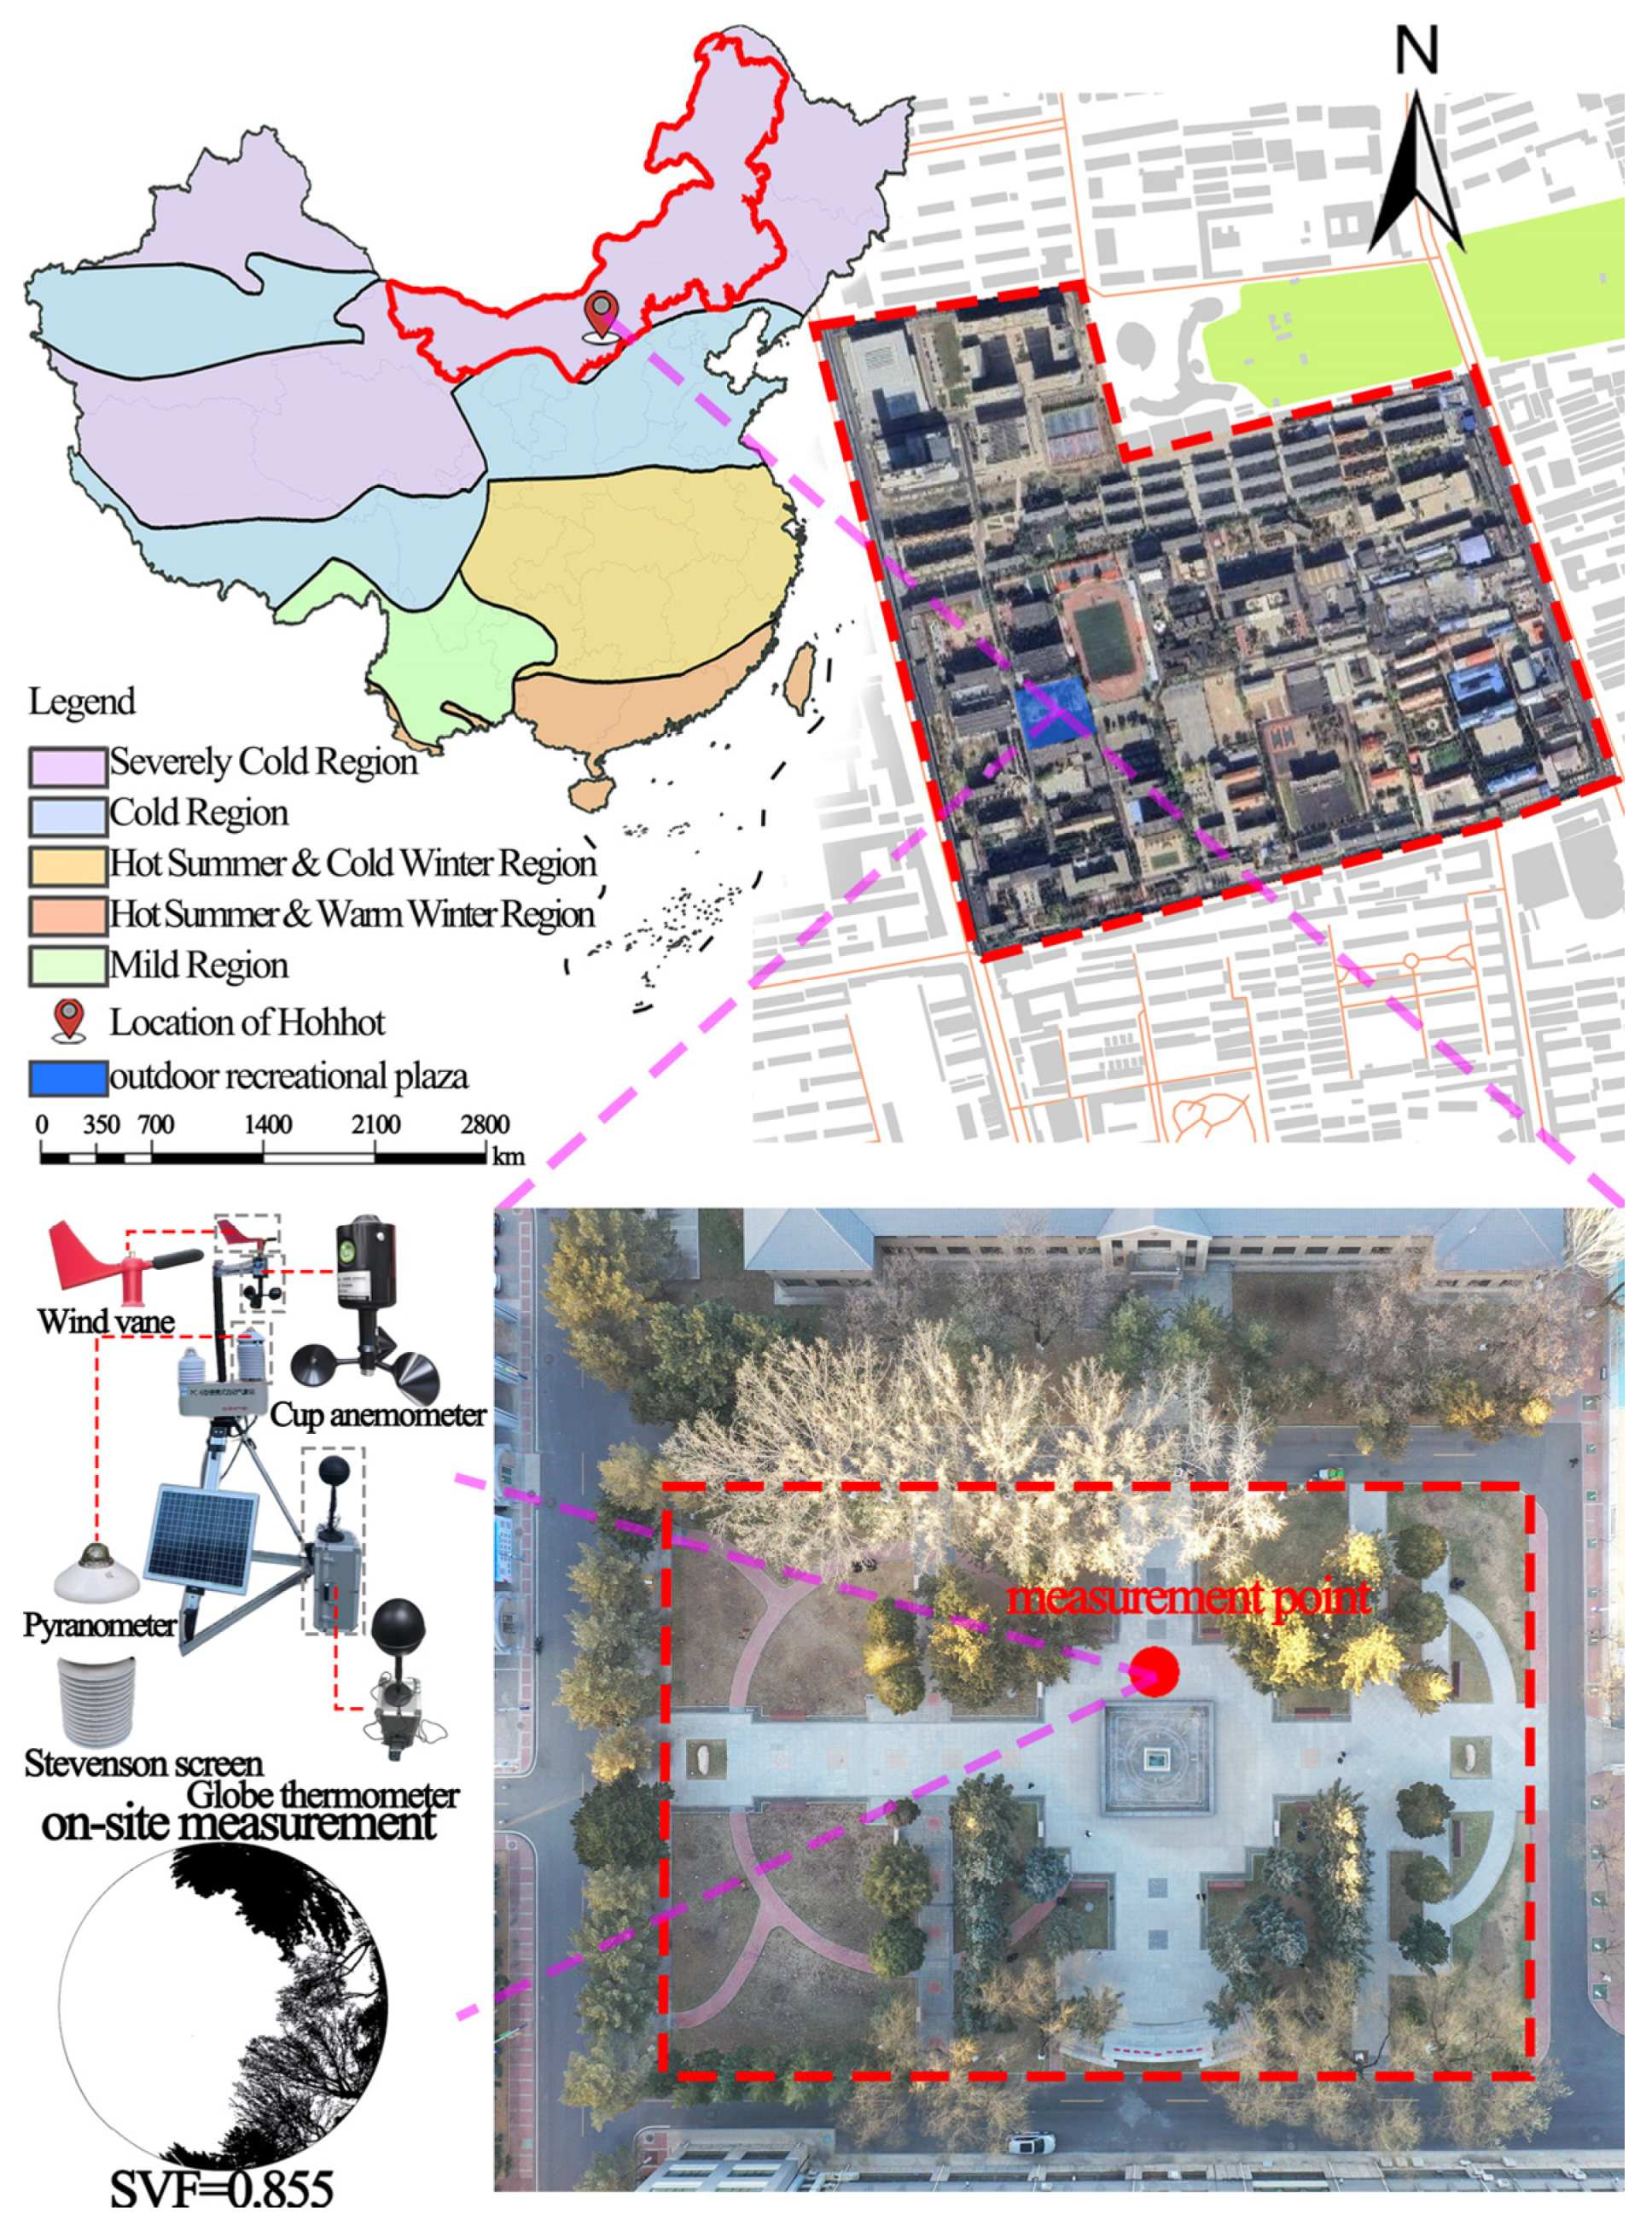
2.1. Study Site and Field Measurements
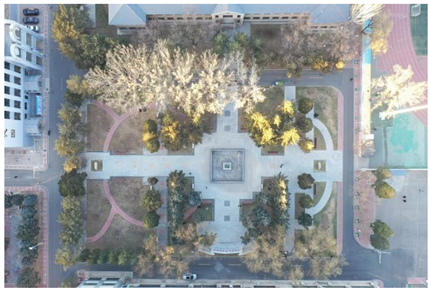
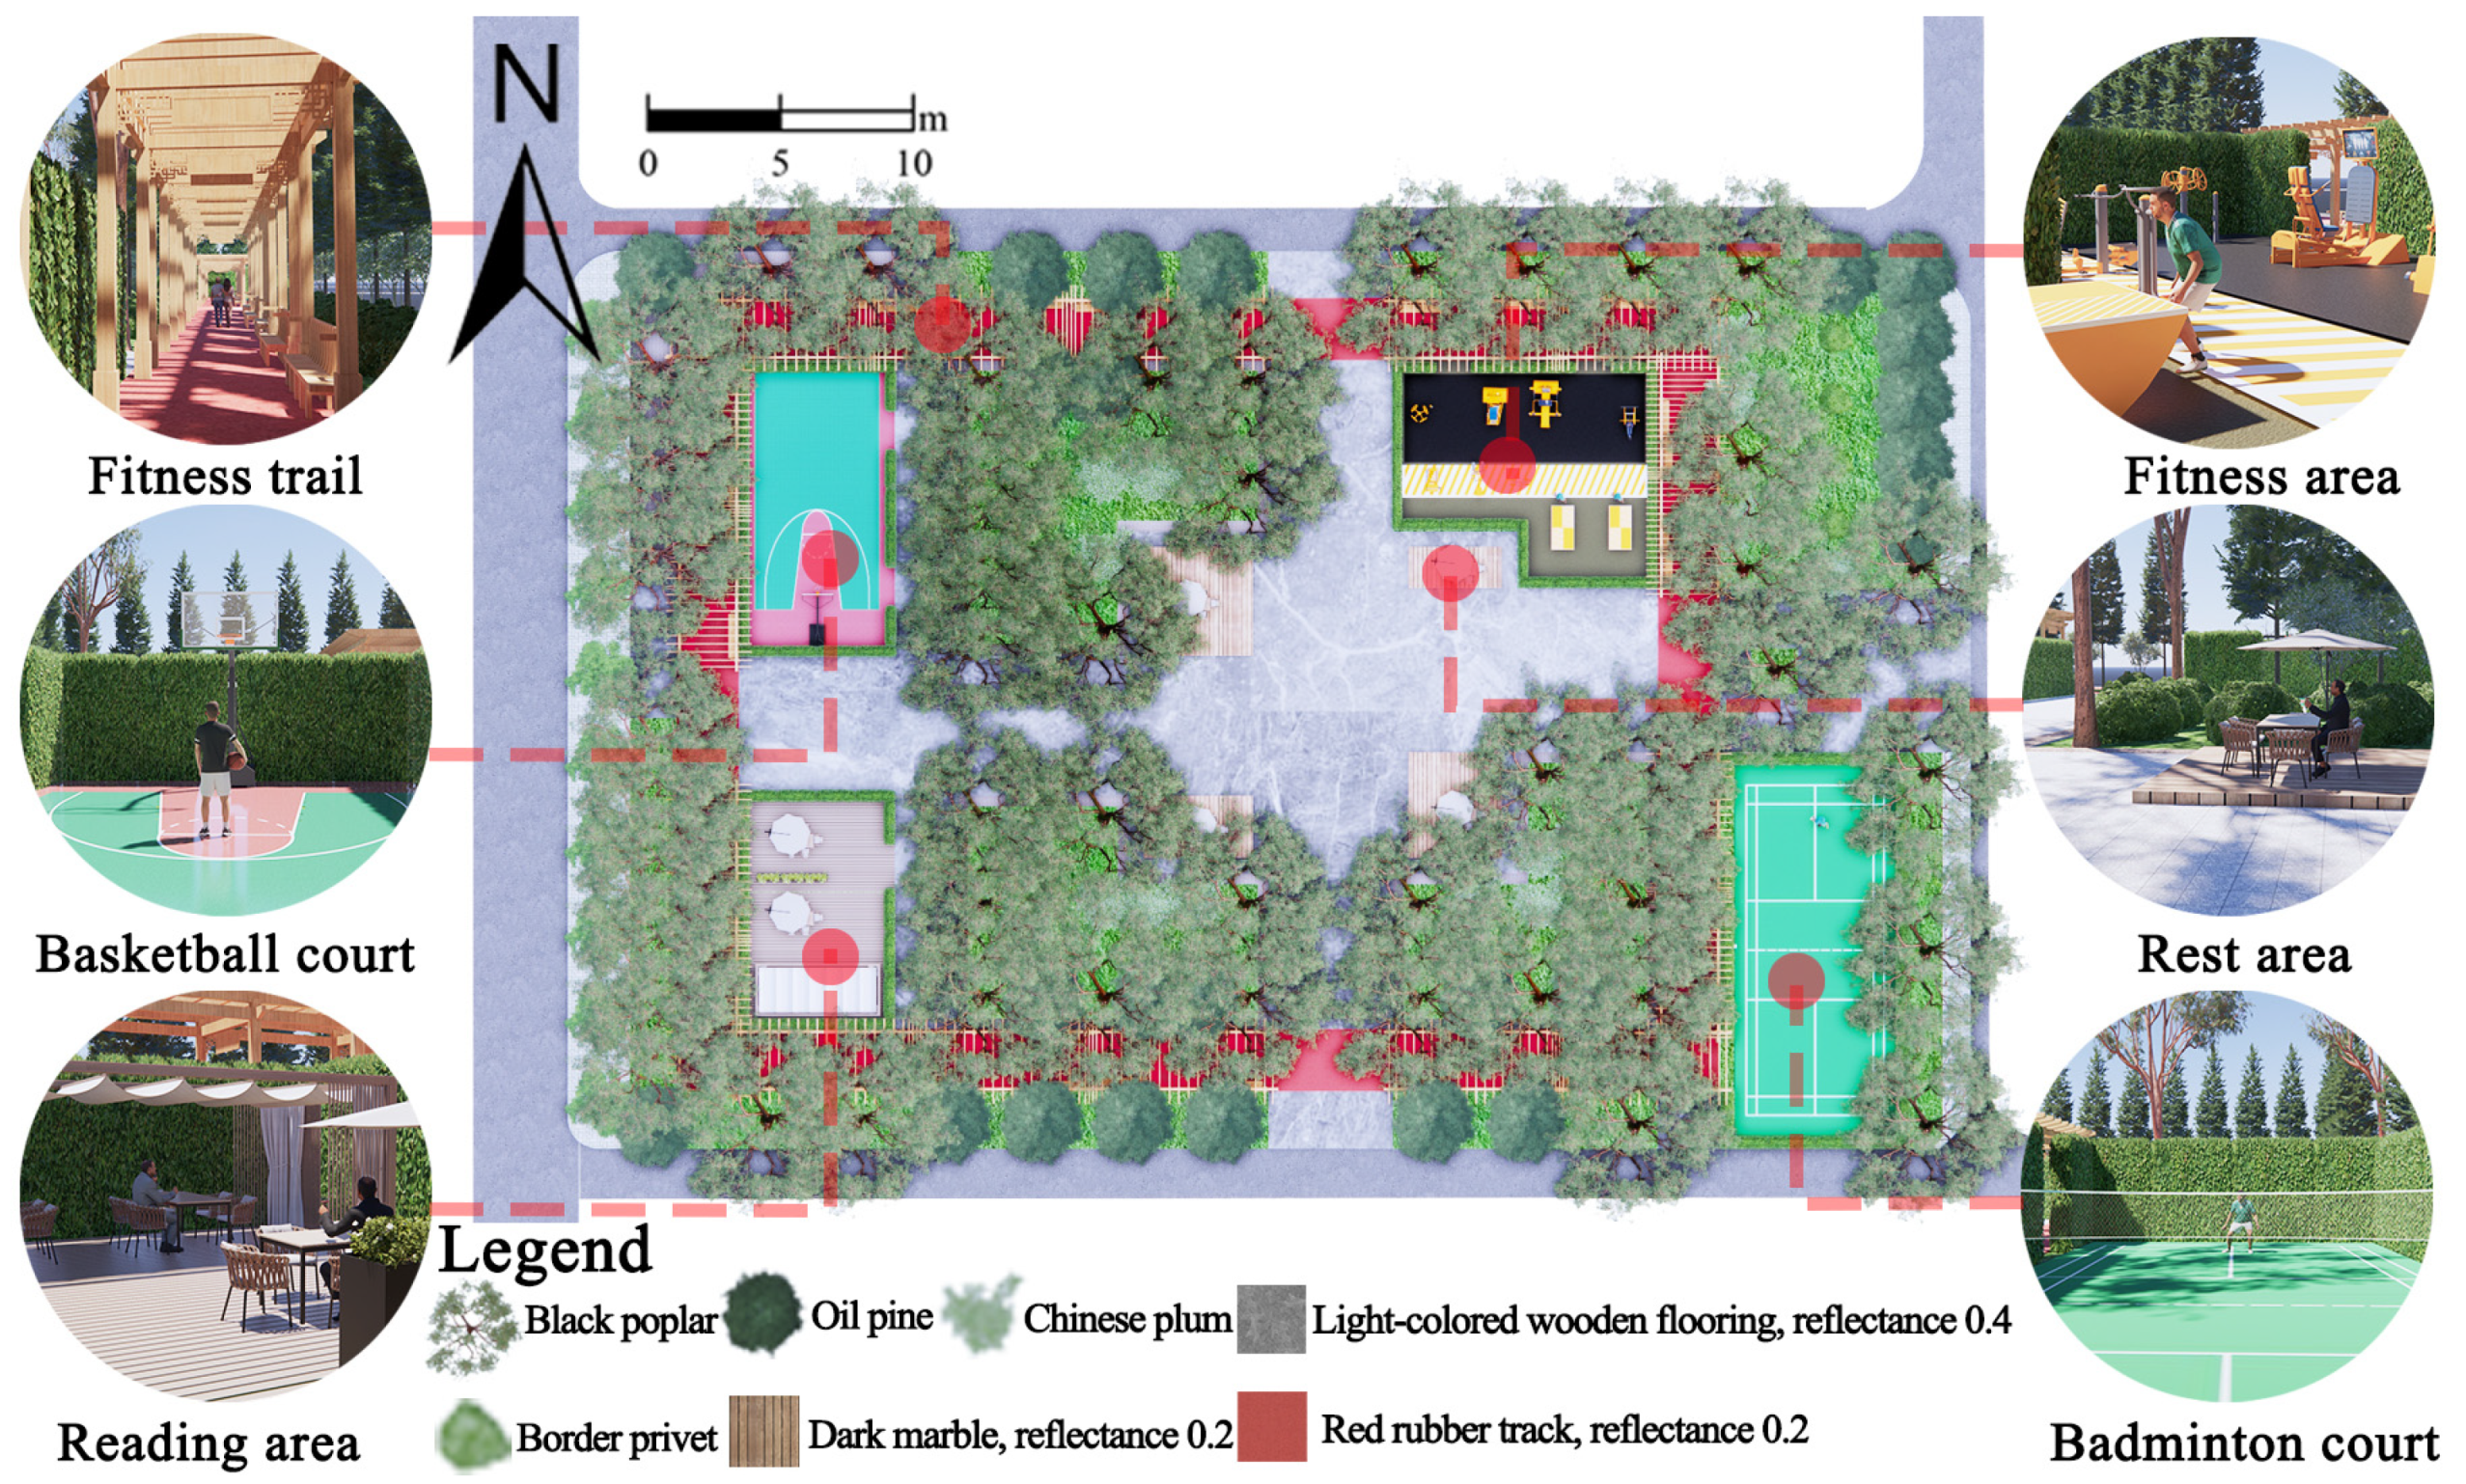
2.1.1. Study Site
2.1.2. Survey Dates
- (1)
- Obtain the hourly values of air temperature, relative humidity, wind speed, and horizontal solar radiation for each day, and calculate the hourly mean values of each parameter for the month;
- (2)
- Compute the MAPE of each parameter by comparing the hourly values of each day against the monthly hourly averages;
- (3)
- Apply a weighted aggregation of the MAPE values using the weight ratio 1:1:1:3 across the four parameters. The day with the smallest cumulative weighted MAPE is selected as the typical meteorological day.
- denotes the hourly value of a meteorological parameter on a given day at hour i;
- represents the corresponding hourly average of that parameter for the month;
- represents the number of selected hours per day;
- refers to the cumulative weighted Mean Absolute Percentage Error for a given TMD;
- is the weight assigned to the i-th meteorological parameter;
- is the MAPE of the i-th parameter on the candidate day.
2.1.3. Field Measurements
- is the globe temperature measured by the globe thermometer (°C);
- is the wind speed measured by the portable meteorological station (m/s);
- is the air temperature measured by the portable meteorological station (°C);
- is the diameter of the globe thermometer (m, the standard black globe with a diameter of 0.15 m was used for measurements in this study);
- is the emissivity of the globe surface (taken as 0.95 in this study).
2.2. Subjective Questionnaire Survey
2.2.1. Questionnaire Structure and Reliability Testing
- represents the probability of a Type I error, which is generally set at α = 0.05;
- is the Z-score corresponding to a 95% confidence level, Z0.975 = 1.96;
- denotes the population standard deviation, σ = 1.5 [49];
- represents the acceptable margin of error, set at 5% of the thermal sensation scale length (E = 0.3).
- represents the number of items in the questionnaire;
- is the variance of the i-th item;
- is the total variance of all items.
2.2.2. Outdoor Thermal Comfort Index
2.3. Experimental Design
2.3.1. Configuration of Landscape Elements
2.3.2. Orthogonal Experimental Design
2.3.3. ENVI-met Boundary Conditions
2.3.4. Model Accuracy Validation
- : predicted value;
- : observed value;
- : number of cases;
- : reflects the overall deviation of the predictions;
- : directly reflects the average magnitude of the prediction error.
3. Results
3.1. Characteristics of Outdoor Activities and Thermal Benchmarks
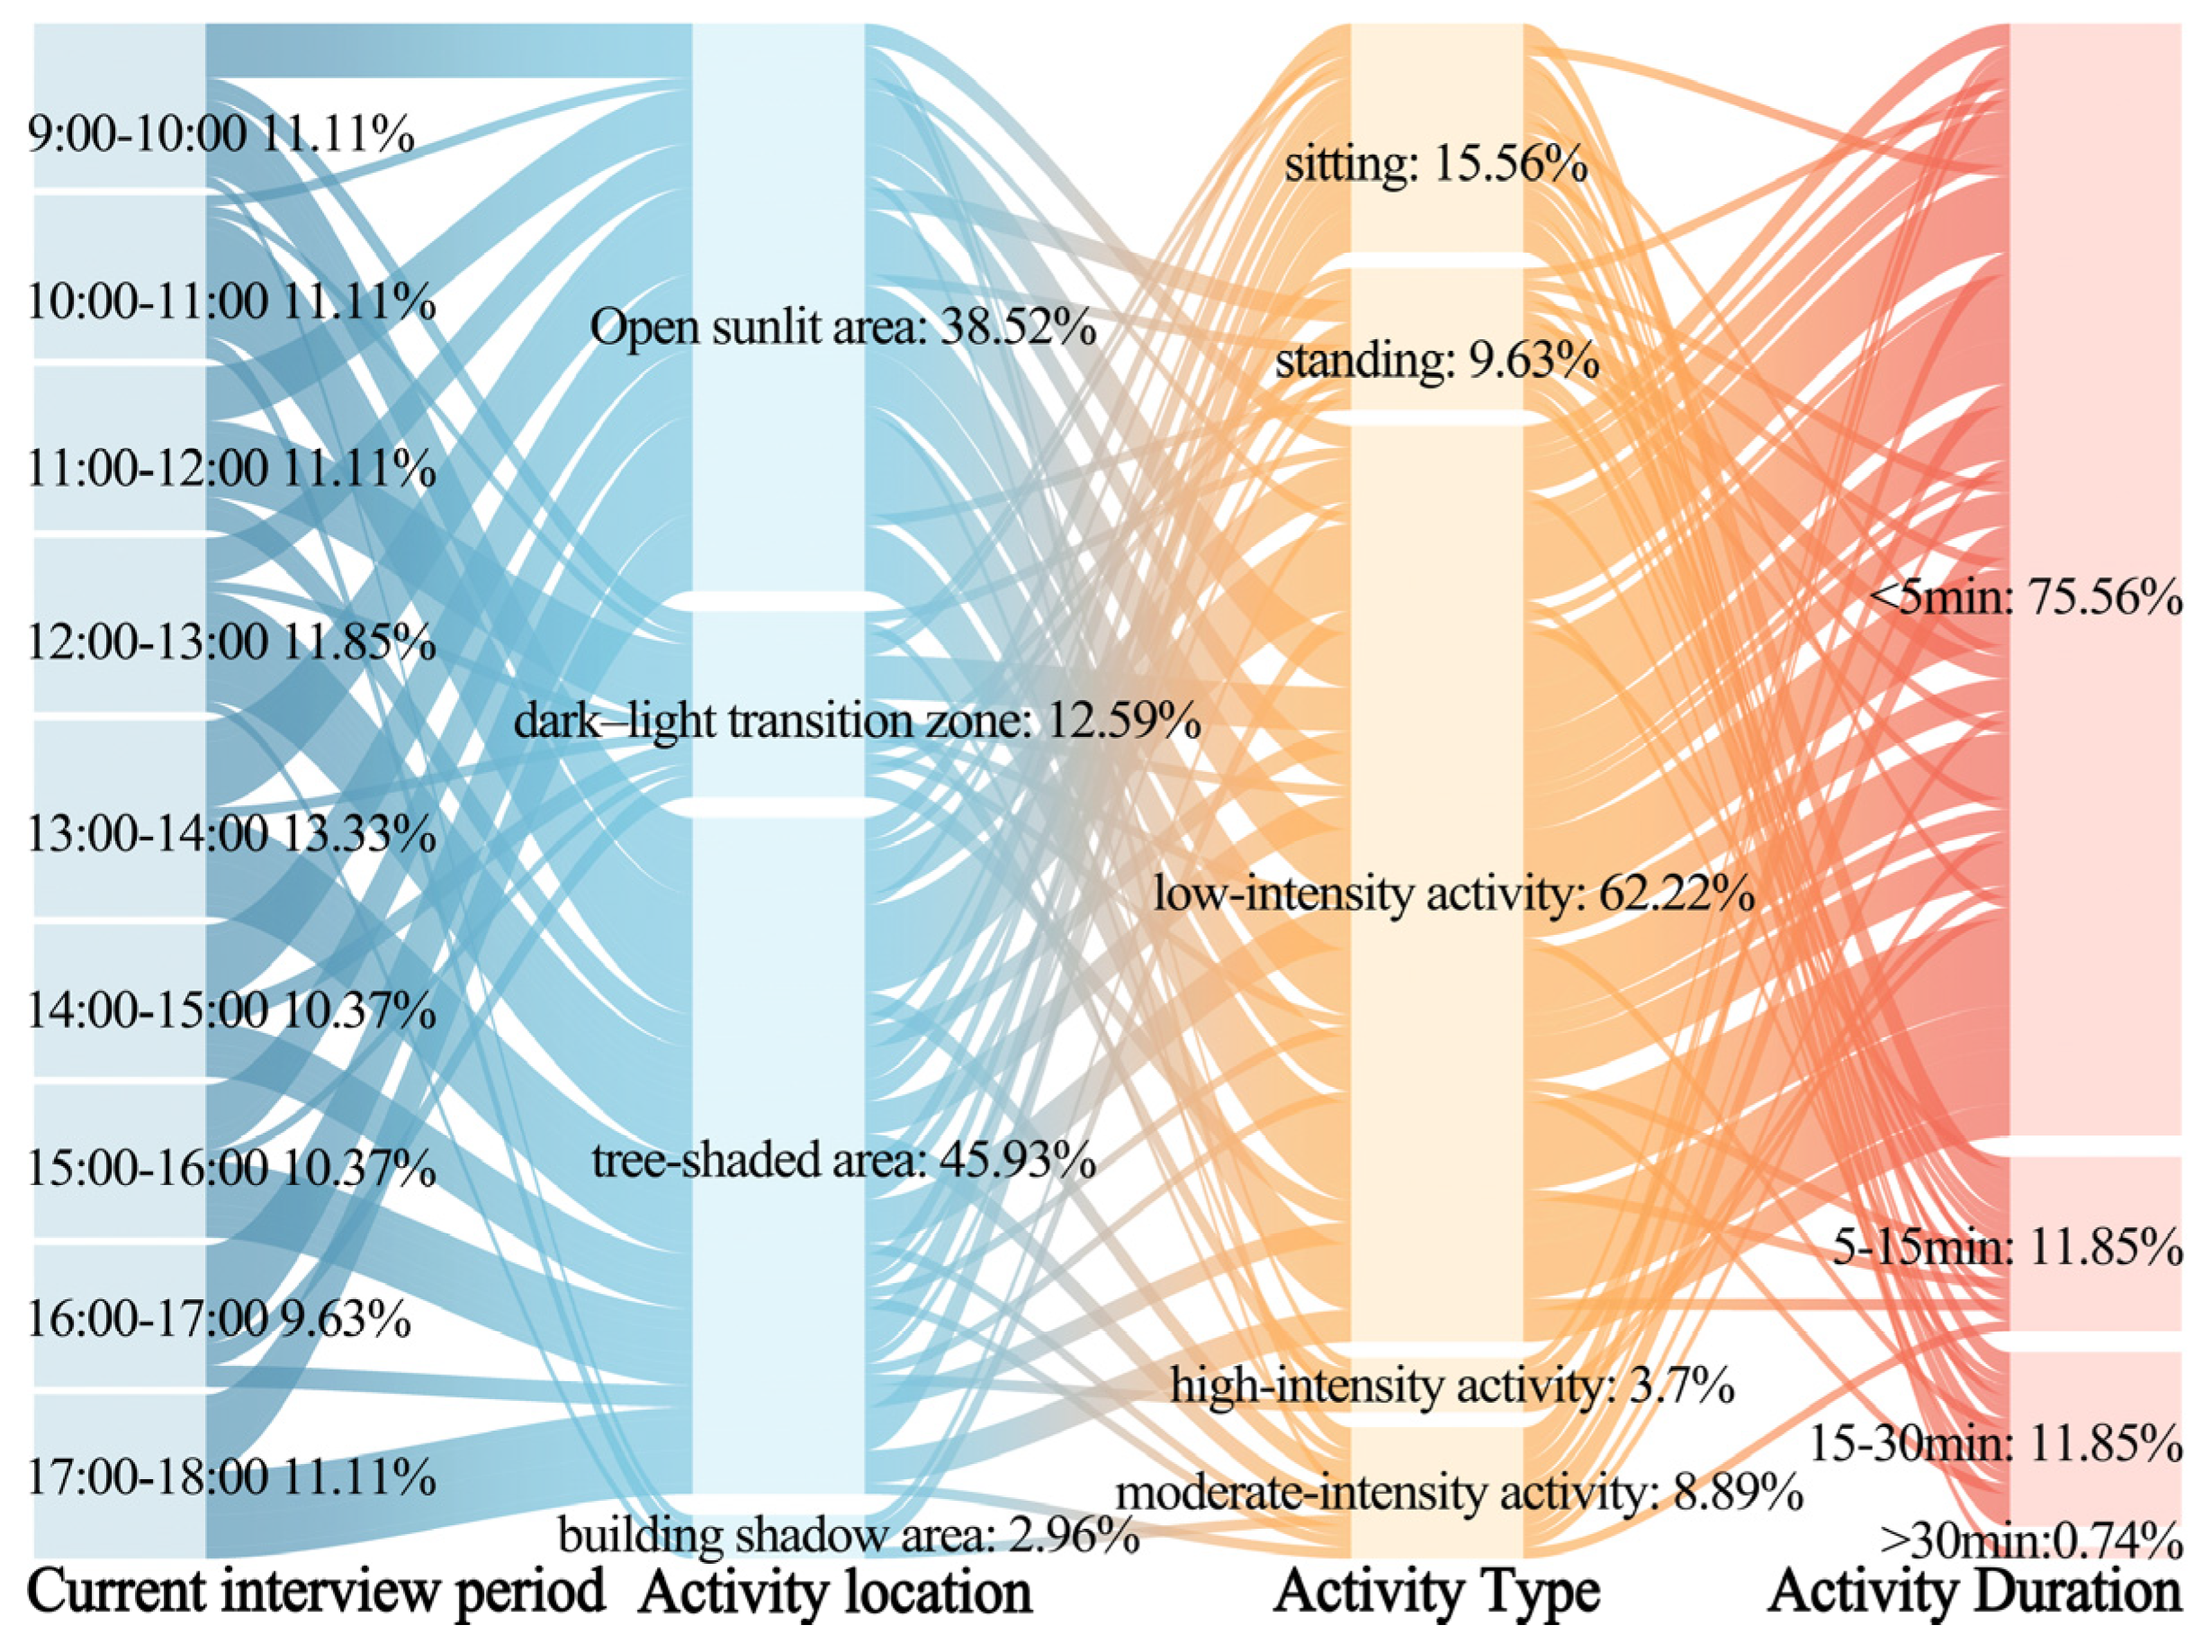
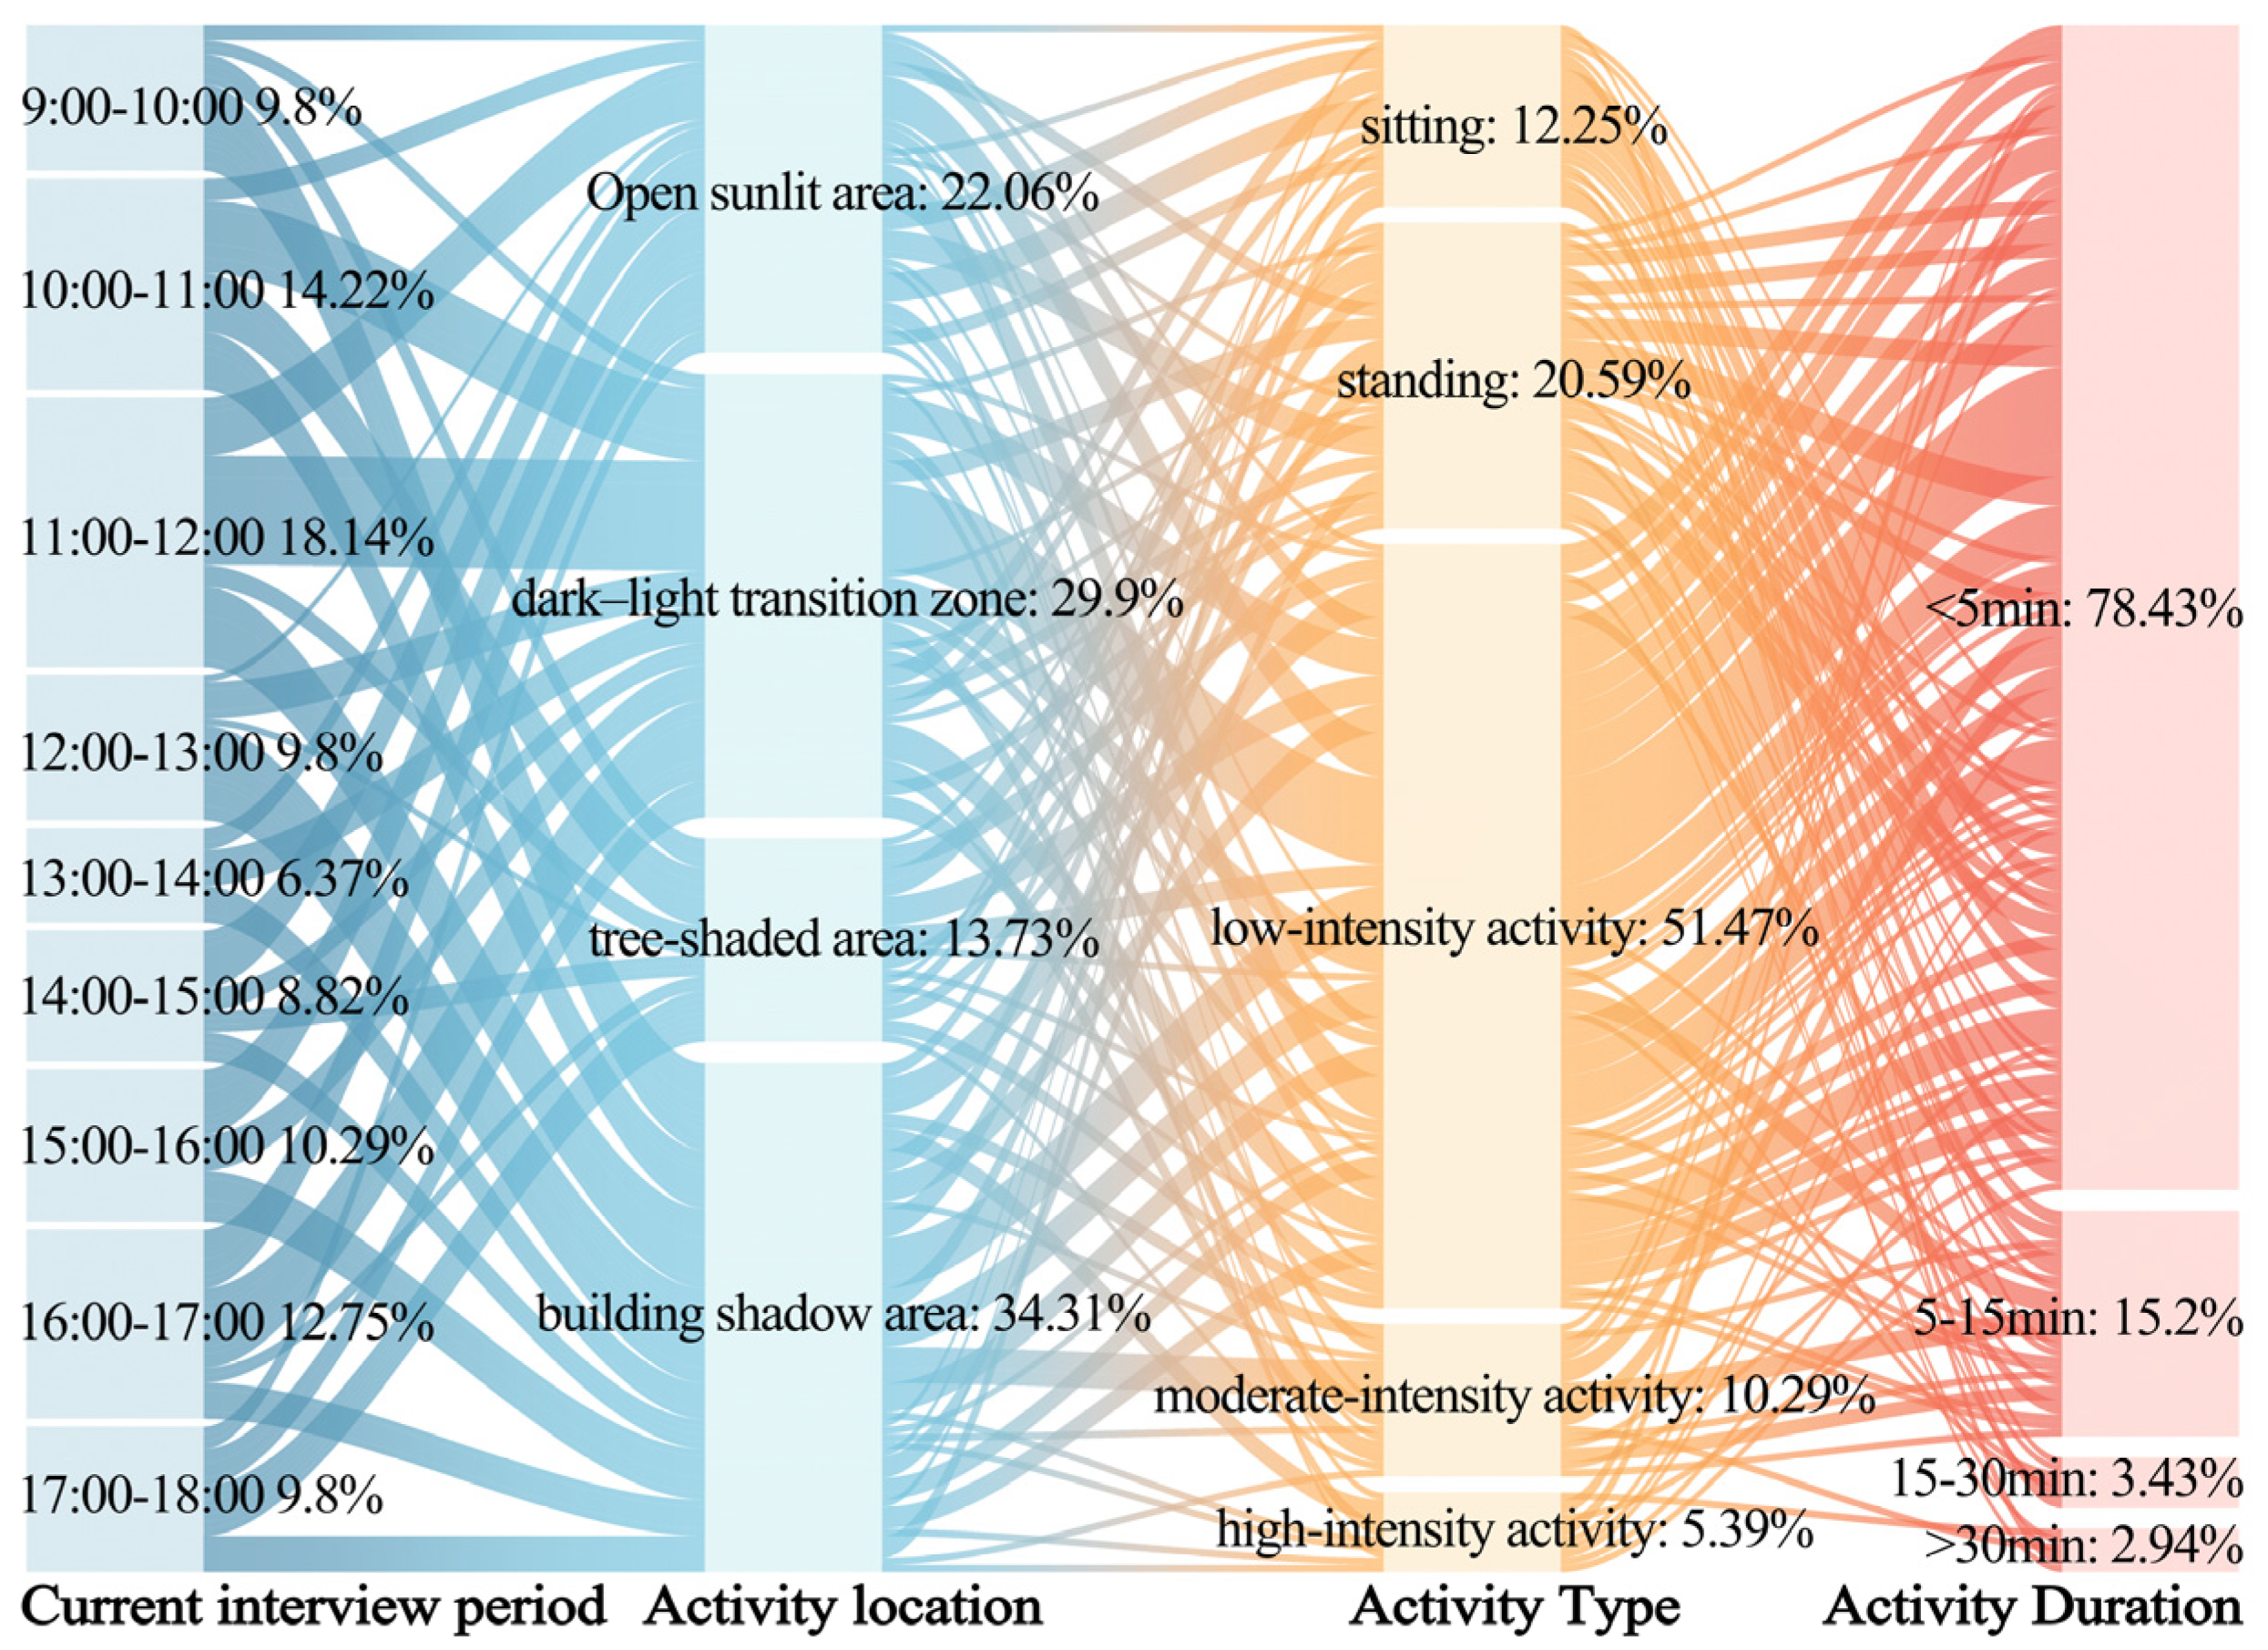
3.1.1. Outdoor Activity Patterns
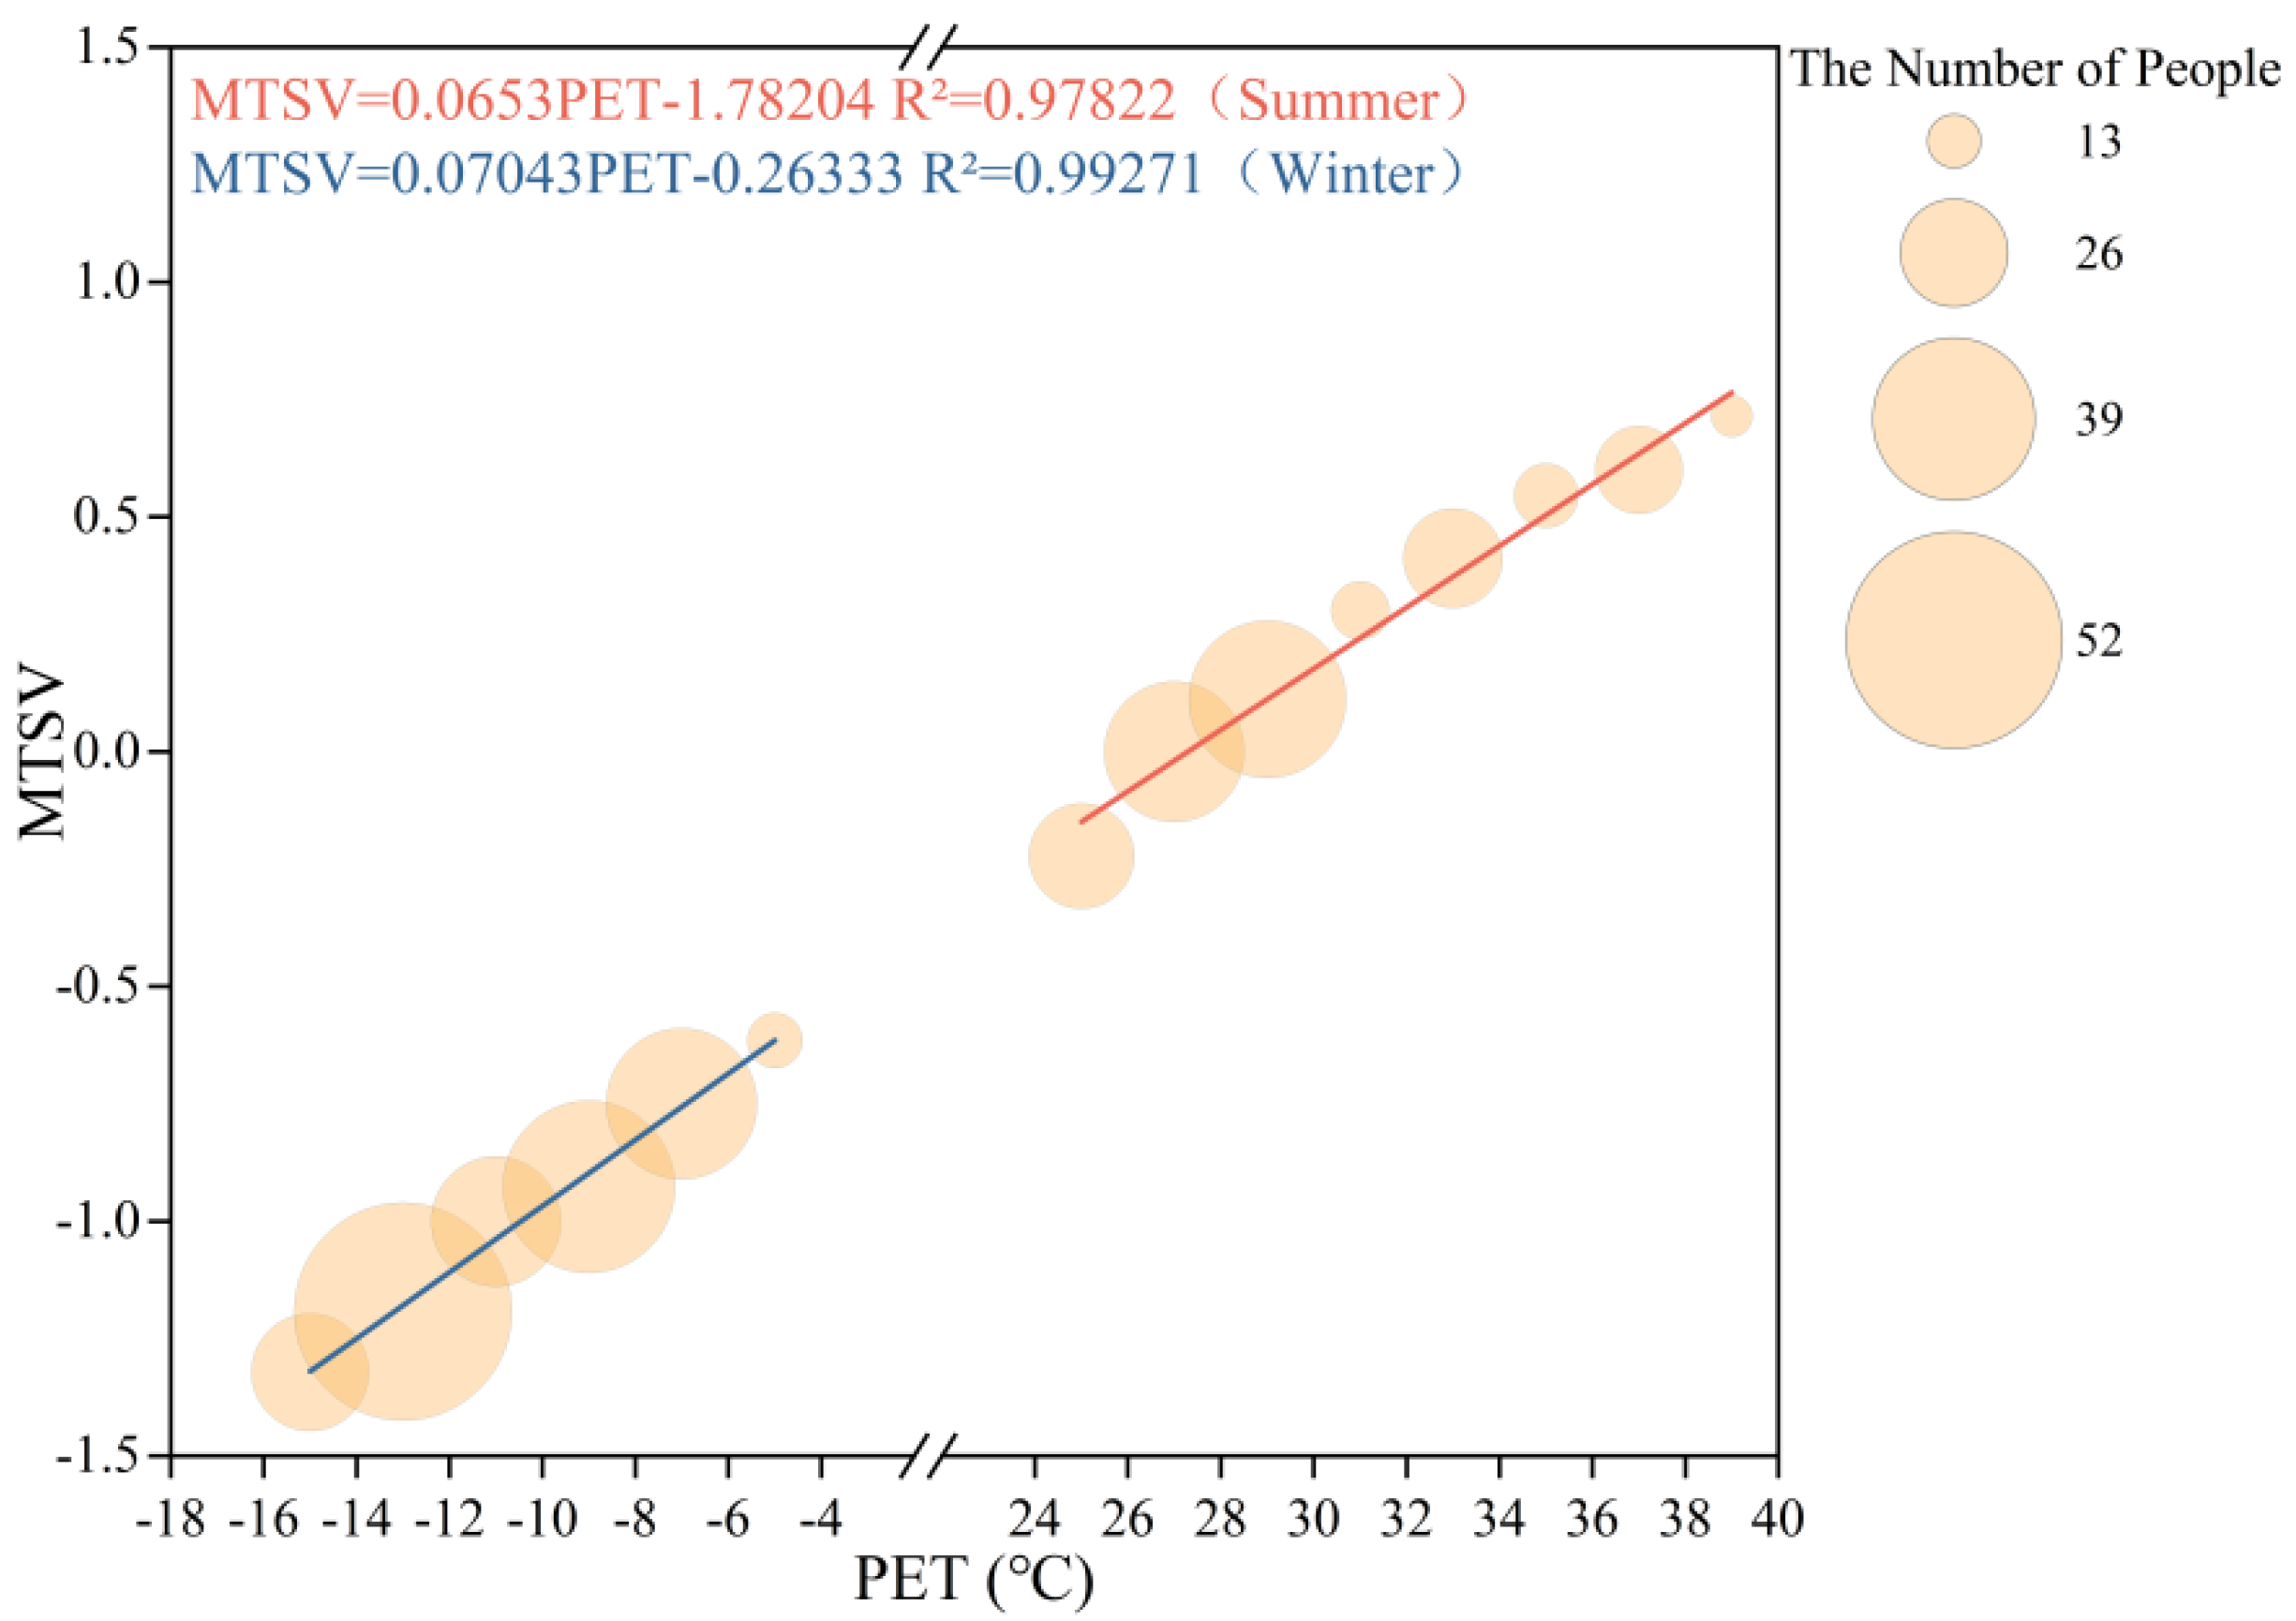
3.1.2. Neutral PET Range
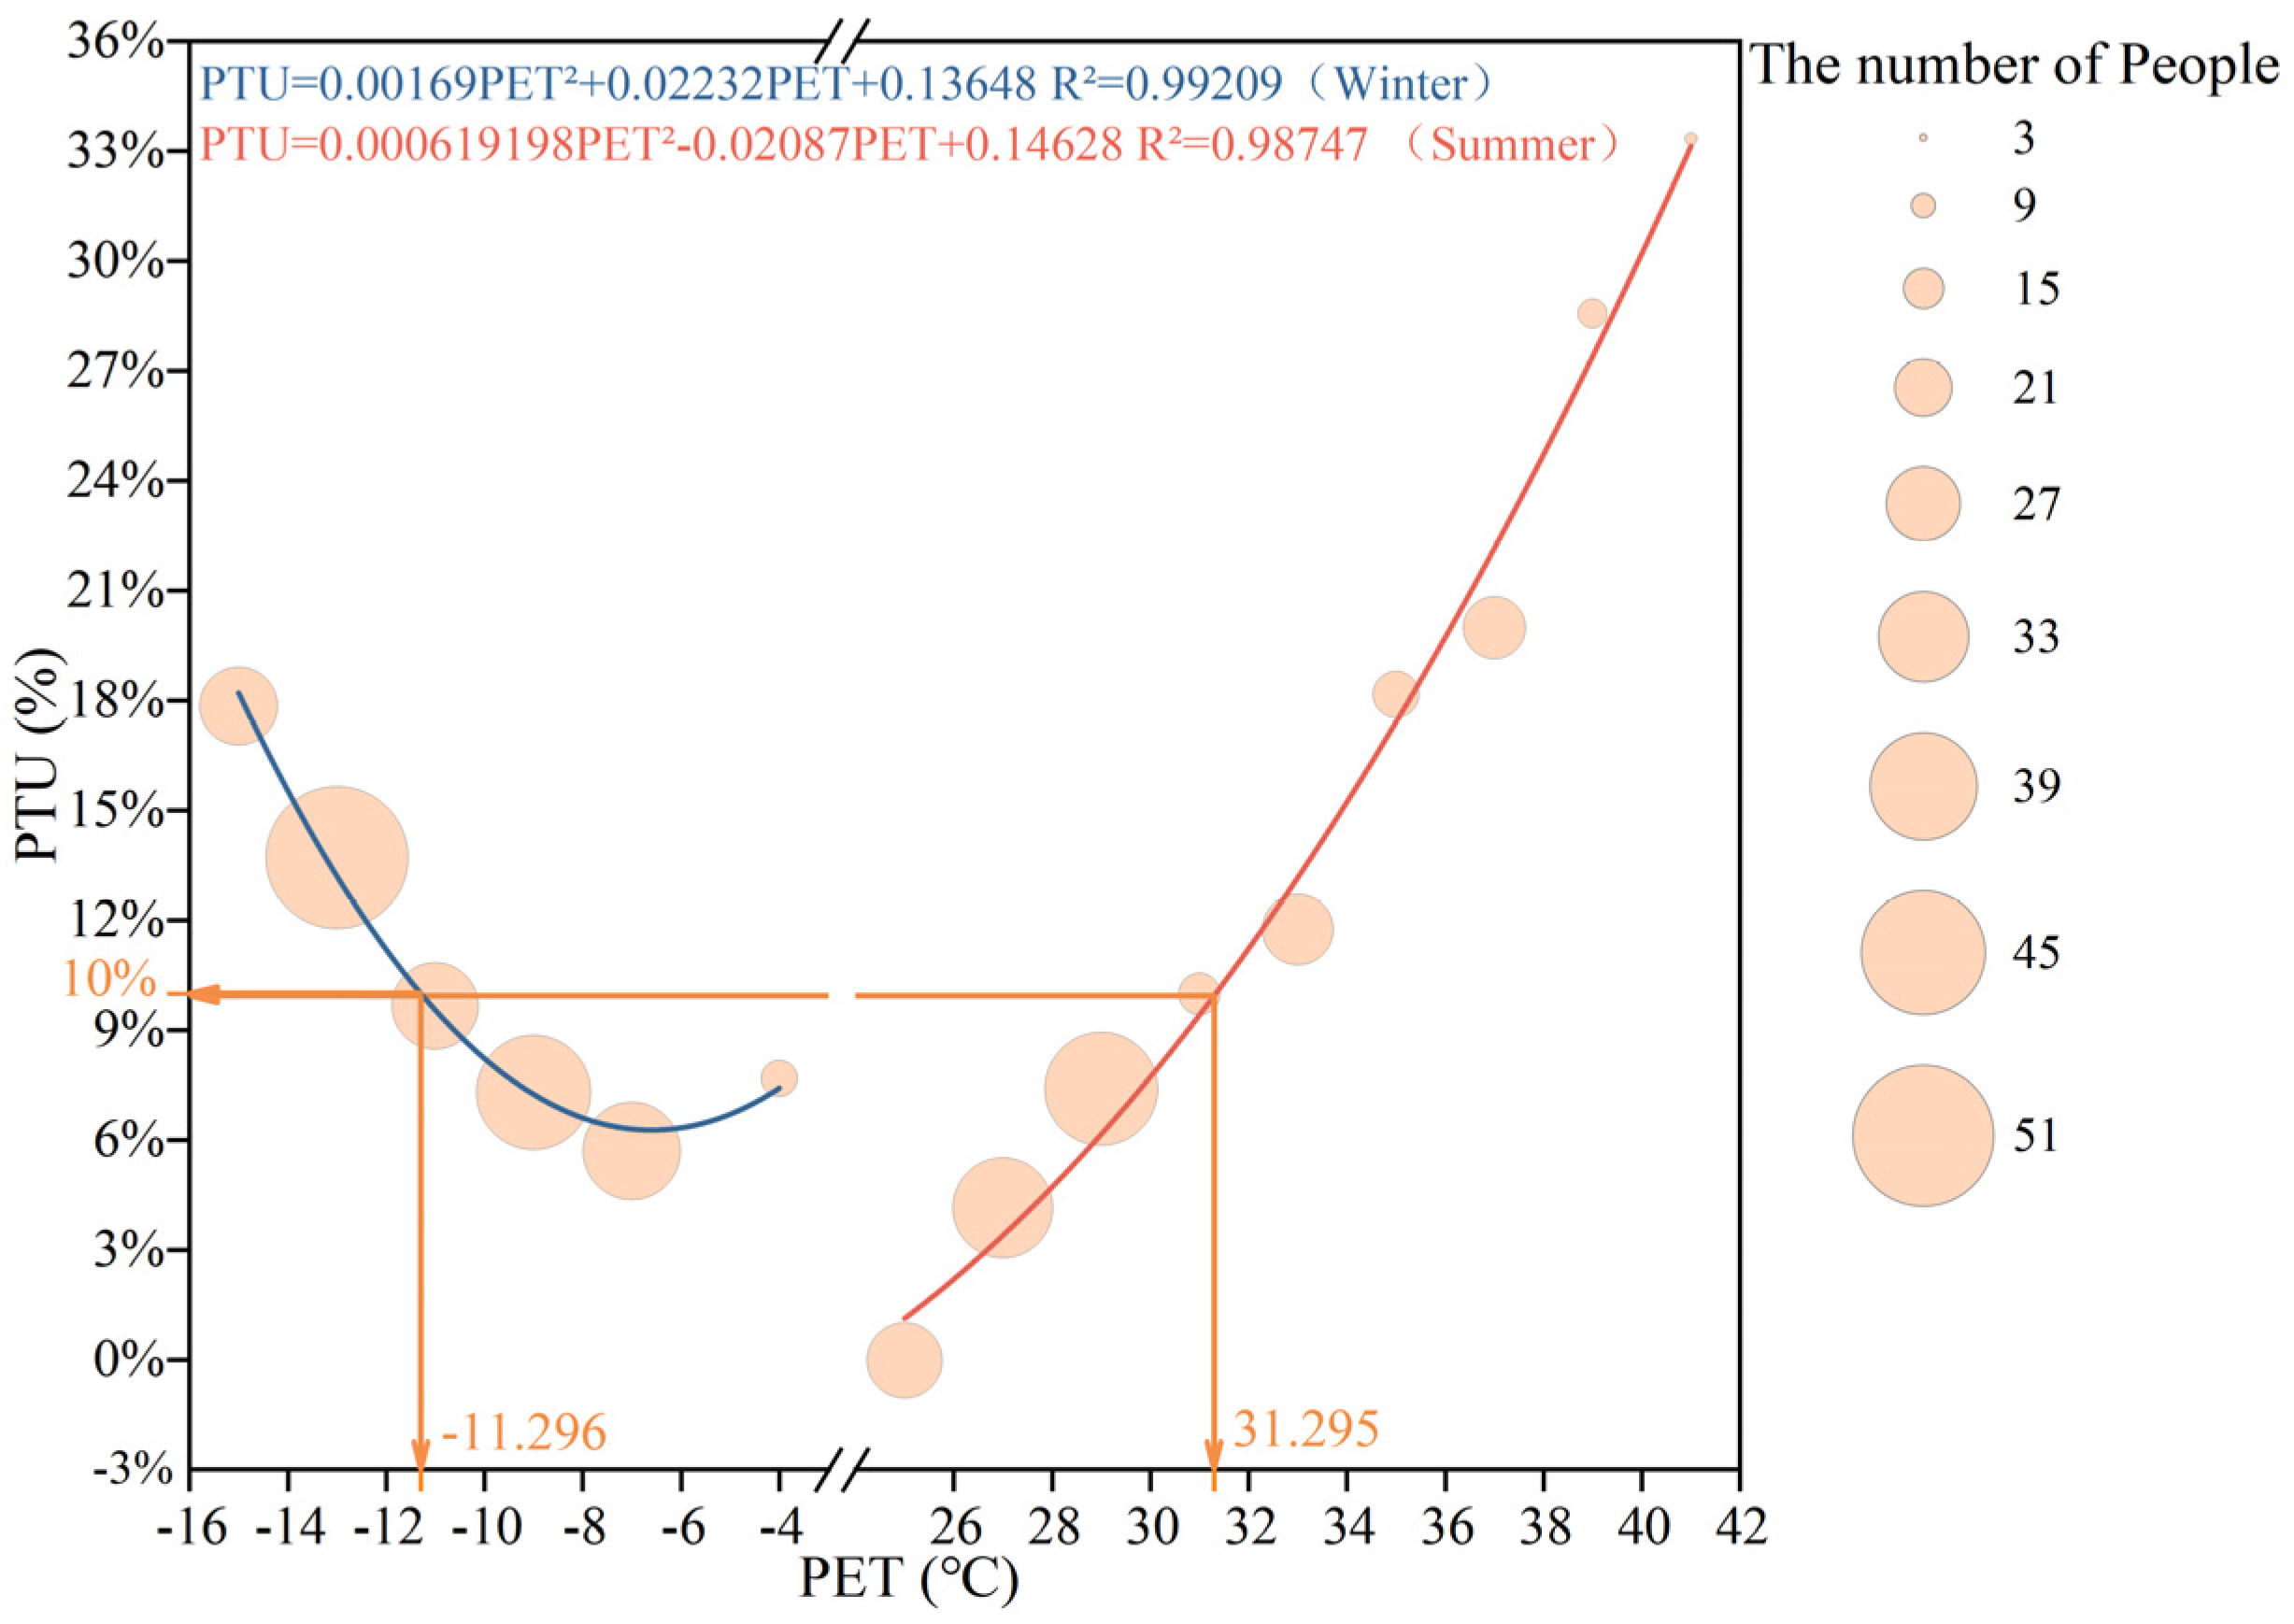
3.1.3. 90% Acceptable PET Range
3.2. Effects of Landscape Elements on Outdoor Thermal Comfort
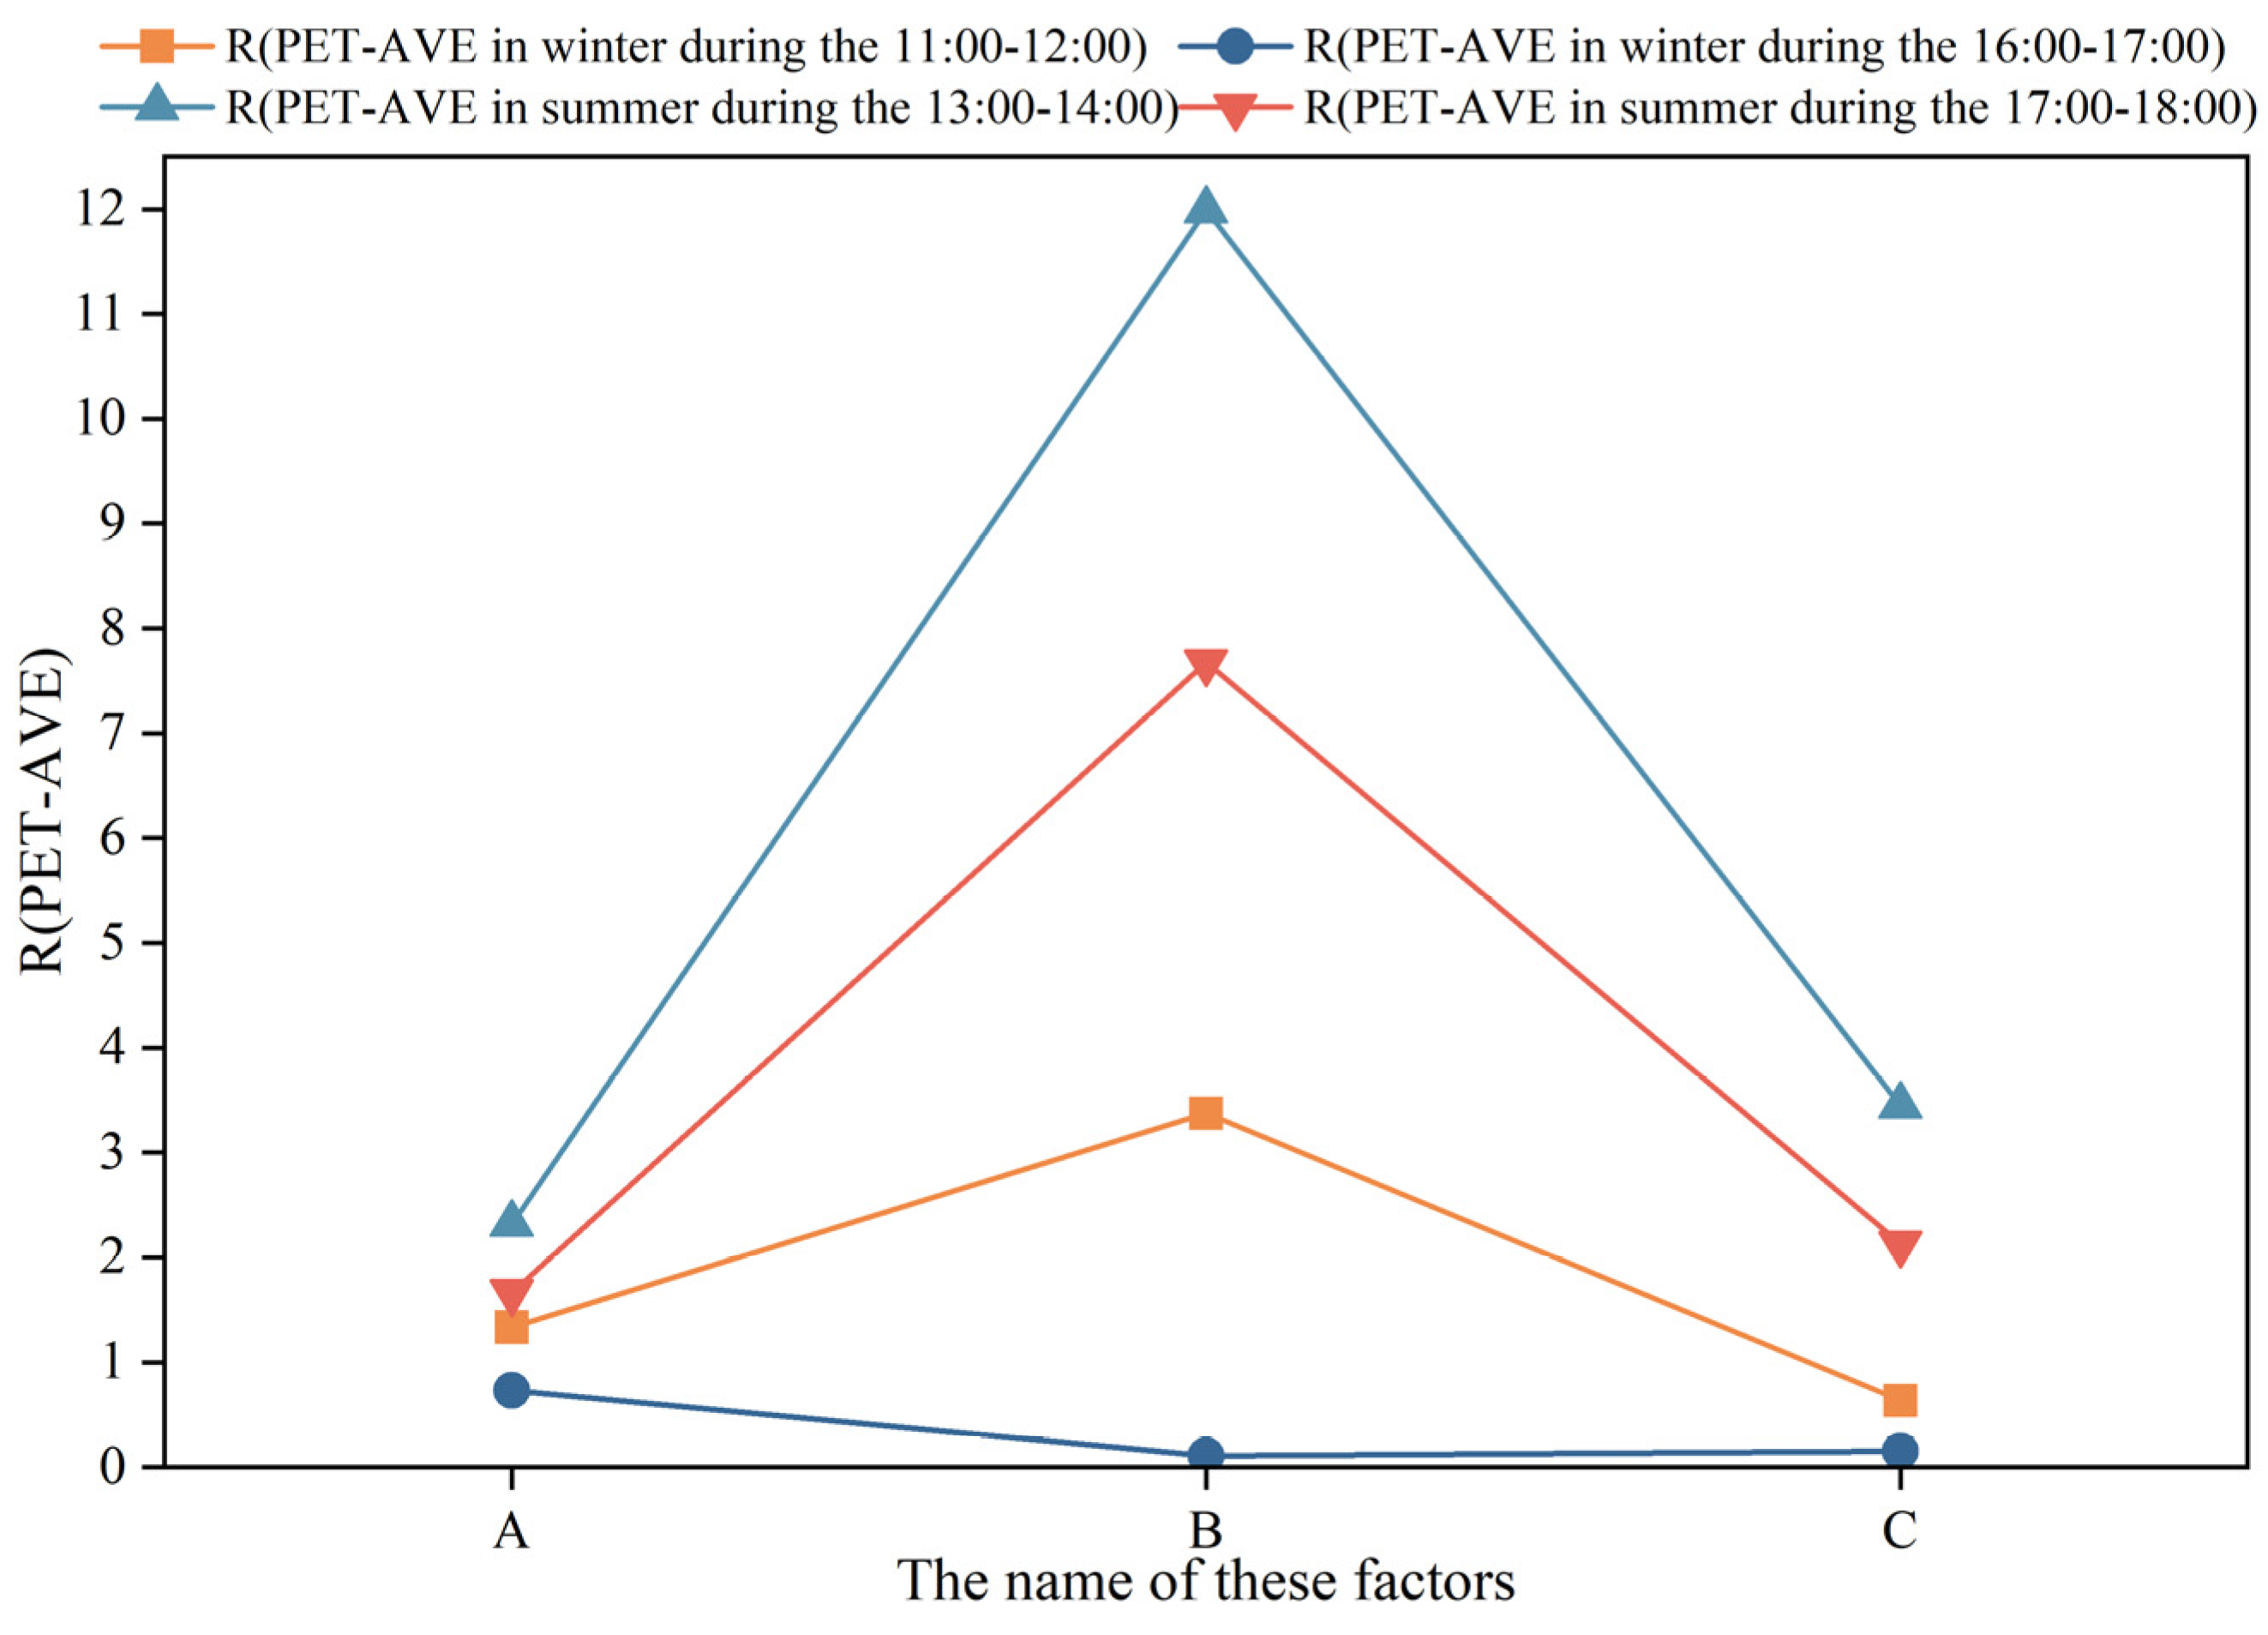
3.2.1. Ranking of Main Effects
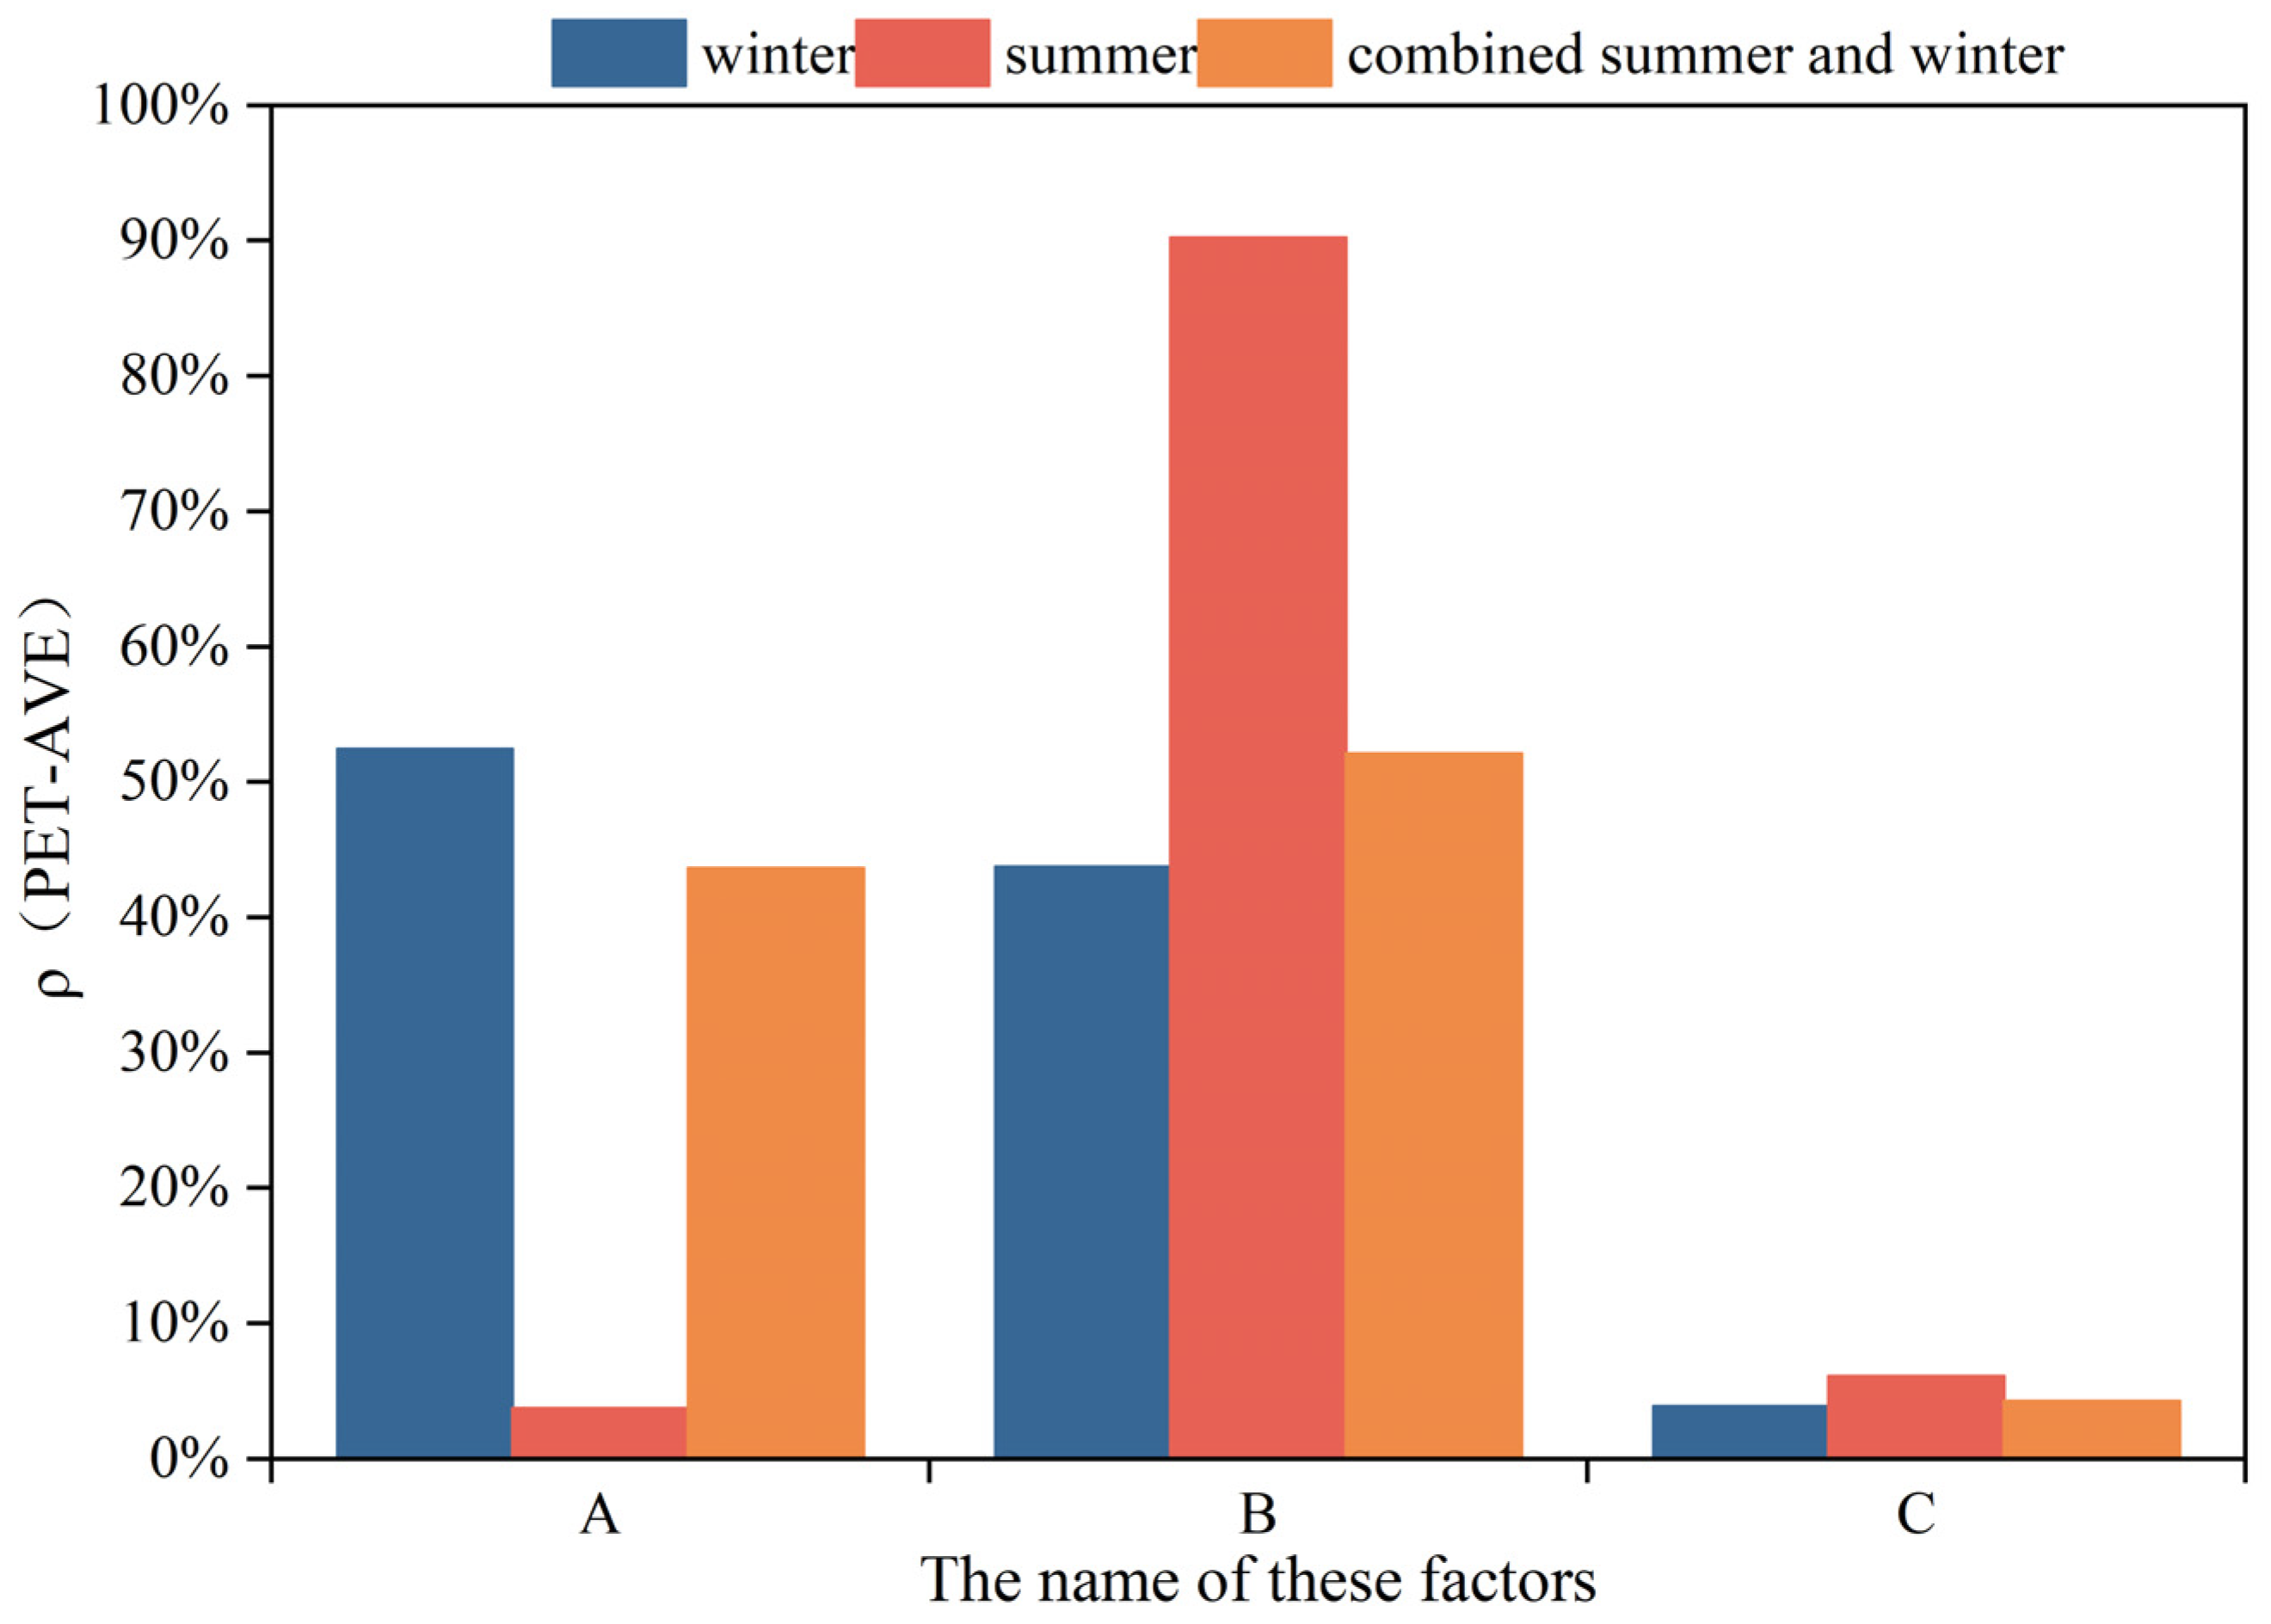
3.2.2. Significance and Contribution Ranking
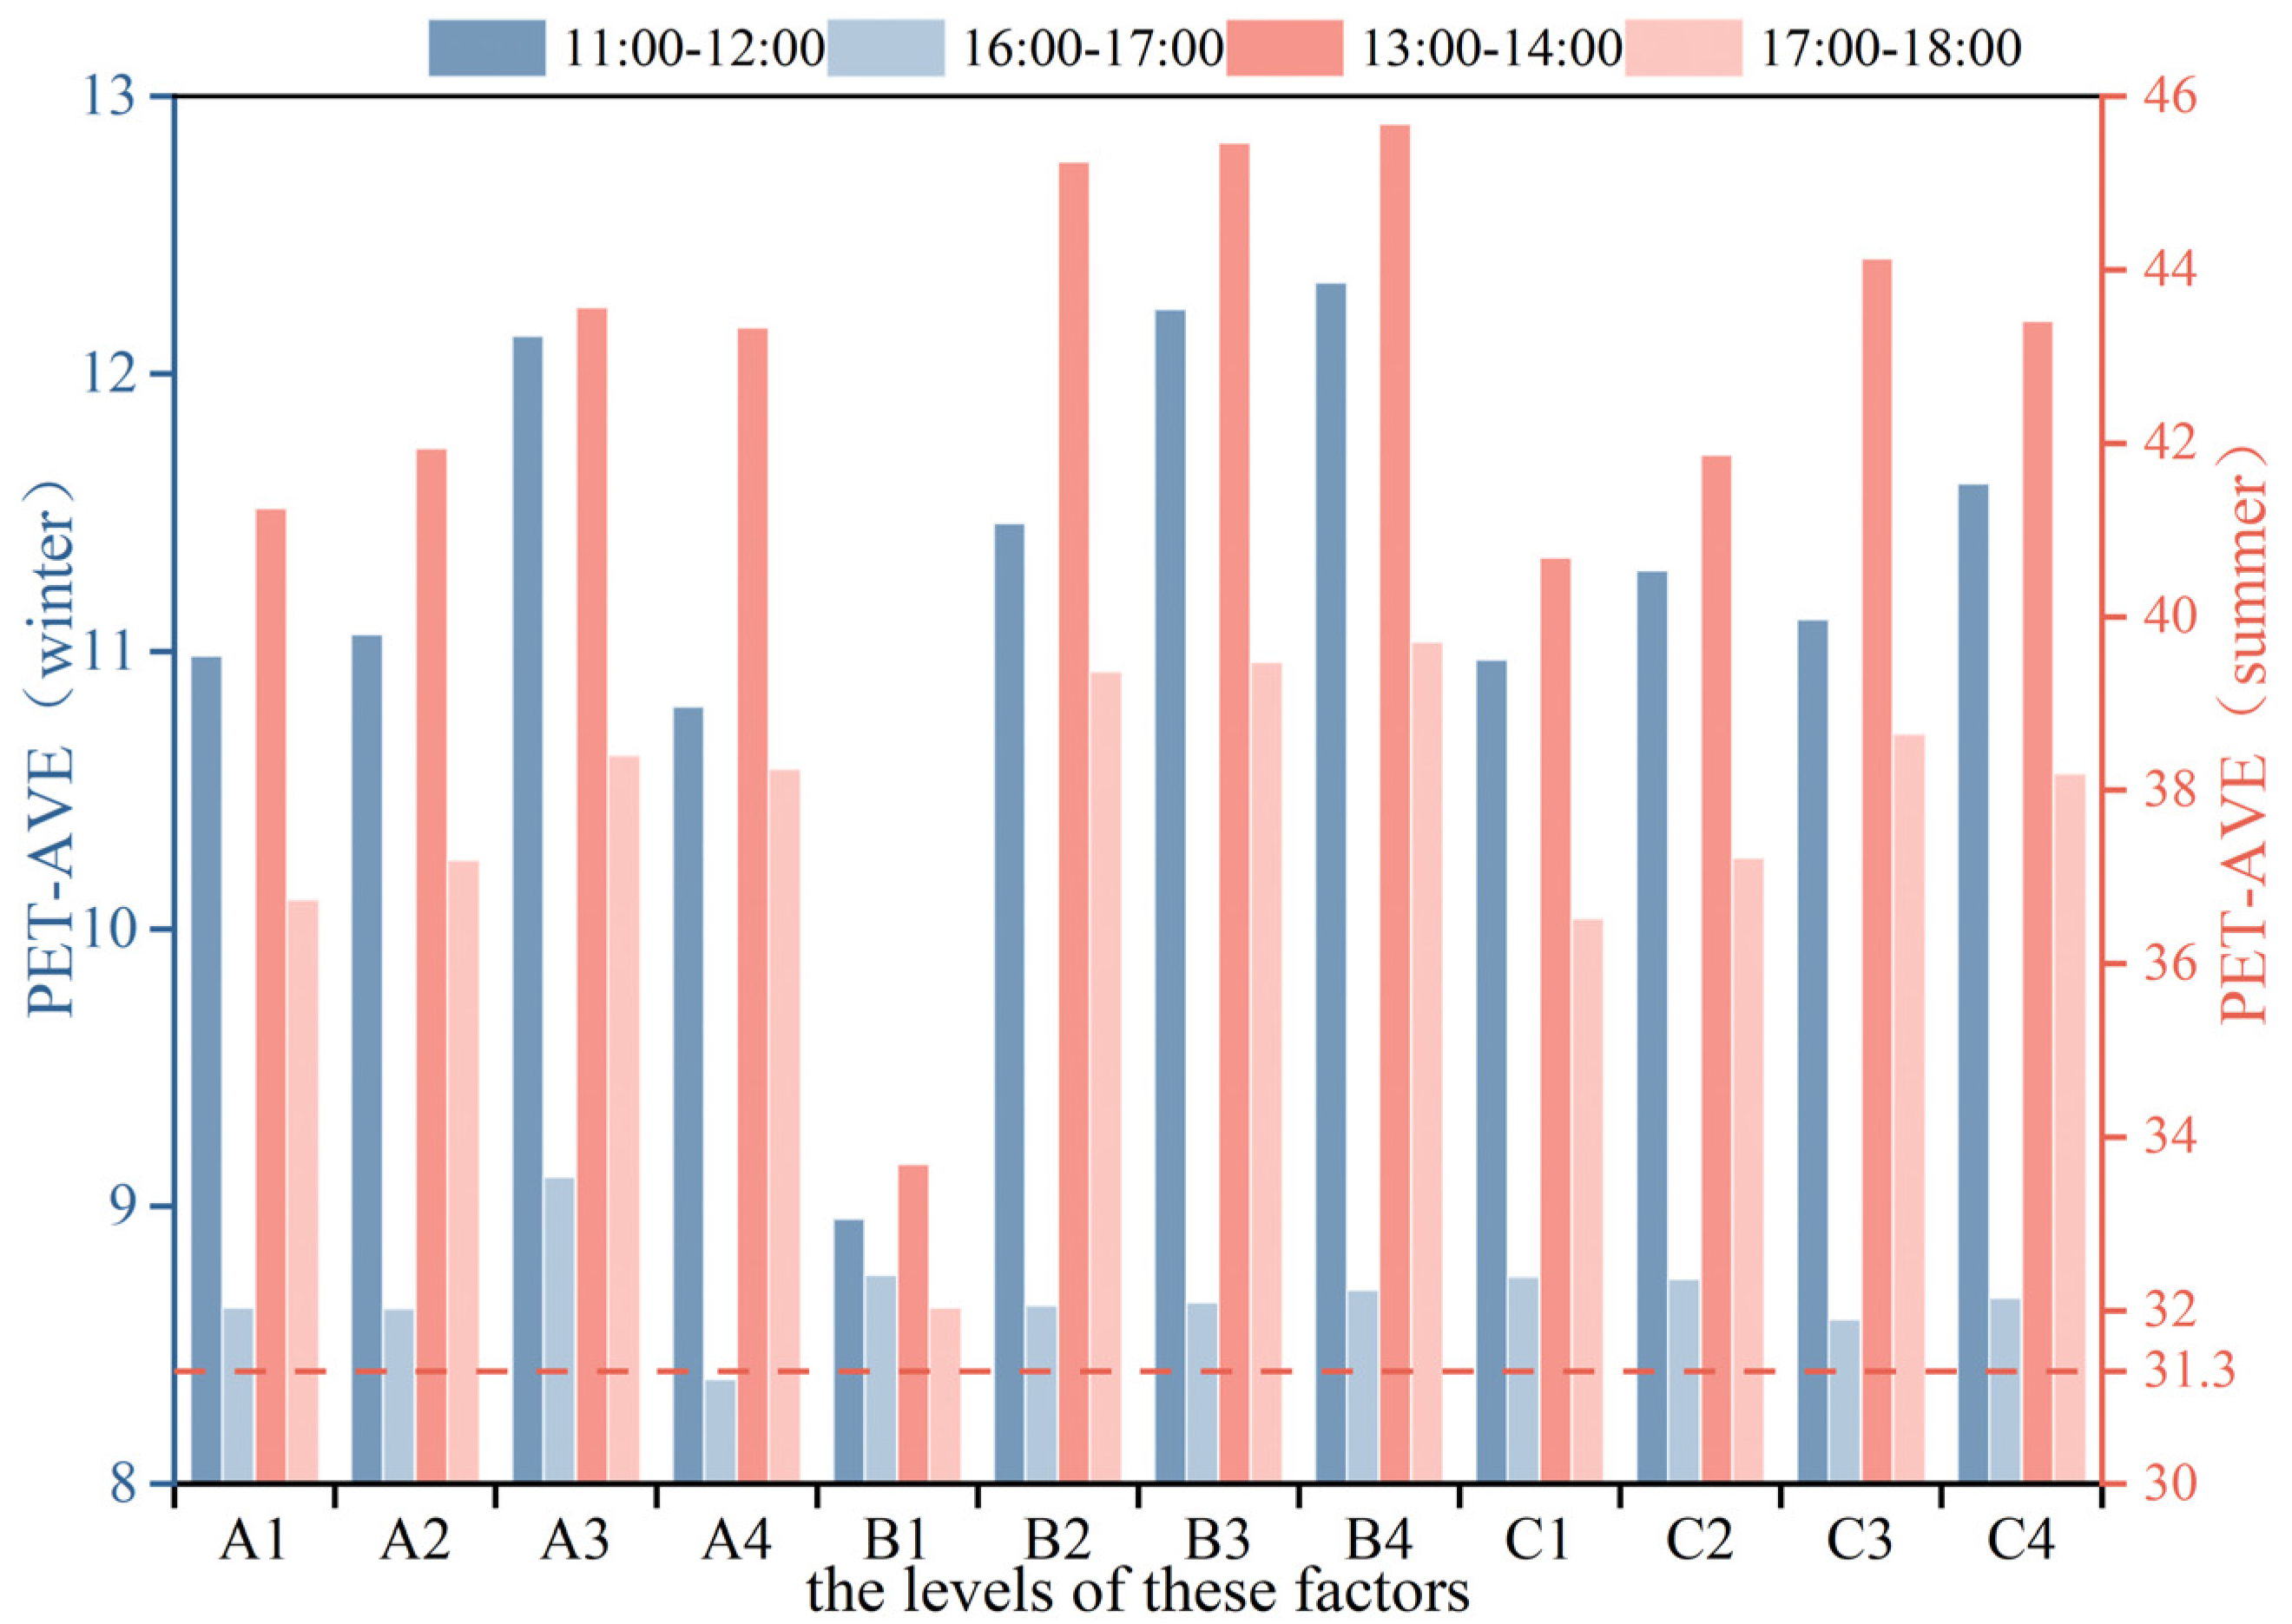
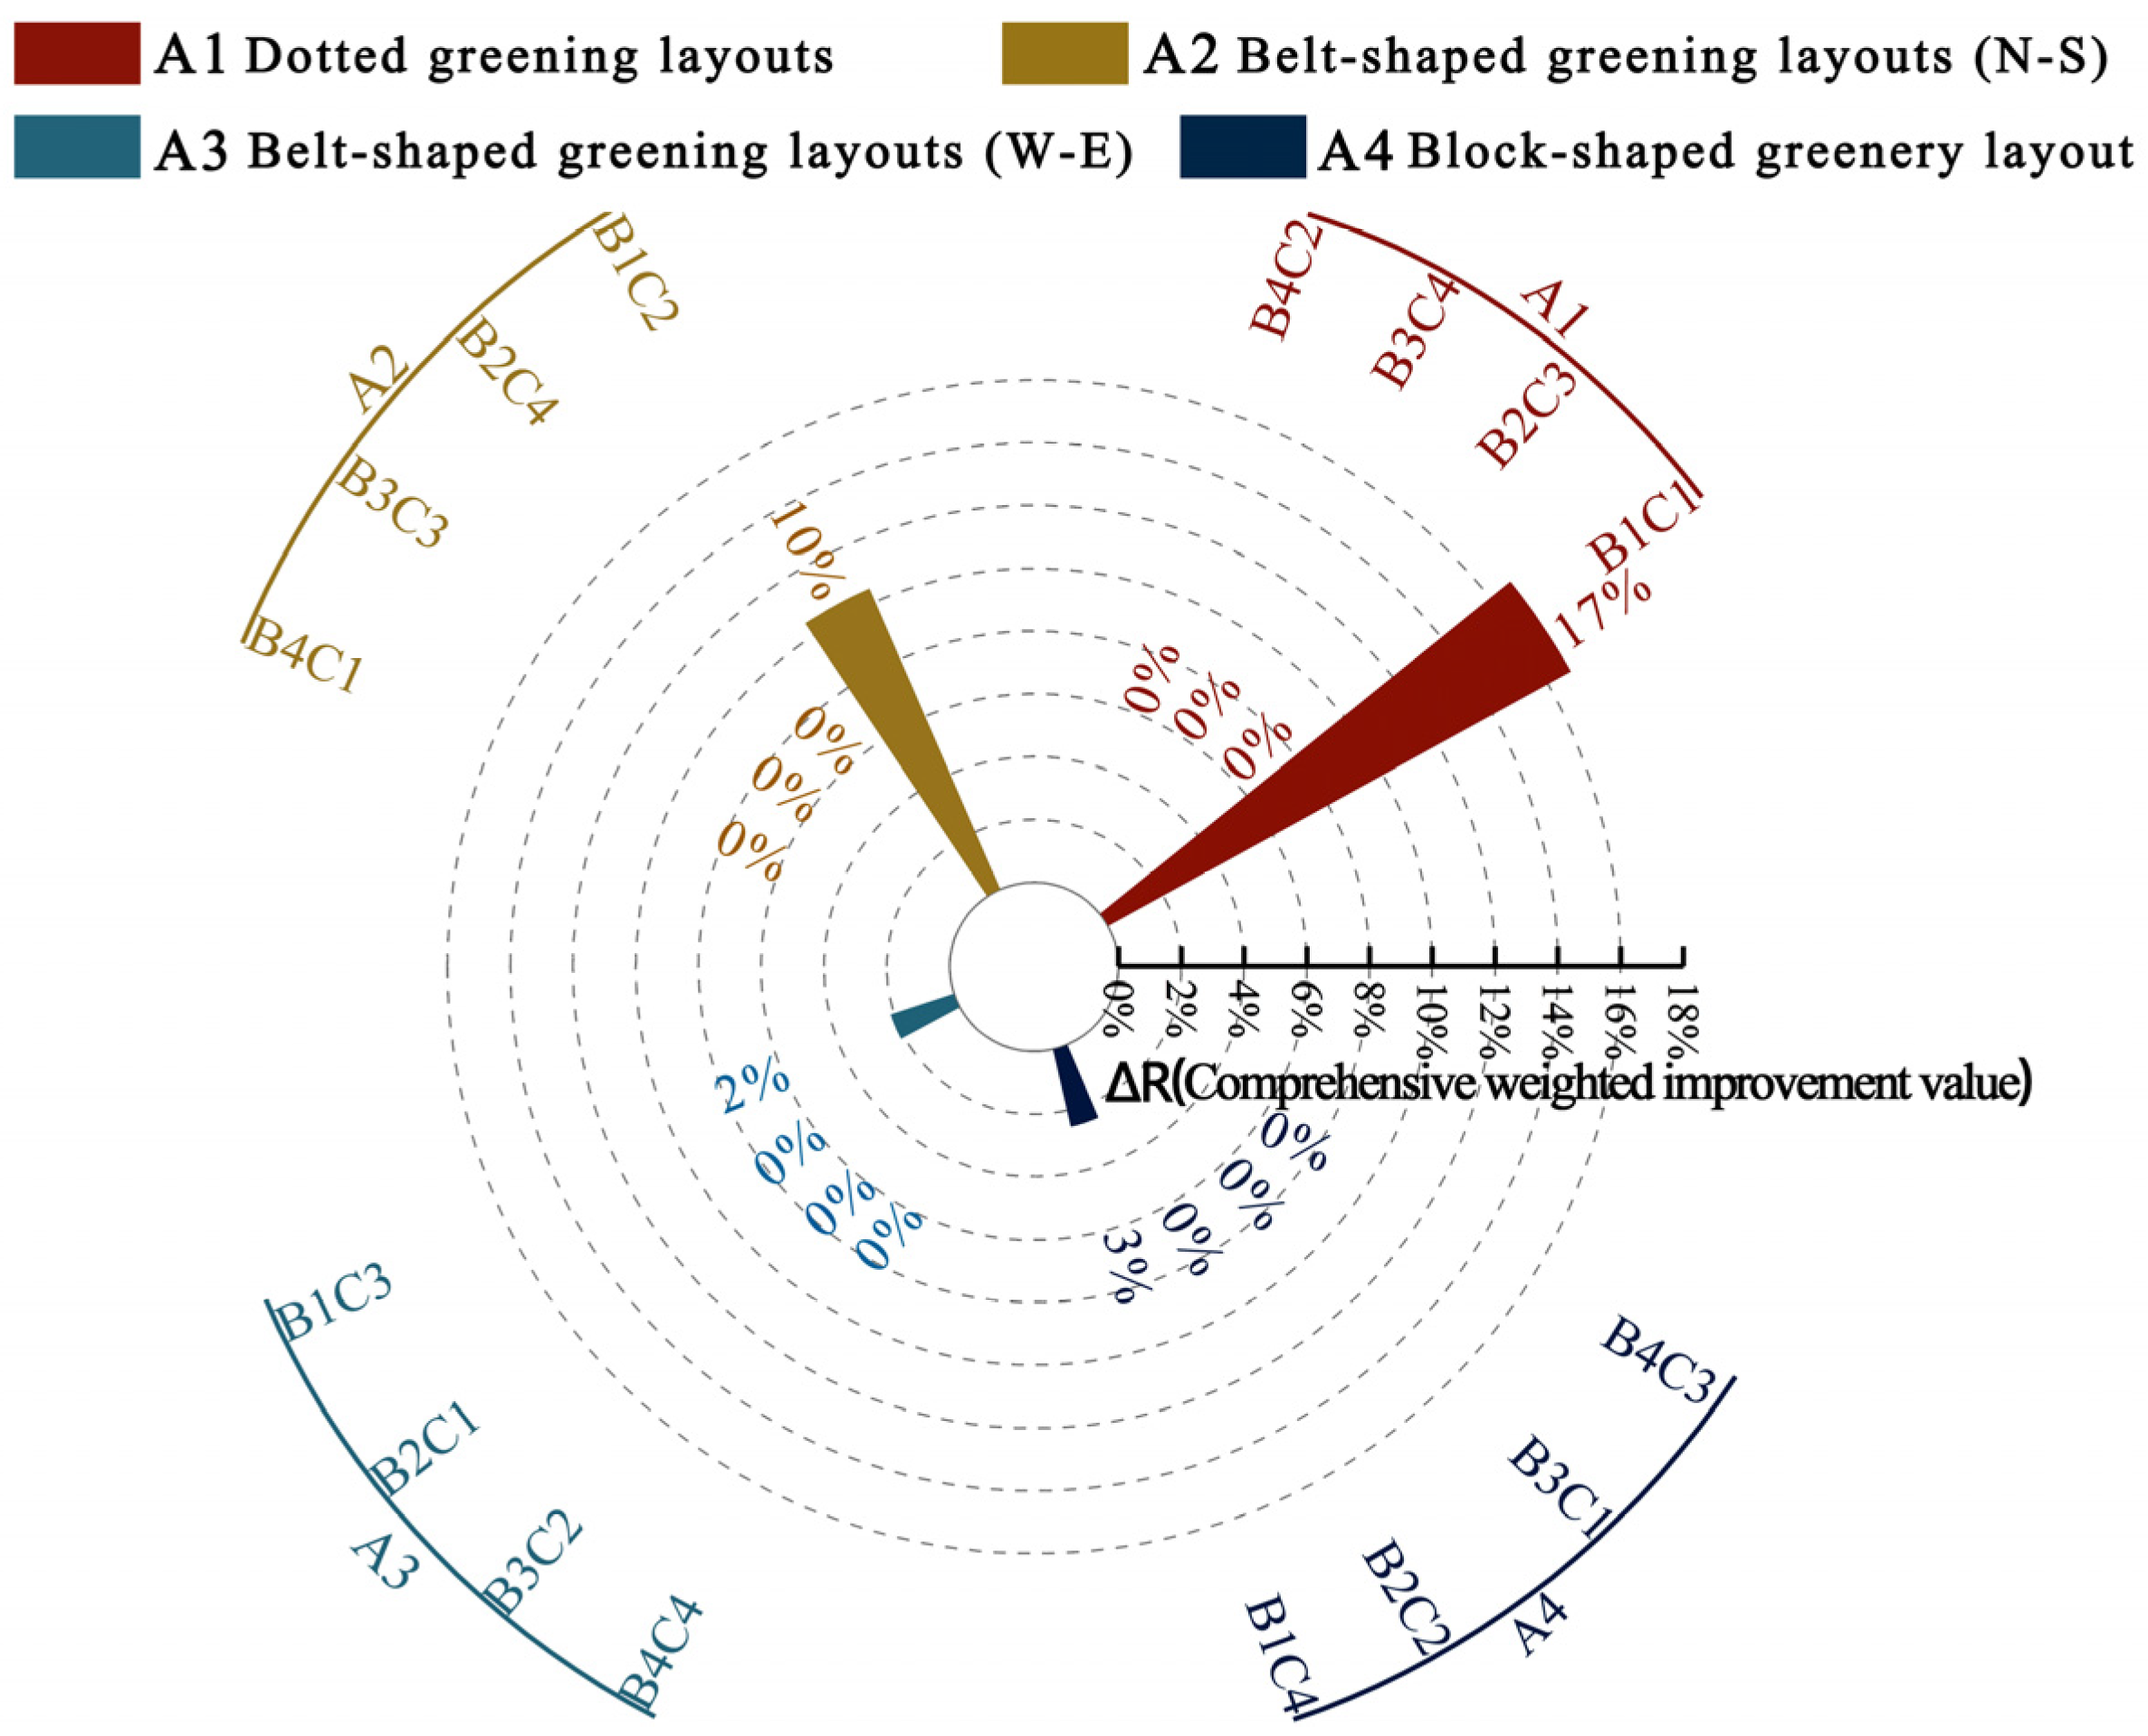
3.3. Optimal Experimental Scheme Selection
3.4. Nature-Based Solution
4. Discussion
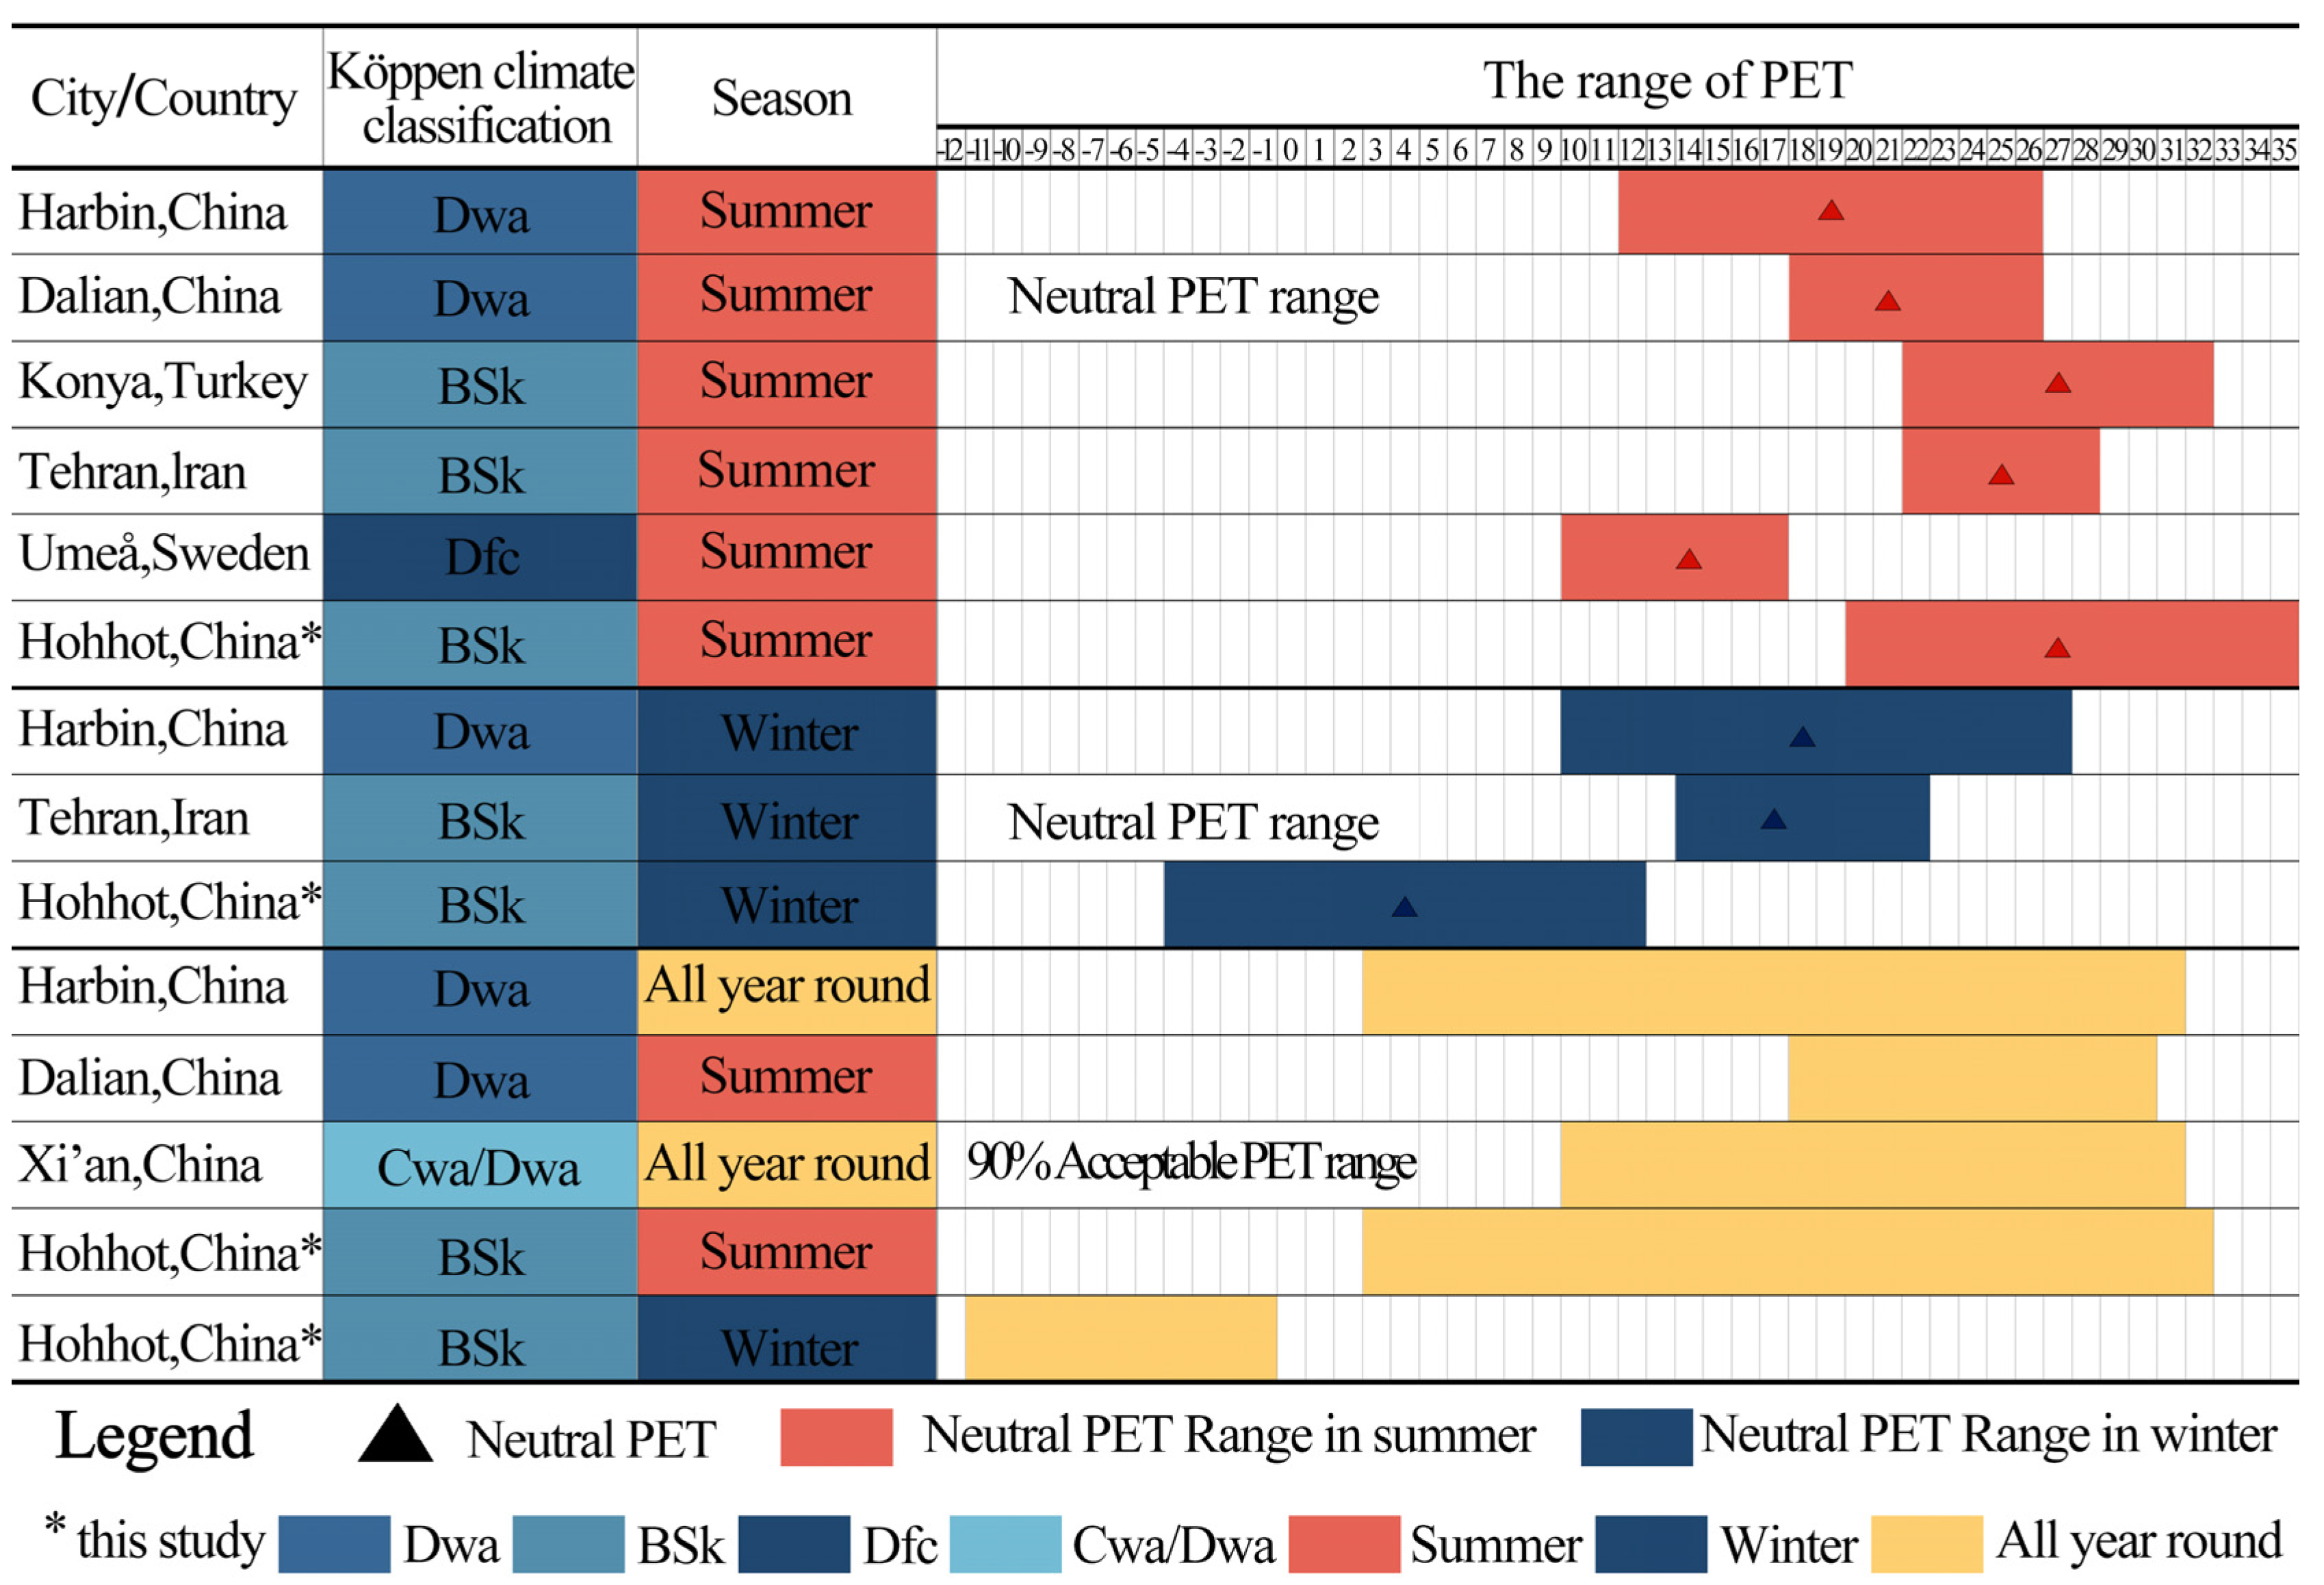
4.1. Comparison of Thermal Benchmarks in Representative Cold-Climate Cities
4.2. Analysis of the Specific Effects of Landscape Elements on the PET
4.3. Study Limitations
5. Conclusions
- (1)
- The thermal benchmarks for the outdoor leisure plaza at the university in Hohhot were clarified for both summer and winter. In winter, the lower limit of the neutral PET range is −11.3 °C, and in summer, the upper limit of the neutral PET range is 31.3 °C.
- (2)
- The study revealed the overall contribution of landscape elements to seasonal outdoor thermal comfort and identified the optimal combination. The overall contribution of the landscape elements to the PET in both summer and winter ranks as follows: plant type > greenery layout > surface albedo. The combination of “dot-shaped greenery layout + black poplar + surface albedo of 0.2” was selected as the optimal configuration for ensuring thermal comfort in both summer and winter.
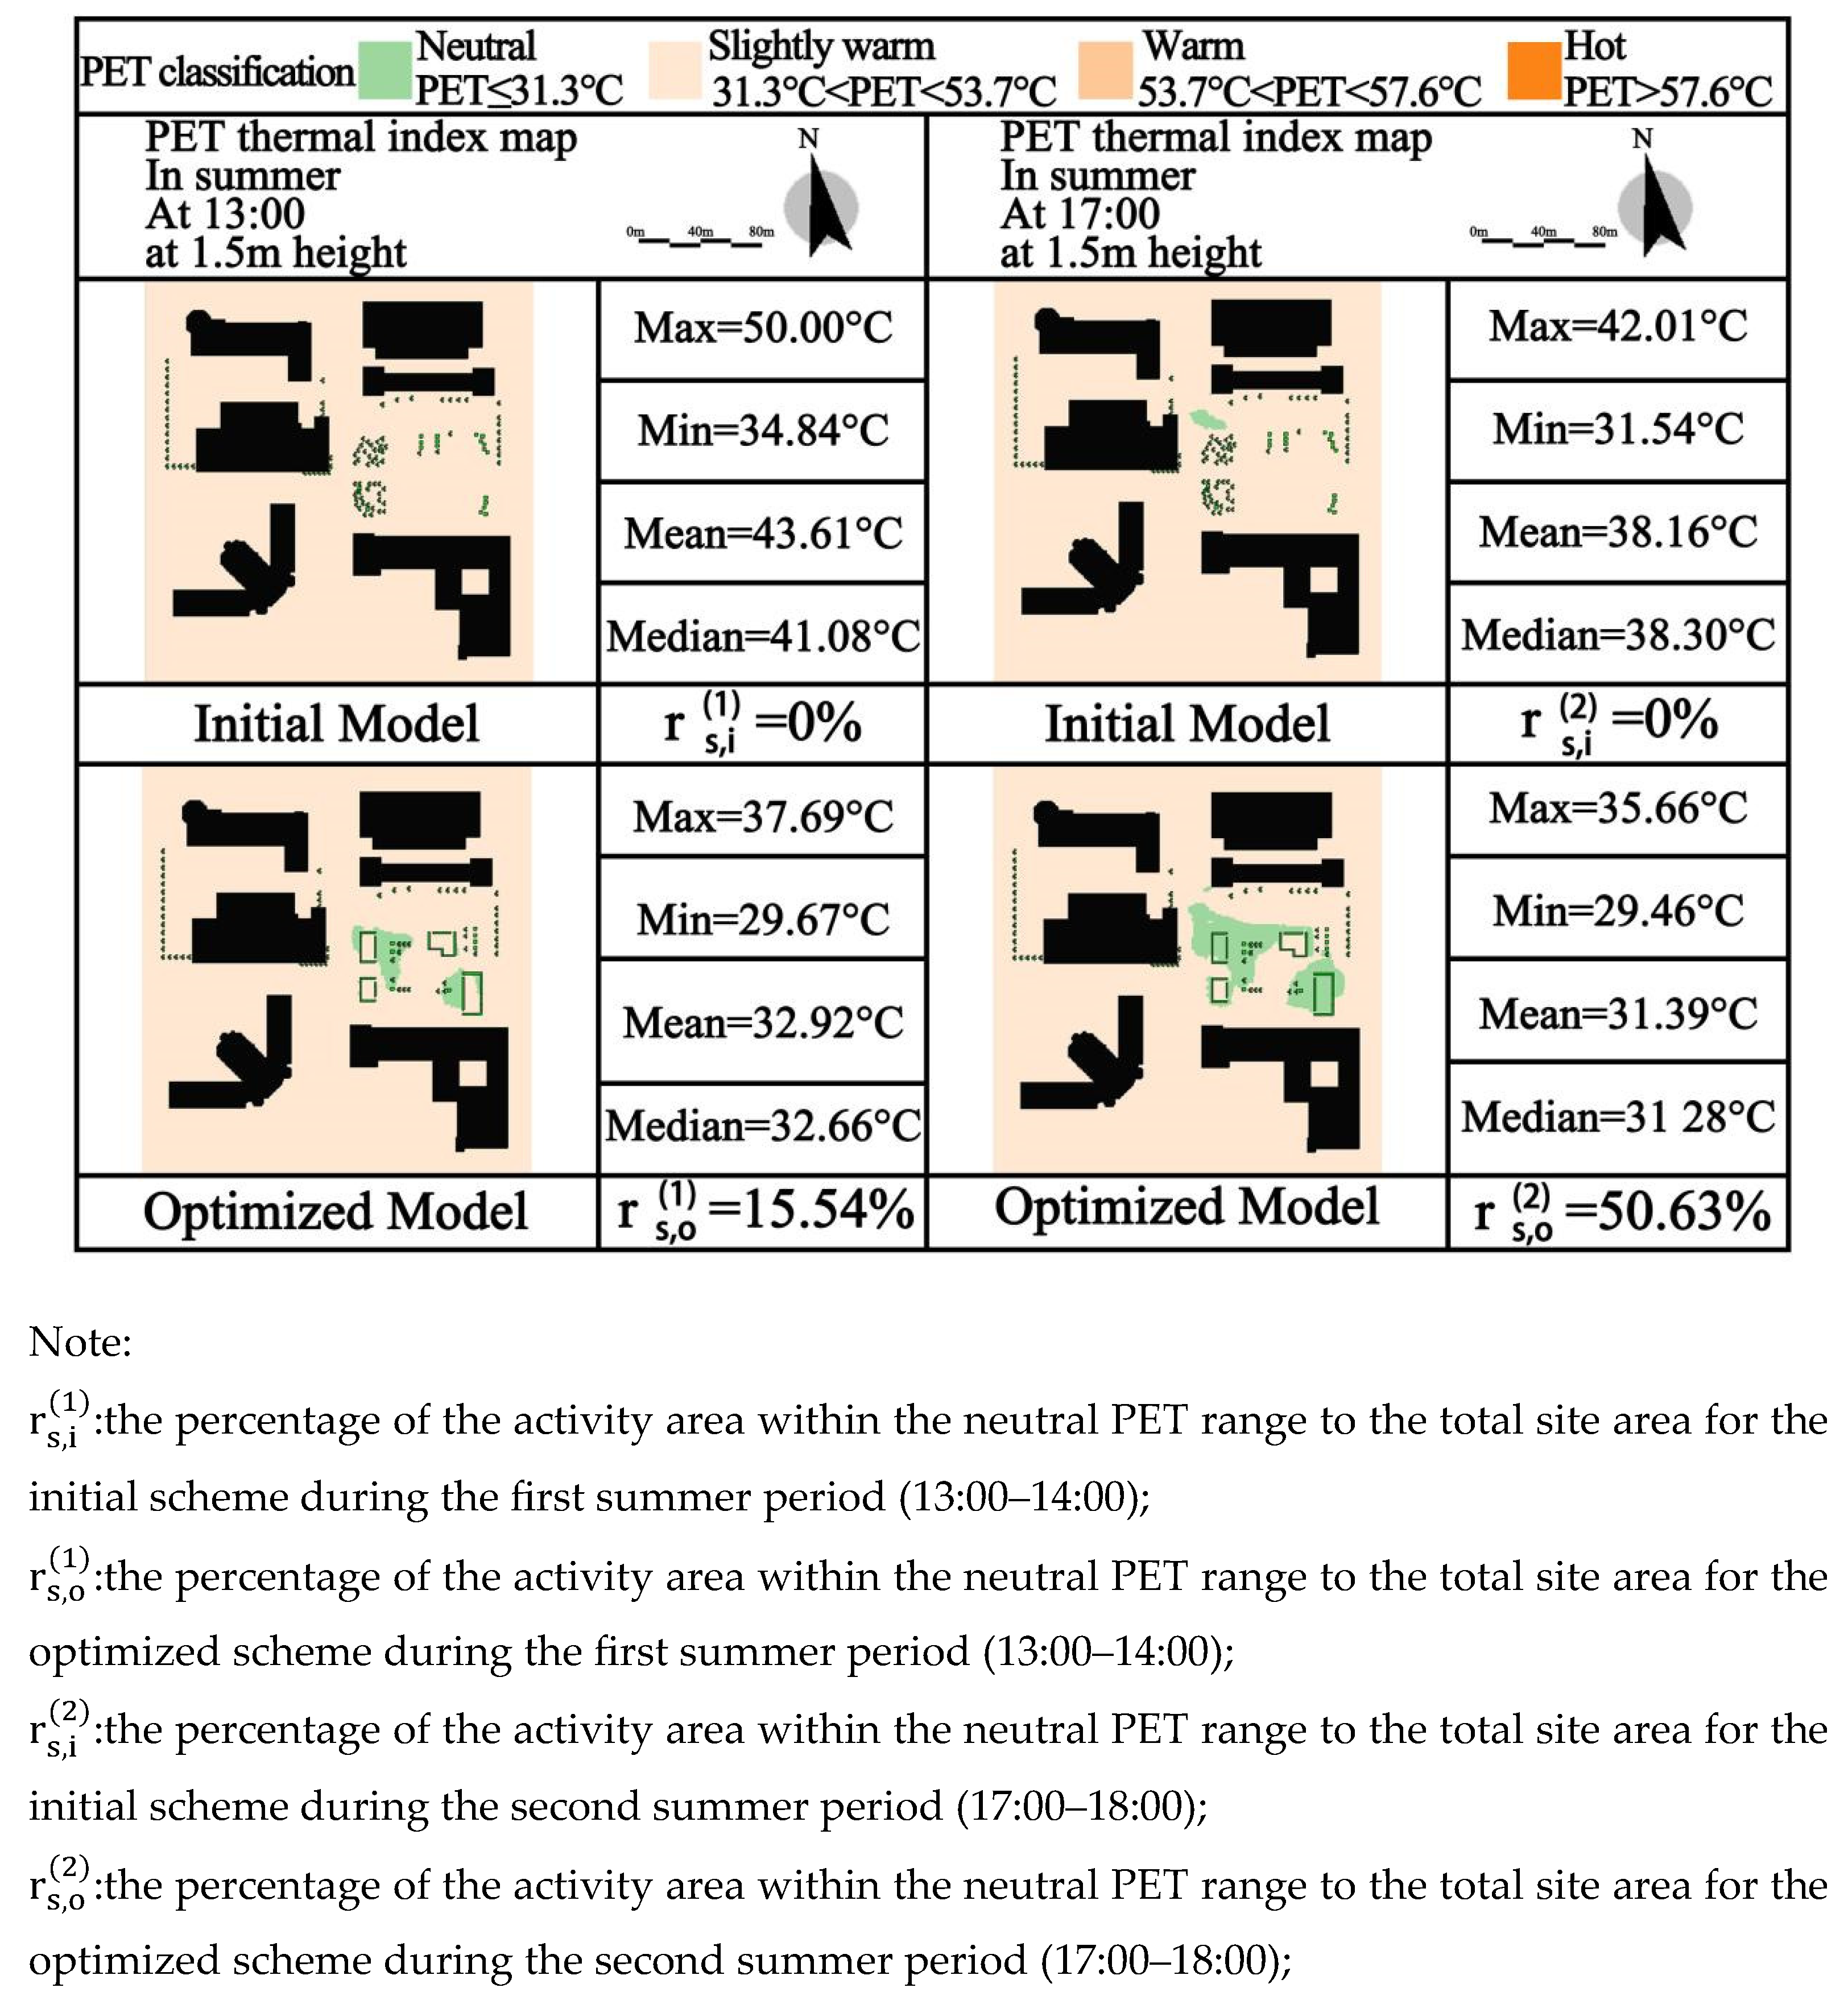
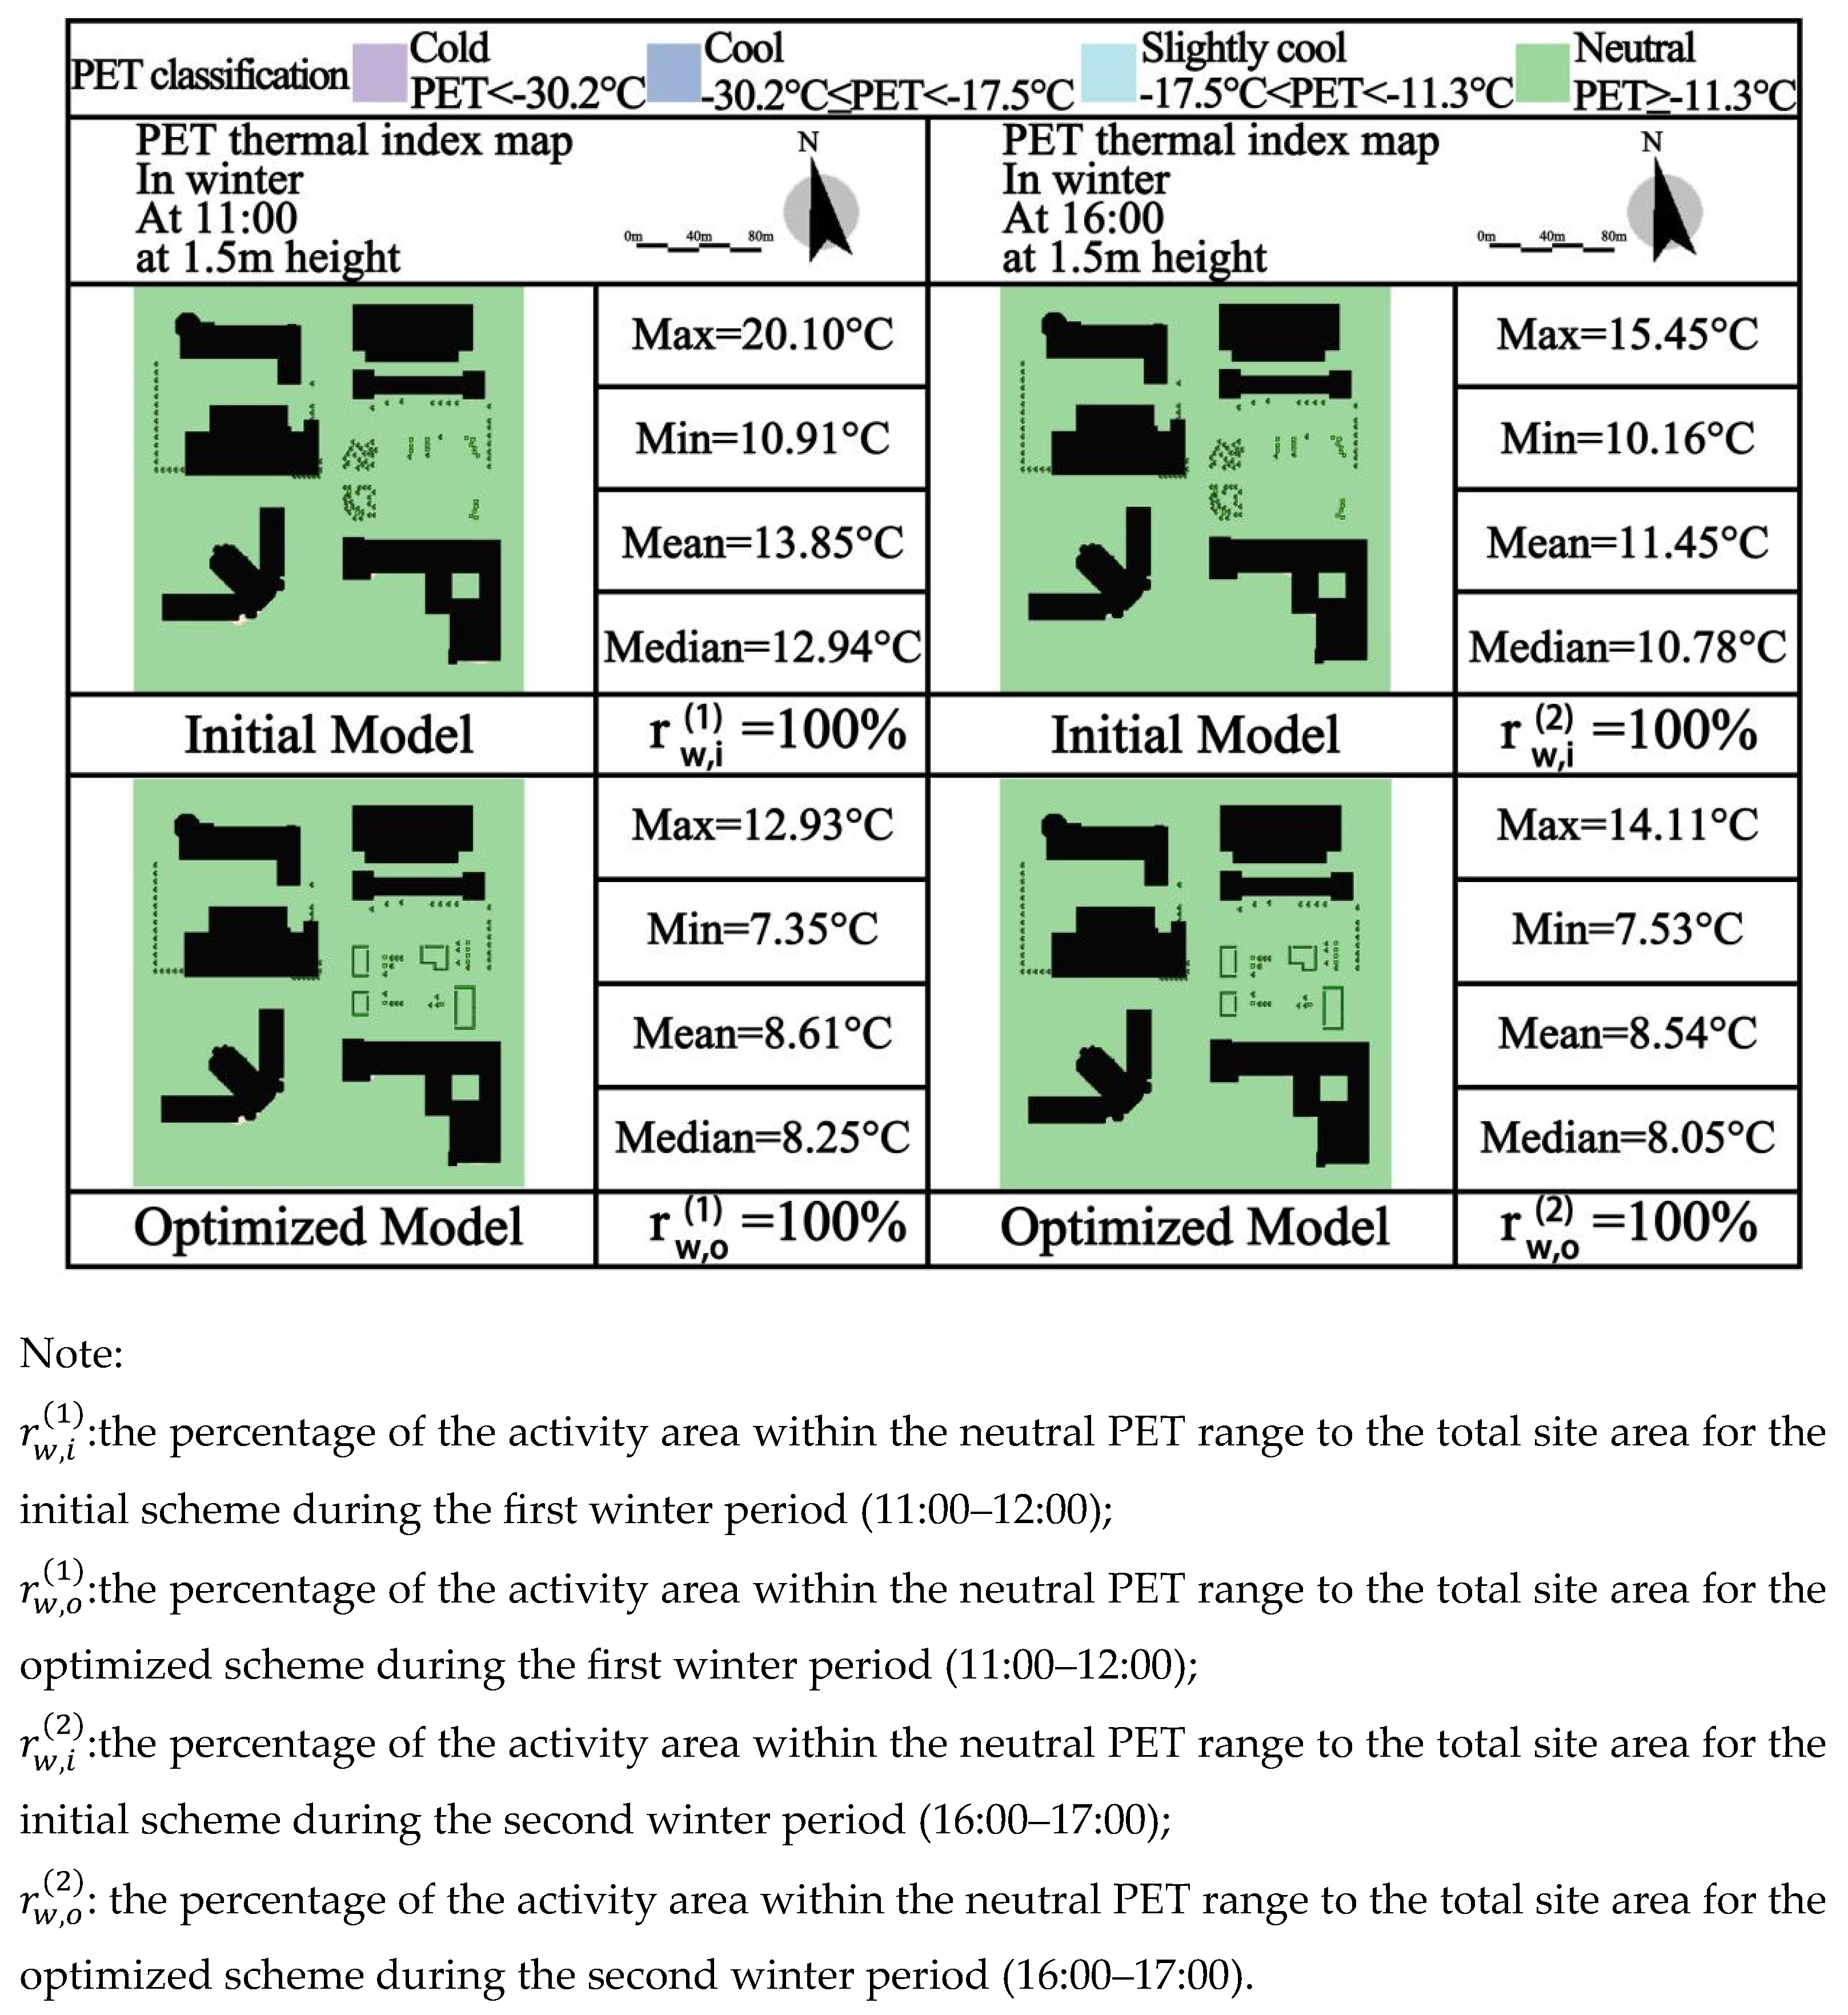
- (3)
- A nature-based solution was proposed that integrates thermal comfort and functional needs. Compared to the initial configuration, the optimized scheme achieved a 6.0% increase in the proportion of activity area within the neutral PET range across both summer and winter seasons.
Author Contributions
Funding
Data Availability Statement
Acknowledgments
Conflicts of Interest
Abbreviations
| PMV | Predicted Mean Vote |
| MAPE | Mean Absolute Percentage Error |
| TMD | Typical meteorological day |
| Ta | Air temperature |
| RH | Relative humidity |
| Va | Wind speed |
| Tg | Globe temperature |
| PET | Physiological Equivalent Temperature |
| MEMI | Munich Energy-balance Model for Individuals |
| MTSV | Mean thermal sensation vote |
| PTU | Percentage of Thermal Unacceptability |
Appendix A
Appendix A.1
| Survey Date | ___ June 2024 |
| Time of completion | : - : |
| □9:00–10:00 | □10:00–11:00 | □11:00–12:00 | □12:00–13:00 |
| □13:00–14:00 | □14:00–15:00 | □15:00–16:00 | □16:00–17:00 □17:00–18:00 |
 |
| □Open sunny area □Light–shade interface □Building shaded area □Tree-shaded area |
| □Sleeveless top (0.12clo) | □Short-sleeved T-shirt (0.19clo) | □Long-sleeved T-shirt (0.25clo) | □Short-sleeved shirt/dress (0.29clo) | □Long-sleeved sports shirt (0.34clo) | □Long-sleeved outerwear (0.36clo) |
| □Underwear (0.03clo) | □Sports shorts (0.08clo) | □Thin trousers (0.15clo) | □Ultra-short skirt (incl. shorts 0.06clo) | □Shorts (0.14clo) | □Long skirt (0.23clo) |
| □Ultra-short socks(0.02clo) | □Ankle socks (0.03clo) | □Shoes (summer, autumn 0.02clo) | □Leather shoes (0.04clo) | □Sandals (incl. flip-flops 0.02clo) (0.02clo) |
| □ Sitting (e.g., sunbathing, using phone, reading, chatting) (60W) (M < 1.2 met) □ Standing (e.g., reading info boards, light talking) (70W) (M < 1.2 met) □ Low-intensity exercise (e.g., walking < 1.2 m/s, Tai Chi, slow dancing) (150W) (1.2 ≤ M < 2.6 met) |
| □ Moderate-intensity exercise (e.g., brisk walking, fitness, dancing) (220W) (2.6 ≤ M < 3.8 met) □ High-intensity exercise (e.g., running, ball games) (360W) (M > 3.8 met) |
| □<6 months | □6 months–1 year | □1–3 years | □More than 3 years |
| □8:00–9:00 | □9:00–10:00 | □10:00–11:00 | □11:00–12:00 | □12:00–13:00 |
| □13:00–14:00 | □14:00–15:00 | □15:00–16:00 | □16:00–17:00 | □17:00–18:00 |
| □Lying down □Sitting □Low-intensity exercise (walking, Tai Chi, yoga, etc.) □Moderate-intensity exercise (brisk walking, jogging, etc.) □High-intensity exercise (ball games, competitive sports, etc.) |
| □Indoors with air conditioning □Naturally ventilated indoors □Shaded outdoor space □Sunny outdoor space |
| □Rest □Exercising □Socializing □Enjoy scenery □Reading □Group activity □Passing by |
| □Daily □Several times a week □Weekly □Occasionally □Rarely |
| □<5min □5–15min □15–30min □>30min |
| □Open sunny area □Tree-shaded area/building shade □Seating/rest area □Windless area □Constantly moving (if selected, no need to choose others; otherwise, select at least 1 and up to 3 options) |
| □Very cold (−3) | □Cold (−2) | □Cool (−1) | □Neutral (0) | □Slightly warm (+1) | □Warm (+2) | □Very hot (+3) |
| □Comfortable (0) | □Slightly uncomfortable (+1) | □Uncomfortable (+2) | □Very uncomfortable (+3) |
| □Fully acceptable (0) | □Slightly acceptable(−1) | □Slightly unacceptable(−1) | □Very unacceptable(−1) |
| □Lower (−1) | □No change (0) | □Higher (+1) |
| □Lower (−1) | □No change (0) | □Higher (+1) |
| □Lower (−1) | □No change (0) | □Higher (+1) |
| □Lower (−1) | □No change (0) | □Higher (+1) |
| □Move to shaded area | □Move to windy area | □Reduce activity | □Reduce clothing | □Use sunshade/umbrella or apply sunscreen | □Drink cold drinks |
| □Weather is nice | □Distance to dorm/study/ workplace | □Whether vegetation is rich | □Whether facilities are complete | □Whether space is open | □Whether activity site is quiet | □Whether activity site is hygienic |
Appendix A.2
| Survey Date | ___ December 2024 |
| Time of Completion | : - : |
| □9:00–10:00 | □10:00–11:00 | □11:00–12:00 | □12:00–13:00 |
| □13:00–14:00 | □14:00–15:00 | □15:00–16:00 | □16:00–17:00 □17:00–18:00 |
 |
| □Open sunny area □Light–shade interface □Building shaded area □Tree-shaded area |
| □Thermal underwear/pajamas (0.20 clo) | □Thin undershirt (short sleeves) (0.13 clo) | □Thick sleeveless vest (0.22 clo) | □Light long-sleeve sweater (0.25 clo) | □Heavy long-sleeve sweater (0.36 clo) |
| □Sweatshirt (0.30 clo) | □Light jacket (0.36 clo) | □Thick jacket (0.44 clo) | □Padded cotton coat (0.50 clo) | □Down jacket (0.55 clo) |
| □Thermal long johns/pajama pants (0.15 clo) | □Thin wool trousers (0.24 clo) | □Thick wool trousers (0.28 clo) | □Thin long trousers (0.24 clo) | □Thick long trousers/fleece-lined pants (0.28 clo) |
| □Ankle-length athletic socks (0.02 clo) | □Stockings (0.02 clo) | □Calf-length socks (0.03 clo) | □Thick knee socks (0.06 clo) |
| □Seasonal shoes (winter/spring) (0.10 clo) | □Boots (0.10 clo) | □Leather shoes (0.04 clo) | □Cotton slippers (0.03 clo) |
| □ Sitting (e.g., sunbathing, using phone, reading, chatting) (60W) (M < 1.2 met) □ Standing (e.g., reading info boards, light talking) (70W) (M < 1.2 met) □ Low-intensity exercise (e.g., walking < 1.2 m/s, Tai Chi, slow dancing) (150W) (1.2 ≤ M < 2.6 met) |
| □ Moderate-intensity exercise (e.g., brisk walking, fitness, dancing) (220W) (2.6 ≤ M < 3.8 met) □ High-intensity exercise (e.g., running, ball games) (360W) (M > 3.8 met) |
| □<6 months | □6 months–1 year | □1–3 years | □More than 3 years |
| □8:00–9:00 | □9:00–10:00 | □10:00–11:00 | □11:00–12:00 | □12:00–13:00 |
| □13:00–14:00 | □14:00–15:00 | □15:00–16:00 | □16:00–17:00 | □17:00–18:00 |
| □Lying down □Sitting □Low-intensity exercise (walking, Tai Chi, yoga, etc.) □Moderate-intensity exercise (brisk walking, jogging, etc.) □High-intensity exercise (ball games, competitive sports, etc.) |
| □Indoors with air conditioning □Naturally ventilated indoors □Shaded outdoor space □Sunny outdoor space |
| □Rest □Exercising □Socializing □Enjoy scenery □Reading □Group activity □Passing by |
| □Daily □Several times a week □Weekly □Occasionally □Rarely |
| □<5min □5–15min □15–30min □>30min |
| □Open sunny area □Tree-shaded area/building shade □Seating/rest area □Windless area □Constantly moving (if selected, no need to choose others; otherwise, select at least 1 and up to 3 options) |
| □Very cold (−3) | □Cold (−2) | □Cool (−1) | □Neutral (0) | □Slightly warm (+1) | □Warm (+2) | □Very hot (+3) |
| □Comfortable (0) | □Slightly uncomfortable(+1) | □Uncomfortable (+2) | □Very uncomfortable (+3) |
| □Fully acceptable (0) | □Slightly acceptable(−1) | □Slightly unacceptable(−1) | □Very unacceptable (−2) |
| □Lower (−1) | □No change (0) | □Higher (+1) |
| □Lower (−1) | □No change (0) | □Higher (+1) |
| □Lower (−1) | □No change (0) | □Higher (+1) |
| □Lower (−1) | □No change (0) | □Higher (+1) |
| □Move to a sunny area | □Move to a wind-sheltered area | □Increase activity intensity | □Add extra clothing | □Wear cold-weather gear (hat, mask, gloves) | □Drink a hot beverage (including plain hot water) |
| □Weather is nice | □Distance to dorm/study/ workplace | □Whether vegetation is rich | □Whether facilities are complete | □Whether space is open | □Whether activity site is quiet | □Whether activity site is hygienic |
Appendix A.3

| Factor | Greening Layouts (A) | Plant Types (B) | Surface Albedo (C) | - | Error | Research Cases | |
|---|---|---|---|---|---|---|---|
| Test Number | |||||||
| 1 | 1 | 1 | 1 | 1 | 1 | 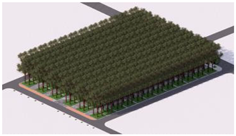 | |
| 2 | 1 | 2 | 2 | 2 | 2 | 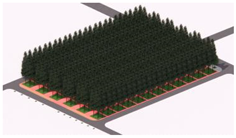 | |
| 3 | 1 | 3 | 3 | 3 | 3 |  | |
| 4 | 1 | 4 | 4 | 4 | 4 | 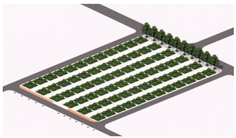 | |
| 5 | 2 | 1 | 2 | 3 | 4 |  | |
| 6 | 2 | 2 | 1 | 4 | 3 |  | |
| 7 | 2 | 3 | 4 | 1 | 2 |  | |
| 8 | 2 | 4 | 3 | 2 | 1 |  | |
| 9 | 3 | 1 | 3 | 4 | 2 |  | |
| 10 | 3 | 2 | 4 | 3 | 1 |  | |
| 11 | 3 | 3 | 1 | 2 | 4 |  | |
| 12 | 3 | 4 | 2 | 1 | 3 |  | |
| 13 | 4 | 1 | 4 | 2 | 3 |  | |
| 14 | 4 | 2 | 3 | 1 | 4 |  | |
| 15 | 4 | 3 | 2 | 4 | 1 |  | |
| 16 | 4 | 4 | 1 | 3 | 2 |  | |
Appendix A.4
Appendix A.5
- : number of factor levels, = 4;
- : total number of cases, = 16;
- : sum of squares for factor B;
- : degrees of freedom for factor B;
- : total degrees of freedom;
- : degrees of freedom for error;
- : mean square for factor B;
- : mean square for error;
- : F-value used to test whether factor B has a significant effect on the PET. A larger F-value indicates a more significant influence of the factor on the experimental results;
- : the cumulative distribution function value of the F-distribution;
- : the significance level of the result. If the p-value is less than the predetermined significance level (e.g., < 0.05), it indicates that the factor has a significant impact on the result.
Appendix A.6
- : the sum of squares for the F-th factor, where F = A, B, C, and similarly for other factors;
- : sum of squares for all factors;
- : the contribution rate of the F-th factor to the PET variation for that time period;
- : the contribution rate of the F-th factor to the PET variation during the first winter period (11:00–12:00), where the coefficient 0.5 represents the time period weighting;
- : the contribution rate of the F-th factor to the PET variation during the second winter period (16:00–17:00), where the coefficient 0.5 represents the time period weighting;
- : the contribution rate of the F-th factor to the PET variation during the first summer period (13:00–14:00), where the coefficient 0.5 represents the time period weighting;
- : the contribution rate of the F-th factor to the PET variation during the second summer period (17:00–18:00), where the coefficient 0.5 represents the time period weighting;
- : the weighted value of the contribution rate of the F-th factor to the PET variation during the main winter activity periods (11:00–12:00 and 16:00–17:00), where the coefficient 0.82 represents the winter weighting;
- : the weighted value of the contribution rate of the F-th factor to the PET variation during the main summer activity periods (13:00–14:00 and 17:00–18:00), where the coefficient 0.18 represents the summer weighting;
- : the combined weighted value of the contribution rate of the F-th factor to the PET variation during the main activity periods in both summer and winter (11:00–12:00 and 16:00–17:00 and 13:00–14:00 and 17:00–18:00).
Appendix A.7
- : the percentage of the activity area within the neutral PET range to the total site area for scheme i during the first winter period (11:00–12:00), with a time period weighting coefficient of 0.5;
- : the percentage of the activity area within the neutral PET range to the total site area for scheme i during the second winter period (16:00–17:00), with a time period weighting coefficient of 0.5;
- : the percentage of the activity area within the neutral PET range to the total site area for scheme i during the first summer period (13:00–14:00), with a time period weighting coefficient of 0.5;
- : the percentage of the activity area within the neutral PET range to the total site area for scheme i during the second summer period (17:00–18:00), with a time period weighting coefficient of 0.5;
- : the weighted value of the percentage of the activity area within the neutral PET range to the total site area for scheme i during the main winter activity periods (11:00–12:00 and 16:00–17:00), with a winter weighting coefficient of 0.82;
- : the weighted value of the percentage of the activity area within the neutral PET range to the total site area for scheme i during the main summer activity periods (13:00–14:00 and 17:00–18:00), with a summer weighting coefficient of 0.18;
- : the comprehensive weighted value of the percentage of the activity area within the neutral PET range to the total site area for scheme i during the main activity periods in both summer and winter (11:00–12:00, 16:00–17:00, 13:00–14:00, and 17:00–18:00);
- : the comprehensive weighted value of the percentage of the activity area within the neutral PET range to the total site area for the original scheme during the main activity periods in both summer and winter (11:00–12:00, 16:00–17:00, 13:00–14:00, and 17:00–18:00);
- : the comprehensive weighted improvement value of the percentage of the activity area within the neutral PET range for each experimental scheme compared to the original scheme during the main activity periods in both summer and winter.
Appendix A.8
References
- Contribution of Working Group II to the Sixth Assessment Report of the Intergovernmental Panel on Climate Change; Pörtner, H.O.; Roberts, D.C.; Tignor, M.; Poloczanska, E.S.; Mintenbeck, K.; Alegría, A.C.M.; Langsdorf, S.; Löschke, S.; Möller, V.; et al. IPCC, 2022: Climate Change 2022: Impacts, Adaptation and Vulnerability; Cambridge University Press: Cambridge, UK; New York, NY, USA, 2022; p. 3056. [Google Scholar]
- Fei, F.; Wang, Y.; Wang, L.; Fukuda, H.; Yao, W. Influence of greenery configuration on summer thermal environment of outdoor recreational space in elderly care centers. Build. Environ. 2023, 245, 110857. [Google Scholar] [CrossRef]
- Lai, D.; Liu, W.; Gan, T.; Liu, K.; Chen, Q. A review of mitigating strategies to improve the thermal environment and thermal comfort in urban outdoor spaces. Sci. Total Environ. 2019, 661, 337–353. [Google Scholar] [CrossRef]
- Canan, F.; Golasi, I.; Falasca, S.; Salata, F. Outdoor thermal perception and comfort conditions in the Koppen-Geiger climate category BSk. One-year field survey and measurement campaign in Konya, Turkey. Sci. Total Environ. 2020, 738, 140295. [Google Scholar] [CrossRef]
- Bian, G.M.; Gao, X.Y.; Zou, Q.S.; Cheng, Q.; Sun, T.Y.; Sha, S.Y.; Zhen, M. Effects of thermal environment and air quality on outdoor thermal comfort in urban parks of Tianjin, China. Environ. Sci. Pollut. Res. 2023, 30, 97363–97376. [Google Scholar] [CrossRef] [PubMed]
- Dashti, A.; Mohammadsharifi, N.; Shokuhi, M.; Matzarakis, A. A comprehensive study on wintertime outdoor thermal comfort of blue-green infrastructure in an arid climate: A case of Isfahan, Iran. Sustain. Cities Soc. 2024, 113, 105658. [Google Scholar] [CrossRef]
- Heidari, A.; Davtalab, J.; Sargazi, M.A. Effect of awning on thermal comfort adjustment in open urban space using PET and UTCI indexes: A case study of Sistan region in Iran. Sustain. Cities Soc. 2024, 101, 105175. [Google Scholar] [CrossRef]
- He, X.Y.; An, L.; Hong, B.; Huang, B.Z.; Cui, X. Cross-cultural differences in thermal comfort in campus open spaces: A longitudinal field survey in China’s cold region. Build. Environ. 2020, 172, 106739. [Google Scholar] [CrossRef]
- Niu, J.Q.; Hong, B.; Geng, Y.B.; Mi, J.Y.; He, J.Y. Summertime physiological and thermal responses among activity levels in campus outdoor spaces in a humid subtropical city. Sci. Total Environ. 2020, 728, 138757. [Google Scholar] [CrossRef]
- Geng, Y.B.; Hong, B.; Du, M.; Yuan, T.T.; Wang, Y.B. Combined effects of visual-acoustic-thermal comfort in campus open spaces: A pilot study in China’s cold region. Build. Environ. 2022, 209, 108658. [Google Scholar] [CrossRef]
- Li, Y.J.; Hong, B.; Wang, Y.B.; Bai, H.F.; Chen, H.Y. Assessing heat stress relief measures to enhance outdoor thermal comfort: A field study in China’s cold region. Sustain. Cities Soc. 2022, 80. [Google Scholar] [CrossRef]
- Chang, J.Y.; Du, M.; Hong, B.; Qu, H.Y.; Chen, H.Y. Effects of thermal-olfactory interactions on emotional changes in urban outdoor environments. Build. Environ. 2023, 232, 110049. [Google Scholar] [CrossRef]
- Jing, W.Q.; Qin, Z.M.; Mu, T.; Ge, Z.M.; Dong, Y.T. Evaluating thermal comfort indices for outdoor spaces on a university campus. Sci. Rep. 2024, 14, 21253. [Google Scholar] [CrossRef]
- Xiong, J.; Cheng, B.; Zhang, J.; Liu, Y.S.; Tan, X.Y.; Shi, M.J.; He, X.M.; Guo, J.R. A study of waterside microenvironmental factors and their effects on summer outdoor thermal comfort in a Cfa-climate campus. J. Therm. Biol. 2023, 117, 103700. [Google Scholar] [CrossRef]
- Zhang, Y.C.; Liu, J.L.; Zheng, Z.M.; Fang, Z.S.; Zhang, X.L.; Gao, Y.F.; Xie, Y.X. Analysis of thermal comfort during movement in a semi-open transition space. Energy Build. 2020, 225, 110312. [Google Scholar] [CrossRef]
- Lam, C.K.C.; Weng, J.F.; Liu, K.; Hang, J. The effects of shading devices on outdoor thermal and visual comfort in Southern China during summer. Build. Environ. 2023, 228, 109743. [Google Scholar] [CrossRef]
- Yang, J.H.; Li, H.Y.; Fang, Z.S.; Li, Y.C.; Lu, F.Q.; Guo, T.Y.; Zhang, X.; Lin, C.; Lu, J. Study on thermal and physiological responses during summer while moving between academic buildings under different walking conditions. Case Stud. Therm. Eng. 2025, 66, 105809. [Google Scholar] [CrossRef]
- Li, J.N.; Niu, J.L.; Huang, T.Y.; Mak, C.M. Dynamic effects of frequent step changes in outdoor microclimate environments on thermal sensation and dissatisfaction of pedestrian during summer. Sustain. Cities Soc. 2022, 79, 103670. [Google Scholar] [CrossRef]
- Al Tahir, I.; El Fattah, A.A.; Mohammed, M.; Asif, M.; Almahdy, O. Evaluating the performance of outdoor shading devices on human thermal comfort in hot humid climates: A case study of Dhahran. Build. Environ. 2025, 271, 112625. [Google Scholar] [CrossRef]
- Aghamohammadi, N.; Fong, C.S.; Idrus, M.H.M.; Ramakreshnan, L.; Haque, U. Outdoor thermal comfort and somatic symptoms among students in a tropical city. Sustain. Cities Soc. 2021, 72, 103015. [Google Scholar] [CrossRef]
- Othman, N.E.; Zaki, S.A.; Rijal, H.B.; Ahmad, N.H.; Abd Razak, A. Field study of pedestrians’ comfort temperatures under outdoor and semi-outdoor conditions in Malaysian university campuses. Int. J. Biometeorol. 2021, 65, 453–477. [Google Scholar] [CrossRef]
- Tochaiwat, K.; Rinchumphu, D.; Sundaranaga, C.; Pomsurin, N.; Chaichana, C.; Khuwuthyakorn, P.; Phichetkunbodee, N.; Chan, Y.C. The potential of a tree to increase comfort hours in campus public space design. Energy Rep. 2023, 9, 184–193. [Google Scholar] [CrossRef]
- Khalili, S.; Fayaz, R.; Zolfaghari, S.A. Analyzing outdoor thermal comfort conditions in a university campus in hot-arid climate: A case study in Birjand, Iran. Urban Clim. 2022, 43, 101128. [Google Scholar] [CrossRef]
- Andreou, E. Thermal comfort in outdoor spaces and urban canyon microclimate. Renew. Energy 2013, 55, 182–188. [Google Scholar] [CrossRef]
- Cao, X.; Onishi, A.; Chen, J.; Imura, H. Quantifying the cool island intensity of urban parks using ASTER and IKONOS data. Landsc. Urban Plan. 2010, 96, 224–231. [Google Scholar] [CrossRef]
- Li, Y.; Ren, C.; Ho, J.Y.-e.; Shi, Y. Landscape metrics in assessing how the configuration of urban green spaces affects their cooling effect: A systematic review of empirical studies. Landsc. Urban Plan. 2023, 239, 104842. [Google Scholar] [CrossRef]
- Zhou, W.; Huang, G.; Cadenasso, M.L. Does spatial configuration matter? Understanding the effects of land cover pattern on land surface temperature in urban landscapes. Landsc. Urban Plan. 2011, 102, 54–63. [Google Scholar] [CrossRef]
- Altunkasa, C.; Uslu, C. Use of outdoor microclimate simulation maps for a planting design to improve thermal comfort. Sustain. Cities Soc. 2020, 57, 102137. [Google Scholar] [CrossRef]
- Dong, Q.; Xu, X.; Zhen, M. Assessing the cooling and buildings’ energy-saving potential of urban trees in severe cold region of China during summer. Build. Environ. 2023, 244, 110818. [Google Scholar] [CrossRef]
- Taha, H. Urban climates and heat islands: Albedo, evapotranspiration, and anthropogenic heat. Energy Build. 1997, 25, 99–103. [Google Scholar] [CrossRef]
- Santamouris, M.; Gaitani, N.; Spanou, A.; Saliari, M.; Giannopoulou, K.; Vasilakopoulou, K.; Kardomateas, T. Using cool paving materials to improve microclimate of urban areas–Design realization and results of the flisvos project. Build. Environ. 2012, 53, 128–136. [Google Scholar] [CrossRef]
- Taleghani, M.; Berardi, U. The effect of pavement characteristics on pedestrians’ thermal comfort in Toronto. Urban Clim. 2018, 24, 449–459. [Google Scholar] [CrossRef]
- Rosso, F.; Pisello, A.L.; Cotana, F.; Ferrero, M. On the thermal and visual pedestrians’ perception about cool natural stones for urban paving: A field survey in summer conditions. Build. Environ. 2016, 107, 198–214. [Google Scholar] [CrossRef]
- Yue, W.; Liu, X.; Zhou, Y.; Liu, Y. Impacts of urban configuration on urban heat island: An empirical study in China mega-cities. Sci. Total Environ. 2019, 671, 1036–1046. [Google Scholar] [CrossRef]
- Karimi, A.; Sanaieian, H.; Farhadi, H.; Norouzian-Maleki, S. Evaluation of the thermal indices and thermal comfort improvement by different vegetation species and materials in a medium-sized urban park. Energy Rep. 2020, 6, 1670–1684. [Google Scholar] [CrossRef]
- Gachkar, D.; Taghvaei, S.H.; Norouzian-Maleki, S. Outdoor thermal comfort enhancement using various vegetation species and materials (case study: Delgosha Garden, Iran). Sustain. Cities Soc. 2021, 75, 22. [Google Scholar] [CrossRef]
- Chu, Z.T.; Li, S.; Li, T.; Qian, H.J.; Liu, C.; Yan, Z.H. Numerical simulation of layout and landscape elements on the thermal environment of urban squares. Ecol. Inform. 2024, 82, 102770. [Google Scholar] [CrossRef]
- Zhu, K.; Huang, B.; Guo, J. Natural Geography of China; Science Press: Beijing, China, 1984. [Google Scholar]
- Ministry of Housing and Urban-Rural Development of the People’s Republic of China. Code for Thermal Design of Civil Buildings; Ministry of Housing and Urban-Rural Development of the People’s Republic of China: Beijing, China, 2016. [Google Scholar]
- NASA. POWER. Data Access Viewer— Prediction of Worldwide Energy Resource. Available online: https://power.larc.nasa.gov/data-access-viewer/ (accessed on 15 December 2024).
- DB15/T 1761-2019; Climate Season Classification. Inner Mongolia Meteorological Bureau: Hohhot, China, 2019.
- China Meteorological Administration Climate; Information Center Meteorological Data Office; Department of Building Science; Tsinghua University. Standard Weather Data for Thermal Design of Buildings in China; China Architecture & Building Press: Beijing, China, 2005. [Google Scholar]
- Hall, I.; Prairie, R.; Anderson, H.; Boes, E. Generation de typical meteorologicalvears for 26 SOLET stations. In Proceedings of the Annual Meeting of the American Section of the International Solar Energy Society, Denver, CO, USA, 28–31 August 1978. [Google Scholar]
- Yang, L.; Lam, J.C.; Liu, J. Analysis of typical meteorological years in different climates of China. Energy Convers. Manag. 2007, 48, 654–668. [Google Scholar] [CrossRef]
- ISO 7726-1998; Ergonomics of the Thermal Environment-Instruments for Measuring Physical Quantities. International Organization for Standardization: Geneva, Switzerland, 1998.
- Chow, W.T.L.; Akbar, S.; Heng, S.L.; Roth, M. Assessment of measured and perceived microclimates within a tropical urban forest. Urban For. Urban Green. 2016, 16, 62–75. [Google Scholar] [CrossRef]
- Spagnolo, J.; De Dear, R. A field study of thermal comfort in outdoor and semi-outdoor environments in subtropical Sydney Australia. Build. Environ. 2003, 38, 721–738. [Google Scholar] [CrossRef]
- Du, H.; Lian, Z.W.; Lan, L.; Lai, D.Y. Application of statistical analysis of sample size: How many occupant responses are required for an indoor environmental quality (IEQ) field study. Build. Simul. 2023, 16, 577–588. [Google Scholar] [CrossRef]
- Wang, Z.; Zhang, H.; He, Y.D.; Luo, M.H.; Li, Z.W.; Hong, T.Z.; Lin, B.R. Revisiting individual and group differences in thermal comfort based on ASHRAE database. Energy Build. 2020, 219, 110017. [Google Scholar] [CrossRef]
- Guo, T.Y.; Lin, Z.X.; Zhao, Y.; Fang, Z.S.; Fan, Y.N.; Zhang, X.; Yang, J.H.; Li, Y.K. Investigation and optimization of outdoor thermal comfort in elementary school campuses: Example from a humid-hot area in China. Build. Environ. 2024, 248, 111055. [Google Scholar] [CrossRef]
- Cronbach, L.J. Coefficient alpha and the internal structure of tests. Psychometrika 1951, 16, 297–334. [Google Scholar] [CrossRef]
- Gagge, A.P. An effective temperature scale based on a simple model of human physiological regulatory response. ASHRAE Trans. 1971, 77, 247–262. [Google Scholar]
- Höppe, P. The physiological equivalent temperature—A universal index for the biometeorological assessment of the thermal environment. Int. J. Biometeorol. 1999, 43, 71–75. [Google Scholar] [CrossRef]
- Tao, Z.Y.; Zhu, X.D.; Xu, G.Q.; Zou, D.Z.; Li, G. A Comparative Analysis of Outdoor Thermal Comfort Indicators Applied in China and Other Countries. Sustainability 2023, 15, 16029. [Google Scholar] [CrossRef]
- Matzarakis, A.; Rutz, F.; Mayer, H. Modelling radiation fluxes in simple and complex environments—Application of the RayMan model. Int. J. Biometeorol. 2007, 51, 323–334. [Google Scholar] [CrossRef]
- Sodoudi, S.; Zhang, H.W.; Chi, X.L.; Müller, F.; Li, H.D. The influence of spatial configuration of green areas on microclimate and thermal comfort. Urban For. Urban Green. 2018, 34, 85–96. [Google Scholar] [CrossRef]
- McPherson, E.G.; Nowak, D.J.; Rowntree, R.A. (Eds.) Chicago’s Urban Forest Ecosystem: Results of the Chicago Urban Forest Climate Project; NE-186; Department of Agriculture, Forest Service, Northeastern Forest Experiment Station: Radnor, PA, USA, 1 June 1994; pp. 5–6. [Google Scholar]
- Cox, D.R.; Reid, N. The Theory of the Design of Experiments; CRC Press: Boca Raton, FL, USA, 2000. [Google Scholar]
- Condra, L. Reliability Improvement with Design of Experiment; CRC Press: Boca Raton, FL, USA, 2001. [Google Scholar]
- Chen, L.X.; Zhang, Y.Z.; Luo, Z.Z.; Yao, F. Optimization Design of the Landscape Elements in the Lhasa Residential Area Driven by an Orthogonal Experiment and a Numerical Simulation. Int. J. Environ. Res. Public Health 2022, 19, 6303. [Google Scholar] [CrossRef]
- Yang, S.H.; Zhou, D.; Wang, Y.P.; Li, P. Comparing impact of multi-factor planning layouts in residential areas on summer thermal comfort based on orthogonal design of experiments (ODOE). Build. Environ. 2020, 182, 107145. [Google Scholar] [CrossRef]
- Zheng, G.R.; Xu, H.; Liu, F.; Dong, J.W. Impact of Plant Layout on Microclimate of Summer Courtyard Space Based on Orthogonal Experimental Design. Sustainability 2024, 16, 4425. [Google Scholar] [CrossRef]
- Yang, Y.J.; Gatto, E.; Gao, Z.; Buccolieri, R.; Morakinyo, T.E.; Lan, H.N. The “plant evaluation model” for the assessment of the impact of vegetation on outdoor microclimate in the urban environment. Sustain. Cities Soc. 2021, 71, 102971. [Google Scholar] [CrossRef]
- Lam, C.K.C.; Lee, H.; Yang, S.R.; Park, S. A review on the significance and perspective of the numerical simulations of outdoor thermal environment. Sustain. Cities Soc. 2021, 71, 102971. [Google Scholar] [CrossRef]
- Tsoka, S.; Tsikaloudaki, A.; Theodosiou, T. Analyzing the ENVI-met microclimate model’s performance and assessing cool materials and urban vegetation applications-A review. Sustain. Cities Soc. 2018, 43, 55–76. [Google Scholar] [CrossRef]
- Tominaga, Y.; Mochida, A.; Murakami, S.; Sawaki, S. Comparison of various revised k–ε models and LES applied to flow around a high-rise building model with 1:1:2 shape placed within the surface boundary layer. J. Wind. Eng. Ind. Aerodyn. 2008, 96, 389–411. [Google Scholar] [CrossRef]
- Forouzandeh, A. Numerical modeling validation for the microclimate thermal condition of semi-closed courtyard spaces between buildings. Sustain. Cities Soc. 2018, 36, 327–345. [Google Scholar] [CrossRef]
- Salata, F.; Golasi, L.; Volloaro, R.D.; Vollaro, A.D. Urban microclimate and outdoor thermal comfort. A proper procedure to fit ENVI-met simulation outputs to experimental data. Sustain. Cities Soc. 2016, 26, 318–343. [Google Scholar] [CrossRef]
- Stull, R.B. An Introduction to Boundary Layer Meteorology; Kluwer Academic Publishers Group: The Hague, The Netherlands, 1988. [Google Scholar]
- European Space Agency (ESA); German Aerospace Center (DLR). Sentinel-5P TROPOMI Cloud 1-Orbit L2 5.5km x 3.5km. Available online: https://disc.gsfc.nasa.gov/datasets/S5P_L2__CLOUD__HiR_2/summary?keywords=cloud%20cover (accessed on 3 March 2025).
- Cheung, P.K.; Jim, C.Y. Determination and application of outdoor thermal benchmarks. Build. Environ. 2017, 123, 333–350. [Google Scholar] [CrossRef]
- Yang, Y.J.; Zhou, D.; Wang, Y.P.; Meng, X.Z.; Gu, Z.L.; Xu, D.; Han, X.X. Planning method of centralized greening in high-rise residential blocks based on improvement of thermal comfort in summer. Sustain. Cities Soc. 2022, 80, 103802. [Google Scholar] [CrossRef]
- Sun, S.B.; Xu, X.Y.; Lao, Z.M.; Liu, W.; Li, Z.D.; García, E.H.; He, L.; Zhu, J.N. Evaluating the impact of urban green space and landscape design parameters on thermal comfort in hot summer by numerical simulation. Build. Environ. 2017, 123, 277–288. [Google Scholar] [CrossRef]
- Zhang, L.; Zhan, Q.M.; Lan, Y.L. Effects of the tree distribution and species on outdoor environment conditions in a hot summer and cold winter zone: A case study in Wuhan residential quarters. Build. Environ. 2018, 130, 27–39. [Google Scholar] [CrossRef]
- Chen, X.; Xue, P.N.; Liu, L.; Gao, L.X.; Liu, J. Outdoor thermal comfort and adaptation in severe cold area: A longitudinal survey in Harbin, China. Build. Environ. 2018, 143, 548–560. [Google Scholar] [CrossRef]
- Su, Y.; Wang, C.J.; Li, Z.M.; Meng, Q.L.; Gong, A.; Wu, Z.R.; Zhao, Q.F. Summer outdoor thermal comfort assessment in city squares-A case study of cold dry winter, hot summer climate zone. Sustain. Cities Soc. 2024, 101, 105062. [Google Scholar] [CrossRef]
- Canan, F.; Golasi, I.; Ciancio, V.; Coppi, M.; Salata, F. Outdoor thermal comfort conditions during summer in a cold semi-arid climate. A transversal field survey in Central Anatolia (Turkey). Build. Environ. 2019, 148, 212–224. [Google Scholar] [CrossRef]
- Hadianpour, M.; Mahdavinejad, M.; Bemanian, M.; Nasrollahi, F. Seasonal differences of subjective thermal sensation and neutral temperature in an outdoor shaded space in Tehran, Iran. Sustain. Cities Soc. 2018, 39, 751–764. [Google Scholar] [CrossRef]
- Yang, B.; Olofsson, T.; Nair, G.; Kabanshi, A. Outdoor thermal comfort under subarctic climate of north Sweden—A pilot study in Umea. Sustain. Cities Soc. 2017, 28, 387–397. [Google Scholar] [CrossRef]
- Mi, J.Y.; Hong, B.; Zhang, T.; Huang, B.Z.; Niu, J.Q. Outdoor thermal benchmarks and their application to climate-responsive designs of residential open spaces in a cold region of China. Build. Environ. 2020, 169, 106592. [Google Scholar] [CrossRef]
- de Dear, R.J.; Brager, G.S. Developing an Adaptive Model of Thermal Comfort and Preference; Macquarie Research Ltd., Macquarie University: Sydney, NSW, Australia; Center for Environmental Design Research, University of California: Berkeley, CA, USA, 1997. [Google Scholar]
- Yin, Q.; Cao, Y.H.; Sun, C. Research on outdoor thermal comfort of high-density urban center in severe cold area. Build. Environ. 2021, 200, 107938. [Google Scholar] [CrossRef]
- Salata, F.; Golasi, I.; Vollaro, R.D.; Vollaro, A.D. Outdoor thermal comfort in the Mediterranean area. A transversal study in Rome, Italy. Build. Environ. 2016, 96, 46–61. [Google Scholar] [CrossRef]
- Nikolopoulou, M.; Steemers, K. Thermal comfort and psychological adaptation as a guide for designing urban spaces. Energy Build. 2003, 35, 95–101. [Google Scholar] [CrossRef]
- de Abreu-Harbicha, L.V.; Labakia, L.C.; Matzarakis, A. Effect of tree planting design and tree species on human thermal comfort in the tropics. Landsc. Urban Plan. 2015, 138, 99–109. [Google Scholar] [CrossRef]
- Zheng, S.L.; Guldmann, J.M.; Liu, Z.X.; Zhao, L.H. Influence of trees on the outdoor thermal environment in subtropical areas: An experimental study in Guangzhou, China. Sustain. Cities Soc. 2018, 42, 482–497. [Google Scholar] [CrossRef]
- Perini, K.; Chokhachian, A.; Auer, T. Nature Based Strategies for Urban and Building Sustainability; Elsevier Inc.: Amsterdam, The Netherlands, 2018. [Google Scholar]
- Morakinyo, T.E.; Dahanayake, K.; Adegun, O.B.; Balogun, A.A. Modelling the effect of tree-shading on summer indoor and outdoor thermal condition of two similar buildings in a Nigerian university. Energy Build. 2016, 130, 721–732. [Google Scholar] [CrossRef]
- Taleghani, M. The impact of increasing urban surface albedo on outdoor summer thermal comfort within a university campus. Urban Clim. 2018, 24, 175–184. [Google Scholar] [CrossRef]
- Erell, E.; Pearlmutter, D.; Boneh, D.; Kutiel, P.B. Effect of high-albedo materials on pedestrian heat stress in urban street canyons. Urban Clim. 2014, 10, 367–386. [Google Scholar] [CrossRef]
- Wu, Z.F.; Chen, L.D. Optimizing the spatial arrangement of trees in residential neighborhoods for better cooling effects: Integrating modeling with in-situ measurements. Landsc. Urban Plan. 2017, 167, 463–472. [Google Scholar] [CrossRef]
- Abdi, B.; Hami, A.; Zarehaghi, D. Impact of small-scale tree planting patterns on outdoor cooling and thermal comfort. Sustain. Cities Soc. 2020, 56, 102085. [Google Scholar] [CrossRef]
- Kong, F.H.; Yan, W.J.; Zheng, G.; Yin, H.W.; Cavan, G.; Zhan, W.F.; Zhang, N.; Cheng, L. Retrieval of three-dimensional tree canopy and shade using terrestrial laser scanning (TLS) data to analyze the cooling effect of vegetation. Agric. For. Meteorol. 2020, 287, 107947. [Google Scholar] [CrossRef]
- Morakinyo, T.E.; Kong, L.; Lau, K.K.L.; Yuan, C.; Ng, E. A study on the impact of shadow-cast and tree species on in-canyon and neighborhood’s thermal comfort. Build. Environ. 2017, 115, 1–17. [Google Scholar] [CrossRef]
- Morakinyo, T.E.; Lam, Y.F. Simulation study on the impact of tree-configuration, planting pattern and wind condition on street-canyon’s micro-climate and thermal comfort. Build. Environ. 2016, 103, 262–275. [Google Scholar] [CrossRef]
- Morakinyo, T.E.; Lau, K.K.L.; Ren, C.; Ng, E. Performance of Hong Kong’s common trees species for outdoor temperature regulation, thermal comfort and energy saving. Build. Environ. 2018, 137, 157–170. [Google Scholar] [CrossRef]
- Guo, W.; Cheng, B.; Wang, C.L.; Tang, X.Y. Tree planting indices and their effects on summer park thermal environment: A case study of a subtropical satellite city, China. Indoor Built Environ. 2022, 31, 109–120. [Google Scholar] [CrossRef]
- Mballo, S.; Herpin, S.; Manteau, M.; Demotes-Mainard, S.; Bournet, P.E. Impact of well-watered trees on the microclimate inside a canyon street scale model in outdoor environment. Urban Clim. 2021, 37, 100844. [Google Scholar] [CrossRef]
- Rahman, M.A.; Hartmann, C.; Moser-Reischl, A.; von Strachwitz, M.F.; Paeth, H.; Pretzsch, H.; Pauleit, S.; Rötzer, T. Tree cooling effects and human thermal comfort under contrasting species and sites. Agric. For. Meteorol. 2020, 287, 107947. [Google Scholar] [CrossRef]
- Shi, D.C.; Song, J.Y.; Huang, J.X.; Zhuang, C.Q.; Guo, R.; Gao, Y.F. Synergistic cooling effects (SCEs) of urban green-blue spaces on local thermal environment: A case study in Chongqing, China. Sustain. Cities Soc. 2020, 55, 102065. [Google Scholar] [CrossRef]
- Fei, F.; Wang, L.Y.; Wang, Y.; Yao, W.X.; Fukuda, H.; Xiao, Y.L.; Tian, L.; Ji, T.T. A new method for evaluating the synergistic effect of urban water body and vegetation in the summer outdoor thermal environment. J. Clean. Prod. 2023, 414, 137680. [Google Scholar] [CrossRef]
- Liu, Q.X.; Dong, Q.; Zhang, L.C.; Sun, C. Summer cooling island effects of blue-green spaces in severe cold regions: A case study of harbin, China. Build. Environ. 2024, 257, 111539. [Google Scholar] [CrossRef]


| Device Names | Measurement Parameters |
|---|---|
| Cup anemometer | Wind speed: Measurement range: 0–70 m/s, resolution: 0.1 m/s, accuracy: ±(0.3 + 0.03 V) m/s |
| wind vane | Wind direction: Range: 0–360°, resolution: 1°, accuracy: ±3° |
| Multi-parameter Stevenson screen | Ambient temperature: Range: −40 to +80 °C, resolution: 0.1 °C, accuracy: ±0.2 °C Ambient humidity: Range: 0–100% RH, resolution: 0.1% RH, accuracy: ±2% (≤80% RH), ±5% (>80% RH) |
| Pyranometer | Solar radiation: Range: 0–2000 W/m2, resolution: 1 W/m2, accuracy: ≤5% |
| JTR04 globe thermometer | Globe thermometer: Temperature range: 10–85 °C, temperature accuracy: ±0.5 °C, resolution: 0.1 °C, globe diameter: 150 mm, emissivity: >0.95 |
| Factor | Greening Layouts (A) | Plant Types (B) | Surface Albedo (C) | |
|---|---|---|---|---|
| Level | ||||
| 1 | 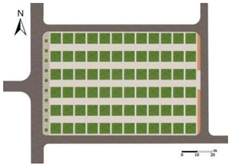 |  |  | |
| Dotted-shaped greening layouts | Black poplar (Populus nigra) | 0.2 | ||
| 2 |  | 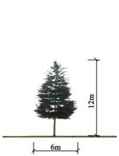 | 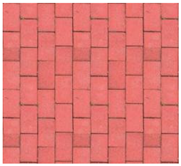 | |
| Belt-shaped greening layouts (N-S) | Oil pine (Pinus tabuliformis) | 0.3 | ||
| 3 |  | 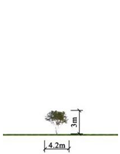 | 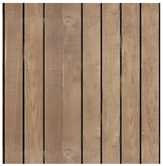 | |
| Belt-shaped greening layouts (W-E) | Chinese plum (Amygdalus triloba) | 0.4 | ||
| 4 |  |  | 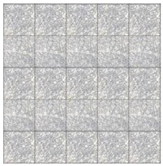 | |
| Block-shaped greenery layout | Border privet | 0.5 | ||
| Plant Name | Plant Type | Plant Height (m) | Canopy Diameter (m) | LAI [57] | Proportion of Total Plant Count (%) |
|---|---|---|---|---|---|
| Black poplar | Deciduous tree | 20 | 13.2 | 3.37 | 10.4% |
| Chinese Pine | Evergreen tree | 12 | 6.0 | 5.38 | 40.5% |
| Chinese Plum | Deciduous tree | 3 | 4.2 | 2.34 | 29.4% |
| Privet | Deciduous shrub | 1.5 | 2.1 | 2.54 | 11.7% |
| Partial Correlation | PET and Ta | PET and RH | PET and Va | PET and Tmrt | |||||
|---|---|---|---|---|---|---|---|---|---|
| Season | P | R | P | R | P | R | P | R | |
| Summer | 0.000 | 0.628 | 0.218 | 0.108 | 0.000 | −0.963 | 0.000 | 0.997 | |
| Winter | 0.000 | 0.358 | 0.136 | 0.106 | 0.000 | −0.784 | 0.000 | 0.413 | |
| Parameter | Summer (29 June 2024) | Winter (7 December 2024) |
|---|---|---|
| Start time | 7:00 | 7:00 |
| Simulation duration | 11 h | 11 h |
| Daily maximum/minimum temperature (°C) | 27.37 °C/18.24 °C | −2.44 °C/−11.31 °C |
| Daily maximum/minimum relative humidity (%) | 56.65%/34.94% | 61.73%/37.50% |
| Specific humidity at 2500 m (g/kg) | 8.57 | 0.78 |
| Constant wind speed at 10 m (m/s) | 2.04 | 1.17 |
| Constant wind direction at 10 m (°) | 180 | 180 |
| Ground microscale roughness length (m) | 1.00 | 1.00 |
| Low cloud cover (0–8) | 0 | 0 |
| Middle cloud cover (0–8) | 6 | 2 |
| High cloud cover (0–8) | 1 | 0 |
| Parameter | Summer | Winter |
|---|---|---|
| Age (y) | 22 | 22 |
| Gender | M | M |
| Weight (kg) | 67.49 | 67.66 |
| Height (m) | 1.73 | 1.75 |
| Body posture | Standing | Standing |
| Walking speed (m/s) | 1.2 | 1.2 |
| Static outdoor clothing insulation (clo) | 0.4 | 1.72 |
| Indoor clothing insulation (clo) | 0.4 | 1.2 |
| Metabolic rate during activity (M) | 142.37 | 142.41 |
| Statistical Indicators | RMSE | MAE | |
|---|---|---|---|
| Meteorological Parameters | |||
| Ta-summer (°C) | 0.6 | 0.5 | |
| Ta-winter (°C) | 1.1 | 0.7 | |
| Tmrt-summer (°C) | 13.8 | 12.7 | |
| Tmrt-winter (°C) | 13.7 | 10.4 | |
| Stress Category | PET Classification in Summer | PET Classification in Winter |
|---|---|---|
| Hot | PET > 57.6 °C | — |
| Warm | 53.7 °C < PET ≤ 57.6 °C | — |
| Slightly warm | 31.3 °C < PET ≤ 53.7 °C | — |
| Neutral | PET ≤ 31.3 °C | PET ≥ −11.3 °C |
| Slightly cool | — | −17.5 °C ≤ PET < −11.3 °C |
| Cool | — | −30.2 °C ≤ PET < −17.5 °C |
| Cold | — | PET < −30.2 °C |
Disclaimer/Publisher’s Note: The statements, opinions and data contained in all publications are solely those of the individual author(s) and contributor(s) and not of MDPI and/or the editor(s). MDPI and/or the editor(s) disclaim responsibility for any injury to people or property resulting from any ideas, methods, instructions or products referred to in the content. |
© 2025 by the authors. Licensee MDPI, Basel, Switzerland. This article is an open access article distributed under the terms and conditions of the Creative Commons Attribution (CC BY) license (https://creativecommons.org/licenses/by/4.0/).
Share and Cite
Tao, Z.; Xu, G.; Li, G.; Zhao, X.; Gao, Z.; Shen, X. Influence and Optimization of Landscape Elements on Outdoor Thermal Comfort in University Plazas in Severely Cold Regions. Plants 2025, 14, 2228. https://doi.org/10.3390/plants14142228
Tao Z, Xu G, Li G, Zhao X, Gao Z, Shen X. Influence and Optimization of Landscape Elements on Outdoor Thermal Comfort in University Plazas in Severely Cold Regions. Plants. 2025; 14(14):2228. https://doi.org/10.3390/plants14142228
Chicago/Turabian StyleTao, Zhiyi, Guoqiang Xu, Guo Li, Xiaochen Zhao, Zhaokui Gao, and Xin Shen. 2025. "Influence and Optimization of Landscape Elements on Outdoor Thermal Comfort in University Plazas in Severely Cold Regions" Plants 14, no. 14: 2228. https://doi.org/10.3390/plants14142228
APA StyleTao, Z., Xu, G., Li, G., Zhao, X., Gao, Z., & Shen, X. (2025). Influence and Optimization of Landscape Elements on Outdoor Thermal Comfort in University Plazas in Severely Cold Regions. Plants, 14(14), 2228. https://doi.org/10.3390/plants14142228