Article

Phylogenomic Analyses Reveal Species Relationships and Phylogenetic Incongruence with New Member Detected in Allium Subgenus Cyathophora

Key Laboratory of Bio-Resources and Eco-Environment of Ministry of Education, College of Life Sciences, Sichuan University, Chengdu 610065, China
*
Author to whom correspondence should be addressed.
Plants 2025, 14(13), 2083; https://doi.org/10.3390/plants14132083
Submission received: 24 April 2025 / Revised: 3 July 2025 / Accepted: 4 July 2025 / Published: 7 July 2025
(This article belongs to the Special Issue Plant Taxonomy, Phylogeny, and Evolution)

Abstract

Species characterized by undetermined clade affiliations, limited research coverage, and deficient systematic investigation serve as enigmatic entities in plant and animal taxonomy, yet hold critical significance for exploring phylogenetic relationships and evolutionary trajectories. Subgenus Cyathophora (Allium, Amayllidaceae), a small taxon comprising approximately five species distributed in the Qinghai–Tibet Plateau (QTP) and adjacent regions might contain an enigmatic species that has long remained unexplored. In this study, we collected data on species from subgenus Cyathophora and its close relatives in subgenus Rhizirideum, as well as the enigmatic species Allium siphonanthum. Combining phylogenomic datasets and morphological evidence, we investigated species relationships and the underlying mechanism of phylogenetic discordance. A total of 1662 single-copy genes (SCGs) and 150 plastid loci were filtered and used for phylogenetic analyses based on concatenated and coalescent-based methods. Furthermore, to systematically evaluate phylogenetic discordance and decipher its underlying drivers, we implemented integrative analyses using multiple approaches, such as coalescent simulation, Quartet Sampling (QS), and MSCquartets. Our phylogenetic analyses robustly resolve A. siphonanthum as a member of subg. Cyathophora, forming a sister clade with A. spicatum. This relationship was further corroborated by their shared morphological characteristics. Despite the robust phylogenies inferred, extensive phylogenetic conflicts were detected not only among gene trees but also between SCGs and plastid-derived species trees. These significant phylogenetic incongruences in subg. Cyathophora predominantly stem from incomplete lineage sorting (ILS) and reticulate evolutionary processes, with historical hybridization events likely correlated with the past orogenic dynamics and paleoclimatic oscillations in the QTP and adjacent regions. Our findings not only provide new insights into the phylogeny of subg. Cyathophora but also significantly enhance our understanding of the evolution of species in this subgenus.

1. Introduction

Allium L., a dominant monocotyledonous genus, represents the sole member in the tribe Allieae (Amaryllidaceae) [1]. This genus comprises over 1000 recognized species predominantly distributed across the Northern Hemisphere [2,3] exhibiting remarkable habitat plasticity, ranging from xeric well-drained soils to hydric environments, and even growing in swampy or aquatic conditions [4]. This extensive geographical distribution coupled with habitat heterogeneity has fostered both high species richness and remarkable morphological diversification within this genus [5,6,7]. Many species are characterized by bulbs enclosed in membranous (sometimes fibrous) tunics, free or almost-free tepals, and often a sub-gynobasic style, and are frequently accompanied by strong or distinctive smells and tastes [6]. Previous studies have suggested that this genus includes two centers of species diversity: one spanning Southwest/Central Asia to the Mediterranean, and another in North America [5,6,8,9]. Although extensive studies have established a robust phylogenetic framework for Allium species, which has classified this genus into 15 subgenera [6], and recent advances in sequencing technologies have further facilitated the investigations of species relationships and evolution within subgenera or sections [10,11,12,13,14,15,16], significant knowledge gaps persist in several subgenera. These include unresolved species composition, ambiguous interspecific relationships, and underexplored evolutionary process within specific taxonomic groups. Particularly, for taxonomically neglected species that have long been understudied, their phylogenetic placement and evolutionary relationships with closely related taxa necessitate comprehensive investigation and systematic resolution.
Subgenus Cyathophora R.M. Fritsch is a small taxon of genus Allium L., currently comprising five species: Allium mairei H.Lév., A. spicatum (Prain) N. Friesen, A. farreri Stearn, A. cyathophorum Bureau & Franch, and A. tetraploideum M.J. Li & X.J. He [16,17]. All species of this subgenus are distributed across the Qinghai–Tibet Plateau (QTP) and adjacent regions. Notably, A. spicatum [18], distinguished by its unique spicate inflorescence, is restricted to the arid western QTP, whereas the remaining four species with umbellate inflorescences primarily occur in the Hengduan Mountains (HDMs) and surrounding regions [10]. Since the establishment of this subgenus, numerous studies have been conducted. Molecular evidence indicates that A. spicatum belongs to subg. Cyathophora, despite its conspicuously elongated spike which contrasts with the typically umbel or capitate inflorescences found in most Allium species [6,18]. Li et al., 2019 [17], reclassified A. cyathophorum var. farreri as a distinct species, A. farreri, based on integrated evidence from morphology, cytology, and molecular biology. Phylogeographic studies indicate that the origin of this subgenus coincided with the uplift of the Hengduan Mountains (HMDs) around 4–3 Ma, with subsequent Quaternary climatic fluctuations intensifying species divergence and shaping current distribution patterns [10,19]. Subsequent phylogenetic analyses demonstrate the following: (i) A. mairei represents the earliest diverged lineage within this subgenus; (ii) A. spicatum forms a sister clade to A. farreri; (iii) A. cyathophorum shows sister relationships with the tetraploid A. tetraploideum, which originated from hybridization between at least two extant diploids (A. farreri and A. cyathophorum) and an extinct diploid progenitor [11,16].
However, species diversity within subg. Cyathophora may exceed that reported for the five species in previous studies, and the phylogenetic relationships within this subgenus might differ from existing interpretations. These reassessments stem from our investigation of Allium siphonanthum J.M Xu in this study. Originally described in Flora Reipublicae Popularis Sinicae [20], A. siphonanthum has received minimal scientific attention since its discovery, with only the Flora of China documenting its narrow distribution in Zhongdian, Yunnan Province, China. To date, only four specimens of this species have been collected. Although Li Q.Q., 2010 [21], classified it within subg. Rhizirideum, this assignment was made without any morphological or molecular data specific to A. siphonanthum. Here, our phylogenomic analyses conclusively assign A. siphonanthum within subg. Cyathophora. Consequently, the phylogenetic placement of A. siphonanthum, interspecific relationships within this subgenus, and associated evolutionary questions require comprehensive re-evaluation.
Recent advances in sequencing technologies and bioinformatics have facilitated the widespread adoption of phylogenomic methods in species taxonomy and evolutionary biology, leveraging phylogenomic data’s rich informative characters to enhance phylogenetic resolution across diverse lineages [22,23,24,25,26,27,28]. These data and associated analytical approaches have demonstrated their usefulness not only in resolving taxonomic classifications but also in reconstructing phylogenetic relationships and elucidating evolutionary patterns within the genus Allium [11,13,14,16,25,29,30]. Here, we collected all currently recognized species within subg. Cyathophora and phylogenetically proximate species from subg. Rhizirideum, including the taxonomically contentious A. siphonanthum. Through the integration of morphological characteristics, transcriptomic profiles, and whole-genome resequencing datasets, we constructed a phylogenomic framework to achieve the following: (i) reconstruct high-resolution phylogenies for subg. Cyathophora, thereby determining A. siphonanthum’s systematic position and delineating its phylogenetic affinities; (ii) elucidate the evolutionary mechanisms driving the observed phylogenetic discordance within this subgenus.

2. Results

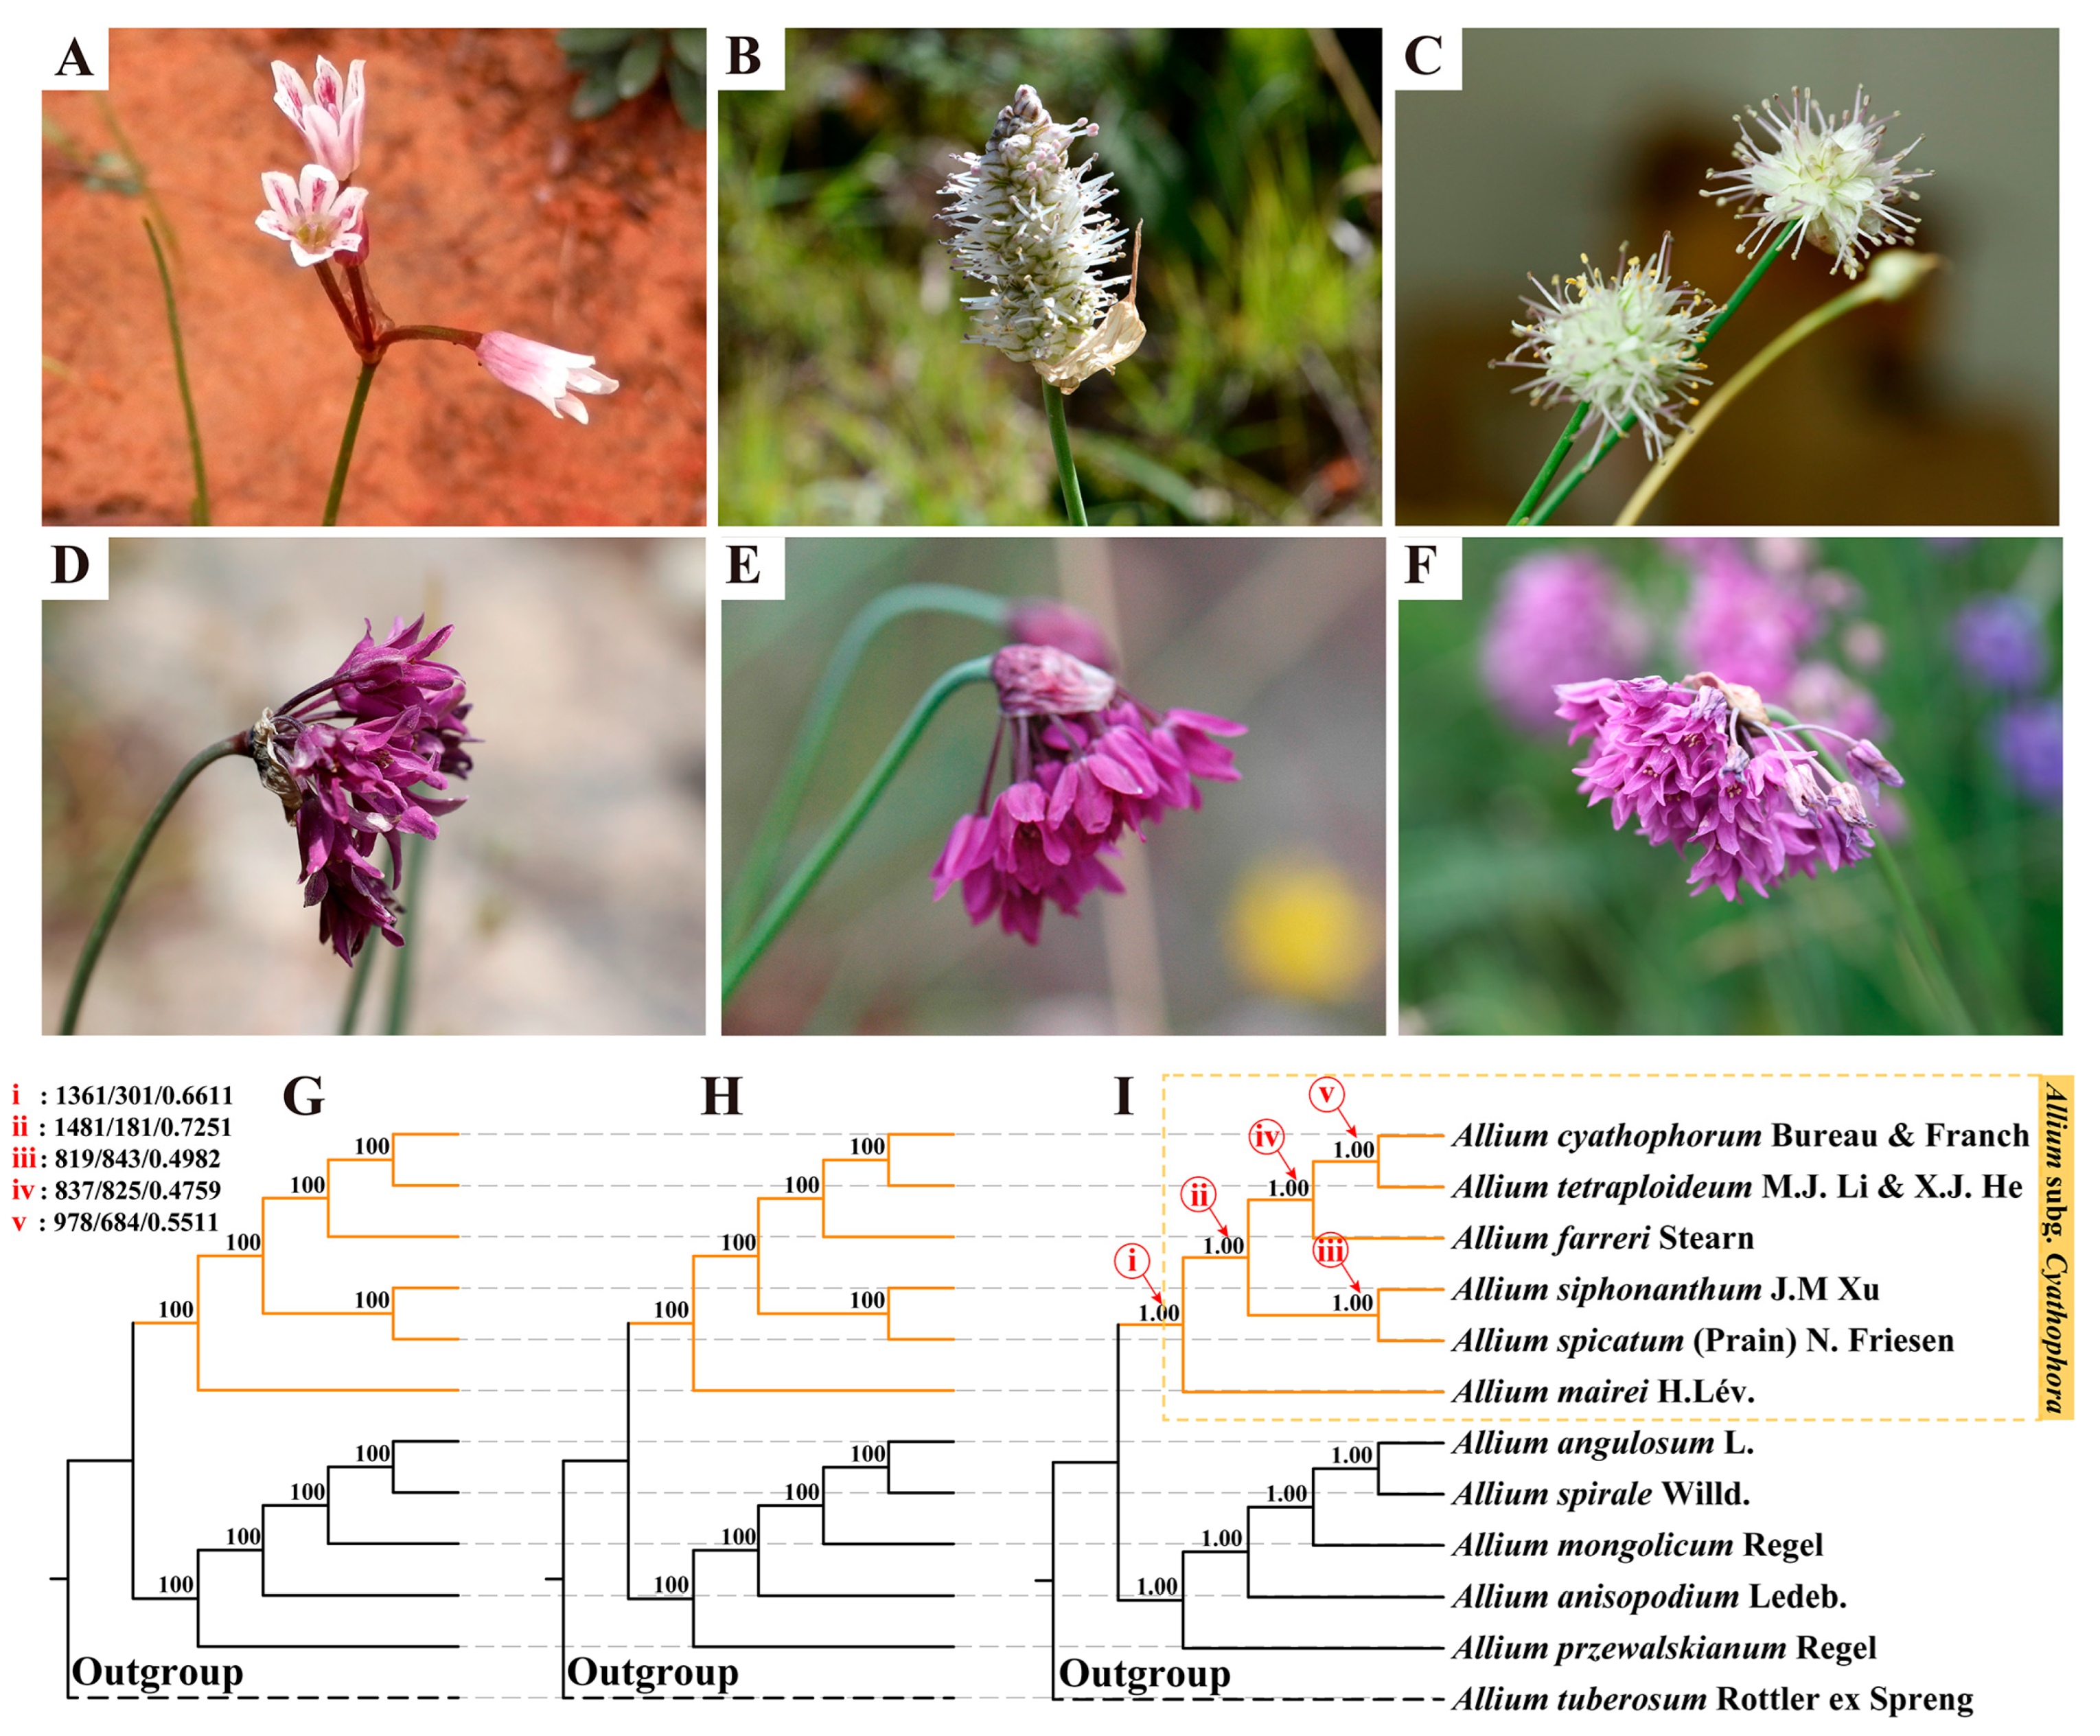
2.1. Summary of Morphological Characteristics

By comparing morphological characteristics among species within subg. Cyathophora, we identified significant differences (Table 1). Allium cyathophorum, A. tetraploideum, and A. farreri exhibit remarkably similar morphology, differing only in scape shape, perianth color, and ploidy level: A. tetraploideum has three-angled scapes (vs. two-angled in others), dark maroon perianths (vs. purple in A. cyathophorum and A. farreri), and is tetraploid (vs. diploid). A. farreri is distinguished by acuminate perianth segments and triangular basal appendages on the inner filaments. Allium siphonanthum displays diagnostic traits: subreticulate bulb tunics, globose, densely multiflowered umbel, two-valved spathes, inner filaments broadened baselly with entire or one-toothed margins, and styles exceeding the ovary. A. spicatum is unique within the subgenus due to its spike inflorescence, characterized by pedicels much shorter than perianths and dense flowers. It also possesses one-valved spathes, white to purple-red perianths (similar to A. siphonanthum), and styles longer than the ovary, but differs in bearing inner filaments that are either entire or two-toothed basally on each side. Allium mairei is diagnosed by its umbel inflorescence bearing very few flowers. Additionally, it usually has clustered bulbs, two-angled scapes, pedicels of unequal length that are 1.5–2 times longer than the perianths, a one-valved spathe, and styles that are shorter than the ovary.

2.2. Transcriptome Assembly and Phylogeny Results

De novo transcriptome assemblies were generated for all Cyathophora species and relatives in subgenus Rhizirideum, yielding assemblies with total base counts ranging from 19,713,114 to 28,906,896 bases with mean transcript lengths spanning 782–892 bp. Transcript quantification revealed interspecific variation in assembly complexity, exhibiting total counts from 28,042 (A. spicatum) to 35,307 (A. siphonanthum), while transcript N50 values, indicating scaffold continuity, ranged from 997 bp (Allium mairei H.Lév.) to 1245 bp (Allium mongolicum Regel) (Table S1).
Phylogenetic reconstruction using concatenation and coalescent approaches based on 1662 single-copy genes (SCGs) yielded congruent topologies (Figure 1), consistently resolving A. mairei as the earliest diverging lineage within subg. Cyathophora. The analyses strongly supported (UFBS/BS = 100; LPP/BS = 1.00/100) a sister relationship between A. spicatum and A. siphonanthum, with A. cyathophorum forming a clade sister to A. tetraploideum, which subsequently showed derived affinity to A. farreri. All subg. Cyathophora species formed a monophyletic clade that was reciprocally sister to subg. Rhizirideum. Internode certainty analysis (ICA) revealed discordance between the species tree and individual gene trees (Figure 1 and Figure S1). More than 50% of the 1662 gene trees supported core divergence events within Cyathophora, except for the diverged node of A. spicatum and A. siphonanthum (Figure 1, node (iii), 819 supporting trees, ICA = 0.498). Node-specific concordance varied substantially across the phylogeny, with the numbers of concordant gene trees ranging from 837 (node (iv)) to 1361 (node (i)), and ICA values ranging from 0.4759 to 0.7251.

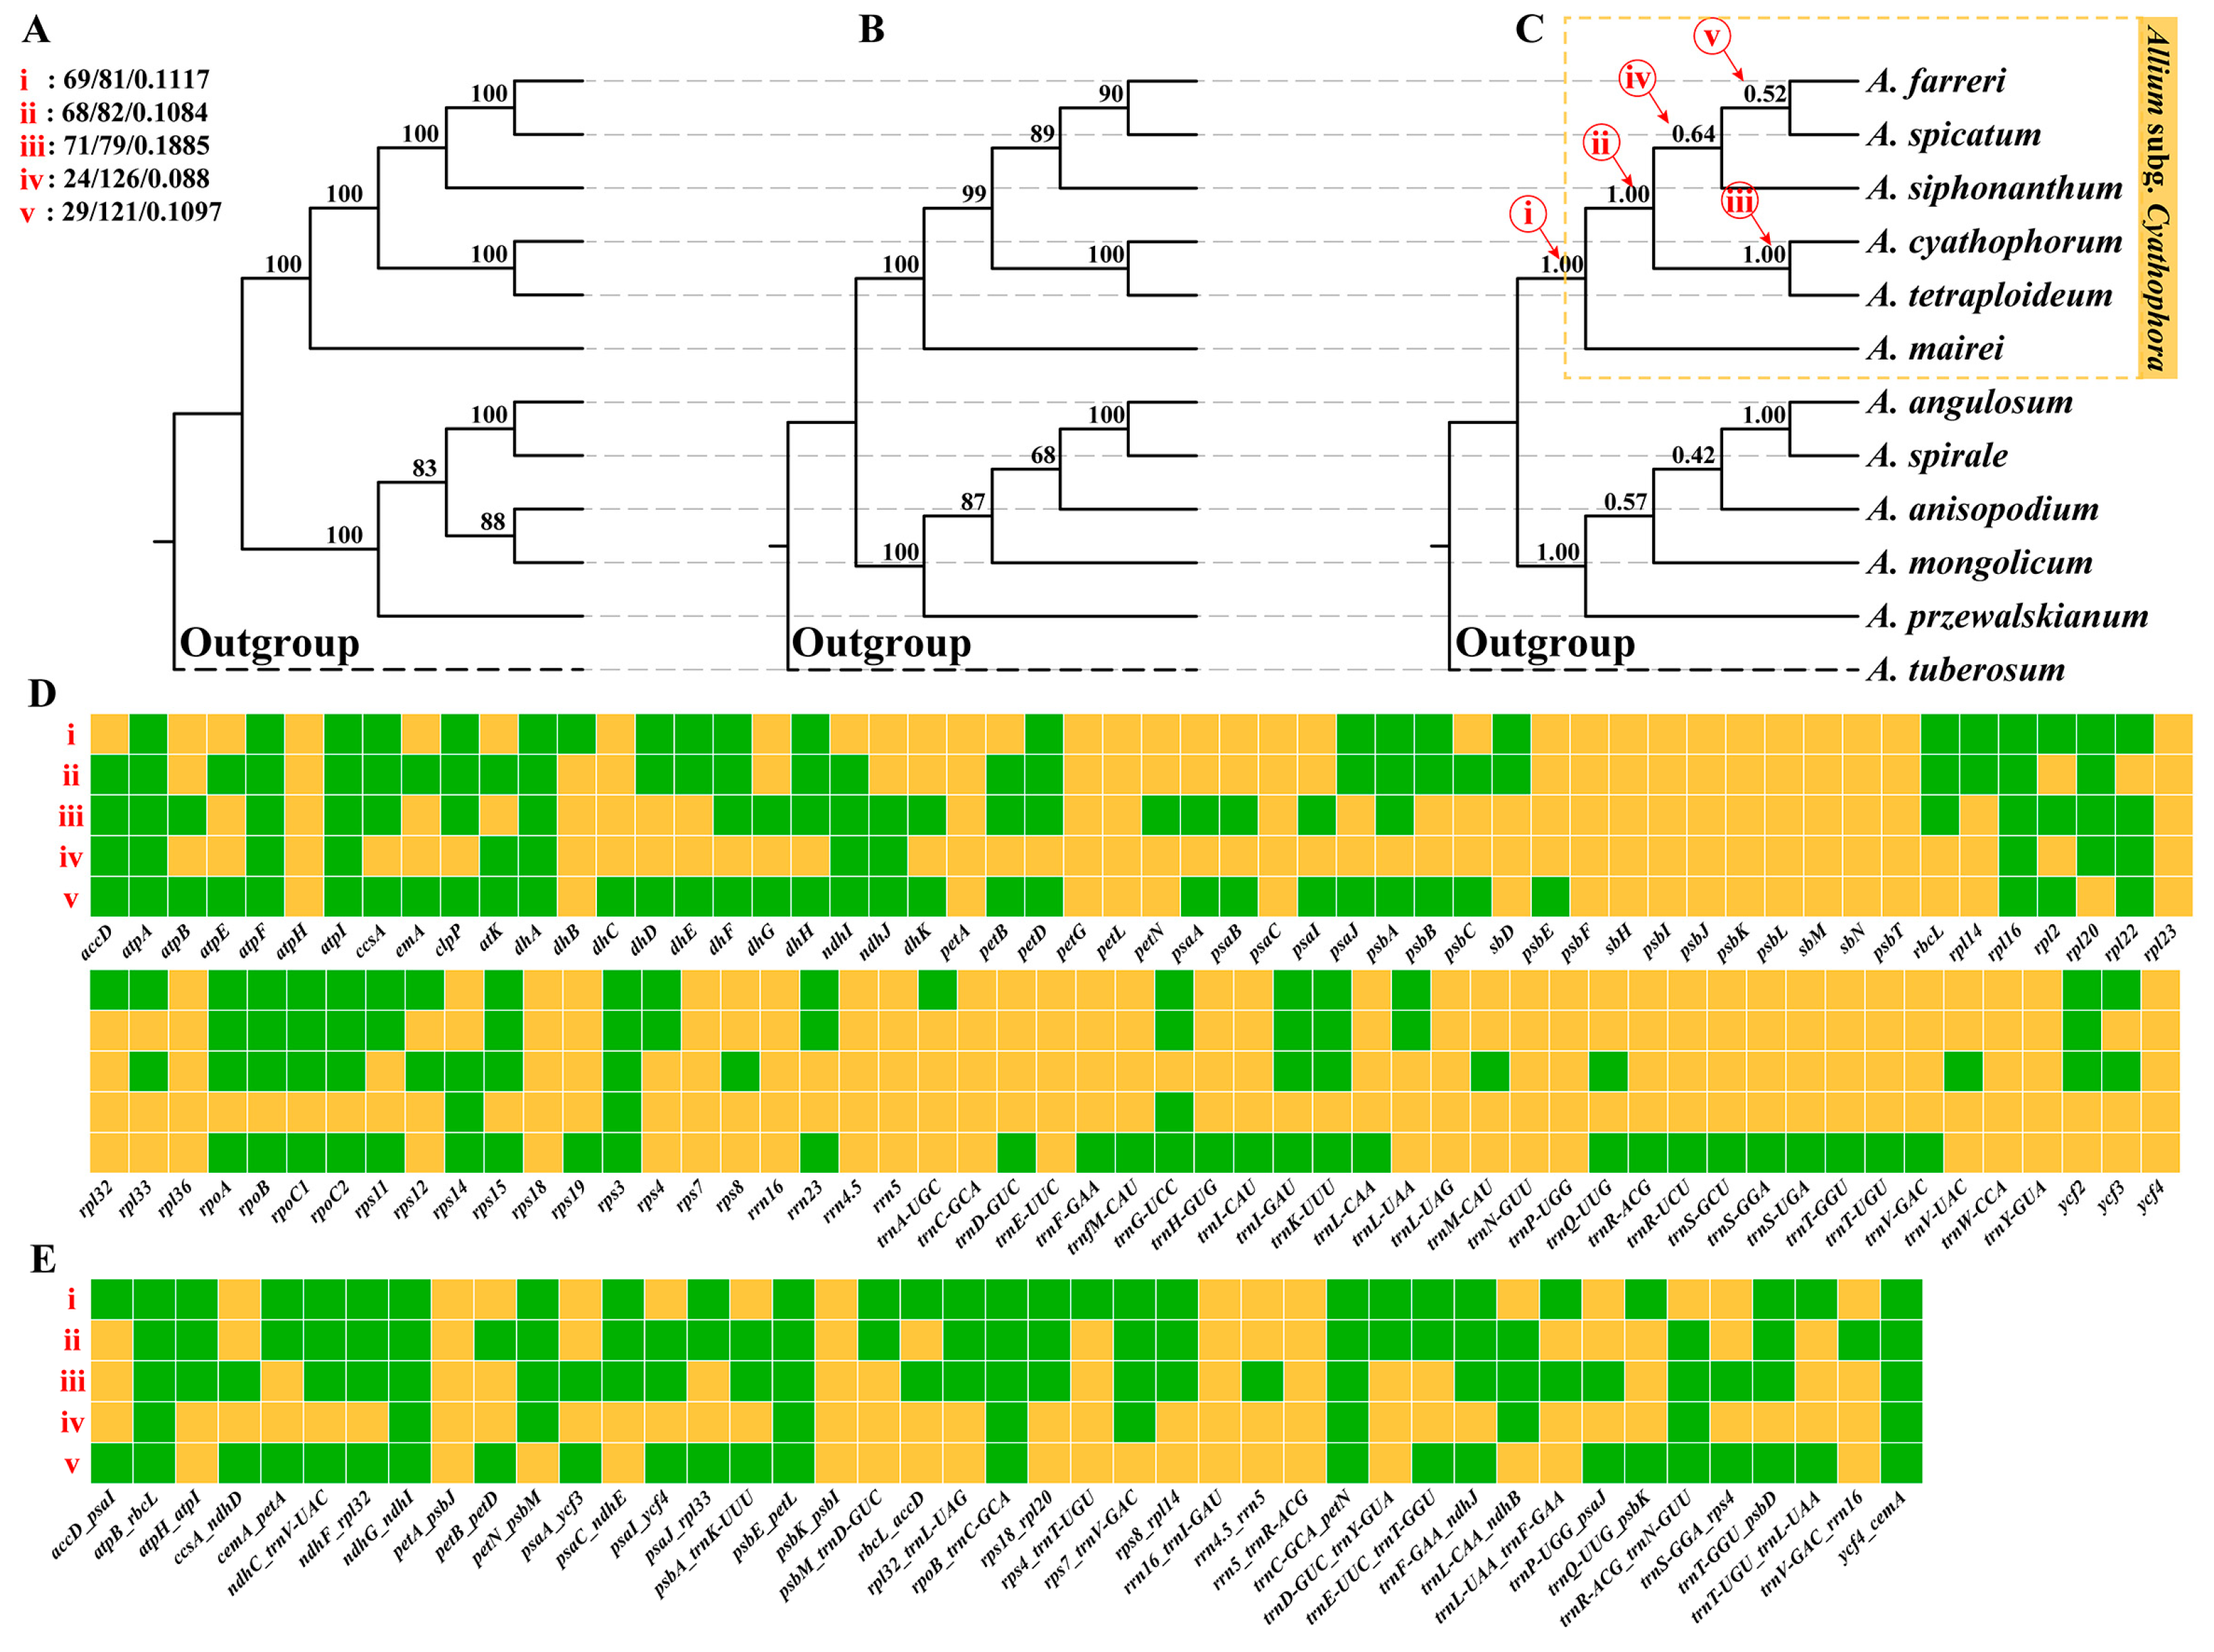
2.3. Phylogenetic Results Based on Plastome Data

The plastid genomes (plastomes) of subg. Cyathophora species exhibited a size range of 152,876 bp to 153,956 bp (Table S2). A total of 107 genes and 43 intergenic spacer regions (IGSs) were selected for phylogenetic reconstruction. The concatenated alignment of 150 loci spanned 112,586 bp, containing 3935 variable sites with 1149 parsimony-informative characters. Both the concatenation- and coalescent-based approaches produced congruent phylogenetic topologies (Figure 2 and Figure S2). However, the plastid-derived phylogeny revealed contrasting relationships with transcriptome-based inferences: (i) Allium mairei occupied the basal divergent position; (ii) Allium cyathophorum and A. tetraploideum formed a sister clade; (iii) A. farreri was sister to A. spicatum, and this clade was sister to A. siphonanthum. All the nodal relationships received strong statistical support (UFBS/BS = 100; LPP/BS > 0.9/90), except for the A. farreri + A. spicatum + A. siphonanthum clade, where the local posterior probabilities were moderate (LPP < 0.7).
Phylogenetic conflict analysis using ICA scores revealed statistically significant incongruence among plastid gene trees at key nodes within subg. Cyathophora. Of the 150 plastid loci analyzed, 69 loci supported the divergence node of A. mairei (Figure 2, node (i), ICA = 0.1117), 68 loci supported the origin of the A. cyathophorum + A. tetraploideum clade (Figure 2, node (ii), ICA = 0.1084), and 71 loci supported the divergence between A. tetraploideum and A. cyathophorum (Figure 2, node (iii), ICA = 0.1885). In contrast, the divergence nodes of the remaining species showed markedly lower support, with fewer than 30 loci supporting them and their associated ICA values ranging from 0.0880 to 0.1097 (Figure 2, nodes (iv), (v)).

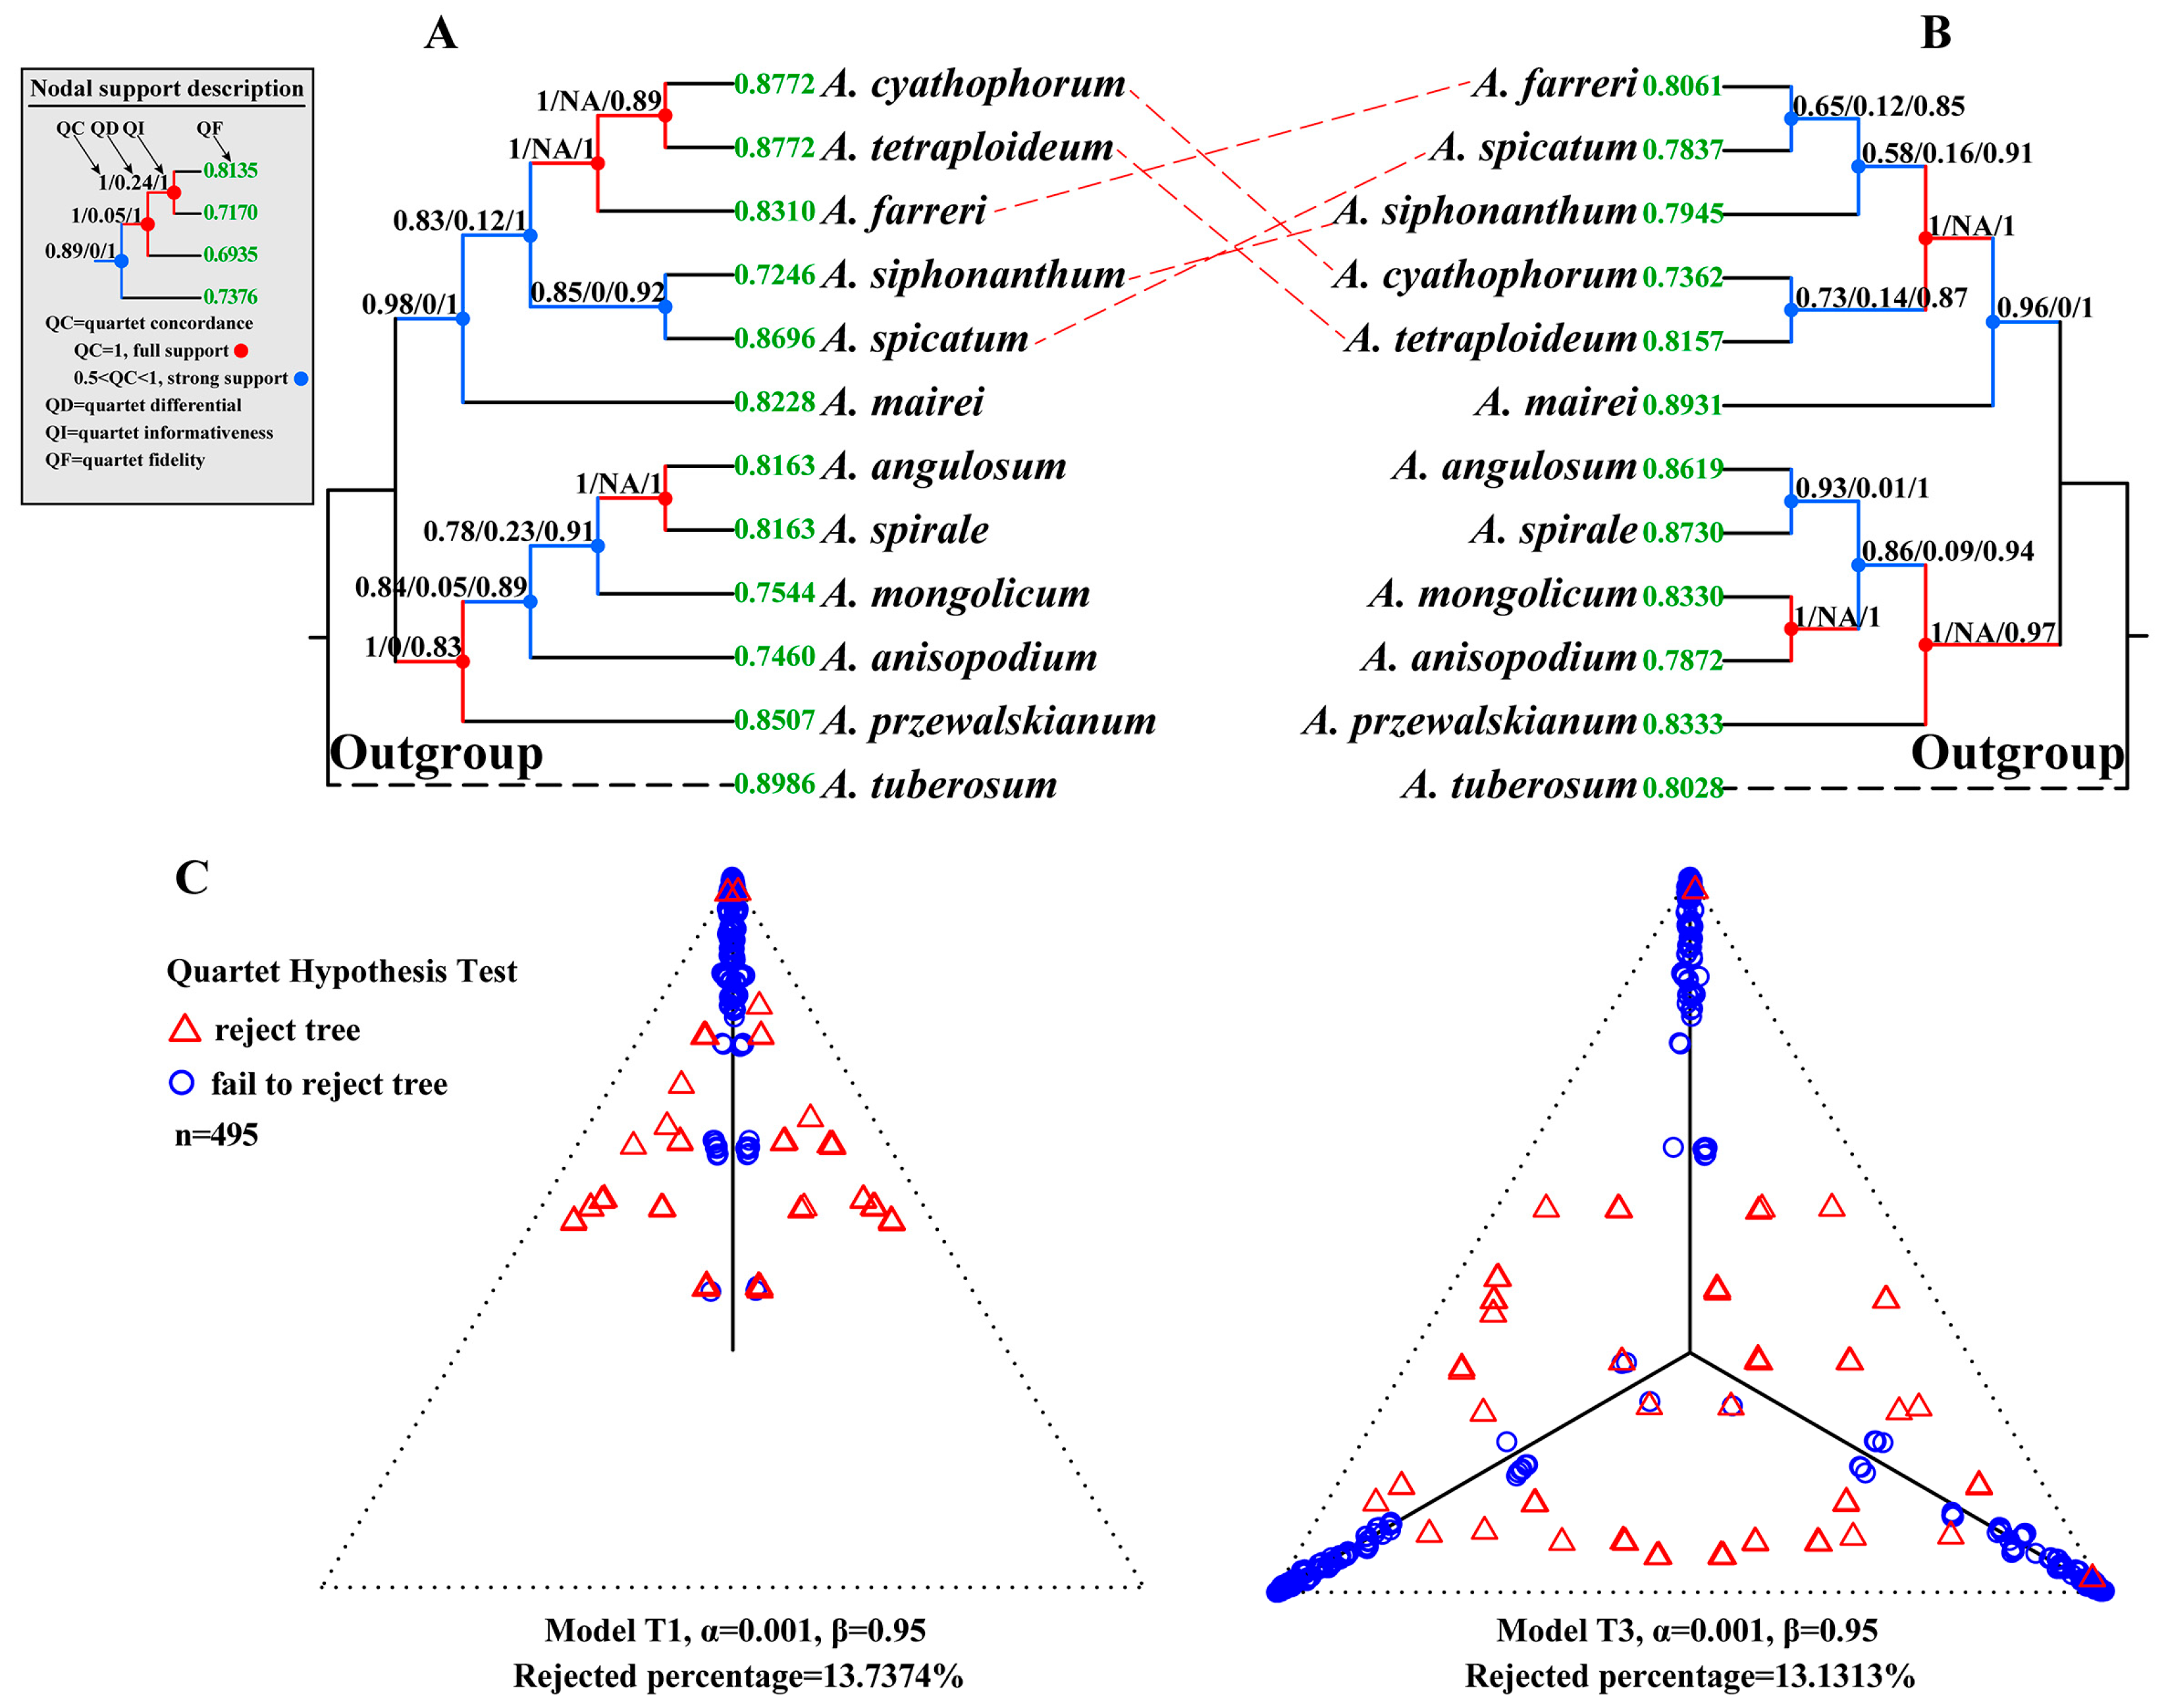
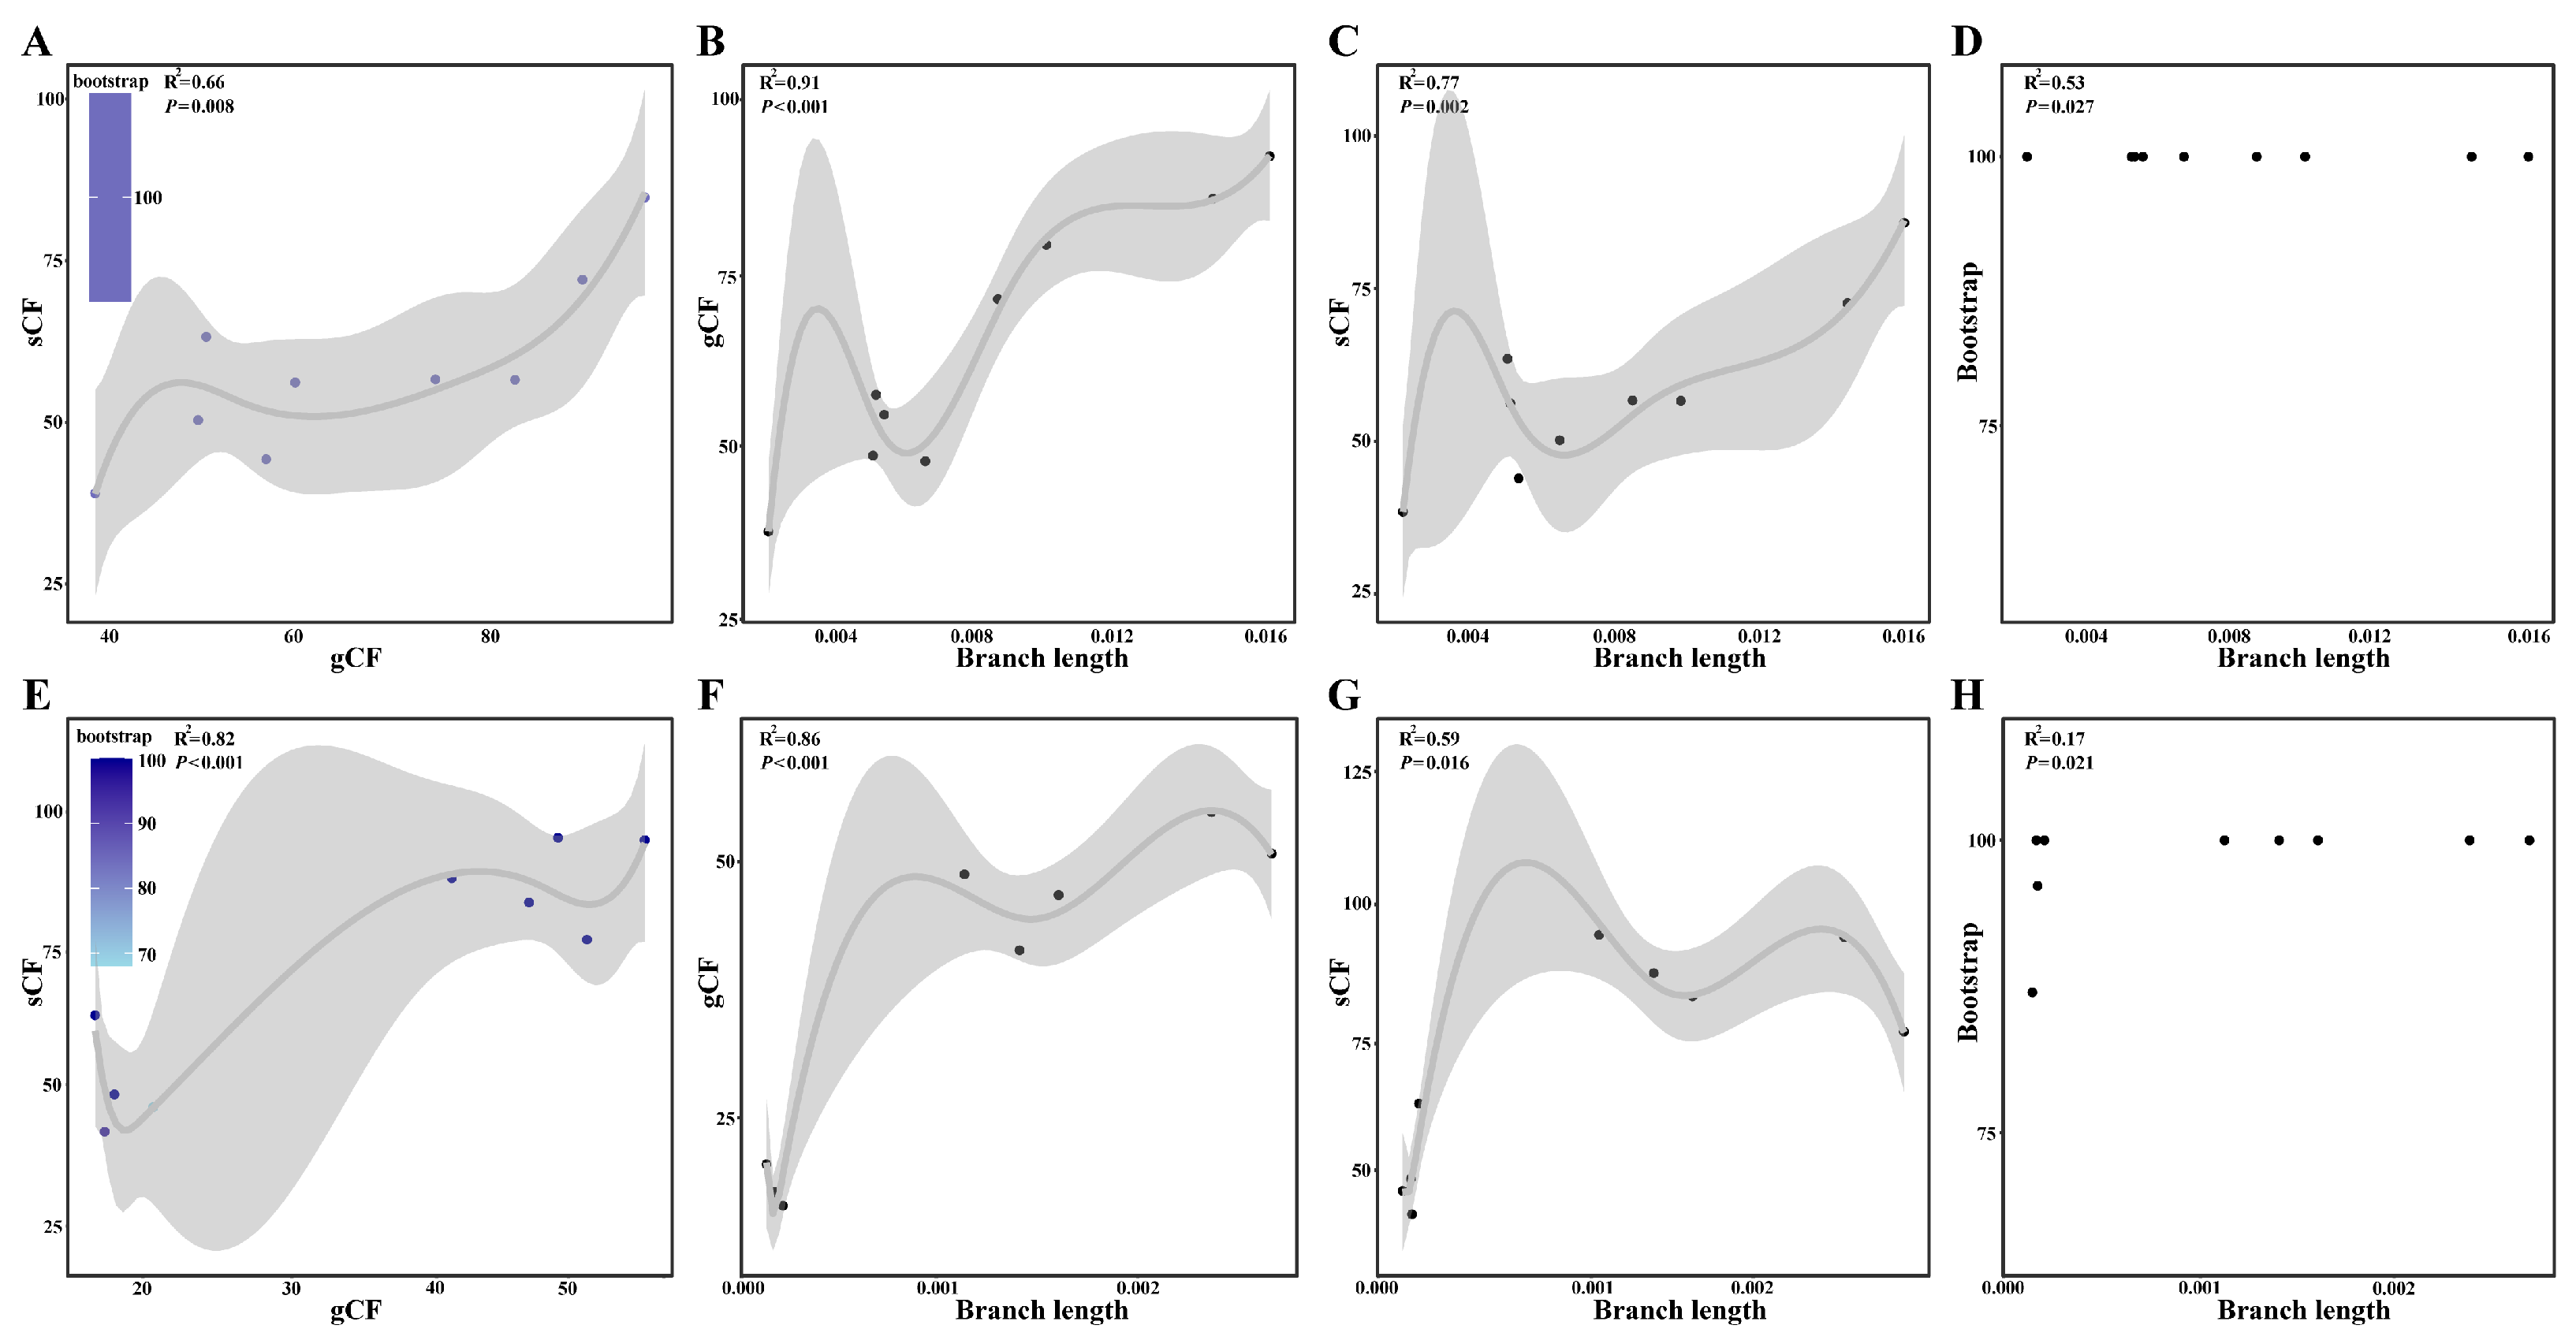
2.4. Concordance Analysis

Through the comparative analysis of the species trees reconstructed from the SCGs and plastid genomes, we detected substantial phylogenetic incongruences within subg. Cyathophora (Figure 3). The SCG-derived species tree resolved A. siphonanthum as sister to A. spicatum, with A. farreri forming a clade with A. cyathophorum and A. tetraploideum (Figure 3A). In contrast, the plastid phylogeny showed different relationships: A. siphonanthum clustered with A. farreri + A. spicatum, while A. cyathophorum appeared as sister to A. tetraploideum (Figure 3B). To further investigate the causes of gene tree discordance and cytonuclear incongruence, we conducted two additional analyses. First, we calculated two concordance metrics: the gene concordance factor (gCF) and the site concordance factor (sCF). In nuclear datasets, gCF values (ranging from 38.5% to 95.4%; mean = 65.89%) consistently exceeded sCF values (38.0–88.9%; mean = 59.24%) (Figure S3). In contrast, the plastid tree showed lower gCF values (16.7–64.7%; mean = 34.96%) but higher sCF values (42.4–95.1%; mean = 71.08%) (Figure S4). Significant correlations (p < 0.05) were observed between concordance factors (gCF and sCF) and branch length/bootstrap support (BS) across both single-copy genes (SCGs) and plastid datasets (Figure 4). Reduced gCF and sCF values consistently corresponded to shorter branches or lower BS. Notably, most nodes in both SCGs and plastid trees exhibited maximum BS (100%), with branch length positively correlating with BS (Figure 4D,H).
Quartet Sampling (QS) analysis further revealed universally high quartet concordance (QC) across all nodes, with QC values exceeding 0.50. The mean QC values reached 0.92 (SCGs-based tree) and 0.85 (plastid tree), respectively. Notably, four nodes in the SCGs-based tree and three nodes in the plastid tree demonstrated maximum QC support (QC = 1.0) (Figure 3A,B). Most nodes exhibited a characteristic pattern of high QC (1.0), low/absent quartet discordance (QD: 0-NA), and complete quartet informativeness (QI: 1.0). This signature pattern (QC/QD/QI = 1/0/1 or 1/NA/1) indicates strong support for the inferred topology at these nodes based on Quartet Sampling. Both trees showed consistently high quartet fidelity (QF >0.70), ranging from 0.7246 to 0.8986 in the SCGs-based tree and 0.7362 to 0.8931 in plastid tree. These findings collectively indicate strong topological consistency across the quartets, with no evidence of problematic taxa.

2.5. Detection of ILS

Phylogenetic analyses using MSCquartets evaluated incomplete lineage sorting (ILS) intensity within subg. Cyathophora by applying the T1 and T3 models to the 1662 single-copy gene (SCG) trees. The analysis identified 495 exhaustive quartets across the taxa. Under increasing rejection thresholds (0.01 to 1 × 10⁻⁶), the proportion of rejected trees decreased from 18.58% to 9.29% (T1 model) and 17.57% to 8.28% (T3 model) (Figure 3C and Figure S5). Simplex plots revealed the dense clustering of qcCF markers along the T1/T3 model trajectories, with blue markers concentrated near the vertices. These patterns strongly support ILS as the dominant driver of topological discordance, while the residual discordance (QC/QD/QI = 1/0/1) likely reflects secondary processes like hybridization.
Phytop analyses revealed pronounced incomplete lineage sorting signatures (ILS-i; 8.9–34.4%) across subg. Cyathophora lineages, with peak ILS-i values (34.4%) at the A. farreri and A. tetraploideumA. cyathophorum divergence nodes (Figure 5A,B, node (iv)). Conversely, four nodes ((i), (ii), (iv), (v)) exhibited substantial introgression probability (IH-i: 2.3–42.6%), with the highest IH-i probability at the A. spicatumA. siphonanthum divergence node (42.6%; Figure 5A,B, node (ii)).

2.6. Reticulation Identification

To evaluate reticulate evolution contributions to phylogenetic discordance in subg. Cyathophora, we reconstructed phylogenetic networks using the NANUQ methodology. SNaQ analyses showed decreasing log-pseudolikelihood values with increasing hybridization parameters (h = 0–5), and the optimal network was found at h = 2 (Table S3). This optimal network indicates two hybridization events within Cyathophora lineages (Figure 5C): (i) A. tetraploideum originates from A. farreri (36.87%) and A. cyathophorum (63.13%); (ii) A. siphonanthum exhibits near-equal genomic contributions to A. spicatum (51.86%) and A. farreri (48.14%). The NANUQ network reconstruction confirmed discernible reticulation nodes connecting four core taxa (Figure 5D), demonstrating the critical role of hybridization in shaping the subgenus’ evolutionary history.

3. Discussion

3.1. Phylogenomic Data Revealed New Species Relationships in Subg. Cyathophora

Phylogenomic data are widely used for phylogenetic analyses and have proven highly efficient for resolving evolutionary relationships in genus Allium [11,13,14,16,29,30]. Our results confirm the monophyly of subg. Cyathophora [10,11,16,31], and identify A. siphonanthum as a new member with novel species relationships. However, significant phylogenetic discordance emerged between the single-copy genes (SCGs) and plastid data. Multiple studies have indicated that factors such as incomplete lineage sorting (ILS), gene introgression, or horizontal gene transfer can sometimes obscure rather than clarify species relationships [27,32,33,34]. For instance, Ma et al., 2024 [33], analyzed Quercus species relationships using both plastid and transcriptome data. The plastid-based tree showed highly confused interspecific relationships, whereas transcriptome data clearly distinguished all species. Moreover, our coalescent-based analyses of transcriptomic analyses yielded significantly stronger nodal support than the plastid phylogenies. Therefore, we propose that nuclear-derived phylogenies are more reliable than those derived from plastid data.
Building upon prior molecular studies [10,11,16], our analyses confirm A. mairei as the earliest diverging lineage in this subgenus (UFBS/BS = 100; LPP/BS = 1.00/100). This placement is further corroborated by its diagnostic inflorescence: unequal pedicels bearing few flowers with patent trumpet-shaped corollas, contrasting with the uniform pedicels and densely flowered umbels of other Cyathophora species (Figure 1, Table 1) [10]. Furthermore, we discovered that A. siphonanthum, which has long been neglected and whose systematic position remained unknown, was shown to be a member of the subg. Cyathophora and exhibits a sister species relationship with A. spicatum. Morphologically, these two species show a high degree of morphological congruence, notably characterized by their strongly abbreviated pedicels, white to purple-red perianth segments, and both their stamens and styles exceeding the perianth (Figure 1, Table 1). Field investigations further indicate their shared ecological affinity for arid hillslopes, where they develop extensive root systems to withstand seasonal drought stress. It has also been suggested that the conspicuously elongated spicate inflorescence of A. spicatum compared to the umbel in its congeners represents an alternative strategy to adapt to the extreme alpine habitat, accompanied by consequential changes in seed size, flowering phase, and ovary size [10,17]. Allium cyathophorum forms a sister relationship with A. tetraploideum, and these two species cluster with A. farreri. All three taxa exhibit purple to dark maroon perianth segments, though conspicuous differences exist in basal perianth morphology, inner filament characteristics, and micro-morphological features (including anticlinal wall patterns, pollen morphology, and stomatal apparatus) [17]. The most pronounced distinction lies in their karyotypes: both A. cyathophorum and A. farreri are diploid (2n = 16), whereas A. tetraploideum is tetraploid (2n = 32). Li et al., 2021 [11], demonstrated that A. tetraploideum originated from hybridization between the two diploids A. farreri and A. cyathophorum or their close relatives, potentially involving an extinct diploid progenitor. Thus, our integrated morphological and molecular analyses establish A. siphonanthum as a new member of the subg. Cyathophora and resolve novel phylogenetic relationships within this subgenus.

3.2. Underlying Causes for Phylogenetic Discordances in Subg. Cyathophora

Substantial phylogenomic evidence indicates that phylogenetic discordance primarily stems from incomplete lineage sorting (ILS) and reticulate processes like introgression or hybridization [27,35,36,37]. In subg. Cyathophora, we detected pronounced incongruence not only among individual gene trees but also between SCGs- and plastid-derived species trees (Figure 1, Figure 2 and Figure 3). Integrative analyses demonstrate that ILS is a primary driver of discordance, supported by two lines of evidence: First, there are significant positive correlations (p < 0.001) between branch lengths and concordance factors (gCF and sCF) (Figure 4), consistent with established ILS-associated branch length variations and phylogenetic discordance [27,36,38,39]. Second, systematic quantification reveals substantial ILS signals (ILS-i ranging from 8.9% to 34.4%, Figure 5), with qcCFs statistics confirming ILS as the predominant source of topological conflicts (Figure 3 and Figure S5). Notably, maximal bootstrap support (BS = 100) at short branch nodes (Figure 4D,H) represents a characteristic signature of ILS-mediated discordance documented across diverse taxa [27,28,38,40]. Meanwhile, ILS has been recognized as a major factor influencing species relationships and evolution [27,33,34]. Here, ILS not only contributes significantly to the phylogenetic discordance within this subgenus but may also drive species adaptation to diverse environments via the maintenance of adaptive loci. For instance, A. spicatum has evolved a unique spicate inflorescence, enhancing its adaptation to the arid western QTP, while A. cyathophorum, A. farreri, and A. tetraploideum have developed purple flowers that attract more insect pollinators, increasing fruit set rates. However, further investigation using expanded samples across broader geographical ranges is needed to understand how the maintenance of adaptive loci enhances environment adaption.
Complementary to ILS-mediated discordance, our analyses revealed definitive reticulate evolution signals in subg. Cyathophora contributing to phylogenetic incongruences, a phenomenon widely documented across eukaryotes [35,41,42]. Alongside marked phylogenetic discordance within subg. Cyathophora, we identified quantifiable hybridization/introgression signals (IH-i values spanning 2.3–42.6% across four specific nodes; Figure 5B). These findings demonstrate a causal relationship between reticulate evolutionary processes and the observed phylogenetic incongruence. Quartet Sampling analysis further revealed robust evidence of ancient hybridization in subg. Cyathophora, with key nodes showing maximal nodal support (UFBS/BS = 100, LPP = 1.0) and high QC values (>0.8) (Figure 1, Figure 2 and Figure 3), yet paradoxically low quartet differential values (QD <0.25/NA), a pattern consistent with deep reticulation events [43].
Furthermore, SNaQ analysis identified two hybridization events (Figure 5C): (i) A. tetraploideum originated from hybridization between A. cyathophorum and A. farreri; (ii) the newly described A. siphonanthum derived from hybridization between A. spicatum and A. farreri. These findings align with Li et al., 2019 [17], who proposed A. tetraploideum’s hybrid origin involving A. farreri, A. cyathophorum, and potentially an extinct diploid progenitor. Morphological and cytological evidence [10,11,17] also provide robust support for interspecific hybridization. Furthermore, we identified novel hybridization events within subg. Cyathophora, including the new member A. siphonanthum originating from hybridization between A. spicatum and A. farreri. This hybrid origin was also supported by the discordant phylogenetic results, where A. siphonanthum is sister to A. spicatum in the SCGs-based tree, whereas it clusters with the lineage of A. spicatum + A. farreri in the plastid tree (Figure 3). These hybridization events were also corroborated by the NANUQ network topology. Numerous studies have suggested that recurrent hybridization events drive reticulate evolution [44,45]. Although such processes can confound phylogenetic interpretations, as evidenced by the significant phylogenetic discordance and reticulate evolution, they simultaneously confer evolutionary advantages through adaptive introgression, enhancing both species diversity and environmental adaptability [46,47]. The species of subg. Cyathophora predominantly inhabit the QTP and HDMs, biodiversity hotspots shaped by intricate topography and dynamic climatic conditions [48,49,50,51,52]. Previous studies have documented pervasive adaptive introgression during the speciation processes of taxa within this region [42,44,53,54,55]. In Allium, many polyploids have been reported in this region, such as A. wallichii, A. przewalskianum, and A. sikkimense, which are correlated with the area’s geographical orogenies and climatic fluctuations [10,11,13,29,56,57]. In addition, Allium species possess adaptive traits, including a herbaceous habit (enabling rapid generations), perennial growth (extending lifespan), clonal reproduction (via bulb/rhizome), and stress tolerance, which may facilitate hybridization and environmental adaptation [58,59]. Our phylogeographic analyses indicate that initial subgenus divergence coincided with the HDMs’ orogenic uplift (4–3 million years ago, Ma), with subsequent Pleistocene climatic fluctuations amplifying species divergence and niche differentiation [10]. This evidence collectively indicates that hybridization in subg. Cyathophora is evolutionarily linked to the regional orogeny and paleoclimate, representing a key adaptive strategy that facilitates species divergence and environmental adaptation within the harsh ecosystems of the QTP and HDMs. In summary, the significant phylogenetic discordance in subg. Cyathophora results from incomplete lineage sorting (ILS) and reticulate evolution, potentially driven by past orogenic events and climatic fluctuations within the QTP and HDMs.

4. Materials and Methods

4.1. Sampling, Morphological Observation, and Transcriptome Sequencing

Over the last decade, we carried out extensive field surveys across the QTP and HDMs and collected numerous samples of subg. Cyathophora and relatives. The morphological characteristics of all species within this subgenus were documented through literature surveys and field observations. Fresh leaves of each species in full bloom were gathered, and the detailed collection protocol comprised the following steps: preparing sterilized tools (tweezers, foil, marker); selecting healthy, pest/disease-free leaves; briefly rinsing samples with sterile water followed by drying with absorbent paper; securely wrapping samples in foil with white cloth tape; labeling with marker; and immediately transferring specimens to liquid nitrogen. The samples were then transported into an −80 °C freezer until they underwent RNA isolation and sequencing processing. The morphologies of the species in subg. Cyathophora were also photographed in the field. We also downloaded the transcriptome data of subg. Rhizirideum species from public databases (National Center for Biotechnology Information/NCBI and National Genomics Data Center/NGDC), including Allium angulosum L., Allium spirale Willd., Allium mongolicum Regel, Allium anisopodium Ledeb., Allium przewalskianum Regel, and Allium tuberosum Rottler ex Spreng. A total of 12 species were collected, and the detailed sample information is listed in Table S4. All collected specimens were identified by Allium taxonomy experts Xing-Jin He, Min-Jie Li, and Deng-Feng Xie to ensure accurate species identification.
Transcriptomic sequencing began with RNA isolation using the RNAprep Pure Plant Kit (Tiangen Biotech, Beijing, China). RNA quality was verified using NanoPhotometer spectrophotometry (IMPLEN, Munich, Germany) and an Agilent 2100 Bioanalyzer (Santa Clara, CA, USA) assessment. Sequencing libraries were then constructed with the NEB Next Ultra™ RNA Library Prep Kit (Illumina) (Ipswich, MA, USA), and sequenced for 150 bp paired-end reads on an Illumina NovaSeq 6000 platform. Raw reads were processed using fastP [60] and Trimmomatic v0.36 [61] to remove adapters and low-quality sequences, generating cleaned reads for transcriptome assembly. All raw data were deposited in the Genome Sequence Archive (GSA: NGDC) under accession codes detailed in Table S4.

4.2. Transcriptome Assembly and Low-Copy Gene Identification

Paired-end clean reads from each transcriptome were assembled de novo using Trinity v.2.1.5 [62] with default parameters. TransDecoder v.5.0.2 (http://transdecoder.sourceforge.net/) (accessed on 16 March 2025) was utilized to predict the longest putative CDS and protein sequences within open reading frames (ORFs). CD-HIT v4.6.1 [63] was employed to generate non-redundant CDS and protein sequences, applying a threshold of 0.95 for sequence identity. To identify single-copy genes (SCGs), we conducted orthogroup inference with OrthoFinder v2.5.2 [64] to identify single-copy genes (SCGs). Each SCG was aligned with PRANK [65], using the ‘-codon’ parameter to guide the alignment. Finally, sequences shorter than 300 bp or containing more than 50% gaps were removed, resulting in a final set of 1662 SCGs for the subsequent analyses.

4.3. Phylogenetic Reconstruction and ICA Score Calculation

Phylogenetic reconstruction was conducted using concatenation- and coalescent-based approaches on the curated dataset of 1662 single-copy core genes (SCGs). Initial sequence processing involved alignment with MAFFT v7.505 [66] using default parameters, followed by the refinement of ambiguous regions through TrimAl v1.2 [67] with a 0.8 gap threshold (−gt). For concatenation analysis, a supermatrix was constructed and analyzed under the maximum likelihood (ML) framework in IQ-TREE v1.6.8 [68]. ModelFinder [69] determined the optimal codon-specific partitioning schemes and substitution models; nodal support was evaluated with 1000 ultra-fast bootstrap (UFBS) replicates (−bb 1000). Concurrently, coalescent-based species tree estimation was employed using ASTRAL-III v5.6.3 [70] and two complementary strategies: (i) the comprehensive integration of gene trees with local posterior probabilities (LPPs) for nodal confidence under ‘−t 3’ configuration [71]; (ii) species tree reconstruction using optimized ML gene trees with multilocus branch support derived from 1000 bootstrap replicates (−i −b −r parameters). All gene trees were independently generated in IQ-TREE using ModelFinder-optimized substitution models, with each SCG’s phylogenetic uncertainty quantified through 1000 rapid bootstrap replicates of unpartitioned alignments.
Phylogenetic concordance analysis was conducted using phyparts v0.01 [72,73] through systematically comparing gene tree and species tree topologies. The Internode Certainty All (ICA) values were calculated to evaluate nodal support or conflict for each lineage. These ICA values were interpreted as follows: values approaching 1 indicated strong internodal consensus; values near 0 suggested equal support for one or more conflicting bipartitions; and negative values signified dominant conflicting bipartition frequencies [72].

4.4. Whole-Genome Resequencing, Plastome Assembly, and Phylogenetic Analyses

To perform phylogenetic analyses based on plastome data, genomic DNA was extracted from fresh or silica-gel-dried materials using the CTAB method [74], followed by whole-genome resequencing on the Illumina HiSeq 6000 platform (Novogene, Beijing, China). Post-sequencing quality assessment yielded clean data for plastome assembly through GetOrganelle v1.7.7.1 [75], with subsequent annotation implemented in GeSeq (https://chlorobox.mpimp-golm.mpg.de/geseq.html) (accessed on 12 March 2025). The annotated plastid genomes underwent rigorous manual verification and refinement using Geneious v11.0.5 (https://www.geneious.com/), ensuring annotation accuracy across all samples. All 12 plastomes used in this study are listed in Table S2.
We further extracted the 107 genes and 43 intergenic spacers (IGSs) from the plastomes for phylogenetic analyses. Sequence processing comprised alignment with MAFFT v7.505 [66] under default parameters, supplemented by precision trimming of ambiguous regions through TrimAl v1.2 [67] with optimized parameters (−gt 0.8). Two complementary phylogenetic approaches were employed: (i) concatenation-based maximum likelihood analysis executed in IQ-TREE v1.6.8 [68] with 1000 ultra-fast bootstrap (UFBS) replicates; (ii) coalescent-based species tree estimation conducted in ASTRAL-III v5.6.3 [70] incorporating bootstrap (BS) support and local posterior probabilities (LPPs). Nodal robustness assessment included Internode Certainty All (ICA) quantification [72,73] applied to key phylogenetic nodes. Methodological consistency with the transcriptomic analysis protocols (Section 4.3) was maintained, and cross-dataset parameter standardization ensured comparative analytical validity.

4.5. Phylogenetic Discordance Analysis

We further evaluated the phylogenetic discordance among gene trees as well as between nuclear and plastid species trees using two methods: (i) Concordance factor analysis using IQ-TREE v2.1.3 [68] to calculate gene (gCF) and site (sCF) concordance factors, quantifying, respectively, the proportion of supporting gene trees (gCF) and aligned sites (sCF) per branch (methodology details: http://iqtree.org) (accessed on 21 March 2025) [76]. An R script (https://robertlanfear.com/blog/files/concordance_factors.html) (accessed on 21 March 2025) visualized gCF-sCF correlations with bootstrap support and branch lengths. (ii) The Quartet Sampling method [77] was implemented via the quartet_sampling.py script (https://github.com/fephyfofum/quartetsampling) (accessed on 21 March 2025) with 1000 bootstrap replicates. This approach generated three core nodal metrics: (i) quartet concordance (QC), quantifying topological congruence between the sampled quartets and candidate species tree; (ii) quartet differential (QD), measuring phylogenetic conflict asymmetry, where skewed distributions may indicate introgression events; (iii) quartet informativeness (QI), evaluating phylogenetic signal strength through likelihood-based comparisons of alternative topologies. To assess terminal node reliability, quartet fidelity (QF) values were calculated to detect unstable “rogue” taxa.

4.6. Estimation of Incomplete Lineage Sorting

To assess whether phylogenetic discordance between nuclear–plastid phylogenies and among individual gene trees could be attributed to incomplete lineage sorting (ILS), we implemented a quartet-based gene tree summarization framework. This methodology calculated quartet count concordance factors (qcCFs) and derived corresponding p-values to statistically evaluate the congruence between the gene trees and species tree topologies [78]. Specifically, the quartetTreeTestInd function from the R package MSCquartets v1.0 [79] was applied to analyze all 1662 SCG trees. The resultant qcCFs were visualized through tetrahedral simplex plots within two distinct phylogenetic models: T1 (incorporating the species tree reconstructed by ASTRAL-III) and T3 (without species tree assumptions). In these visualizations, color-coded symbols (red = rejection, blue = non-rejection at α thresholds: 0.01, 0.001, 1 × 10⁻⁴, 1 × 10⁻⁶) represented individual quartet vectors, where centroid-proximal distributions supported ILS dominance, while vertex-adjacent clustering suggested alternative evolutionary processes such as introgression.
To comprehensively characterize incomplete lineage sorting (ILS) and introgression/hybridization (IH) signals across lineages, we implemented the phylogenomic analysis pipeline in Phytop v1.0 [80], which quantitatively assesses ILS/IH magnitudes and visualizes spatial patterns based on ASTRAL-generated gene trees. A curated dataset was prepared by extracting SCGs for 12 representative taxa from the original 1662 SCG collection. Each gene tree was reconstructed using IQ-TREE v1.6.8 under optimal substitution models as detailed in Section 4.3. The species tree topology was subsequently inferred through ASTRAL-III v5.6.3 with the branch annotation parameter (−t 2). This consensus species tree served as the scaffold for Phytop’s comparative analysis, enabling the systematic quantification and heatmap visualization of lineage-specific ILS/IH values through its integrated topological permutation algorithms.

4.7. Reticulate Evolution Detection

To systematically evaluate the contribution of reticulate evolution (hybridization/introgression) to observed phylogenetic discordance, we implemented a dual analytical framework combining phylogenetic network reconstruction and quartet-based distance methods. First, maximum pseudolikelihood network inference was performed using PhyloNet v3.8.0 [81] through its SNaQ algorithm [82]. This analysis utilized 1662 SCG trees to test evolutionary models permitting 0–5 reticulation events (h). We conducted 100 independent optimizations per h-value to identify maximum likelihood network configurations, and final topologies were visualized in Dendroscope v3.8.2 [83]. To address uncertainties in pseudolikelihood model selection, we complemented this approach with the NeighborNet Using Quartet distance (NANUQ) method [84]. Empirical quartet counts from SCG trees were processed through MSCquartets’ NANUQ function under the T3 model (α = 0.01) to calculate taxon-pair network distances. These distances were subsequently transformed into a consensus split graph using SplitsTree4 v4.15.1′s NeighborNet algorithm [85], enabling the simultaneous visualization of conflicting phylogenetic signals through the multidimensional scaling of quartet discordance patterns.

5. Conclusions

In this study, we generated transcriptomic and plastid datasets for subg. Cyathophora species and relatives. From these, 1662 single-copy nuclear genes (SCGs) and 150 plastid loci were extracted for phylogenetic reconstruction using both concatenation- and coalescent-based methods, with their integrated morphological characteristics used to assess interspecific relationships. Our analyses definitively resolve Allium siphonanthum, a taxon with historically uncertain placement, within subg. Cyathophora. While novel species relationships were resolved, significant phylogenetic discordance was detected. Multiple pieces of evidence indicate that this discordance stems from incomplete lineage sorting (ILS) and/or hybridization, processes likely facilitated by intense orogeny and paleoclimatic fluctuations across the HDMs and QTP. These findings substantially advance our understanding of diversification mechanisms in this subgenus.

Supplementary Materials

The following supporting information can be downloaded at: https://www.mdpi.com/article/10.3390/plants14132083/s1, Figure S1: The concordance and conflict statistics for the 1662 SCG trees. The numbers above and below the branches indicate the counts of gene trees concordant with and in conflict with the species tree, respectively. The pie charts at the main clades show the proportion of genes in concordance (blue) and conflict (green = a single dominant alternative; red = all other conflicting trees); Figure S2: The concordance and conflict statistics for the 150 plastid loci trees. The numbers above and below the branches indicate the counts of gene trees concordant with and in conflict with the species tree, respectively. The pie charts at the main clades show the proportion of genes in concordance (blue) and conflict (green = a single dominant alternative; red = all other conflicting trees); Figure S3: The bootstrap value (BS), gene concordance factor (gCF), and site concordance factor (sCF) for each node across the species tree based on the 1662 SCGs trees. The numbers above the branches represent the values of BS/gCF/sCF; Figure S4: The bootstrap value (BS), gene concordance factor (gCF), and site concordance factor (sCF) for each node across the species tree based on the 150 plastid loci trees. The numbers above the branches represent the values of BS/gCF/sCF; Figure S5: Simplex plots of qcCFs under the MSC model of ILS with the T1 and T3 models based on the 1662 LCGs trees. These analyses were performed under different rejection levels (from 0.01 to 1 × 10⁻⁶). The red triangles in the plot indicate the rejection of the MSC on the species tree, while the blue circles indicate probable ILS; Table S1: The ten transcriptomes’ assembly statistics; Table S2: The 12 chloroplast genomes’ information collected in this study; Table S3: The network scores (−ploglik) estimated in the SNaQ analysis. The optimal network in each analysis is indicated in bold; Table S4: All transcriptomes, locations, and voucher information used in this study.

Author Contributions

K.C., conceptualization, data curation, formal analysis, investigation, writing—original draft. Z.-J.T., data curation, investigation, methodology. Y.W., data curation, formal analysis, methodology. J.-B.T., investigation, formal analysis. S.-D.Z., conceptualization, formal analysis. X.-J.H., conceptualization, data curation, funding acquisition, investigation, writing—review and editing. D.-F.X., conceptualization, data curation, formal analysis, funding acquisition, investigation, methodology, writing—original draft, writing—review and editing. All authors have read and agreed to the published version of the manuscript.

Funding

This work was supported by the Sichuan Science and Technology Program (Grant Number 2025ZNSFSC1129), the National Natural Science Foundation of China (Grant Nos. 32100180), and the Key Project at Central Government Level: The Ability Establishment of Sustainable Use for Valuable Chinese Medicine Resources (2060302).

Data Availability Statement

All sequencing data have been deposited in the Genome Sequence Archive (GSA) of the National Genomics Data Center (NGDC) under project PRJCA039276.

Conflicts of Interest

The authors declare that they have no known competing financial interests or personal relationships that could have appeared to influence the work reported in this paper.

References

  1. Chase, M.W.; Reveal, J.L. A phylogenetic classification of the land plants to accompany APG III. Bot. J. Linn. Soc. 2009, 161, 122–127. [Google Scholar] [CrossRef]
  2. Herden, T.; Hanelt, P.; Friesen, N. Phylogeny of Allium L. subgenus Anguinum (G. Don. ex W.D.J. Koch) N. Friesen (Amaryllidaceae). Mol. Phylogenet. Evol. 2016, 95, 79–93. [Google Scholar] [CrossRef] [PubMed]
  3. Govaerts, R.; Kington, S.; Friesen, N.; Fritsch, R.M.; Snijman, D.A.; Marcucci, R.; Silverstone-Sopkin, P.A.; Brullo, S. World Checklist of Amaryllidaceae. Facilitated by the Roy. Bot. Gard., Kew. 2021. Available online: http://apps.kew.org/wcsp/ (accessed on 27 February 2025).
  4. Block, E. Garlic and Other Alliums: The Lore and the Science; Royal Society of Chemistry: Cambridge, UK, 2010. [Google Scholar]
  5. Fritsch, R.M.; Friesen, N. Evolution, domestication and taxonomy. In Allium Crop Science: Recent Advances; Rabinowitch, H.D., Currah, L., Eds.; CABI Publishing: Wallingford, UK, 2002; pp. 5–30. [Google Scholar]
  6. Friesen, N.; Fritsch, R.M.; Blattner, F.R. Phylogeny and intrageneric classification of Allium (Alliaceae) based on nuclear ribosomal DNA ITS sequences. Aliso 2006, 22, 372–395. [Google Scholar] [CrossRef]
  7. Jang, J.E.; Baasanmunkh, S.; Nyamgerel, N.; Oh, S.Y.; Song, J.H.; Yusupov, Z.; Tojibaev, K.; Choi, H.J. Flower morphology of Allium (Amaryllidaceae) and its systematic significance. Plant Divers. 2023, 46, 3–27. [Google Scholar] [CrossRef] [PubMed]
  8. Choi, H.J.; Oh, B.U. A partial revision of Allium (Amaryllidaceae) in Korea and north-eastern China. Bot. J. Linn. Soc. 2011, 167, 153–211. [Google Scholar] [CrossRef]
  9. Nguyen, N.H.; Driscoll, H.E.; Specht, C.D. A molecular phylogeny of the wild onions (Allium: Alliaceae) with a focus on the western North American center of diversity. Mol. Phylogenet. Evol. 2008, 47, 1157–1172. [Google Scholar] [CrossRef]
  10. Li, M.J.; Tan, J.B.; Xie, D.F.; Huang, D.Q.; Gao, Y.D.; He, X.J. Revisiting the evolutionary events in Allium subgenus Cyathophora (Amaryllidaceae): Insights into the effect of the Hengduan Mountains Region (HMR) uplift and quaternary climatic fluctuations to the environmental changes in the Qinghai-Tibet Plateau. Mol. Phylogenet. Evol. 2016, 94, 802–813. [Google Scholar] [CrossRef]
  11. Li, M.J.; Zheng, Z.Y.; Liu, J.C.; Yang, Y.Z.; Ren, G.P.; Ru, D.F.; Zhang, S.Z.; Du, X.; Ma, T.; Milne, R.; et al. Evolutionary origin of a tetraploid Allium species on the Qinghai-Tibet Plateau. Mol. Ecol. 2021, 30, 5780–5795. [Google Scholar] [CrossRef]
  12. Xie, D.F.; Yu, H.X.; Price, M.; Xie, C.; Deng, Y.Q.; Chen, J.P.; Yu, Y.; Zhou, S.D.; He, X.J. Phylogeny of Chinese Allium species in section Daghestanica and adaptive evolution of Allium (Amaryllidaceae, Allioideae) species revealed by the chloroplast complete genome. Front. Plant Sci. 2019, 10, 460. [Google Scholar] [CrossRef]
  13. Xie, D.F.; Tan, J.B.; Yu, Y.; Gui, L.J.; Su, D.M.; Zhou, S.D.; He, X.J. Insights into phylogeny, age and evolution of Allium (Amaryllidaceae) based on the whole plastome sequences. Ann. Bot. 2020, 125, 1039–1055. [Google Scholar] [CrossRef]
  14. Fu, X.; Xie, D.F.; Zhou, Y.Y.; Cheng, R.Y.; Zhang, X.Y.; Zhou, S.D.; He, X.J. Phylogeny and adaptive evolution of subgenus Rhizirideum (Amaryllidaceae, Allium) based on plastid genomes. BMC Plant Biol. 2023, 23, 70. [Google Scholar] [CrossRef] [PubMed]
  15. Friesen, N.; Herden, T.; Leweke, M.; Grützmacher, L.; Fragman-Sapir, O.; Hurka, H.; Blattner, F.; Fritsch, R.M. Dated phylogeny, phylogeography, and classification of Allium subgenus Amerallium (Amaryllidaceae) from the old world, based on six DNA fragments. Taxon 2024, 73, 971–991. [Google Scholar] [CrossRef]
  16. Zhang, Z.; Liu, G.; Li, M. Phylotranscriptomic discordance is best explained by incomplete lineage sorting within Allium subgenus Cyathophora and thus hemiplasy accounts for interspecific trait transition. Plant Divers. 2024, 46, 28–38. [Google Scholar] [CrossRef]
  17. Li, M.J.; Liu, J.Q.; Guo, X.L.; Xiao, Q.Y.; He, X.J. Taxonomic revision of Allium Cyathophorum (Amaryllidaceae). Phytotaxa 2019, 415, 240–246. [Google Scholar] [CrossRef]
  18. Friesen, N.; Fritsch, R.M.; Pollner, S.; Blattner, F.R. Molecular and morphological evidence for an origin of the aberrant genus Milula within Himalayan species of Allium (Alliaceae). Mol. Phylogenet. Evol. 2000, 17, 209–218. [Google Scholar] [CrossRef]
  19. Tang, H.G.; Meng, L.H.; Ao, S.Q.; Liu, J.Q. Origin of the Qinghai-Tibetan Plateau endemic Milula (Liliaceae): Further insights from karyological comparisons with Allium. Caryologia 2005, 58, 320–331. [Google Scholar] [CrossRef]
  20. Xu, J.M. Allium siphonanthum J.M.Xu. Fl. Reipubl. Popularis Sin. 1980, 14, 284. [Google Scholar]
  21. Li, Q.Q. Molecular Systematics of the Genus Allium L. (Amaryllidaceae: Allieae). Doctoral Thesis, Sichuan University, Chengdu, China, 2010. [Google Scholar]
  22. Meleshko, O.; Martin, M.D.; Korneliussen, T.S.; Schröck, C.; Lamkowski, P.; Schmutz, J.; Healey, A.; Piatkowski, B.T.; Shaw, A.J.; Weston, D.J.; et al. Extensive genome-wide phylogenetic discordance is due to incomplete lineage sorting and not ongoing introgression in a rapidly radiated bryophyte genus. Mol. Biol. Evol. 2021, 38, 2750–2766. [Google Scholar] [CrossRef]
  23. Wang, G.; Zhang, X.; Herre, E.A.; McKey, D.; Machado, C.A.; Yu, W.B.; Cannon, C.H.; Arnold, M.L.; Pereira, R.A.S.; Ming, R.; et al. Genomic evidence of prevalent hybridization throughout the evolutionary history of the fig-wasp pollination mutualism. Nat. Commun. 2021, 12, 718. [Google Scholar] [CrossRef]
  24. Cheng, L.; Han, Q.; Chen, F.; Balbuena, T.S.; Zhao, Y. Phylogenomics as an effective approach to untangle cross-species hybridization events: A case study in the family Nymphaeaceae. Front. Genet. 2022, 13, 1031705. [Google Scholar] [CrossRef]
  25. Feng, Y.; Xiang, X.; Akhter, D.; Pan, R.; Fu, Z.; Jin, X. Mitochondrial phylogenomics of Fagales provides insights into plant mitogenome mosaic evolution. Front. Plant Sci. 2021, 12, 762195. [Google Scholar] [CrossRef]
  26. Xia, X.M.; Yang, M.Q.; Li, C.L.; Huang, S.X.; Jin, W.T.; Shen, T.T.; Wang, F.; Li, X.H.; Yoichi, W.; Zhang, L.H.; et al. Spatiotemporal evolution of the global species diversity of Rhododendron. Mol. Biol. Evol. 2022, 39, msab314. [Google Scholar] [CrossRef] [PubMed]
  27. Xie, D.F.; Li, J.; Sun, J.H.; Cheng, R.Y.; Wang, Y.; Song, B.N.; He, X.J.; Zhou, S.D. Peering through the hedge: Multiple datasets yield insights into the phylogenetic relationships and incongruences in the tribe Lilieae (Liliaceae). Mol. Phylogenet. Evol. 2024, 200, 108182. [Google Scholar] [CrossRef]
  28. Xu, L.; Song, Z.; Li, T.; Jin, Z.; Zhang, B.; Du, S.; Liao, S.; Zhong, X.; Chen, Y. New insights into the phylogeny and infrageneric taxonomy of Saussurea based on hybrid capture phylogenomics (Hyb-Seq). Plant Divers. 2025, 47, 21–33. [Google Scholar] [CrossRef] [PubMed]
  29. He, X.J. Integrating high-volume molecular and morphological data into the evolutionary studies of Allium. Plant Divers. 2024, 46, 1–2. [Google Scholar] [CrossRef]
  30. Zhang, Z.; Liu, G.; Li, M. Incomplete lineage sorting and gene flow within Allium (Amaryllidaceae). Mol. Phylogenet. Evol. 2024, 195, 108054. [Google Scholar] [CrossRef]
  31. Huang, D.Q. Molecular Systematics of Allium subgenus Cyathophora, Sections Bromatorrhiza and Sikkimensia (Amaryllidaceae) and Intraspecific Genetic Differentiation of A. wallichii. Doctoral Thesis, Sichuan University, Chengdu, China, 2014. [Google Scholar]
  32. Yang, L.H.; Harris, A.J.; Wen, F.; Li, Z.; Feng, C.; Kong, H.; Kang, M. Phylogenomic analyses reveal an allopolyploid origin of Core Didymocarpinae (Gesneriaceae) followed by rapid radiation. Syst. Biol. 2023, 72, 1064–1083. [Google Scholar] [CrossRef] [PubMed]
  33. Ma, X.G.; Ren, Y.B.; Sun, H. Introgression and incomplete lineage sorting blurred phylogenetic relationships across the genomes of sclerophyllous oaks from southwest China. Cladistics 2024, 40, 357–373. [Google Scholar] [CrossRef]
  34. Naranjo, A.A.; Edwards, C.E.; Gitzendanner, M.A.; Soltis, D.E.; Soltis, P.S. Abundant incongruence in a clade endemic to a biodiversity hotspot: Phylogenetics of the scrub mint clade (Lamiaceae). Mol. Phylogenet. Evol. 2024, 192, 108014. [Google Scholar] [CrossRef]
  35. Taylor, S.A.; Larson, E.L. Insights from genomes into the evolutionary importance and prevalence of hybridization in nature. Nat. Ecol. Evol. 2019, 3, 170–177. [Google Scholar] [CrossRef]
  36. Rose, J.P.; Toledo, C.A.P.; Lemmon, E.M.; Lemmon, A.R.; Sytsma, K.J. Out of sight, out of mind: Widespread nuclear and plastid-nuclear discordance in the flowering plant genus Polemonium (Polemoniaceae) suggests widespread historical gene flow despite limited nuclear signal. Syst. Biol. 2021, 70, 162–180. [Google Scholar] [CrossRef] [PubMed]
  37. Talavera, A.; Nie, Z.L.; Ma, Z.Y.; Ma, Z.-Y.; Johnson, G.; Ickert-Bond, S.M.; Zimmer, E.A.; Wen, J. Phylogenomic analyses using a new 1013-gene Vitaceae bait-set support major groups of North American Vitis. Mol. Phylogenet. Evol. 2023, 186, 107866. [Google Scholar] [CrossRef] [PubMed]
  38. Edelman, N.B.; Frandsen, P.B.; Miyagi, M.; Clavijo, B.; Davey, J.; Dikow, R.B.; García-Accinelli, G.; Van Belleghem, S.M.; Patterson, N.; Neafsey, D.E.; et al. Genomic architecture and introgression shape a butterfly radiation. Science 2019, 366, 594–599. [Google Scholar] [CrossRef]
  39. Dong, W.; Li, E.; Liu, Y.; Xu, C.; Wang, Y.; Liu, K.; Cui, X.; Sun, J.; Suo, Z.; Zhang, Z.; et al. Phylogenomic approaches untangle early divergences and complex diversifications of the olive plant family. BMC Biol. 2022, 20, 92. [Google Scholar] [CrossRef]
  40. Cai, L.; Xi, Z.; Lemmon, E.M.; Lemmon, A.R.; Mast, A.; Buddenhagen, C.E.; Liu, L.; Davis, C.C. The Perfect Storm: Gene Tree Estimation Error, Incomplete Lineage Sorting, and Ancient Gene Flow Explain the Most Recalcitrant Ancient Angiosperm Clade, Malpighiales. Syst. Biol. 2021, 70, 491–507. [Google Scholar] [CrossRef]
  41. Whitney, K.D.; Ahern, J.R.; Campbell, L.G.; Albert, L.P.; King, M.S. Patterns of hybridization in plants. Perspect. Plant Ecol. Evol. Syst. 2010, 12, 175–182. [Google Scholar] [CrossRef]
  42. Liu, J.; Nie, Z.L.; Ren, C.; Su, C.; Wen, J. Phylogenomics of Aralia sect. Aralia (Araliaceae): Signals of hybridization and insights into its species delimitations and intercontinental biogeography. Mol. Phylogenet. Evol. 2023, 181, 107727. [Google Scholar]
  43. Marianne, B.; Erin, K.M.; Colin, N.D.; Claudia, S.L. Detectability of varied hybridization scenarios using genome-scale hybrid detection methods. arXiv 2023. [Google Scholar] [CrossRef]
  44. Ma, Y.; Mao, X.; Wang, J.; Zhang, L.; Jiang, Y.; Geng, Y.; Ma, T.; Cai, L.; Huang, S.; Hollingsworth, P.; et al. Pervasive hybridization during evolutionary radiation of Rhododendron subgenus Hymenanthes in mountains of southwest China. Nat. Sci. Rev. 2022, 9, nwac276. [Google Scholar] [CrossRef]
  45. Wang, Z.; Kang, M.H.; Li, J.L.; Zhang, Z.Y.; Wang, Y.F.; Chen, C.L.; Yang, Y.Z.; Liu, J.Q. Genomic evidence for homoploid hybrid speciation between ancestors of two different genera. Nat. Commun. 2022, 13, 1987. [Google Scholar] [CrossRef]
  46. Cardoni, S.; Piredda, R.; Denk, T.; Grimm, G.W.; Papageorgiou, A.C.; Schulze, E.D.; Scoppola, A.; Salehi Shanjani, P.; Suyama, Y.; Tomaru, N.; et al. 5S-IGS rDNA in wind-pollinated trees (Fagus L.) encapsulates 55 million years of reticulate evolution and hybrid origins of modern species. Plant J. 2022, 109, 909–926. [Google Scholar] [CrossRef] [PubMed]
  47. McLay, T.G.B.; Fowler, R.M.; Fahey, P.S.; Murphy, D.J.; Udovicic, F.; Cantrill, D.J.; Bayly, M.J. Phylogenomics reveals extreme gene tree discordance in a lineage of dominant trees: Hybridization, introgression, and incomplete lineage sorting blur deep evolutionary relationships despite clear species groupings in Eucalyptus subgenus Eudesmia. Mol. Phylogenet. Evol. 2023, 187, 107869. [Google Scholar] [CrossRef]
  48. Liu, J.Q.; Duan, Y.W.; Hao, G.; Ge, X.J.; Sun, H. Evolutionary history and underlying adaptation of alpine plants on the Qinghai-Tibet Plateau. J. Syst. Evol. 2014, 52, 241–249. [Google Scholar] [CrossRef]
  49. Marchese, C. Biodiversity hotspots: A shortcut for a more complicated concept. Glob. Ecol. Conserv. 2015, 3, 297–309. [Google Scholar] [CrossRef]
  50. Mosbrugger, V.; Favre, A.; Muellner-Riehl, A.N. Cenozoic evolution of geo-biodiversity in the Tibeto-Himalayan region. In Mountains, Climate, and Biodiversity; Hoorn, C., Perrigio, A., Antonelli, A., Eds.; Wiley-Blackwell: Chichester, UK, 2018; pp. 429–448. [Google Scholar]
  51. Rahbek, C.; Borregaard, M.K.; Antonelli, A.; Colwell, R.K.; Holt, B.G.; Nogues-Bravo, D.; Rasmussen, C.M.Ø.; Richardson, K.; Rosing, M.T.; Whittaker, R.J.; et al. Building mountain biodiversity: Geological and evolutionary processes. Science 2019, 365, 1114–1119. [Google Scholar] [CrossRef] [PubMed]
  52. Ding, W.N.; Ree, R.H.; Spicer, R.A.; Xing, Y.W. Ancient orogenic and monsoon-driven assembly of the world’s richest temperate alpine flora. Science 2020, 369, 578–581. [Google Scholar] [CrossRef]
  53. Ru, D.; Sun, Y.; Wang, D.; Chen, Y.; Wang, T.; Hu, Q.; Abbott, R.J.; Liu, J. Population genomic analysis reveals that homoploid hybrid speciation can be a lengthy process. Mol. Ecol. 2018, 27, 4875–4887. [Google Scholar] [CrossRef]
  54. Wu, S.; Wang, Y.; Wang, Z.; Shrestha, N.; Liu, J. Species divergence with gene flow and hybrid speciation on the Qinghai–Tibet Plateau. New Phytol. 2022, 234, 392–404. [Google Scholar] [CrossRef]
  55. Liu, J.; Lindstrom, A.J.; Gong, Y.; Dong, S.; Liu, Y.C.; Zhang, S.; Gong, X. Eco-evolutionary evidence for the global diversity pattern of Cycas (Cycadaceae). J. Integr. Plant Biol. 2024, 66, 1170–1191. [Google Scholar] [CrossRef]
  56. Huang, D.Q.; Ma, X.G.; Sun, H. Phylogenomic analyses and chromosome ploidy identification reveal multiple cryptic species in Allium sikkimense complex (Amaryllidaceae). Front. Plant Sci. 2024, 14, 1268546. [Google Scholar] [CrossRef]
  57. Wu, L.L.; Cui, X.K.; Milne, R.I.; Sun, Y.S.; Liu, J.Q. Multiple autopolyploidizations and range expansion of Allium przewalskianum Regel. (Alliaceae) in the Qinghai-Tibetan Plateau. Mol. Ecol. 2010, 19, 1691–1704. [Google Scholar] [CrossRef] [PubMed]
  58. Van Drunen, W.E.; Husband, B.C. Evolutionary associations between polyploidy, clonal reproduction, and perenniality in the angiosperms. New Phytol. 2019, 224, 1266–1277. [Google Scholar] [CrossRef] [PubMed]
  59. Han, T.S.; Zheng, Q.J.; Onstein, R.E.; Rojas-Andres, B.M.; Hauenschild, F.; Muellner-Riehl, A.N.; Xing, Y.W. Polyploidy promotes species diversification of Allium through ecological shifts. New Phytol. 2020, 225, 571–583. [Google Scholar] [CrossRef] [PubMed]
  60. Chen, S.; Zhou, Y.; Chen, Y.; Gu, J. fastp: An ultra-fast all-in-one FASTQ preprocessor. Bioinformatics 2018, 34, 884–890. [Google Scholar] [CrossRef]
  61. Bolger, A.M.; Lohse, M.; Usadel, B. Trimmomatic: A flexible trimmer for Illumina sequence data. Bioinformatics 2014, 30, 2114–2120. [Google Scholar] [CrossRef]
  62. Grabherr, M.G.; Haas, B.J.; Yassour, M.; Levin, J.Z.; Thompson, D.A.; Amit, I.; Adiconis, X.; Fan, L.; Raychowdhury, R.; Zeng, Q.; et al. Full-length transcriptome assembly from RNA-Seq data without a reference genome. Nat. Biotechnol. 2011, 29, 644–652. [Google Scholar] [CrossRef]
  63. Fu, L.; Niu, B.; Zhu, Z.; Wu, S.; Li, W. CD-HIT: Accelerated for clustering the next-generation sequencing data. Bioinformatics 2012, 28, 3150–3152. [Google Scholar] [CrossRef]
  64. Emms, D.M.; Kelly, S. OrthoFinder: Solving fundamental biases in whole genome comparisons dramatically improves orthogroup inference accuracy. Genome Biol. 2015, 16, 1–14. [Google Scholar] [CrossRef]
  65. Löytynoja, A.; Goldman, N. Phylogeny-aware gap placement prevents errors in sequence alignment and evolutionary analysis. Science 2008, 320, 1632–1635. [Google Scholar] [CrossRef]
  66. Katoh, K.; Standley, D.M. MAFFT multiple sequence alignment software version 7: Improvements in performance and usability. Mol. Biol. Evol. 2013, 30, 772–780. [Google Scholar] [CrossRef]
  67. Capella-Gutiérrez, S.; Silla-Martínez, J.M.; Gabaldón, T. trimAl: A tool for automated alignment trimming in large-scale phylogenetic analyses. Bioinformatics 2009, 25, 1972–1973. [Google Scholar] [CrossRef] [PubMed]
  68. Nguyen, L.T.; Schmidt, H.A.; von Haeseler, A.; Minh, B.Q. IQ-TREE: A fast and effective stochastic algorithm for estimating maximum-likelihood phylogenies. Mol. Biol. Evol. 2015, 32, 268–274. [Google Scholar] [CrossRef] [PubMed]
  69. Kalyaanamoorthy, S.; Minh, B.Q.; Wong, T.K.F.; von Haeseler, A.; Jermiin, L.S. ModelFinder: Fast model selection for accurate phylogenetic estimates. Nat. Methods 2017, 14, 587–589. [Google Scholar] [CrossRef] [PubMed]
  70. Zhang, C.; Rabiee, M.; Sayyari, E.; Mirarab, S. ASTRAL-III: Polynomial time species tree reconstruction from partially resolved gene trees. BMC Bioinform. 2018, 19, 153. [Google Scholar] [CrossRef]
  71. Sayyari, E.; Mirarab, S. Fast Coalescent-Based Computation of Local Branch Support from Quartet Frequencies. Mol. Biol. Evol. 2016, 33, 1654–1668. [Google Scholar] [CrossRef]
  72. Smith, S.A.; Moore, M.J.; Brown, J.W.; Hinchliff, C.E. Analysis of phylogenomic datasets reveals conflict, concordance, and gene duplications with examples from animals and plants. BMC Evol. Biol. 2015, 15, 150. [Google Scholar] [CrossRef]
  73. Salichos, L.; Stamatakis, A.; Rokas, A. Novel information theory-based measures for quantifying incongruence among phylogenetic trees. Mol. Biol. Evol. 2014, 31, 1261–1271. [Google Scholar] [CrossRef]
  74. Doyle, J.J. A rapid DNA isolation procedure for small amounts of fresh leaf tissue. Phytochem. Bull. 1987, 19, 11–15. [Google Scholar]
  75. Jin, J.J.; Yu, W.B.; Yang, J.B.; Song, Y.; dePamphilis, C.W.; Yi, T.S.; Li, D.Z. GetOrganelle: A fast and versatile toolkit for accurate de novo assembly of organelle genomes. Genome Biol. 2020, 21, 241. [Google Scholar] [CrossRef]
  76. Minh, B.Q.; Hahn, M.W.; Lanfear, R. New methods to calculate concordance factors for phylogenomic datasets. Mol. Biol. Evol. 2020, 37, 2727–2733. [Google Scholar] [CrossRef]
  77. Pease, J.B.; Brown, J.W.; Walker, J.F.; Hinchliff, C.E.; Smith, S.A. Quartet Sampling distinguishes lack of support from conflicting support in the green plant tree of life. Am. J. Bot. 2018, 105, 385–403. [Google Scholar] [CrossRef]
  78. Allman, E.S.; Mitchell, J.D.; Rhodes, J.A. Gene tree discord, simplex plots, and statistical tests under the coalescent. Syst. Biol. 2022, 71, 929–942. [Google Scholar] [CrossRef] [PubMed]
  79. Rhodes, J.A.; Baños, H.; Mitchell, J.D.; Allman, E.S. MSCquartets 1.0: Quartet methods for species trees and networks under the multispecies coalescent model in R. Bioinformatics 2021, 37, 1766–1768. [Google Scholar] [CrossRef] [PubMed]
  80. Shang, H.Y.; Jia, K.H.; Li, N.W.; Zhou, M.J.; Yang, H.; Tian, X.L.; Ma, P.F.; Zhang, R.G. Phytop: A tool for visualizing and recognizing signals of incomplete lineage sorting and hybridization using species trees output from ASTRAL. Hortic. Res. 2024, 11, uhae330. [Google Scholar] [CrossRef] [PubMed]
  81. Yu, Y.; Nakhleh, L. A maximum pseudo-likelihood approach for phylogenetic networks. BMC Genomics 2015, 16, S10. [Google Scholar] [CrossRef]
  82. Solís-Lemus, C.; Bastide, P.; Ané, C. PhyloNetworks: A package for phylogenetic networks. Mol. Biol. Evol. 2017, 34, 3292–3298. [Google Scholar] [CrossRef]
  83. Huson, D.H.; Scornavacca, C. Dendroscope 3: An interactive tool for rooted phylogenetic trees and networks. Syst. Biol. 2012, 61, 1061–1067. [Google Scholar] [CrossRef]
  84. Allman, E.S.; Baños, H.; Rhodes, J.A. NANUQ: A method for inferring species networks from gene trees under the coalescent model. Algorithms Mol. Biol. 2019, 14, 1–25. [Google Scholar] [CrossRef]
  85. Huson, D.H.; Bryant, D. Application of phylogenetic networks in evolutionary studies. Mol. Biol. Evol. 2006, 23, 254–267. [Google Scholar] [CrossRef]
Figure 1. The inflorescences characteristics (AF) and the phylogenetic relationships (GI) of species in subgenus Cyathophora. (A) A. mairei; (B) A. spicatum; (C) A. siphonanthum; (D) A. farreri; (E) A. tetraploideum; (F) A. cyathophorum. The concatenation- and coalescent-based species trees of subg. Cyathophora species based on 1662 SCGs were inferred from (G) IQ-TREE and (H,I) ASTRAL-III. The support values from the different methods [i.e., UFBS/IQ-TREE, BS/ASTRAL-III, and LPP/ASTRAL-III] are indicated above their respective branches. The yellow dotted box represents the subg. Cyathophora. The critical evolutionary nodes with red colors (i–v) display the number of gene trees in concordance/conflict with the display nodes and the ‘Internode Certainty All’ (ICA) scores.
Plants 14 02083 g001
Figure 2. Phylogenetic trees based on 150 plastid loci. (AC) The species tree was inferred from IQ-TREE and ASTRAL-III, and the numbers on internal branches represent the UFBS/IQ-TREE, BS/ASTRAL-III, and LPP/ASTRAL-III, respectively. The yellow dotted box represents the subg. Cyathophora. The critical evolutionary nodes (marked with i–v in red) display the number of gene trees in concordance/conflict with the display nodes and the ‘Internode Certainty All’ (ICA) scores. (D) A heatmap showing the comparative results for each of the 107 gene trees with the species trees at the five nodes (i–v), with the gene trees exhibiting concordant and conflict topologies marked with green and orange squares, respectively. (E) A heatmap showing the comparative results for each of the 43 IGS trees to the species trees at the five nodes (i–v), with the IGS trees exhibiting concordant and conflict topologies marked with green and orange squares, respectively.
Plants 14 02083 g002
Figure 3. Phylogenetic discordance (A,B) and ILS detection (C). The species trees are inferred from (A) 1662 SCGs and (B) 150 plastid loci. The nodal support values are explained by referring to the ‘Nodal support description’ for a visual guide; the nodes show QC/QD/QI values in black above their branches, the terminals display QF values in green at the branch tips. The red branches represent full support with QC = 1; blue represents strong support, with QC values from 0.5 to 1. (C) Simplex plots of qcCFs under the MSC model of ILS with the T1 and T3 models (α = 0.001, other levels are provided in Figure S5) for the 1662 SCG trees. The red triangles denote MSC model rejection, while the blue circles indicate ILS-driven phylogenetic discordance.
Plants 14 02083 g003
Figure 4. Correlative relationships between concordance factors (gCF and sCF) and bootstrap (BS) values and branch lengths at all phylogenomic nodes, examined through analyses of (AD) SCG dataset and (EH) plastid loci dataset.
Plants 14 02083 g004
Figure 5. The detection of the ILS and reticulate evolution signals and network reconstruction. (A) The species phylogeny reconstructed from 1662 SCGs in subg. Cyathophora. (B) The signals of incomplete lineage sorting (ILS-i) and introgression/hybridization (IH-i) across the key phylogenetic nodes (red i–v) are identified and visualized, corresponding to the nodes in the phylogenetic tree. (C) The maximum pseudolikelihood species network, inferred using PhyloNet. The red and blue lines indicate greater and lesser parental contributions, respectively, to the hybrid lineages. The numbers adjacent to the branches indicate inheritance probabilities (r) for each hybrid node. (D) the reticulate phylogeny reconstructed through NANUQ topological analysis. The colored ovals highlight areas of possible reticulation.
Plants 14 02083 g005
Table 1. Main morphological characteristics of species in subg. Cyathophora.
SpeciesAllium cyathophorumAllium tetraploideumAllium farreriAllium siphonanthumAllium spicatumAllium mairei
bulbsolitary or clustered, cylindricsolitary or clustered, cylindricsolitary or clustered, cylindricsolitary or clustered, cylindricsolitary, cylindricusually clustered, cylindric
bulb tunicsgrayish brown, fibrousgrayish brown, fibrousgrayish brown, fibrousyellowish brown, subreticulateyellowish brown, fibrousyellowish brown to grayish brown, fibrous
scape shapeterete, usually 2-angled, covered with leaf sheaths only at baseterete, usually 3-angled, covered with leaf sheaths only at baseterete, usually 2-angled, covered with leaf sheaths only at baseterete, not angled, covered with leaf sheaths only at baseterete, hollow, not angled, covered with leaf sheaths only at baseterete, 2-angled, covered with leaf sheaths only at base.
scape length13–25 cm13–25 cm13–25 cm18–60 cm5–40 cm10–30 cm
leafshorter than scapeshorter than scapeshorter than scapesubequal to scapesubequal to scapeshorter than or subequal to scape
inflorescenceumbel hemispheric, laxly floweredumbel hemispheric, laxly floweredumbel hemispheric, laxly floweredumbel globose, densely many floweredspike, densely many floweredumbel, with very few flowers
pedicel lengthequal, 1–3 × as long as perianth, ebracteolateequal, 1–3 × as long as perianth, ebracteolateequal, 1–3 × as long as perianth, ebracteolateequal, shorter than 1/3 of perianth, ebracteolateequal, shorter than 1/3 of perianth, ebracteolateunequal, 1.5–2 × as long as perianth, ebracteolate
spathe1(–3)-valved, persistent1(–3)-valved, persistent1(–3)-valved, persistent2-valved, persistent1-valved, persistent1-valved, persistent
perianthpurple, retuse to obtuse at apexdark maroon, retuse to obtuse at apexpurple, acuminate at apexwhite to purple-red, retuse to obtuse at apexwhite to purple-red, retuse to obtuse at apexpale red to purple-red, apex obtuse or acute
inner filamentsshoulder-shaped at base, no teethshoulder-shaped at base, no teethtriangular at base, no teethwide at base, entire or 1-toothed on each sidewide at base, entire or 2-toothed on each sideconical at base, no teeth
styleshorter than ovaryshorter than ovaryshorter than ovarylonger than ovarylonger than ovaryshorter than ovary
chromosome number2n = 162n = 322n = 16unknown2n = 162n = 16, 32
flowering seasonJune to AugustJune to AugustJune to AugustSeptember to OctoberAugust to OctoberAugust to October
Disclaimer/Publisher’s Note: The statements, opinions and data contained in all publications are solely those of the individual author(s) and contributor(s) and not of MDPI and/or the editor(s). MDPI and/or the editor(s) disclaim responsibility for any injury to people or property resulting from any ideas, methods, instructions or products referred to in the content.

