Article

The Novel Transcription Factor BnaA01.KAN3 Is Involved in the Regulation of Anthocyanin Accumulation Under Phosphorus Starvation

by
Li He
,
Shan Peng
,
Ruihua Lin
,
Jiahui Zhang
,
Peng Cui
,
Yi Gan
* and
Hongbo Liu
*
College of Advanced Agricultural Sciences, Zhejiang A & F University, Hangzhou 311300, China
*
Authors to whom correspondence should be addressed.
These authors contributed equally to this work.
Plants 2025, 14(13), 2036; https://doi.org/10.3390/plants14132036
Submission received: 1 June 2025 / Revised: 27 June 2025 / Accepted: 30 June 2025 / Published: 3 July 2025
(This article belongs to the Special Issue Molecular Genetics and Breeding of Oilseed Crops—2nd Edition)

Abstract

The investigation of phosphorus metabolism and regulatory mechanisms is conducive to maintaining stable production of crops within a low-phosphorus environment. In phosphorus signal transduction, a few phosphorus starvation response (PHR) transcription factors were identified to bind to the characteristic cis-element, namely the PHR1 binding sequence (P1BS). While the molecular function of the PHR transcription factor has been intensively elucidated, here, we explore a novel transcription factor, BnaA01.KAN3, that undergoes specific binding to the P1BS by yeast one-hybrid and electrophoretic mobility shift assays, and its expression is induced with low-phosphorus stress. BnaA01.KAN3 possessed transcriptional activation and was located in the nucleus. The spatiotemporal expression pattern of BnaA01.KAN3 exhibited tissue specificity in developmental seed, and its expression level was especially high 25–30 days after pollination. Regarding the phenotype analysis, the independent heterologous overexpression lines of BnaA01.KAN3 in Arabidopsis thaliana exhibited not only significantly longer taproots but also an increased number of lateral roots compared to that of the wild type undergoing low-phosphorus treatment, while no differences were seen under normal phosphorus conditions. Furthermore, these lines showed higher anthocyanin and inorganic phosphorus contents with normal and low-phosphorus treatment, suggesting that BnaA01.KAN3 could enhance phosphorus uptake or remobilization to cope with low-phosphorus stress. In summary, this study characterized the transcription factor BnaA01.KAN3 that modulates low-phosphate adaptation and seed development, providing insights for improving phosphorus use efficiency and yield traits in Brassica napus.

1. Introduction

Phosphorus is an indispensable element for crop growth and development. As a non-renewable resource, phosphorus has increasingly attracted attention in terms of its efficient utilization for agricultural production security [1]. Although only 0.1–0.5% of dry matter in crops contains phosphorus, organic forms of phosphorus such as nucleic acids and phospholipids account for up to 85%, directly participating in key physiological processes such as energy metabolism, photosynthetic production, and cell proliferation [2,3]. As a major component of cell membranes, phospholipids are crucial for maintaining membrane structural stability and regulating cellular functions [4,5]. In response to abiotic stress, fatty acid derivatives enhance cellular osmotic adjustment capacity and inhibit membrane lipid peroxidation, forming a unique feedback regulation mechanism. They also alter metabolic pathways and restructure membrane lipids to improve the physiological utilization of phosphorus, effectively enhancing the stress resistance of crops [6,7]. On the other hand, resistance mechanisms optimize root architecture (such as root hair proliferation) and establish mycorrhizal symbiotic systems to enhance phosphorus acquisition capabilities [8]. Moreover, phosphorus signaling is involved in regulating stress response pathways, enhancing crop resistance by mediating hormone metabolism [9].
KANADI is a gene family unique to higher plants. All members of this family contain a conserved GRAP domain and have transcriptional activation activity. There are four members of the KANADI gene family in A. thaliana, namely KAN1-4. Previous studies have shown that KAN1, KAN2, and KAN3 participate in the polarity establishment of leaves [10]. The double mutant kan1/kan2 and triple mutant kan1/kan2/kan3 show significant polarity defects in leaves, with the adaxial side of the leaves forming protruding structures, and the floral organs also show obvious adaxialization characteristics. Additionally, the double mutant kan1/kan2 also undergoes the phenomenon of early flowering, which indicates that it enters the reproductive stage earlier and that the transition from the juvenile to adult stage is advanced [11].
Rapeseed (B. napus L.) is an important vegetable oil, accounting for approximately 15% of the world’s commodity. The Yangtze River region with phosphorus deficiency is the main production area of semi-winter B. napus in China. Rapeseed is extremely sensitive to phosphorus deficiency, and its growth and development as well as yield are significantly affected by the input of phosphorus fertilizer [12]. Under low phosphorus stress, the phenotype demonstrates slow growth; dark green or even purplish red leaves appear in the seedling stage; root development is delayed, leading to plant dwarfism; and the vegetative growth stage is prolonged, causing the flowering period to be delayed [13]. When the deficiency intensifies, the accumulation rate of the aboveground biomass decreases by more than 40%, the number of effective branches reduces by 30% to 50%, and the differentiation of pods is hindered, resulting in a sharp reduction in the number of pods per plant. This low-phosphorus state not only reduces the rapeseed yield by 20% to 60% but also weakens the stability of cell membranes, significantly reducing the survival rate of plants under low-temperature and drought stress [14,15]. In crops, the phosphorus metabolism network deeply affects the growth and development of crops and their stress response capabilities by regulating core processes such as lipid synthesis and signal transduction [16]. Therefore, there is an urgent need to explore the mechanism of the efficient utilization of phosphate fertilizer and select and breed low-phosphorus-tolerant varieties to ensure the stable yield of rapeseed, improve the utilization efficiency of phosphate fertilizer, and reduce agricultural source pollution.

2. Results

2.1. Transcription Factor BnaA01.KAN3 Binds to Cis-Element P1BS

The cis-element P1BS and its mutant were integrated into the pAbAi vector though HindIII and XhoI. Then, two types of vectors (pP1BS-AbAi and pP1BSMutant-AbAi), linearized with BstBI, were transformed into Y1HGold to construct bait yeast strains through homologous recombination into the genome of Y1HGold. The plasmid pGADT7-BnaA01.KAN3 was transformed into two types of yeast strains, Y1H[pP1BS-AbAi] and Y1H[pP1BSMutant-AbAi], to confirm the interaction. The yeast strain Y1H[pP1BS-AbAi] could grow on the SD/-Leu plus 200 μg/L AbA resistant medium but not Y1H[pP1BSMutant-AbAi] (Figure 1A). Moreover, in the EMSA (electrophoretic mobility shift assay), the transcription factor BnaA01.KAN3 could bind to the cis-element P1BS, and even the hybridization signals became weakened with the increase in mutation competitor (Figure 1B). These results indicate that the transcription factor BnaA01.KAN3 can bind to the phosphorus starvation response element P1BS in in vivo and in vitro.

2.2. Homology and Phylogenetic Tree Analysis

There are four homologous BnaKAN3s in the ‘Zhongshuang 11’ variety of B. napus. The total length of the BnaA01.KAN3 sequence is 939 bp, encoding 312 amino acids, with a molecular weight of 36.07 kDa. The conserved domain SHAQKYF class in the SANT superfamily was found in the protein sequence. A phylogenetic tree analysis revealed that the sequence of XP_013668667.1 from Brassica rapa had the closest genetic relationship to BnaA01.KAN3, and the other homologous genes are arranged from nearest to furthest as follows: Brassica oleracea, Raphanus sativus, and A. thaliana (Figure 2).

2.3. Tissue-Specific Expression Pattern and Response to Phosphorus Starvation

The expression pattern of BnaA01.KAN3 was analyzed by RT-qPCR in the roots, stems, leaves, flowers, and seeds in different developmental stages (15, 20, 25, 30, 35, 40, 45, and 50 days after pollination). The results show that the BnaA01.KAN3 gene’s relative expression level was mainly detected in developmental seeds, especially 25 and 30 days after pollination, reaching 8.33 and 8.96 times higher than that of the roots, respectively (Figure 3A). This indicates that the molecular function is related to seed development, oil accumulation, and fatty acid component regulation. To further clarify the phosphorus starvation response pattern of BnaA01.KAN3, one normal phosphorus concentration (625 μM P) and three low phosphorus concentrations (100 μM P, 50 μM P, and 0 μM P) were applied to seedling for 0 h, 6 h, and 12 h. After that, the relative expression levels at different phosphorus concentrations were analyzed. It was found that the BnaA01.KAN3 gene’s relative expression level was significant induced at all low phosphorus concentrations after 6 h of treatment compared to that at 0 h (Figure 3B). These results indicate that the BnaA01.KAN3 gene can respond to phosphorus starvation and may be involved in the regulation of phosphorus deficiency in B. napus.

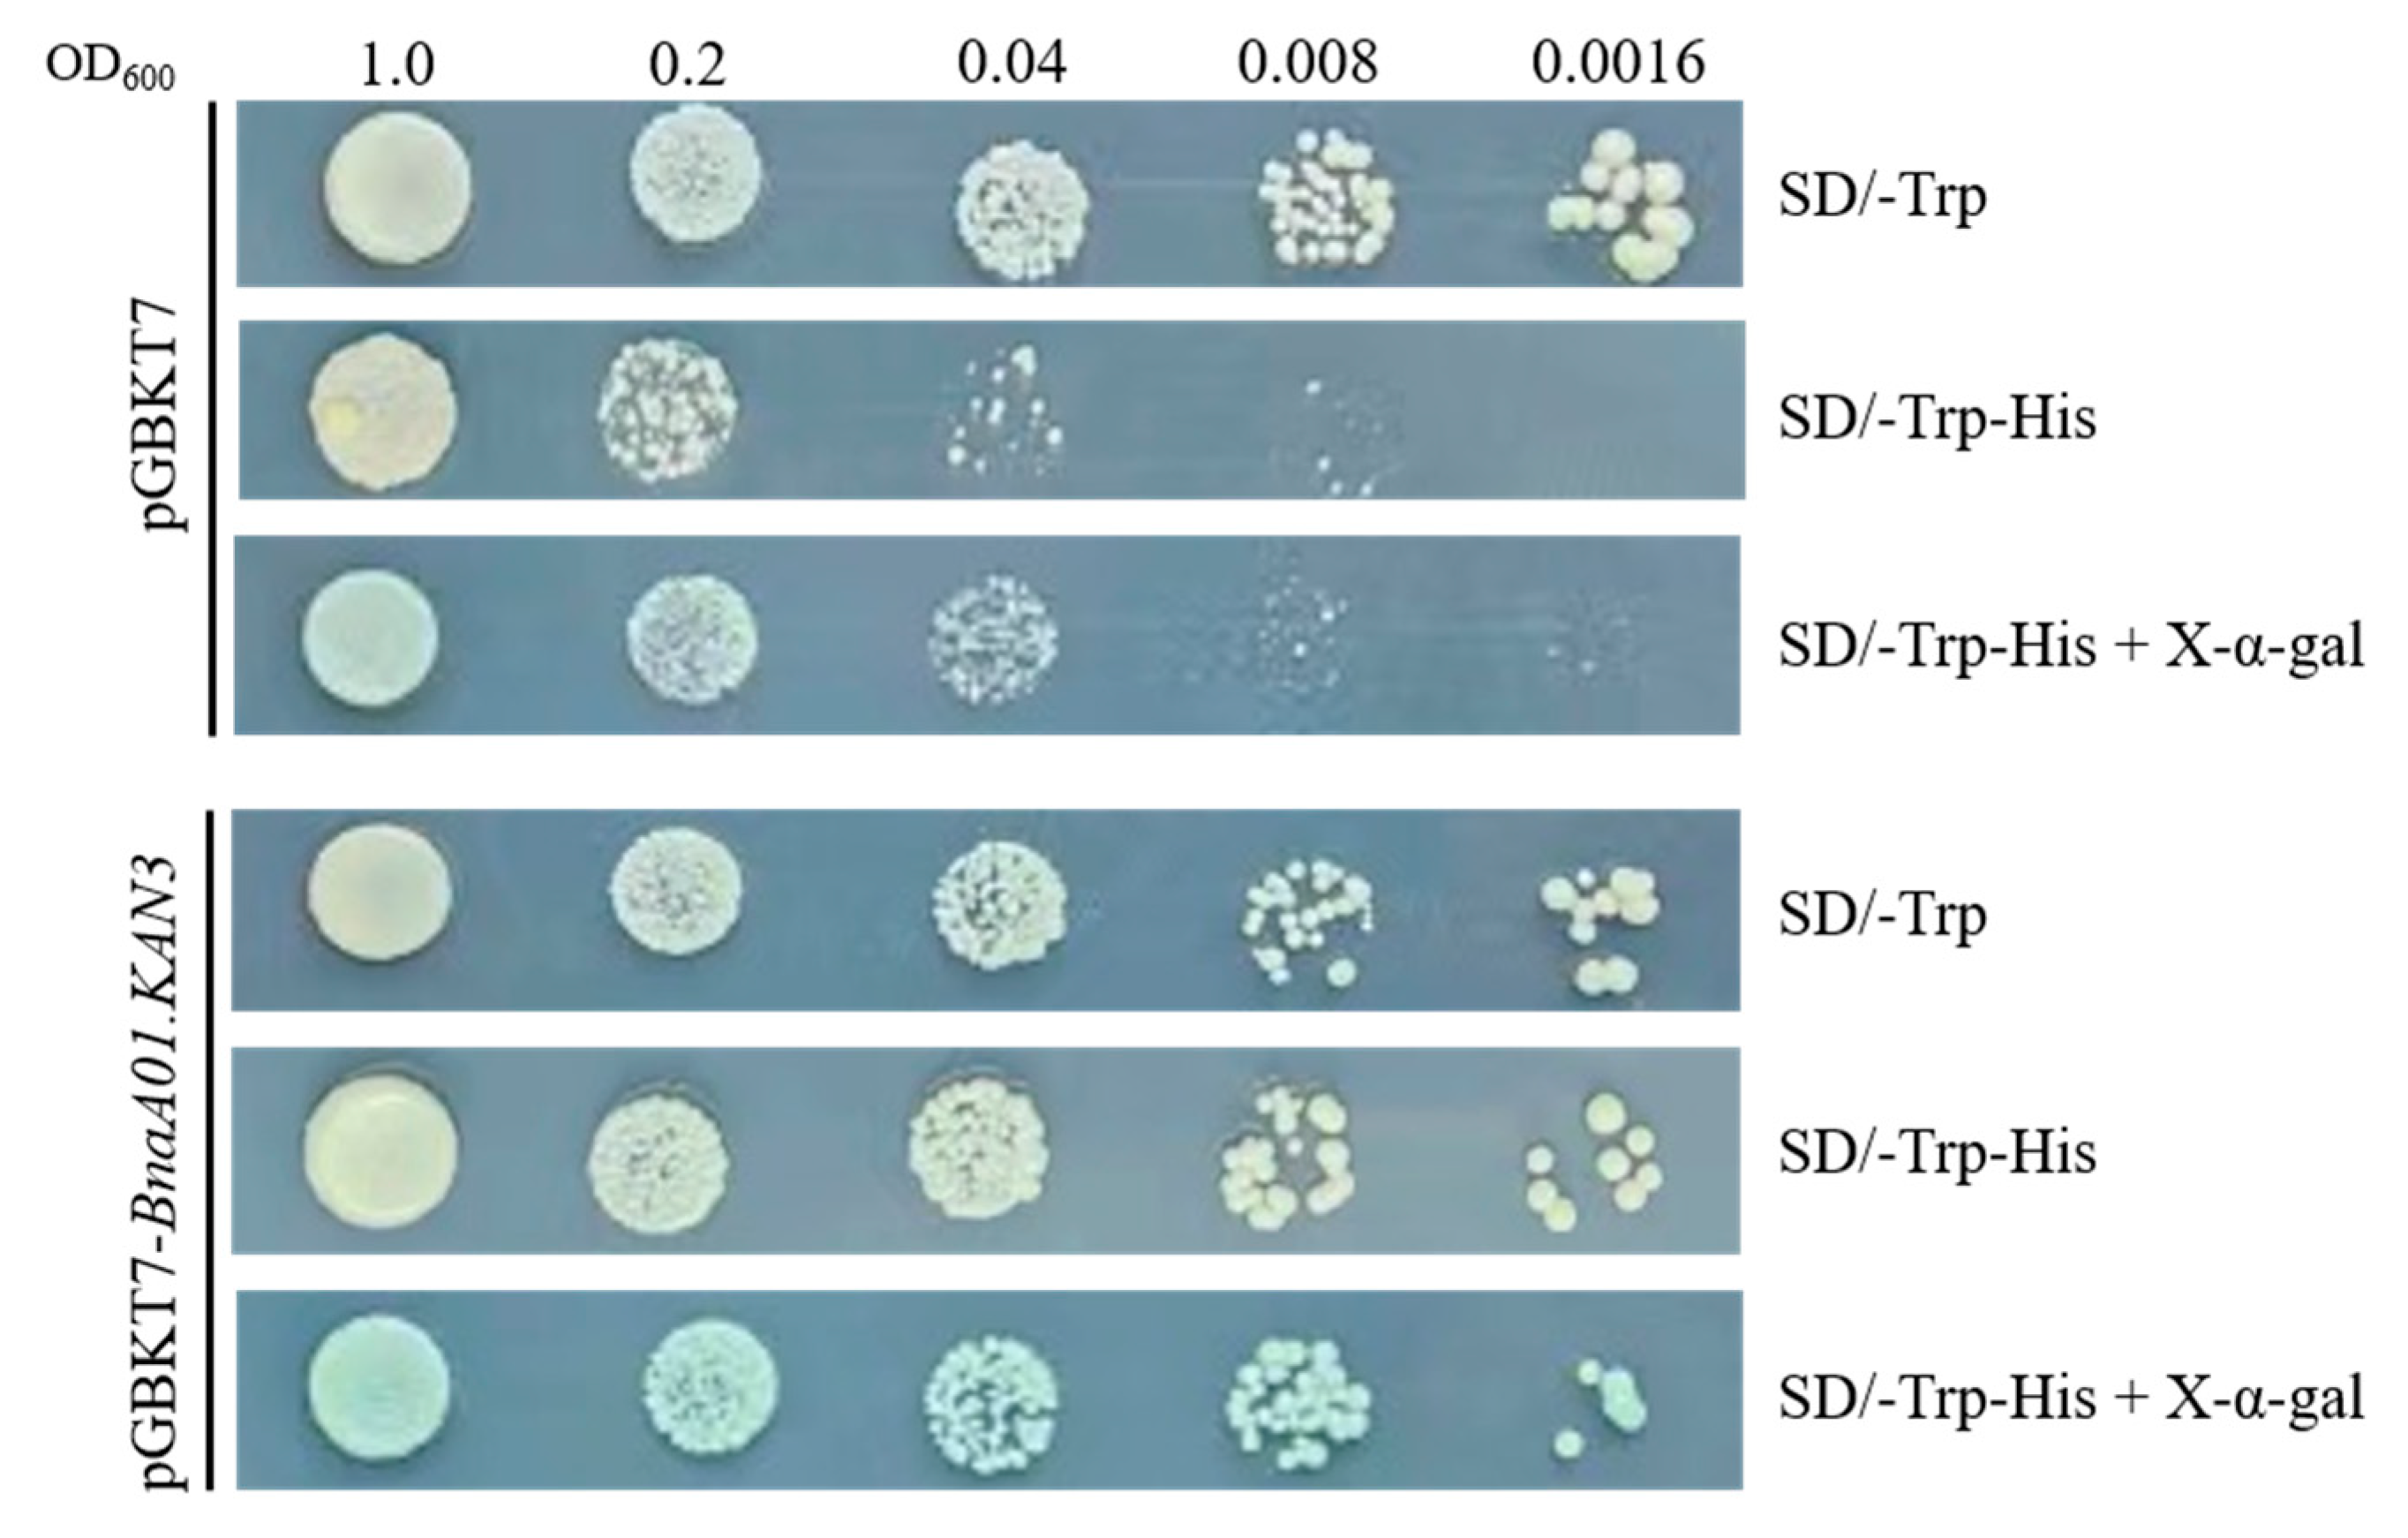
2.4. Transcription Auto-Activation of pGBKT7-BnaA01.KAN3

The BnaA01.KAN3 gene was cloned into yeast expression vector pGBKT7-BD by homologous recombination. The yeast strain Y2HGold that contained the recombinant vector pGBKT7-BnaA01.KAN3 could grow on the SD/-Trp-His and SD/-Trp-His plus X-α-gal medium, activate MEL-1 reporter genes, and encode α-galactosidase, making the yeast turn blue, which means that the transcription factor BnaA01.KAN3 activated the reporter genes (Figure 4). As a myb-like DNA-binding domain transcription factor, the transcriptional activation of BnaA01.KAN3 was confirmed by a yeast two-hybrid auto-activation system.

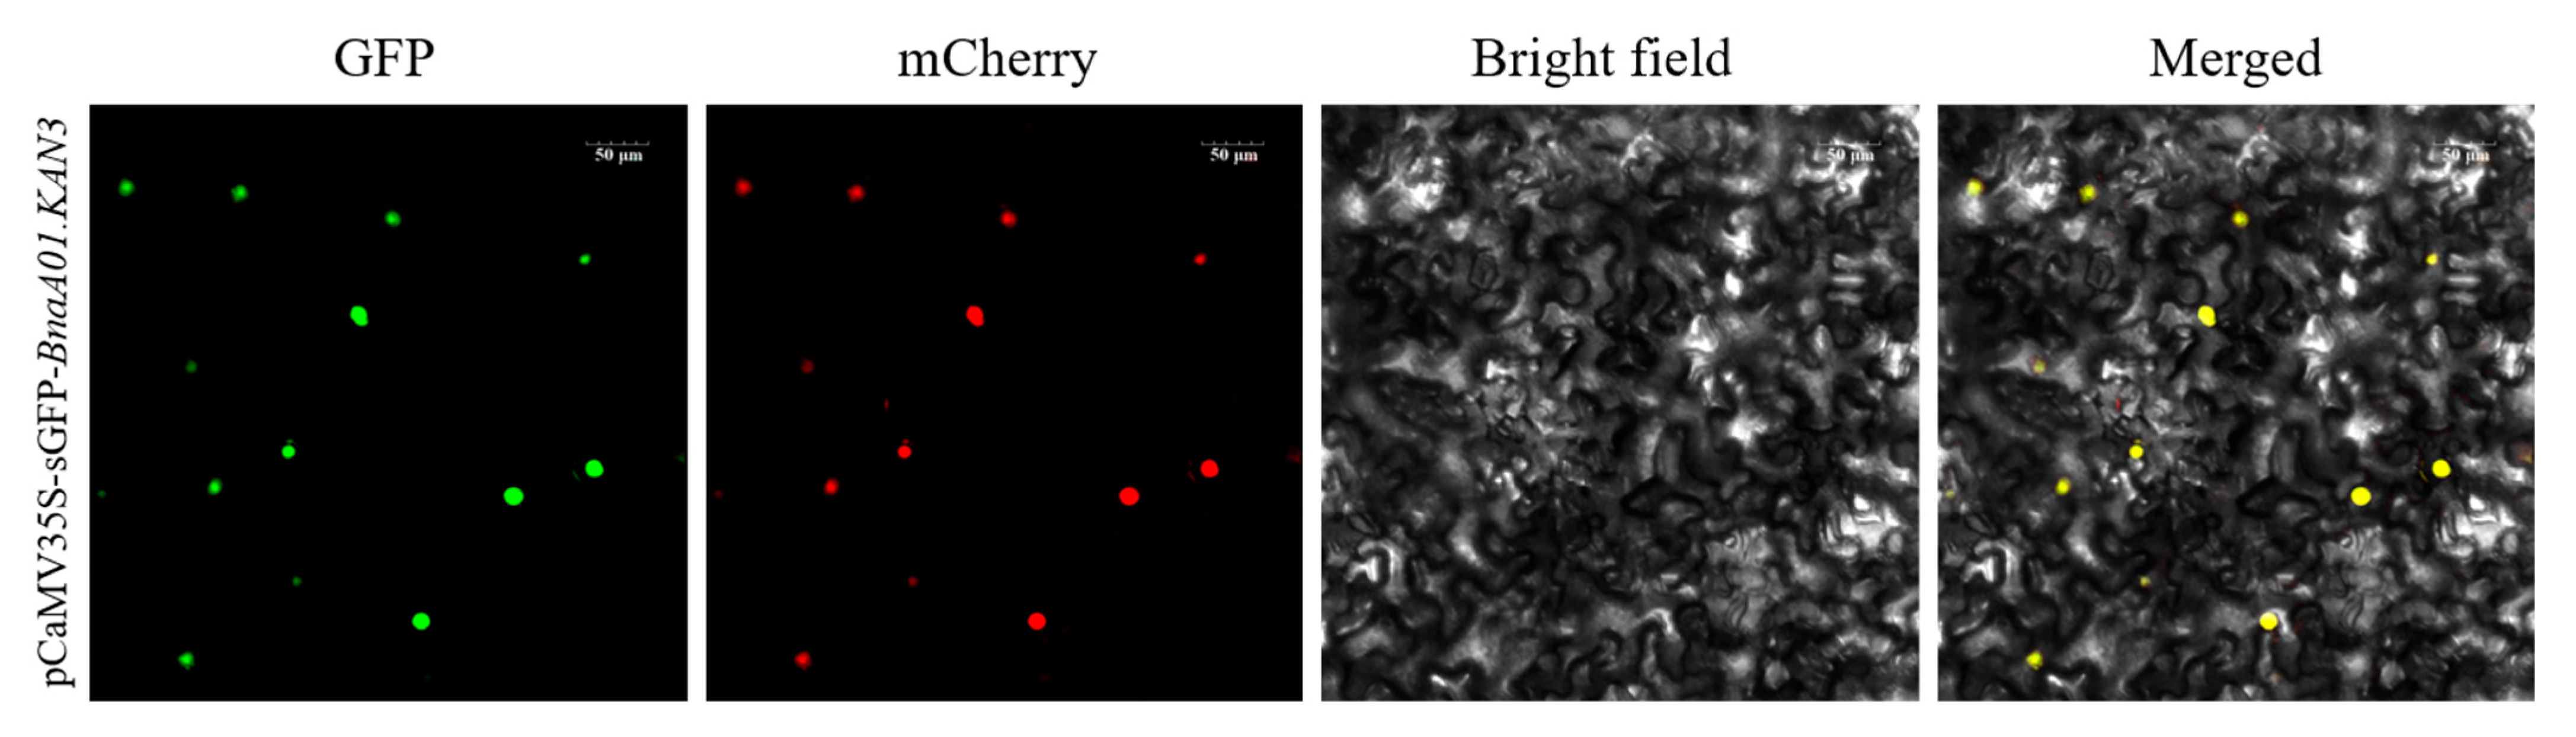
2.5. Subcellular Localization of Fusion Protein BnaA01.KAN3-GFP

To determine the subcellular localization of the transcription factor BnaA01.KAN3, a recombination plasmid of pCAMBIA1305.1-GFP-BnaA01.KAN3 was constructed. Then, the BnaA01.KAN3-GFP fusion protein was transiently expressed in Nicotiana tabacum leaves with a OsD53-mCherry protein as a control. Compared to the nucleus location signal in OsD53-mCherry protein, the result shows that the green fluorescence signal of the BnaA01.KAN3-GFP fusion protein was located in the nucleus in the merged image (Figure 5).

2.6. Constructed Transformants with BnaA01.KAN3 Overexpression in A. thaliana

The heterologous overexpression vector p1305.1-35S-BnaA01.KAN3-Nos was constructed and transformed into the A. thaliana through Agrobacterium tumefaciens GV3101. The positive plants were identified by hygromycin and PCR (Supplementary Figure S1). For T2 generation seeds, 13 independent lines were confirmed to be single-copy insertion transgenic lines using Mendel’s law of inheritance segregation test (Supplementary Table S2). T3 generation seeds were harvested, and five independent lines were chosen for further functional analysis. In addition, the relative expression level of BnaA01.KAN3 in five independent lines was significantly higher than that of the wild type (Supplementary Figure S2).
We have only analyzed the BnaA01.KAN3 gene’s relative expression level using RT-qPCR in five independent Arabidopsis lines.

2.7. Phenotype Analysis

The wild type and five independent lines were obtained using normal and low-phosphorus treatments. After 7 days of treatment, we observed that there was no significant difference in the above-ground and roots phenotypes between the wild type and overexpression lines in the normal phosphorus medium (Figure 6A,C,D). However, under phosphorus starvation, five independent signal-copy insertion lines showed that the length of the taproots are significantly longer than that of the wild type (Figure 6B,C). Meanwhile, the same result was observed in the lateral root number between the overexpression lines and wild type (Figure 6B,D). An increase in the root specific surface area could improve the absorption of phosphorus.

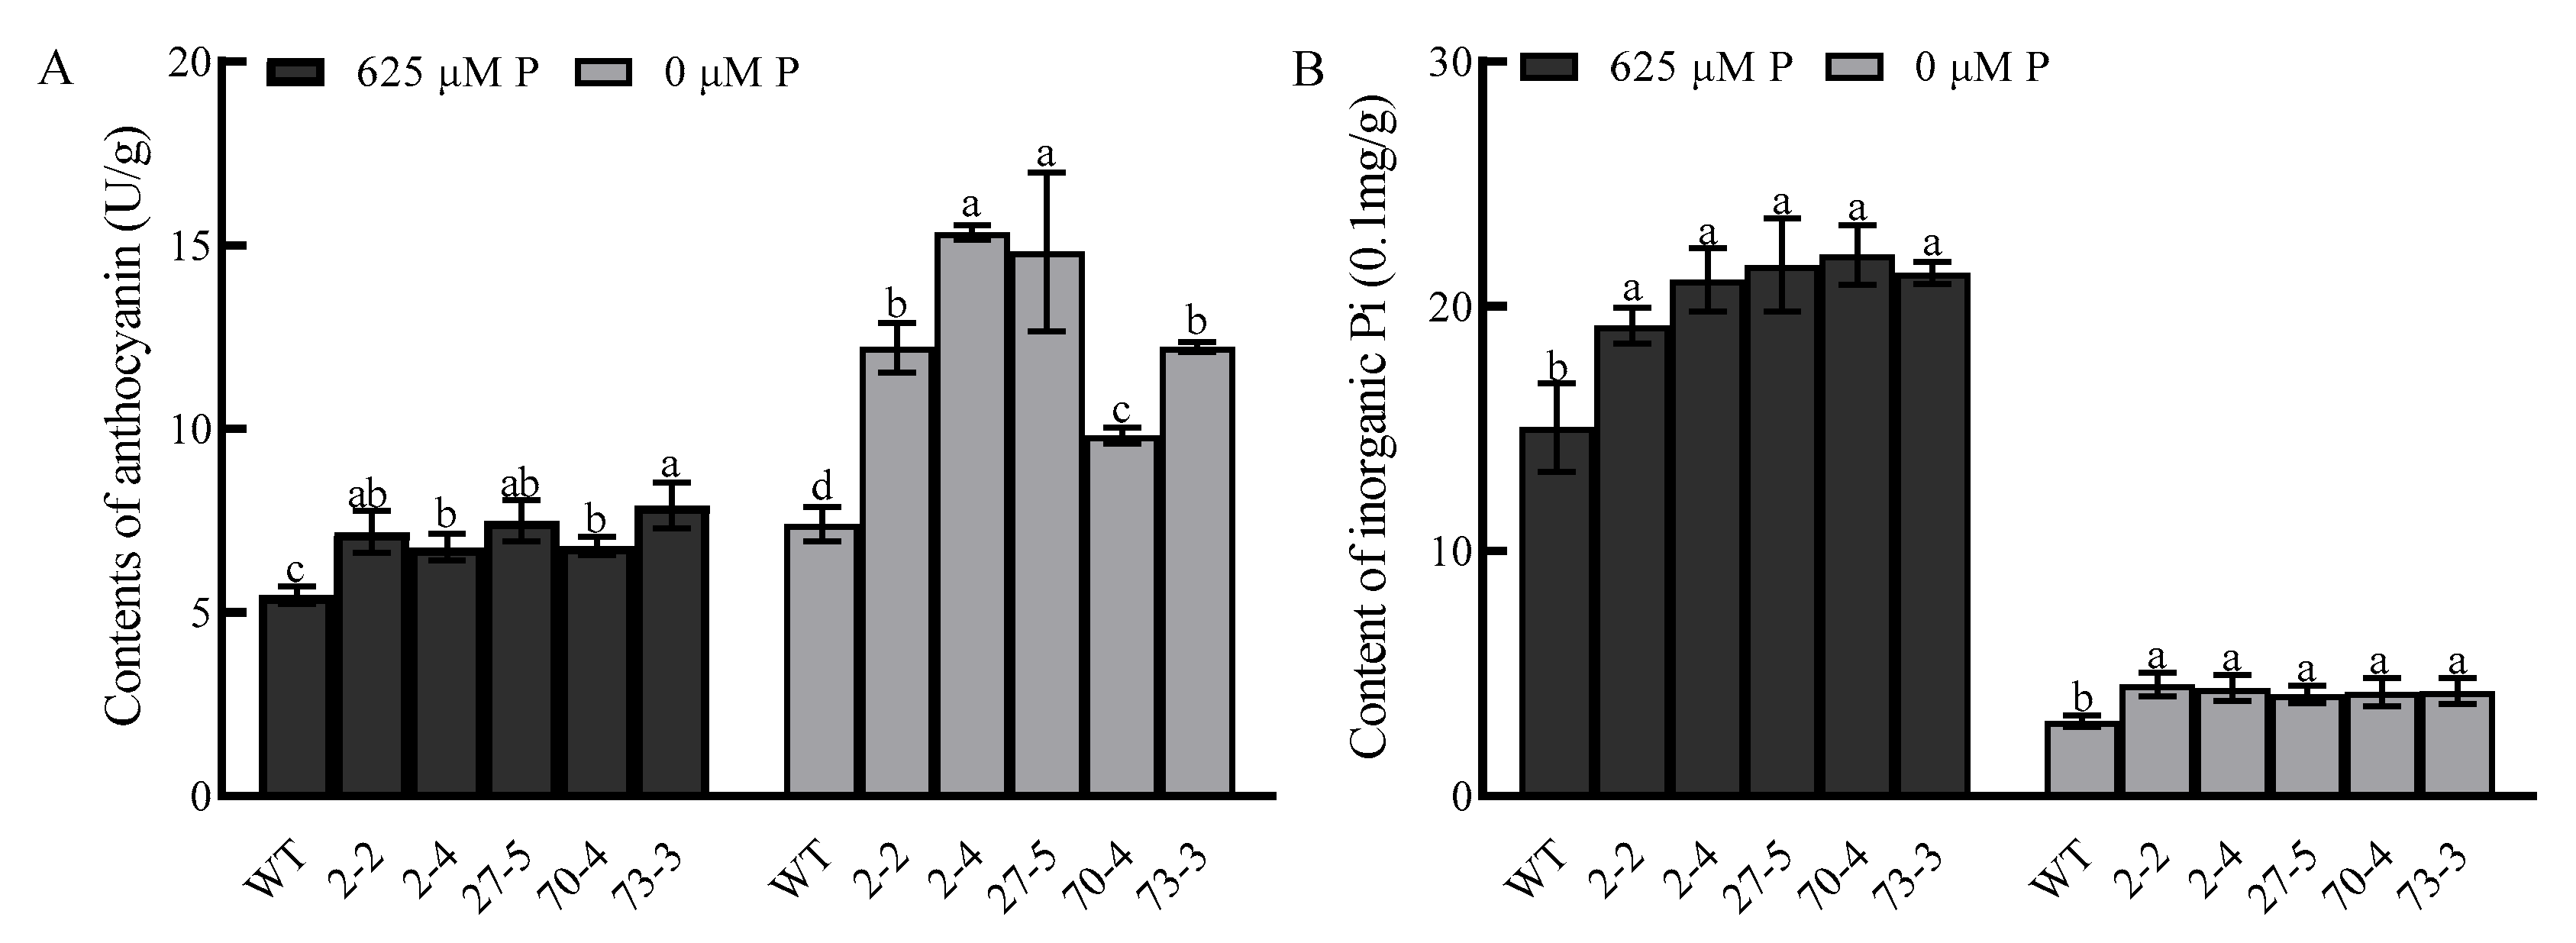
2.8. Anthocyanin and Inorganic Phosphorus Measurement

All BnaA01.KAN3 overexpression lines showed a higher content of anthocyanin than the wild type under normal and low-phosphorus treatments, and even the increased proportion is higher in the overexpression lines (Figure 7A). Additionally, the overexpression lines possessed more inorganic phosphorus than the wild type when treated with normal and low-phosphorus treatments, but the decreased proportion is also higher in the overexpression lines (Figure 7B). These results imply that BnaA01.KAN3 overexpression could enhance the tolerance to low-phosphorus stress in A. thaliana.

3. Discussion

The response to low-phosphorus stress is strictly regulated by a group of transcription factors in plants. As is well known, the P1BS was a key cis-element, serving as a conserved binding site by transcription factors in the signal transduction of low-phosphorus stress [17,18,19]. In this study, a novel KANADI family protein, BnaA01.KAN3, was observed to undergo specific binding to P1BS in in vivo and in vitro, respectively. Broadly, phosphorus starvation response gene expression does not particularly change under low-phosphorus treatment, which function as long-distance or systemic sensing pathways that trigger each other in plants [17]. According to the results of the BnaA01.KAN3 gene’s relative expression level with the low-phosphorus treatment, we speculated that the transcription factor BnaA01.KAN3 is an important executor leading to precise regulation in the target gene. In addition, the tissue-specific expression pattern indicates that the BnaA01.KAN3 gene is involved in phosphorus metabolism and recycling in seed development.
In allotetraploid B. napus, four homologous genes were presented in the A and C genomes. A phylogenetic analysis showed that BnaA01.KAN3 had the highest homology to the gene from Brassica rapa, indicating that these genes have conserved evolution among cruciferous species. The specific molecular function of BnaA01.KAN3 was characterized through heterologous overexpression in A. thaliana. The root morphology is the main phenotypic characteristic in plants adapting to low-phosphorus stress [20,21]. There were no significant differences in root length and the number of lateral roots between the wild type and overexpression lines cultured on the medium with a normal phosphorus concentration. However, the root length was longer and the number of lateral roots was higher than that of the wild type cultured on the medium with a low phosphorus concentration, respectively. On the other hand, a common physiological feature of the low-phosphorus response in plants is the development of anthocyanin accumulation brought about by anthocyanin biosynthetic enzymes [22]. The significant increase in anthocyanin may indicate that the BnaA01.KAN3 gene could enhance the resistance of the overexpression lines under phosphorus-deficient conditions. Meanwhile, overexpression lines have more inorganic phosphorus than the wild type whether they are cultured on a medium with a normal or low phosphorus concentration. A possible explanation is that phosphorus absorption or cyclic metabolic utilization was enhanced by the BnaA01.KAN3 gene’s overexpression [23,24].

4. Materials and Methods

4.1. Plant Materials

The B. napus cv. ‘Zhongshuang 11’, N. tabacum, and A. thaliana (col-0) were used as plant materials for gene cloning and genetic transformation, respectively. For plantlet greenhouse cultivation, 16/8 h light and dark cycles were carried out, with a 25 °C average temperature and 50–60% relative humidity.

4.2. Yeast One-Hybrid Assay and EMSA

The coding sequences of BnaA01.KAN3 were cloned from the cDNA of ‘Zhongshuang 11’ through RT-PCR; the primers are listed in Supplementary Table S1. Then, the fragment was subcloned into the vectors pGADT7 and pET28a for the yeast one-hybrid assay and EMSA according to the protocols of the Matchmaker Gold Yeast One-Hybrid Library Screening System (Cat. No. 630491, Clontech, Mountain View, CA, USA) and the LightShift Chemiluminescent EMSA Kit (Cat. No. 20148, Thermo, Rockford, IL, USA). The cis-element P1BS and its mutant sequence were synthesized by two antiparallel oligonucleotides with overhanging sticky ends for cloning into the appropriately digested pAbAi vector. In addition, the probe was labeled by using the Biotin 3′ End DNA Labeling Kit (Cat. No. 89818, Thermo, Rockford, IL, USA).

4.3. Bioinformatics Analysis

Information about the BnaA01.KAN3 gene was retrieved from the NCBI database, and species closely related to B. napus were selected for homologous analysis. A phylogenetic tree with nine homologous members of other Brassicaceae was created using MEGA software (version 7.0) with the neighbor-joining method, and the bootstrap test was repeated 1000 times.

4.4. RT-qPCR

For the tissue-specific expression pattern of BnaA01.KAN3, the total RNA was extracted from the roots, stems, leaves, flowers, and seeds in different developmental stages (15, 20, 25, 30, 35, 40, 45, and 50 days after pollination) of the ‘Zhongshuang 11’ cultivar. On the other hand, the total RNA from the plantlet with or without low-phosphorus treatment was used to analyze the response to phosphorus starvation. The B. napus SUMO E2 ligase encoding gene (BnaUBC9) was used as a reference gene. All of the primers are listed in Supplementary Table S1. The RT-qPCR was repeated three biological times, and the results were calculated according to the 2−ΔΔCt analysis method [25]. The means of the relative expression level were analyzed for variance using the least significant difference test at the p < 0.05 level of significance with SPSS software (version 27.0.1).

4.5. Transcription Auto-Activation Analysis

In the transcription auto-activation assay, we cloned the BnaA01.KAN3 gene through homologous recombination with the pGBKT7-FP and pGBKT7-RP sequences, which are listed in Supplementary Table S1. Then, the pGBKT7-BD empty vector and pGBKT7-BD-BnaA01.KAN3 vector were transformed into the yeast strain Y2HGold with two reporter genes (HIS3 and MEL1) and then spread on SD/-Trp, SD/-Trp-His and SD/-Trp-His plus X-α-gal plates, respectively. The plates were cultured at 30 °C in an incubator for 3–5 days to observe the growth of the yeast.

4.6. Subcellular Localization Analysis

The recombinant pCAMBIA1305.1-35S-BnaA01.KAN3-GFP vector was transformed into A. tumefaciens GV3101 for transient expression in tobacco leaves. Mixed bacterial infection liquid including OsD53-mCherry as a nuclear marker was injected into the epidermis of tobacco leaves and dark-cultured for 48 h. Fluorescence signal was detected using an LSM980 laser scanning confocal microscope (Carl Zeiss, Oberkochen, Germany). For GFP signals, 488 nm and 505–530 nm were used as the excitation and emission wavelengths, respectively, while 587 nm and 600–630 nm wavelengths were used for OsD53-mCherry signals.

4.7. Plant Transformation and Confirmation

For BnaA01.KAN3 overexpression, the pCAMBIA1305.1-35S-Nos recombinant vector, by homologous recombination, was used for transformation into A. thaliana (col-0) through mediated A. tumefaciens GV3101. The positive transformants were identified by PCR. For screened single-copy insertion transgenic lines, the seeds of independent T2 were detected following Mendel’s law of inheritance segregation through the chi-square test. The formula is χ2 = |A − 3 × B|^2/[3 × (A + B)], where A and B represent the numbers of positive and negative plants, respectively. If χ2 is less than 3.84, this indicates that the transgenic line is a single-copy insertion at the significant level of 0.05. Then, 10 plants from each candidate line were transplanted to the soil and normally cultivated in the greenhouse until T3 generation seeds were harvested. Furthermore, the non-separated T3 lines were selected for the low-phosphorus treatment analysis.

4.8. Phenotype and Physiological Indicator Analysis with Low-Phosphorus Treatment

The wild type (col-0) and five independent lines (No. 2-2, 2-4, 27-5, 70-4, and 73-3) of single-copy insertion homozygous T3 seeds were cultured in a greenhouse as previously described. For a phenotype analysis of tap and lateral roots, 7 days after germination, the seedlings were transferred onto 1/2 MS solid medium with normal (625 μM P) and low-phosphorus (0 μM P) treatment for 7 days. Meanwhile, the contents of anthocyanin and inorganic phosphorus were measured in the wild type and overexpression lines with or without treatment, respectively. After seed germination, the seedlings were transferred to 1/5 Hoagland liquid nutrient solution for 3 weeks. Then, the treatment was conducted as previously mentioned. The determination of anthocyanin and inorganic phosphorus contents was conducted according to the protocols of the Test Kit (ADS116P0 and ADS099TC1, AIDISHENG). All experiments were repeated three biological times. The means of the data were analyzed for variance using the least significant difference test at the p < 0.05 level of significance using SPSS software.

5. Conclusions

The transcription factor BnaA01.KAN3, which is located in the nucleus and has transcriptional activation, is a key factor in the response to low phosphorus. The above results indicate that the transcription factor BnaA01.KAN3 could promote anthocyanin accumulation and inorganic phosphorus absorption through binding to the low-phosphorus response cis-element P1BS. Furthermore, in A. thaliana overexpression lines, BnaA01.KAN3 significantly reshapes the root architecture, increasing the length of the taproot and enhancing the formation of lateral roots. Thus, this work will provide insights for improving phosphorus use efficiency in the abiotic breeding of B. napus.

Supplementary Materials

The following supporting information can be downloaded at: https://www.mdpi.com/article/10.3390/plants14132036/s1, Table S1: Information of primer sequences; Table S2: The segregation ratio of overexpression independent T2 lines; Figure S1: PCR identification of T1 lines; Figure S2: The relative expression level of BnaA01.KAN3 in 5 independent single copy insertion T3 lines.

Author Contributions

Conceptualization, H.L. and Y.G.; Funding Acquisition, H.L.; Investigation, L.H. and S.P.; Methodology, L.H., S.P., R.L. and P.C.; Validation, S.P., L.H., R.L., J.Z. and P.C.; Writing—Original Draft, L.H., S.P. and P.C.; Writing—Review and Editing, H.L. and Y.G. All authors have read and agreed to the published version of the manuscript.

Funding

This work was supported by the National Natural Science Foundation of China (32071929), the Natural Science Foundation of Zhejiang Province (LY21C130001), National Key Research and Development Program of China (2022YFD1200403), and the Agricultural Science and Technology Project by Three Rural and Nine Institutions of Zhejiang Province (2024SNJF008-1).

Data Availability Statement

The original contributions presented in this study are included in the article and Supplementary Materials; further inquiries can be directed to the corresponding author.

Conflicts of Interest

The authors declare that they have no competing interests.

References

  1. Margalef, O.; Sardans, J.; Fernández-Martínez, M.; Molowny-Horas, R.; Janssens, I.A.; Ciais, P.; Goll, D.; Richter, A.; Obersteiner, M.; Asensio, D.; et al. Global patterns of phosphatase activity in natural soils. Sci. Rep. 2017, 7, 1337. [Google Scholar] [CrossRef]
  2. Nussaume, L.; Kanno, S.; Javot, H.; Marin, E.; Pochon, N.; Ayadi, A.; Nakanishi, T.M.; Thibaud, M.C. Phosphate import in plants: Focus on the PHT1 transporters. Front. Plant Sci. 2011, 2, 12. [Google Scholar] [CrossRef]
  3. Yang, S.-Y.; Huang, T.-K.; Kuo, H.-F.; Chiou, T.-J. Role of vacuoles in phosphorus storage and remobilization. J. Exp. Bot. 2017, 68, 3045–3055. [Google Scholar] [CrossRef] [PubMed]
  4. Sobkowiak, L.; Bielewicz, D.; Malecka, E.M.; Jakobsen, I.; Albrechtsen, M.; Szweykowska-Kulinska, Z.; Pacak, A. The role of the P1BS element containing promoter-driven genes in Pi transport and homeostasis in plants. Front. Plant Sci. 2012, 3, 20102. [Google Scholar] [CrossRef] [PubMed]
  5. Xiao, J.; Zhou, Y.; Xie, Y.; Li, T.; Su, X.; He, J.; Jiang, Y.; Zhu, H.; Qu, H. ATP homeostasis and signaling in plants. Plant Commun. 2024, 5, 100834. [Google Scholar] [CrossRef] [PubMed]
  6. Nakamura, Y. Phosphate starvation and membrane lipid remodeling in seed plants. Prog. Lipid Res. 2013, 52, 43–50. [Google Scholar] [CrossRef]
  7. Lambers, H. Phosphorus acquisition and utilization in plants. Annu. Rev. Plant Biol. 2022, 73, 17–42. [Google Scholar] [CrossRef]
  8. Bates, T.R.; Lynch, J.P. Stimulation of root hair elongation in Arabidopsis thaliana by low phosphorus availability. Plant Cell Environ. 1996, 19, 529–538. [Google Scholar] [CrossRef]
  9. Rubio, V.; Linhares, F.; Solano, R.; Martín, A.C.; Iglesias, J.; Leyva, A.; Paz-Ares, J. A conserved MYB transcription factor involved in phosphate starvation signaling both in vascular plants and in unicellular algae. Genes Dev. 2001, 15, 2122–2133. [Google Scholar] [CrossRef]
  10. Eshed, Y.; Baum, S.F.; Perea, J.V.; Bowman, J.L. Establishment of polarity in lateral organs of plants. Curr. Biol. 2001, 11, 1251–1260. [Google Scholar] [CrossRef]
  11. Eshed, Y.; Izhaki, A.; Baum, S.F.; Floyd, S.K.; Bowman, J.L. Asymmetric leaf development and blade expansion in Arabidopsis are mediated by KANADI and YABBY activities. Development 2004, 131, 2997–3006. [Google Scholar] [CrossRef] [PubMed]
  12. Shen, Y.; Chen, J.; Liu, H.; Zhu, W.; Chen, Z.; Zhang, L.; Du, R.; Wu, Z.; Liu, S.; Zhou, S.; et al. Genome-wide identification and analysis of phosphate utilization related genes (PURs) reveal their roles involved in low phosphate responses in Brassica napus L. BMC Plant Biol. 2025, 25, 326. [Google Scholar] [CrossRef]
  13. Zhao, Z.; Wang, Y.; Shi, J.; Wang, S.; White, P.J.; Shi, L.; Xu, F. Effect of balanced application of boron and phosphorus fertilizers on soil bacterial community, seed yield and phosphorus use efficiency of Brassica napus. Sci. Total. Environ. 2021, 751, 141644. [Google Scholar] [CrossRef] [PubMed]
  14. Zhao, Z.; Wang, S.; White, P.J.; Wang, Y.; Shi, L.; Xu, F. Boron and phosphorus act synergistically to modulate absorption and distribution of phosphorus and growth of Brassica napus. J. Agric. Food Chem. 2020, 68, 7830–7838. [Google Scholar] [CrossRef]
  15. Yuan, P.; Ding, G.-D.; Cai, H.-M.; Jin, K.-M.; Broadley, M.R.; Xu, F.-S.; Shi, L. A novel Brassica–rhizotron system to unravel the dynamic changes in root system architecture of oilseed rape under phosphorus deficiency. Ann. Bot. 2016, 118, 173–184. [Google Scholar] [CrossRef]
  16. Gaude, N.; Nakamura, Y.; Scheible, W.R.; Ohta, H.; Dörmann, P. Phospholipase C5 (NPC5) is involved in galactolipid accumulation during phosphate limitation in leaves of Arabidopsis. Plant J. 2008, 56, 28–39. [Google Scholar] [CrossRef] [PubMed]
  17. Sega, P.; Pacak, A. Plant PHR transcription factors: Put on a map. Genes 2019, 10, 1018. [Google Scholar] [CrossRef]
  18. Schünmann, P.H.D.; Richardson, A.E.; Smith, F.W.; Delhaize, E. Characterization of promoter expression patterns derived from the Pht1 phosphate transporter genes of barley (Hordeum vulgare L.). J. Exp. Bot. 2004, 55, 855–865. [Google Scholar] [CrossRef]
  19. Schünmann, P.H.; Richardson, A.E.; Vickers, C.E.; Delhaize, E. Promoter analysis of the barley Pht1;1 phosphate transporter gene identifies regions controlling root expression and responsiveness to phosphate deprivation. Plant Physiol. 2004, 136, 4205–4214. [Google Scholar] [CrossRef]
  20. Matthus, E.; Doddrell, N.H.; Guillaume, G.; Mohammad-Sidik, A.B.; Wilkins, K.A.; Swarbreck, S.M.; Davies, J.M. Phosphate deprivation can impair mechano-stimulated cytosolic free calcium elevation in Arabidopsis roots. Plants 2020, 9, 1205. [Google Scholar] [CrossRef]
  21. Ngo, A.H.; Nakamura, Y.; Takahashi, H. Phosphate starvation-inducible GLYCEROPHOSPHODIESTER PHOSPHODIESTERASE6 is involved in Arabidopsis root growth. J. Exp. Bot. 2022, 73, 2995–3003. [Google Scholar] [CrossRef] [PubMed]
  22. Vance, C.P.; Uhde-Stone, C.; Allan, D.L. Phosphorus acquisition and use: Critical adaptations by plants for securing a nonrenewable resource. New Phytol. 2003, 157, 423–447. [Google Scholar] [CrossRef] [PubMed]
  23. Nilsson, L.; Müller, R.; Nielsen, T.H. Dissecting the plant transcriptome and the regulatory responses to phosphate deprivation. Physiol. Plant. 2010, 139, 129–143. [Google Scholar] [CrossRef] [PubMed]
  24. Plaxton, W.C.; Tran, H.T. Metabolic adaptations of phosphate-starved plants. Plant Physiol. 2011, 156, 1006–1015. [Google Scholar] [CrossRef]
  25. Livak, K.J.; Schmittgen, T.D. Analysis of relative gene expression data using real-time quantitative PCR and the 2(-Delta Delta C(T)) Method. Methods 2001, 25, 402–408. [Google Scholar] [CrossRef]
Figure 1. Identification of interaction between transcription factor BnaA01.KAN3 and cis-element P1BS by yeast one-hybrid assay (A) and EMSA (B). A: Yeast one-hybrid assay was used to confirm that transcription factor BnaA01.KAN3 interacted with cis-element P1BS in in vivo; B: EMSA was used to confirm in vitro interaction. BnaA01.KAN3-His: vector of pET28a contained BnaA01.KAN3 gene.
Plants 14 02036 g001
Figure 2. Phylogenetic tree of BnaA01.KAN3 with homologous protein sequence. Red star indicates BnaA01.KAN3. Homologous genes from other four species (B. rapa B. oleracea, R. sativus, and A. thaliana) were used in phylogenetic tree analysis.
Plants 14 02036 g002
Figure 3. The relative expression level of BnaA01.KAN3 in different tissues (A) and the response of B. napus to low-phosphorus stress (B). Values are shown as the means of three biological replicates, with error bars representing the standard deviation, and those with the same letter are not significantly different at p < 0.05. The statistical analysis showed the least significant difference.
Plants 14 02036 g003
Figure 4. Transcriptional auto-activation analysis of BnaA01.KAN3.
Plants 14 02036 g004
Figure 5. The subcellular localization of BnaA01.KAN3. The fluorescence signal of the fusion protein was observed in the epidermal cells of tobacco leaves. The OsD53-mCherry protein was located in the nucleus as a control.
Plants 14 02036 g005
Figure 6. Seedling phenotypes and root statistics of independent lines with BnaA01.KAN3 overexpression in A. thaliana under normal (625 μM P) and low-phosphorus treatments (0 μM P). (A) The above-ground and root phenotypes of the plantlet with normal phosphorus treatment. (B) The above-ground and root phenotypes of the plantlet with low-phosphorus treatment. (C) The length of the taproot between the wild type and overexpression lines with normal and low-phosphorus treatments. (D) The number of lateral roots between the wild type and overexpression lines with normal and low-phosphorus treatments. The values are shown as the means of three biological replicates, with error bars representing the standard deviation. Bars with the same letter are not significantly different at p < 0.05. The statistical analysis showed the least significant difference.
Plants 14 02036 g006
Figure 7. Anthocyanin (A) and inorganic phosphorus (B) analysis in wild type and overexpression lines under normal (625 μM P) and low-phosphorus treatments (0 μM P). Values are shown as means of three biological replicates, with error bars representing standard deviation; bars followed by same letter are not significantly different at p < 0.05. Statistical analysis showed least significant difference.
Plants 14 02036 g007
Disclaimer/Publisher’s Note: The statements, opinions and data contained in all publications are solely those of the individual author(s) and contributor(s) and not of MDPI and/or the editor(s). MDPI and/or the editor(s) disclaim responsibility for any injury to people or property resulting from any ideas, methods, instructions or products referred to in the content.

