Article

Yield Increase and Emission Reduction Effects of Alfalfa in the Yellow River Irrigation District of Gansu Province: The Coupling Mechanism of Biodegradable Mulch and Controlled-Release Nitrogen Fertilizer

1
College of Water Conservancy and Hydrpower Engineering, Gansu Agricultural University, Lanzhou 730070, China
2
Gansu Province Jingtai Chuan Power Irrigation Water Resource Utilization Center, Baiyin 730400, China
*
Authors to whom correspondence should be addressed.
Plants 2025, 14(13), 2022; https://doi.org/10.3390/plants14132022
Submission received: 27 May 2025 / Revised: 29 June 2025 / Accepted: 30 June 2025 / Published: 2 July 2025
(This article belongs to the Special Issue Advances in Plant Nutrition and Novel Fertilizers—Second Edition)

Abstract

Agricultural production in Northwest China is widely constrained by residual plastic film pollution, excessive greenhouse gas emissions, and low productivity. Integrating biodegradable film with controlled-release nitrogen fertilizer offers a promising approach to optimize crop management, enhance yield, and improve environmental outcomes. In this study, three planting patterns (conventional flat planting, FP; ridge mulching with biodegradable film, BM; and ridge mulching with conventional plastic film, PM), two nitrogen fertilizer types (urea, U, and controlled-release nitrogen fertilizer, C), and four nitrogen application rates (0, 80, 160, and 240 kg·hm−2) were applied to systematically investigate their effects on alfalfa yield and N2O emissions from grasslands. The results showed that BM and PM increased alfalfa yield by 23.49% and 18.65%, respectively, compared to FP, while C increased yield by 8.46% compared to urea. The highest yield (24.84 t·hm−2) was recorded under the BMC2 treatment, which was 97.11% higher than that of FPN0. N2O emission flux and cumulative emissions increased with nitrogen application rate. Compared with U, C reduced cumulative N2O emissions and greenhouse gas emission intensity (GHGI) by 23.89% and 25.84%, respectively. Compared to PM, BM reduced cumulative N2O emissions and GHGI by 11.58% and 20.15%, respectively. Principal component analysis indicated that the combination of ridge mulching with biodegradable film and 160 kg·hm−2 of C was optimal for simultaneously increasing alfalfa yield and reducing N2O emissions, making it a suitable planting–fertilization strategy for the Yellow River irrigation district in Gansu and similar ecological regions.

1. Introduction

Global climate warming continues to intensify, posing serious challenges to human society and ecosystems [1]. Greenhouse gas (GHG) emissions are the primary driver of global warming. Among the three major GHGs-CO2, CH4, and N2O, N2O has a global warming potential (GWP) 298 times higher than CO2 over a 100-year time scale [2]. According to the IPCC AR6 (2023) report, anthropogenic N2O emissions account for approximately 40% of total global emissions, with agriculture contributing more than 70% [3]. In agricultural production systems, N2O emissions are closely linked to soil nitrification and denitrification processes regulated by biological and environmental factors, with environmental effects largely determined by field management practices [4]. However, current agricultural production is often constrained by extensive field management, simplistic planting patterns, and a focus on productivity at the expense of ecological outcomes [5]. Therefore, optimizing cropping management to synergistically enhance both productivity and environmental sustainability is essential for promoting agricultural transformation and high-quality development.
Nitrogen is a vital nutrient for crop growth and development. Rational nitrogen fertilization is key to replenishing soil nitrogen reserves and ensuring high crop productivity [6]. In contrast, improper N application can lead to nitrate accumulation in plant tissues; disrupt nitrogen metabolism; reduce photosynthetic efficiency [7]; and result in low fertilizer use efficiency, resource waste, soil acidification, compaction, and increased N2O emissions [8]. To improve nitrogen use efficiency (NUE), extensive research has focused on developing novel nitrogen fertilizers, improving application techniques, and optimizing planting systems. Studies have shown that, compared with conventional urea, new-generation nitrogen fertilizers, such as slow-release fertilizers, biofertilizers, and stabilized nitrogen fertilizers (containing nitrification and urease inhibitors), can achieve stable and sustained nutrient release via physical coating, chemical inhibition, or biological activation, thereby enhancing root growth and crop yield. These fertilizers also reduce substrate concentrations for nitrification and lower agricultural N2O emissions [9]. In addition, liquid nitrogen fertilizers and organic–inorganic compound fertilizers have demonstrated good performance in agricultural production [10,11]. Significant advances have also been made in nitrogen application technologies, including split application, side-dressing, deep placement, and precision fertilization. Compared with broadcast application, deep placement or hole fertilization can enhance ammonium (NH4+) adsorption by soil particles, reduce NH4+-N diffusion, and inhibit nitrification at localized high concentrations, thereby prolonging fertilizer effectiveness and reducing N losses [12,13]. Split application aligns nitrogen supply with crop demand at key growth stages, significantly improving NUE [14]. Spectral-based variable rate fertilization, using multispectral and hyperspectral sensors combined with machine learning algorithms, can monitor crop canopy reflectance in real time to diagnose nitrogen status and generate prescription maps, enabling precision fertilization at the field scale and reducing nitrogen leaching and volatilization [15]. Water-fertilizer integration technology, as exemplified by Israel, achieves precise supply of nutrients through pressure-compensated drip heads, resulting in a nitrogen fertilizer utilization rate of 60~80% and a significant reduction in agricultural surface pollution [16]. Planting patterns also regulate the spatial distribution of light, heat, water, and nutrients, influencing microbial abundance and activity and thus driving soil nitrogen cycling processes [17]. Studies have shown that, compared with flat planting, ridge planting improves rhizosphere conditions, promotes microbial proliferation and nutrient transformation, and enhances crop yield as well as water and light use efficiency [18]. When combined with field mulching, ridge planting improves surface energy balance and water redistribution. Designing the structure of a ridge–furrow system is a key aspect of ridge cultivation technology. Zhang et al. [19] found that when the ridge–furrow ratio was 60 cm:60 cm, the rainwater collection efficiency was significantly higher than that of traditional earth ridges on the Loess Plateau, China. Liu et al. [20] found that when the ridge–furrow ratio was 75 cm:50 cm, it could increase the photosynthetic rate and yield of wheat on the Huang Huaihai Plain, China. Ridge cultivation combined with plastic mulching effectively reduces soil moisture evaporation, promotes the convergence of rainfall on the ridge surface into the furrows, increases the infiltration depth and water-holding capacity of soil moisture in the furrows, and forms a synergistic mechanism of dynamic water exchange and complementarity between ridges and furrows. In the arid Loess Plateau, the fully mulched ridge–furrow system increases precipitation use efficiency to over 70%, 20~25% higher than flat planting [21]. In the black soil region of Northeast China, ridge mulching increases effective accumulated temperature and advances maize phenology by 7~10 days [22]. Straw mulching, by providing physical insulation, buffers environmental fluctuations, stabilizes soil temperature and moisture, and suppresses N2O emission spikes triggered by drying–rewetting cycles [23]. In recent years, environmentally friendly mulching materials such as liquid films and biodegradable films have also been increasingly applied in agricultural production [24].
In summary, while substantial progress has been made in optimizing nitrogen management and cropping systems, most studies have focused on either fertilization or planting pattern as a single factor. Few have addressed the synergistic effects of combined planting–fertilization regimes on crop performance and N2O emissions, and most existing studies focus on annual food and cash crops [25,26,27], with limited research on perennial forage crops, especially alfalfa. Alfalfa (Medicago sativa L.), the most widely cultivated perennial legume forage worldwide, is known as the “Queen of Forages” due to its high protein content, strong adaptability, and excellent ecological benefits [28]. However, its efficient nitrogen fixation exacerbates nitrogen management complexity, and N2O emission fluxes from alfalfa systems are generally higher than those of other crops [29]. With abundant sunshine and large diurnal temperature variation, Gansu Province offers ideal conditions for alfalfa cultivation and has become one of China’s primary high-quality alfalfa production regions [30]. Given this context, this study systematically investigated the effects of planting pattern, nitrogen fertilizer type, and nitrogen application rate on alfalfa yield and N2O emissions, with the objectives to (1) quantify the differences in N2O emission indicators under different planting–fertilization regimes; (2) identify the key factors influencing N2O emissions from alfalfa grasslands; and (3) establish a planting–fertilization model for achieving yield enhancement and emission reduction in alfalfa systems.

2. Results and Analysis

2.1. Alfalfa Yield Response to Planting–Fertilization Regimes

Except for the interaction between nitrogen application rate and nitrogen type in 2023 and the interaction between planting pattern and nitrogen type in 2024, which showed no significant effects on alfalfa yield (p > 0.05), all other main effects and interactions significantly influenced alfalfa yield (p < 0.05; Table 1).
Under the C application, alfalfa yield initially increased and then decreased with an increase in the nitrogen rate. Yields under BM and PM were significantly higher than under FP (Figure 1a,c). Within the same planting pattern, the yield of C2 in 2023 was significantly higher than those of N0, C1, and C3 by 54.21%, 24.20%, and 11.77%, respectively; in 2024, the corresponding increases were 50.83%, 21.67%, and 12.71%. At the same nitrogen level, BM and PM treatments in 2023 significantly increased alfalfa yield compared to FP by 43.56% and 30.07%, respectively; in 2024, the increases were 31.49% and 17.05%, respectively. Among all C treatments, BMC2 produced the highest alfalfa yield (two-year average: 24.84 t·hm−2), which was not significantly different from BMC3 and PMC2 but was significantly higher than FPN0, BMN0, and FPC2 by 97.11%, 59.63%, and 35.74%, respectively. Under the U application, alfalfa yields ranged from 13.34 to 21.06 t·hm−2 in 2023 and from 15.62 to 24.14 t·hm−2 in 2024. The yield patterns with an increase in the nitrogen rate and under different planting modes were generally consistent with those observed under C. Among all U treatments, BMU2 had the highest yield (two-year average: 22.60 t·hm−2), not significantly different from BMC2 and PMC2 but significantly higher than FPN0, BMN0, and FPU2 by 77.18%, 43.49%, and 30.33%, respectively. At the same nitrogen rate and planting mode, C application increased alfalfa yield by 8.46% compared with U (Figure 1b,d). Thus, the BMC2 treatment achieved the optimal yield performance.

2.2. Effects of Planting–Fertilization Regimes on Soil N2O Emissions

2.2.1. N2O Emission Flux and Cumulative Emissions

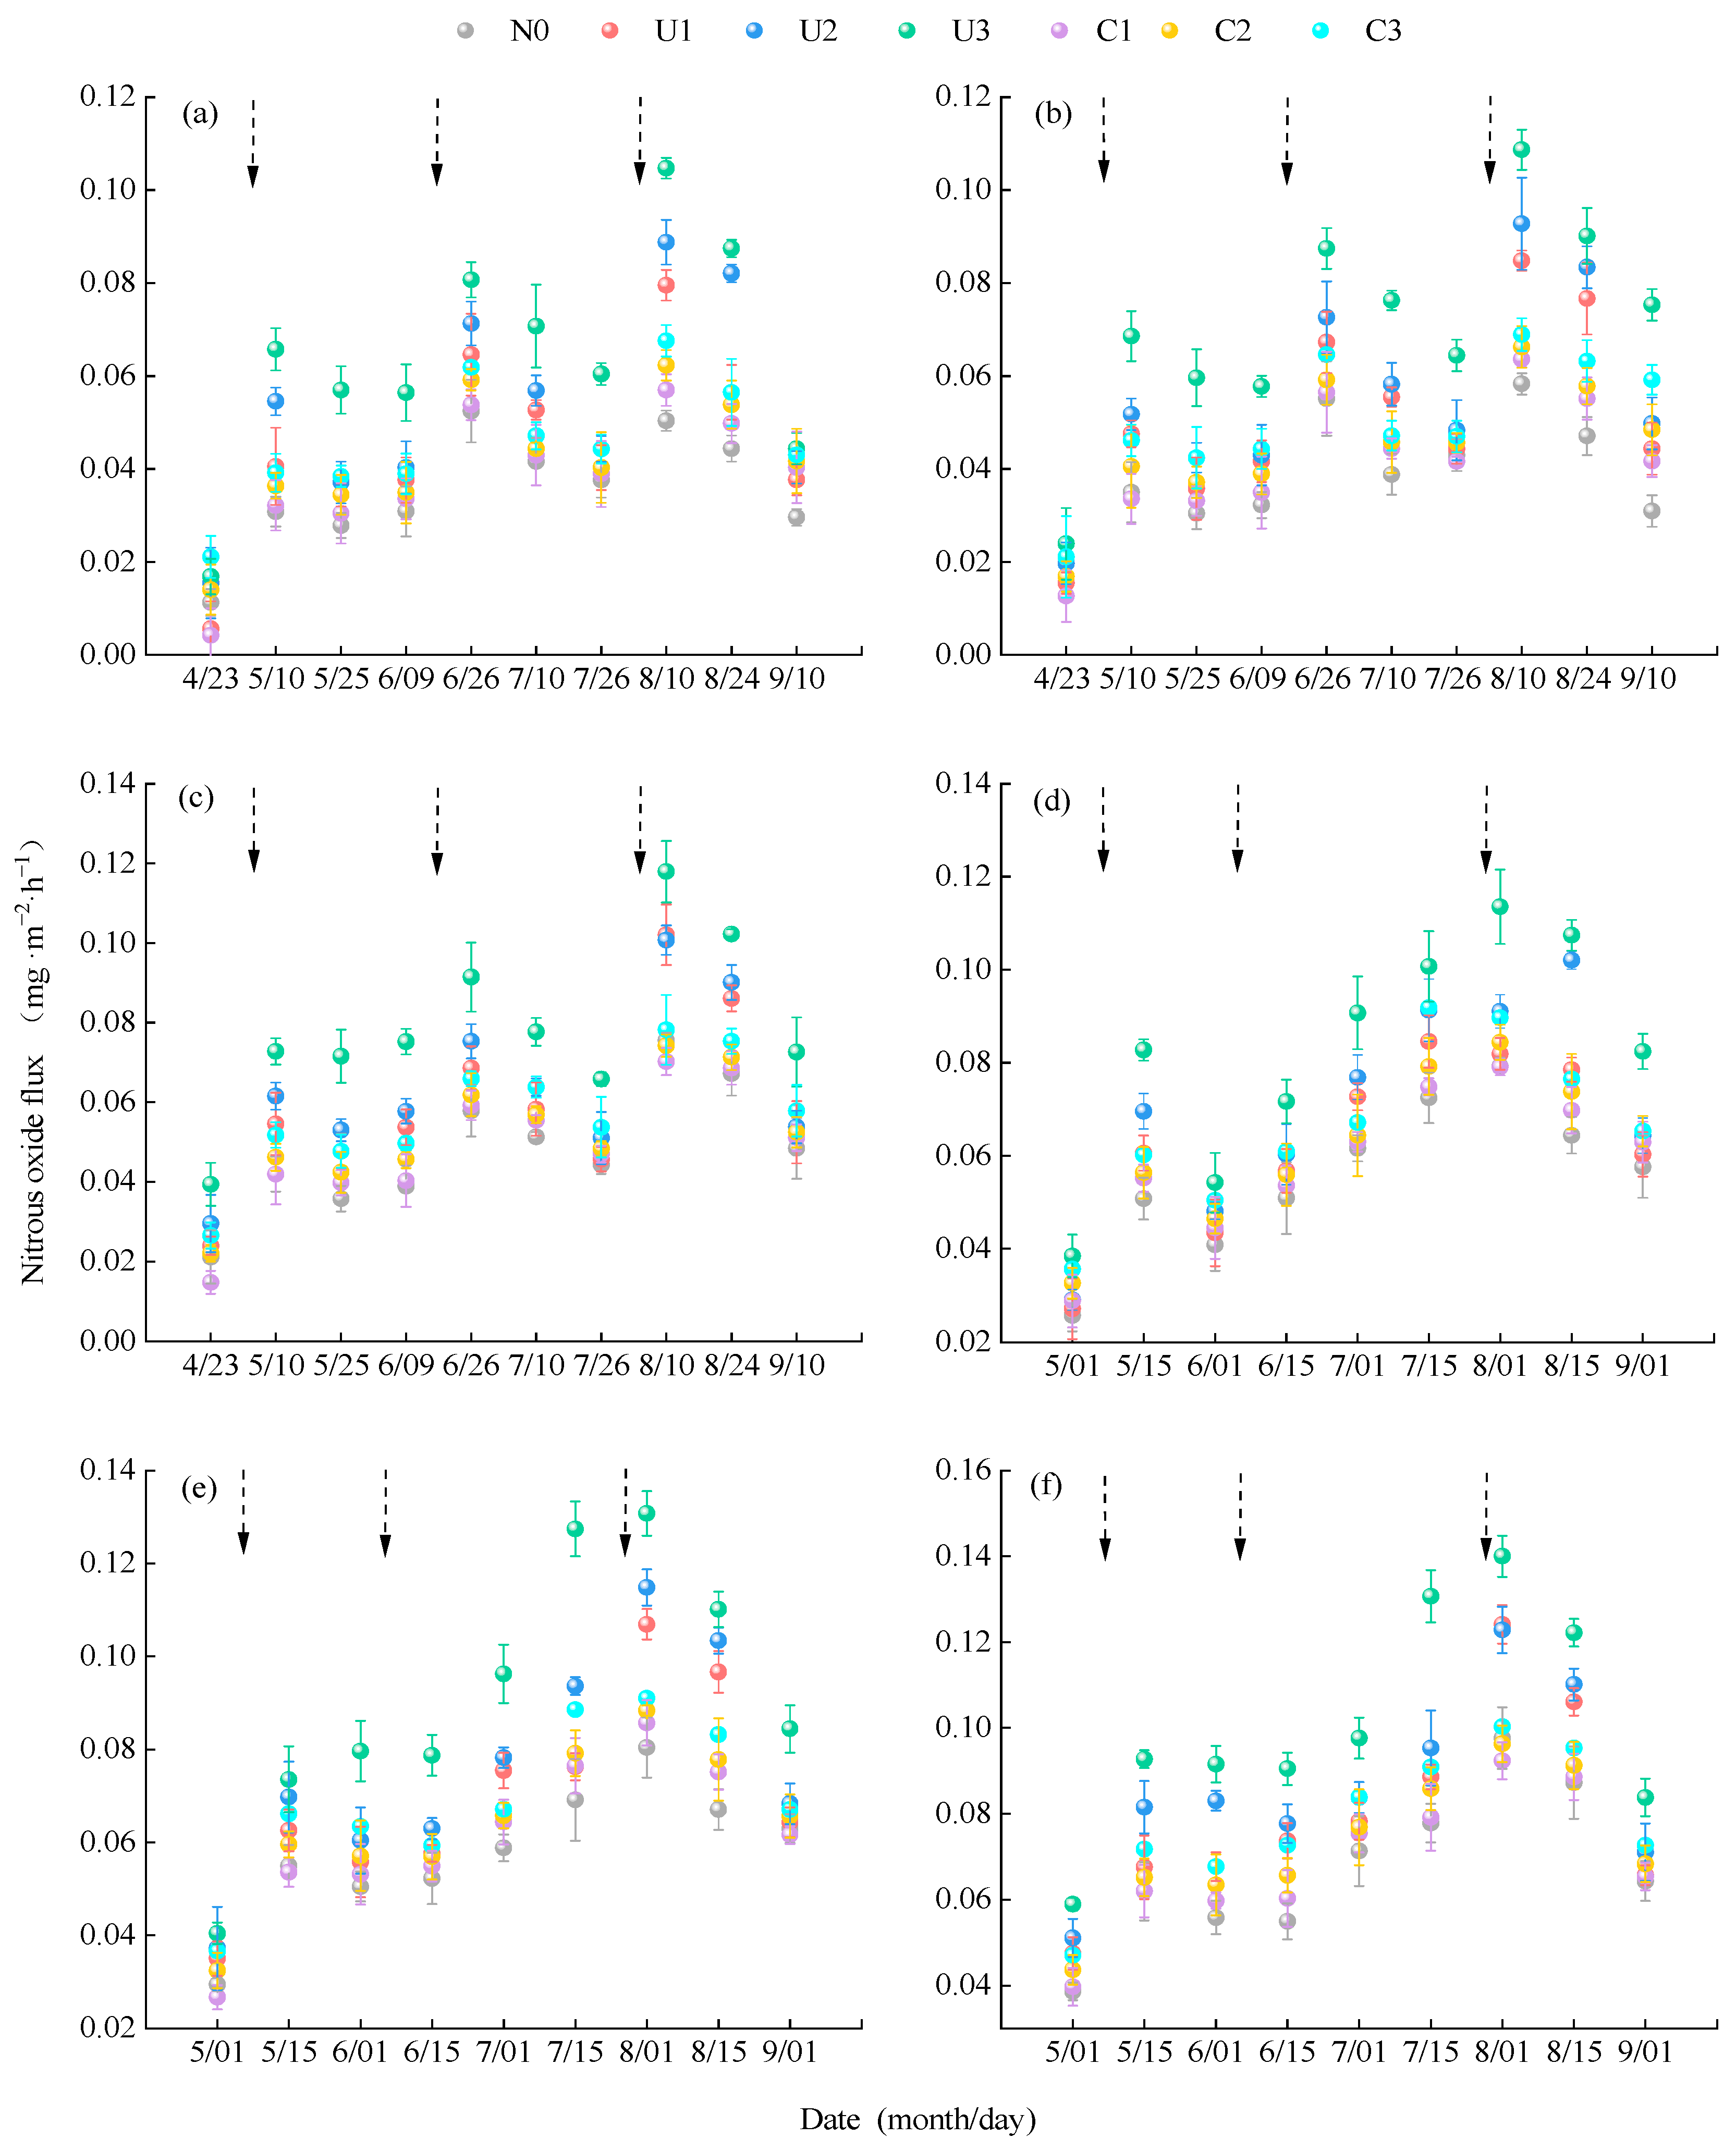
Soil N2O emission flux exhibited a trend of initially increasing and then decreasing as the alfalfa growth stages progressed. In 2023, N2O flux ranged from 0.0042 to 0.1179 mg·m−2·h−1, with distinct emission peaks observed on 10 May, 26 June, and 10 August. In 2024, flux ranged from 0.0257 to 0.1401 mg·m−2·h−1, with peaks on May 15 and August 1 (Figure 2). Under the C application, the average N2O emission fluxes in PM and BM were 25.13% and 9.11% higher than in FP, respectively. Within the same planting pattern, C1, C2, and C3 treatments showed average increases of 4.82%, 12.23%, and 21.49% in the N2O flux compared with N0, respectively. Under the U application, N2O flux significantly increased after each top-dressing event. On average, the N2O flux under U was 24.61% higher than that under C. In PM and BM treatments, the average N2O fluxes were 24.08% and 10.01% higher than the values in FP, respectively. Within the same planting pattern, N2O fluxes in U1, U2, and U3 increased by 21.93%, 34.96%, and 63.31% compared to N0, respectively. Among all treatments, FPN0 had the lowest emission flux (two-year average: 0.04582 mg·m−2·h−1), while PMU3 had the highest (two-year average: 0.0897 mg·m−2·h−1).
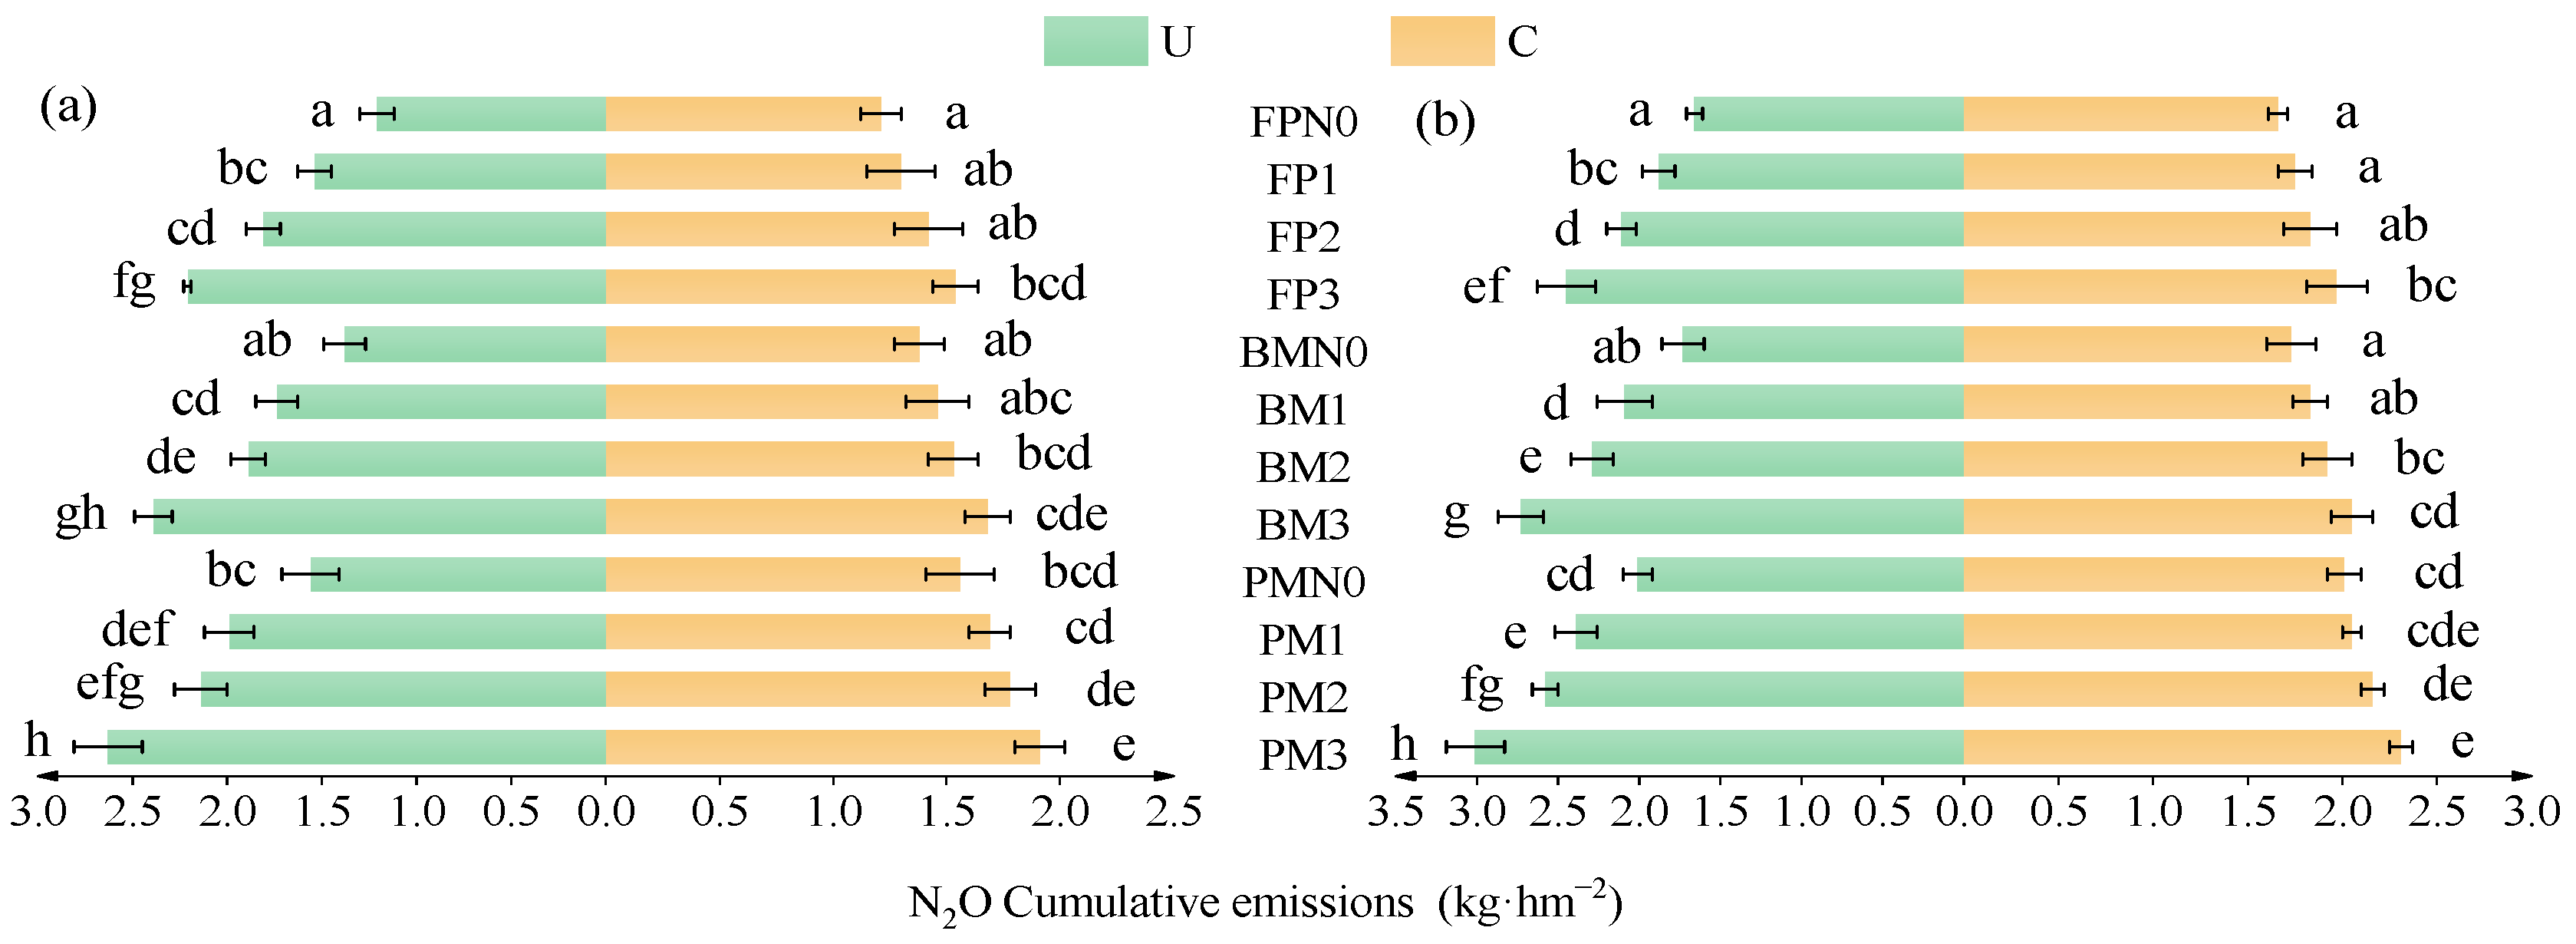
Both the main effects of planting pattern, nitrogen fertilizer type, and nitrogen rate, as well as the interaction between nitrogen rate and fertilizer type, significantly affected cumulative N2O emissions (Table 2). Cumulative N2O emissions were lower under C than under U, increased with higher nitrogen rates, and were higher in BM and PM than in FP (Figure 3). Under C, cumulative N2O emissions in C1, C2, and C3 were 5.56%, 11.41%, and 20.01% higher than those in N0, respectively. At the same nitrogen level, PM and BM showed 21.31% and 6.73% higher cumulative emissions than FP, respectively. Under the urea application, cumulative N2O emissions in U1, U2, and U3 increased by 21.78%, 34.24%, and 61.47% compared to N0, respectively. At the same nitrogen level, cumulative emissions in PM and BM were 23.12% and 9.45% higher than those in FP, respectively. Among all treatments, PMC3, BMU3, and BMC2 had cumulative emissions 25.18%, 9.22%, and 38.83% lower, respectively, than the highest-emitting treatmentPMU3 (two-year average: 2.82 kg·hm−2).

2.2.2. Soil Global Warming Potential and N2O Emission Intensity

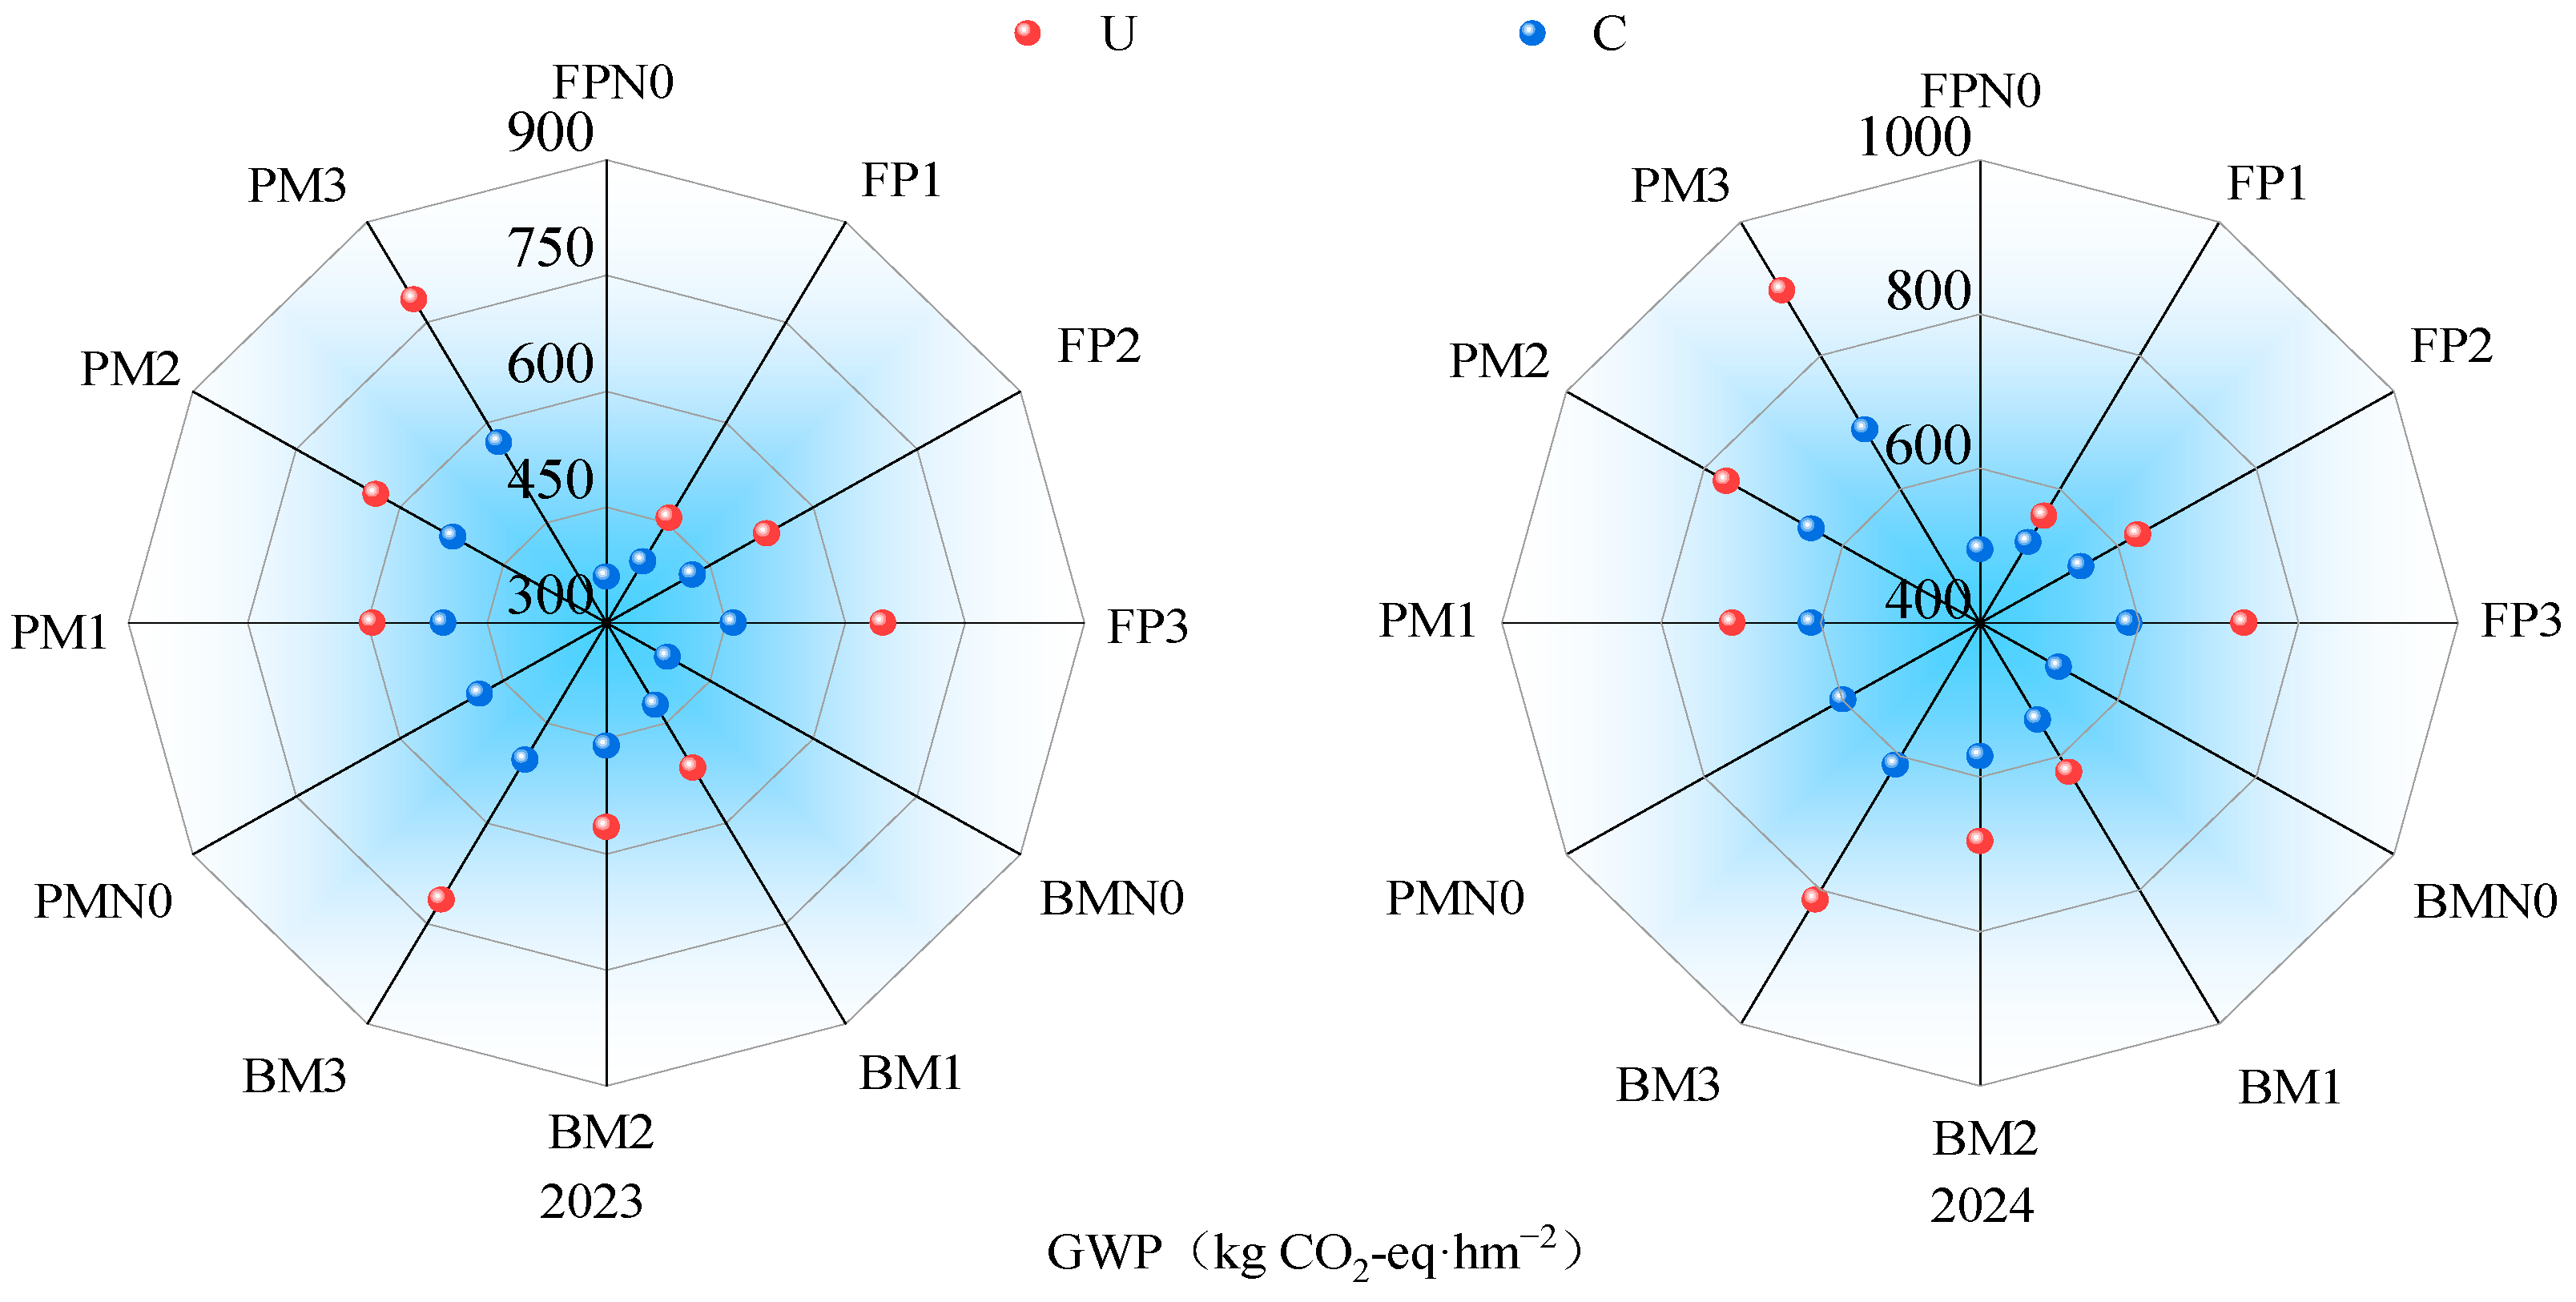
The variation in soil global warming potential (GWP) under different nitrogen fertilizer types, application rates, and planting patterns was generally consistent with that of cumulative N2O emissions (Figure 4). Under the C application, GWP in C1, C2, and C3 was 5.86%, 12.26%, and 21.32% higher than that in N0, respectively. At the same nitrogen level, GWP in PM and BM was 23.27% and 7.97% higher than that in FP, respectively. Under the urea application, GWP in U1, U2, and U3 increased by 21.93%, 34.43%, and 61.91% compared with N0, respectively. At the same nitrogen level, GWP in FP was 18.95% and 9.18% lower than that in PM and BM, respectively.
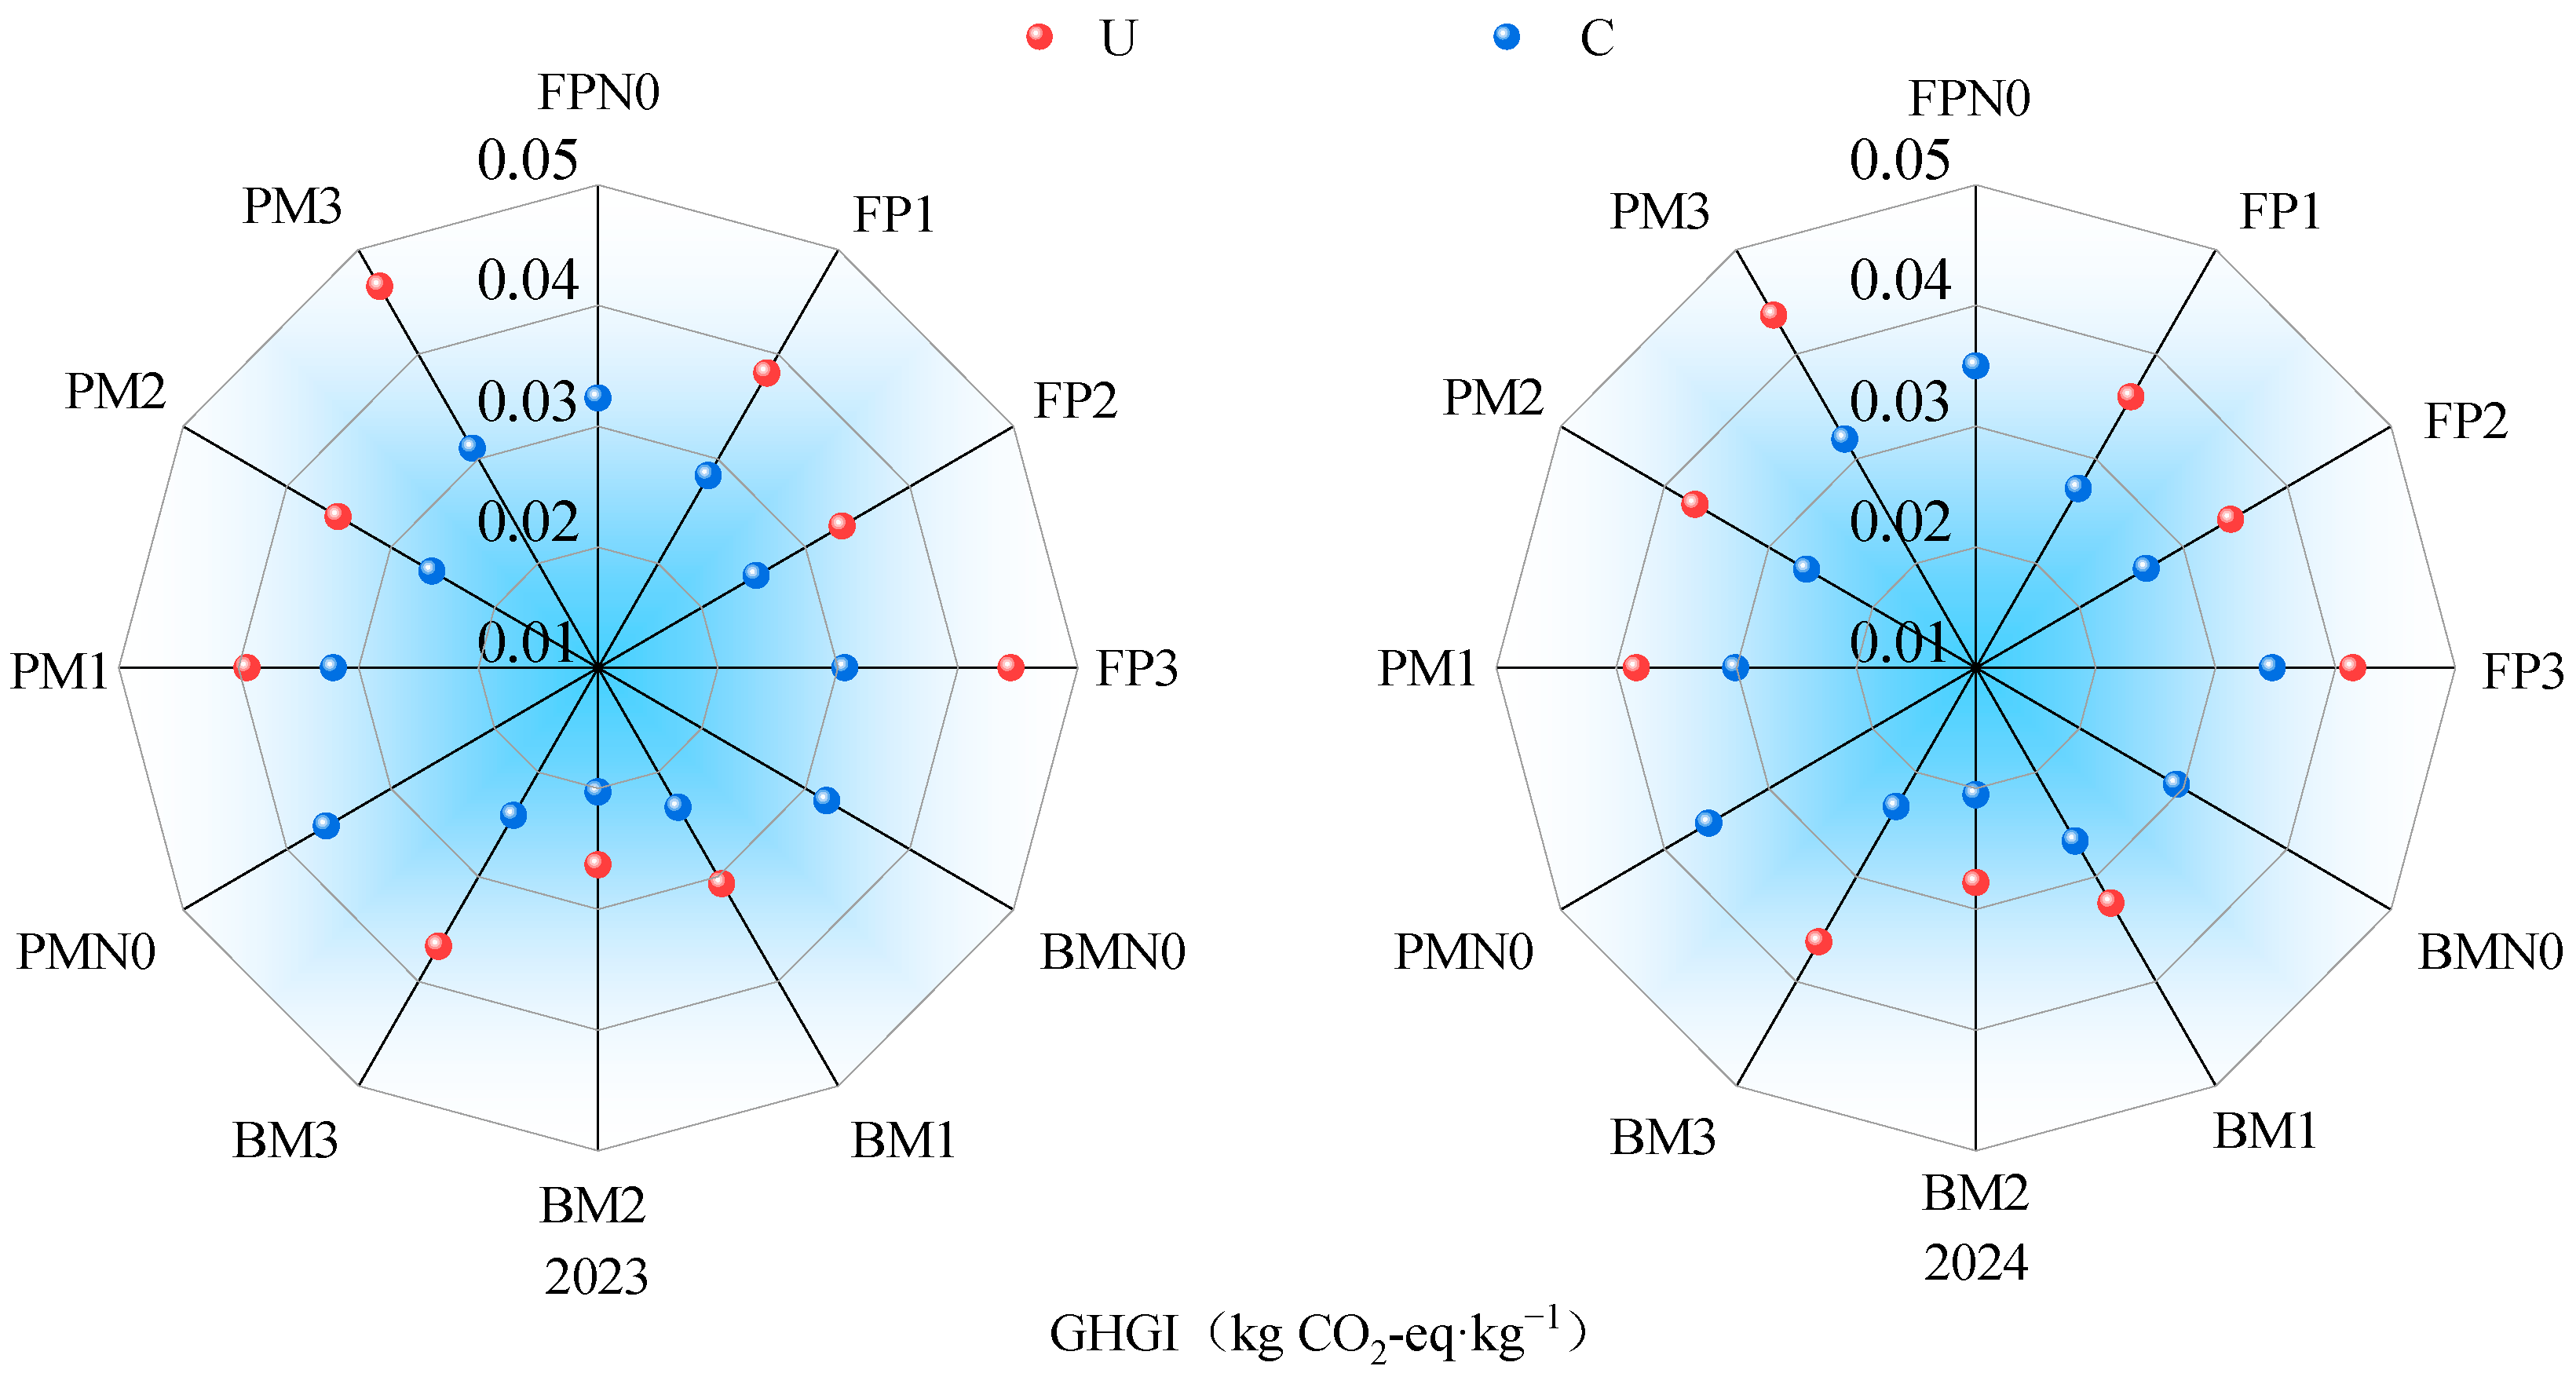
Soil N2O emission intensity (GHGI) was lower under C than under U and followed a trend of initially decreasing and then increasing with the increase in the nitrogen rate. GHGI in BM was lower than in PM and FP (Figure 5). Under the C application, GHGI in BM was reduced by 20.15% and 19.49% compared to PM and FP, respectively. Within the same planting pattern, GHGI in C2 was reduced by 32.98%, 13.48%, and 17.07% compared to N0, C1, and C3, respectively. Under the U application, GHGI in BM was 19.07% and 16.79% lower than in PM and FP, respectively. Within the same planting pattern, GHGI in U2 was reduced by 3.52%, 9.89%, and 22.18% compared to N0, U1, and U3, respectively. Among all treatments, BMC2 had the lowest GHGI, with a two-year average of 0.0204 kg CO2-eq·kg−1.

2.3. Effects of Planting–Fertilization Regimes on Soil Environment

2.3.1. Effects of Planting–Fertilization Regimes on Soil Temperature

Soil temperature in the 0~25 cm layer showed a decreasing trend with an increase in depth. The temperatures under PM (20.3~28.0 °C) and BM (19.1~26.7 °C) were higher than those under FP (18.7~25.1 °C) (Figure 6). At the same fertilizer type and nitrogen level, the average soil temperature at 5 cm depth under PM and BM was 11.37% and 4.89% higher than that under FP, respectively; similar increases were observed at 25 cm depth, where PM and BM were 11.37% and 4.89% higher than FP, respectively. No significant differences in soil temperature in the 0~25 cm layer were observed among different nitrogen fertilizer types or nitrogen application levels.

2.3.2. Effects of Planting–Fertilization Regimes on Soil Moisture Content

Soil volumetric water content in the 0~30 cm layer ranged from 5.71% to 19.79%, with PM and BM treatments exhibiting higher values than FP. Soil moisture content increased with both the nitrogen application rate and soil depth (Figure 7). At the same fertilizer type and nitrogen rate, the average soil moisture content in PM and BM was 20.20% and 8.71% higher than that in FP, respectively. Under the FP planting pattern, the average soil moisture content in C1, C2, and C3 increased by 6.57%, 9.20%, and 20.03%, respectively, compared to N0; under the urea treatment, U1, U2, and U3 increased by 14.21%, 17.04%, and 26.89%, respectively, compared to N0. Under the BM pattern, the average soil moisture content in C1, C2, and C3 increased by 5.89%, 10.91%, and 15.75%, and in U1, U2, and U3 by 9.38%, 15.19%, and 16.94%, respectively, compared to N0. Under the PM pattern, the average soil moisture content in C1, C2, and C3 increased by 4.49%, 9.28%, and 4.94%, and in U1, U2, and U3 by 5.27%, 14.11%, and 17.80%, respectively, compared to N0. Among all treatments, PMU3 had the highest average soil moisture content (16.85%), which was 48.72%, 6.39%, and 12.17% higher than FPN0, FMU3, and PMN0, respectively.

2.3.3. Effects of Planting–Fertilization Regimes on Soil Available Nitrogen Content

The effects of planting pattern, nitrogen fertilizer type, and nitrogen application rate as single factors, as well as the interactions between planting pattern and fertilizer type, and between fertilizer type and nitrogen rate, significantly influenced the soil nitrate nitrogen (NO3-N) content. The effects of planting pattern and fertilizer type as main factors, as well as the interaction between planting pattern and nitrogen rate, significantly influenced the soil ammonium nitrogen (NH4+-N) content (Table 3).
Under the C application, both NO3-N and NH4+-N contents increased with an increase in the nitrogen rate and were higher in PM and BM than in FP. Within the same planting pattern, compared to N0, the average NO3-N contents in C1, C2, and C3 increased by 56.08%, 152.76%, and 160.95%, respectively, while NH4+-N contents increased by 73.59%, 118.25%, and 202.33%, respectively. At the same nitrogen rate, NO3-N contents in PM and BM were 18.51% and 7.29% higher than in FP, and NH4+-N contents were 54.27% and 42.51% higher than in FP, respectively. Under the U application, soil NO3-N and NH4+-N contents ranged from 10.33 to 20.78 mg·kg−1 and from 2.28 to 6.23 mg·kg−1, respectively, and their variation patterns with nitrogen rate and planting pattern were generally consistent with those observed under C. However, at the same nitrogen level and planting pattern, NO3-N and NH4+-N contents under U were on average 18.32% and 17.04% higher, respectively, than those under C.

2.4. Correlation Between Soil N2O Emission Flux and Soil Environmental Factors

Correlation analysis showed that soil N2O emission flux was significantly positively correlated with soil moisture content, nitrate nitrogen (NO3-N) content, and ammonium nitrogen (NH4+-N) content. Among these, the correlation between N2O flux and NO3-N content was the strongest (R2 = 0.624), followed by the soil moisture content (R2 = 0.551) and NH4+-N content (R2 = 0.506). A non-significant negative correlation was observed between soil N2O emission flux and soil temperature (Figure 8).

2.5. Optimal Planting–Fertilization Regime for Yield Increase and Emission Reduction in Alfalfa

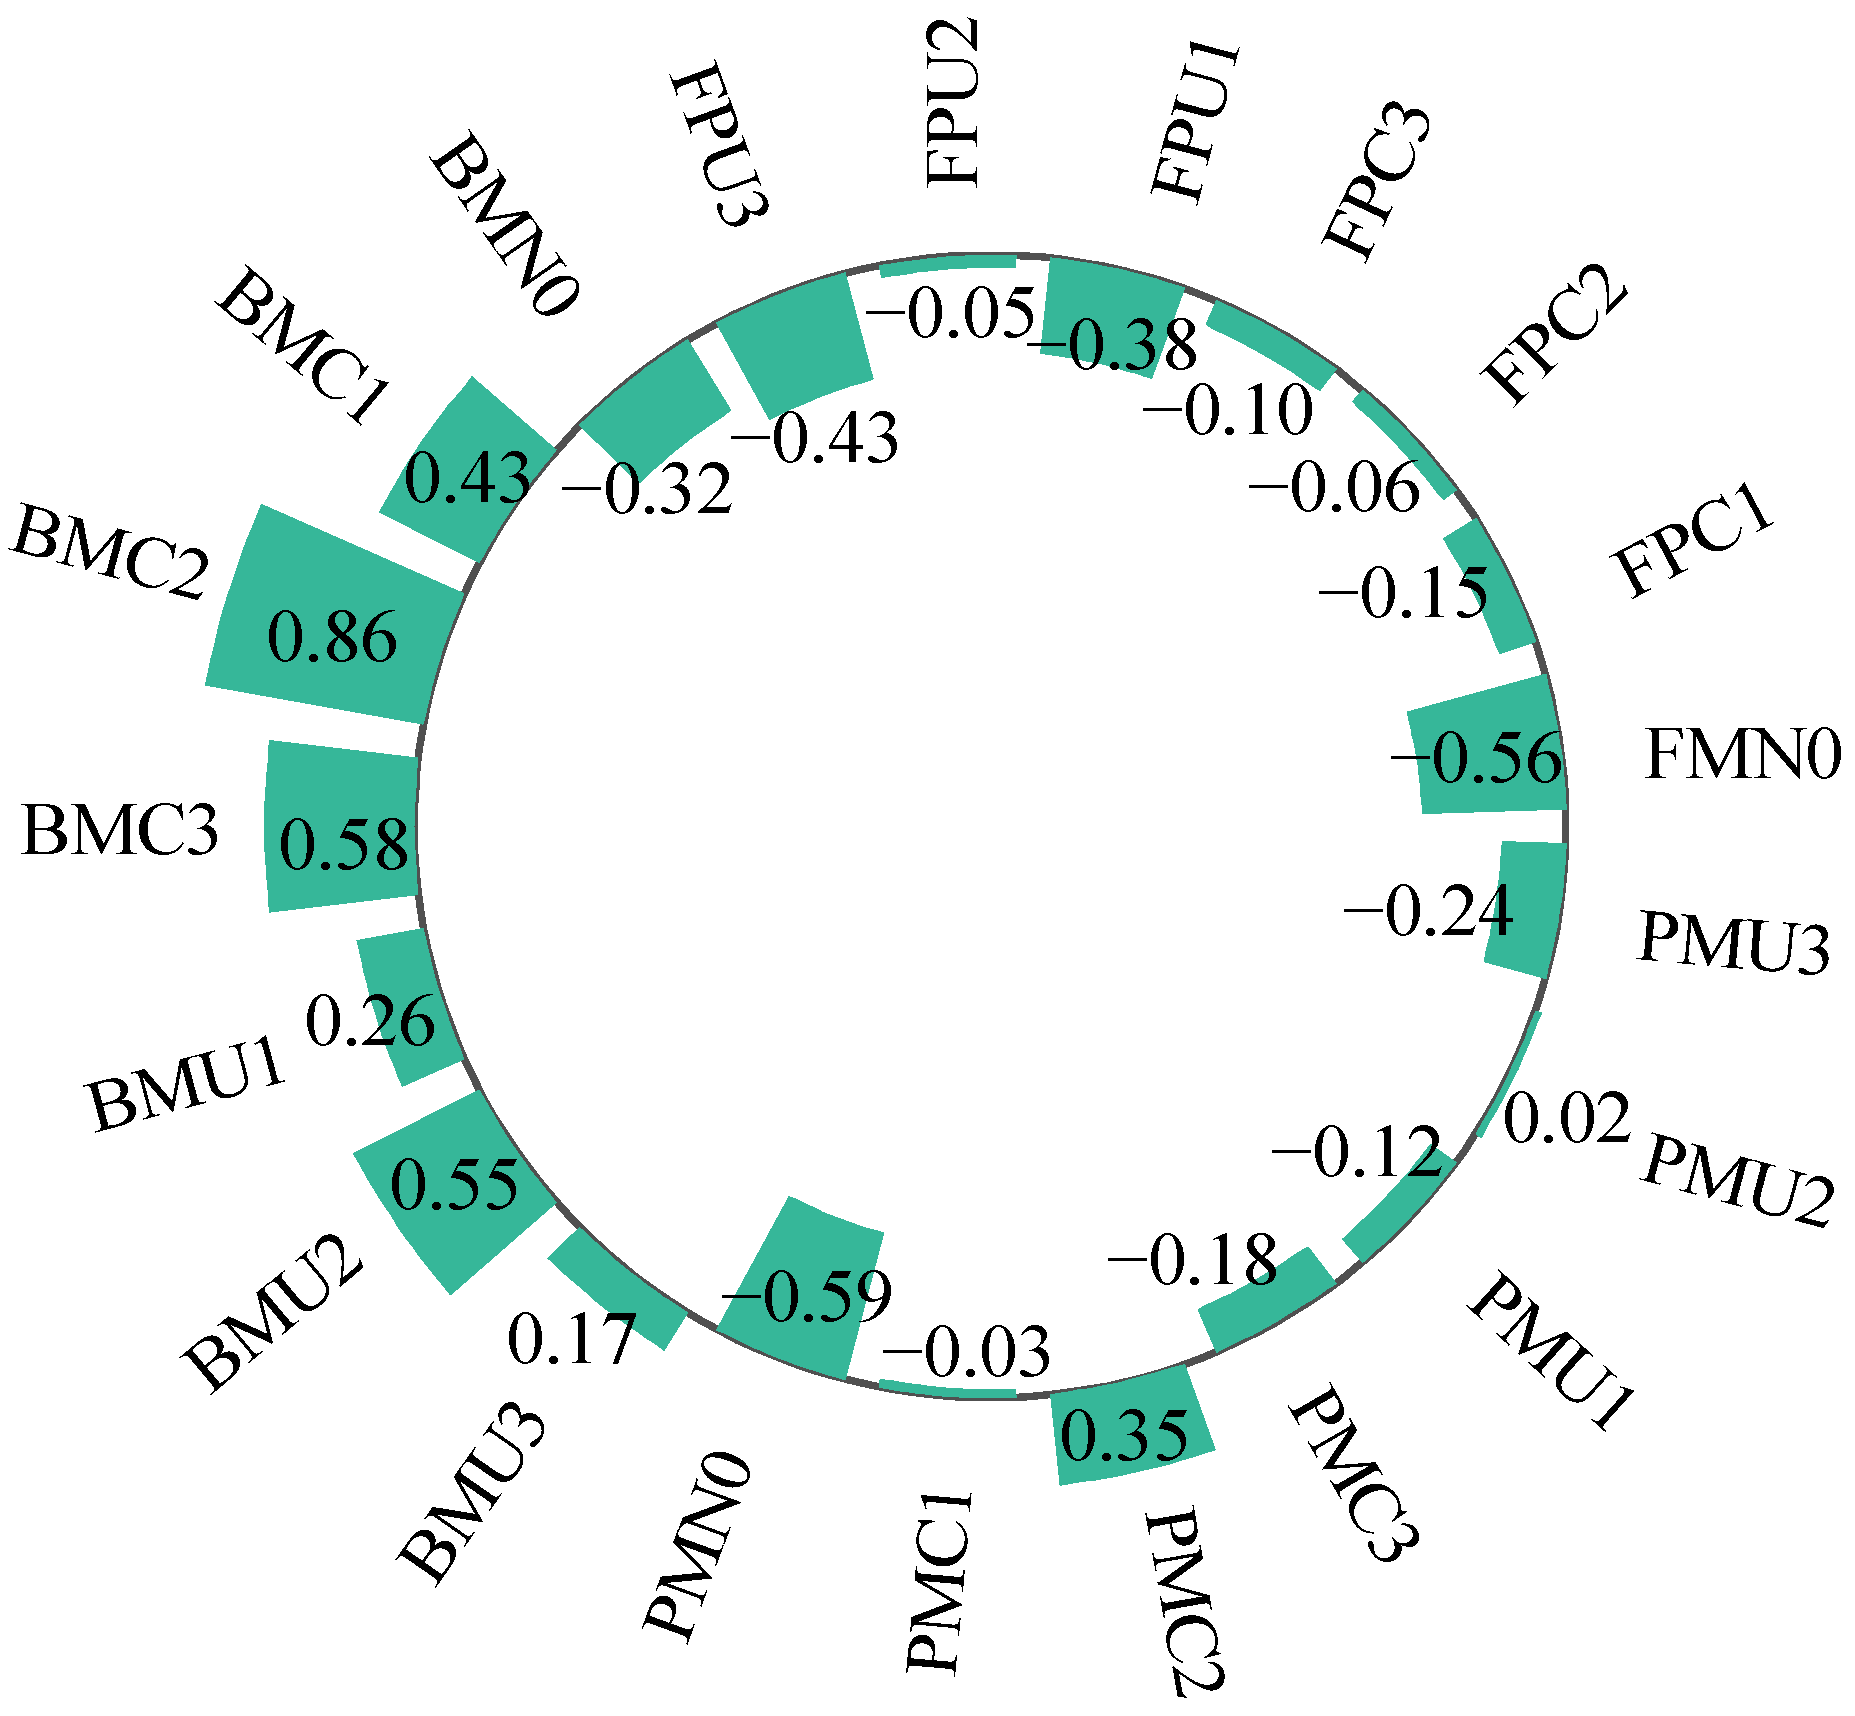
To evaluate the yield-increasing and emission-reducing effects of different planting–fertilization regimes in alfalfa grasslands, principal component analysis (PCA) was conducted based on eight indicators: soil temperature (T), soil moisture content (W), annual alfalfa yield (Y), cumulative soil N2O emissions (E), soil nitrate nitrogen content (N), ammonium nitrogen content (A), global warming potential (GWP), and greenhouse gas emission intensity (GHGI) (Table 4). The analysis showed that the eigenvalues of the first three extracted principal components were all greater than 1, with a cumulative contribution rate of 82.50%. Principal Component 1 accounted for 36.72% of the total variance (mainly reflecting the impact of GHGI); Principal Component 2 explained 29.28% of the variance (mainly associated with E, GWP, and Y); and Principal Component 3 explained 16.49% of the variance (mainly reflecting the influence of T).
Based on the comprehensive scores and ranking results (Figure 9), BM performed better than PM and FP; C was superior to U, with the best performance observed at the nitrogen application rate of 160 kg·hm−2. Among all treatments, BMC2 was identified as the optimal regime, while PMN0 was the least favorable.

3. Discussion

3.1. Effects of Planting–Fertilization Regimes on Alfalfa Yield

As a typical leguminous crop, alfalfa can fix atmospheric nitrogen via root nodule symbiosis. However, during early growth, post-cutting regrowth, and early spring under low temperatures, nitrogen fixation capacity is limited, making alfalfa dependent on soil nitrogen supply to meet its growth demand [31]. Exogenous nitrogen supplementation is an effective approach to enhance soil fertility and secure high alfalfa yield [32]. This study found that alfalfa yield increased and then decreased with an increase in the nitrogen application rate, peaking at 160 kg·hm−2. Similar trends were reported by Wang et al. [33] in wheat and Ma et al. [34] in cotton. Excessive nitrogen application can inhibit the activities of nitrate reductase and sucrose phosphate synthase in plants, disrupting nitrogen metabolism, weakening photosynthesis, and delaying reproductive growth [7]. However, Zhao et al. [35] reported that 120 kg·hm−2 was optimal for alfalfa in Henan, while Lu et al. [36] in Jiangsu found the highest yield at 225 kg·hm−2. These differences may be attributed to regional climatic conditions and soil nutrient status. Gansu, located in the arid Inland Northwest, is characterized by saline–alkali and infertile soils. Henan has moderate hydrothermal conditions and loamy soils with good fertility and nitrogen use efficiency. In Jiangsu, high rainfall causes nitrogen leaching losses up to 30%, and high temperatures accelerate nitrogen transformation, compounding losses. Nitrogen fertilizer type is another key factor affecting yield response. This study showed that a controlled-release nitrogen fertilizer application increased alfalfa yield by 8.46% compared to urea at the same nitrogen rate. Similar findings were reported by Belyaeva et al. [37] in ryegrass, Gao et al. [38] in maize, and Sun et al. [39] in rice. This is primarily due to the differences in nitrogen transformation rates [40]. Urea releases nitrogen rapidly, causing temporary nitrogen surges and losses via volatilization and leaching. In contrast, controlled-release nitrogen fertilizer uses coating technology to release nitrogen gradually, reducing NH4+-N and NO3-N concentration spikes and stabilizing nitrogen supply [41]. However, Jin. et al. [42] found no significant yield difference between controlled-release nitrogen fertilizer and urea in winter wheat in the Huang–Huai–Hai region, possibly due to crop-specific growth traits. Alfalfa is harvested multiple times per year under high temperatures and a long growing season, likely making it more compatible with controlled-release nitrogen fertilizer release dynamics. In contrast, winter wheat has a dormant period and lower temperatures, limiting the effectiveness of controlled-release nitrogen fertilizer.
Planting pattern is also a critical agronomic factor affecting yield. Ridge mulching modifies soil moisture, nutrients, temperature, and aeration around the root zone, promoting plant growth and productivity [43]. This study found that BM and PM increased alfalfa yield by 23.49% and 18.65%, respectively, compared to FP. Similar yield enhancements due to mulching have been observed by Miceli et al. [44] in Italy, Samphire et al. [45] in the UK, and Lv et al. [46] in Gansu. DeVetter et al. [47] also found that biodegradable films outperformed polyethylene films in yield enhancement. Mulching improves soil solar radiation absorption, raises temperature, and redistributes moisture more effectively [48]. Compared to conventional plastic films, biodegradable films reduce late-season soil heat stress and prevent premature senescence [49]. As the film degrades, thermal insulation weakens, and lower nighttime temperatures reduce plant respiration losses, enhancing organic matter retention and yield [50]. Biodegradable mulch also retains moisture effectively in the early stages and develops micropores during degradation, reducing surface runoff and improving rainwater infiltration, which helps maintain optimal soil moisture during critical growth stages [51]. Furthermore, it avoids problems such as residual pollution and soil overheating associated with conventional plastic films, supporting sustainable yield improvement.

3.2. Effects of Planting–Fertilization Regimes on N2O Emissions in Alfalfa Grasslands

Nitrogen management affects N2O emissions by regulating microbial activity and nitrogen transformation processes [40]. This study showed that different nitrogen types and rates led to net N2O emissions in alfalfa fields. Under the urea application, significant N2O emission peaks appeared approximately 7 days after each top-dressing event. Similar patterns were reported by Oikawa et al. [52] in Sorghum bicolor. The hydrolysis of urea generates NH4+, which rapidly nitrifies into NO3, causing spikes in inorganic nitrogen and triggering N2O release [53]. In contrast, controlled-release nitrogen fertilizer releases nitrogen more gradually, avoiding distinct emission peaks. In this study, controlled-release nitrogen fertilizer reduced N2O emissions by 17.95% compared to urea. However, Yao. et al. [54] found a 13.30% increase in N2O emissions under controlled-release nitrogen fertilizer in maize fields in the Songliao Plain. This discrepancy may be due to different application methods. In our study, controlled-release nitrogen fertilizer was applied once at green-up, allowing for a slow release throughout the growth period [55]. In contrast, Yao et al. [54] used an equal fertilization proportion with base fertilizer and top dressing to concentrate nitrogen supply in the middle of the corn growing season. However, this period coincides with the hot and rainy season, which may accelerate the release of nutrients from controlled-release nitrogen fertilizers. At the same time, the combination of fertilization disturbance and frequent rainfall can easily form anaerobic micro-zones, significantly enhancing denitrification and leading to increased N2O emissions [56]. Soil N2O emissions are closely related to environmental factors. This study found significant positive correlations between N2O flux and NO3-N (R2 = 0.624) and NH4+-N (R2 = 0.506), consistent with results by Song et al. [57] in grasslands on the Qinghai–Tibet Plateau. The high availability of inorganic nitrogen promotes microbial nitrification and denitrification by providing substrates [58], and elevated NH4+-N and NO3-N concentrations stimulate microbial abundance and activity, enhancing N2O emissions [51].
Planting patterns alter soil thermal and moisture regimes and nitrogen transformation processes, thus regulating the nitrification–denitrification intensity and N2O flux [59]. In this study, N2O emissions followed the order PM > BM > FP, with PM and BM increasing cumulative emissions by 23.12% and 9.45%, respectively. Similar findings were reported by Chen et al. [60] in garlic, Meng et al. [61] in potatoes in the Shiyang River Basin, and Samphire [45] in leeks in the UK. Plastic mulch retains more soil heat, enhancing organic nitrogen mineralization and microbial nitrification–denitrification [62,63]. Biodegradable films initially have similar insulation to plastic, but their degradation weakens this effect over time [64], thereby lowering N2O emission risk. In our study, N2O flux was negatively but non-significantly correlated with soil temperature (R2 = 0.095, p > 0.05). However, Chen et al. [65] found a positive correlation in tomato fields in Shaanxi, likely due to different crop types and climates. Soil temperatures during alfalfa growth (17.9~28.0 °C) were below the optimal range (25~35 °C) for nitrifiers [66], limiting microbial N2O production. Alfalfa’s deep roots may also improve soil aeration and enhance N2O reduction to N2 [67]. In contrast, tomato roots are shallower, and frequent irrigation in Shaanxi may promote denitrification [68]. Soil moisture is another important factor affecting N2O emissions under different planting regimes. This study found a significant positive correlation between soil moisture and N2O flux (R2 = 0.551, p < 0.05). However, Mumford et al. [69] found no such correlation in ryegrass fields in New South Wales. This may be due to water management differences. In our study, drip irrigation maintained a stable moist soil layer [70], which filled pore spaces, creating anaerobic conditions favorable for denitrification and N2O release [71,72]. In contrast, Mumford’s site experienced alternating wet–dry cycles, disrupting these processes and weakening the moisture–emission link [73].
GHGI is a key indicator for assessing the environmental efficiency of agricultural production, reflecting N2O emissions per unit of yield [74]. This study found that GHGI in BM was reduced by 19.07% and 16.79% compared to PM and FP, respectively. Similar results were reported by Chen et al. [75] in maize–wheat rotations and by Hu et al. [25] in rice in southern China. Although biodegradable mulch slightly increased GWP, the concurrent yield gain significantly reduced GHGI [40]. Both the nitrogen type and application rate affected GHGI. In the study by Zeng. et al. [76] on rice and Wang et al. [77] on lettuce, the authors found that C significantly reduced GHGI compared to urea. In this study, GHGI was lowest under C at 160 kg·hm−2. This is likely due to reduced leaching, smoother N cycling, and lower residual soil nitrogen. The BMC2 treatment had the lowest GHGI, indicating that combining C with biodegradable mulch effectively achieved yield gains and emission reductions. This is consistent with results by Chen et al. [26] in maize and Hu et al. [27] in rice.
Biological factors also play a key role in regulating yield and N2O emissions under different planting–fertilization regimes [78]. Future research should focus on the soil microbial community structure, functional microbial activity, and key enzymatic regulation of N2O production and transformation to clarify the mechanisms by which biological processes contribute to both yield and environmental benefits.

4. Materials and Methods

4.1. Experimental Site

The field experiment was conducted from April to September in both 2023 and 2024 at the Irrigation Experiment Station of the Gansu Jingtai Chuan Electric Power Lift Irrigation Water Resource Utilization Center (37°12′ N, 104°05′ E; elevation 1572 m). The site is located in a temperate arid continental climate zone, with an annual sunshine duration of 2652 h, an average annual solar radiation of 6.18 × 10⁵ J·cm−2, a frost-free period of 191 days, and a multi-year average evaporation of 2761 mm. During the experimental periods, the mean air temperature and total precipitation were 8.6 °C and 75.61 mm in 2023 and 12.28 °C and 279.87 mm in 2024, respectively. The test site is sandy loam soil. The surface soil (0~20 cm) had a bulk density of 1.61 g·cm−3, a pH of 8.11, and a field capacity of 24.10% (volumetric water content). The soil contained 6.09 g·kg−1 of organic matter, 1.62 g·kg−1 of total nitrogen, and 74.51 mg·kg−1 of available nitrogen.

4.2. Experimental Design

The tested alfalfa (Medicago sativa L.) cultivar was “Longdong alfalfa” (hereafter referred to as alfalfa), which was sown in April 2021. Before sowing, we inoculated lucerne seeds by soaking them in a solution containing highly effective rhizobacteria (Sinorhizobia meliloti). The land was leveled 10 days before sowing, and row sowing was used. The alfalfa sowing rate was 22.5 kg·hm−2. A completely randomized block design was used, with three factors: planting pattern, nitrogen fertilizer type, and nitrogen application rate. The three planting patterns (Figure 10) included flat planting without mulch (FP), ridge planting with biodegradable mulch (BM), and ridge planting with conventional plastic mulch (PM). The biodegradable mulch (BM, supplied by Shandong Tianzhuang Environmental Protection Technology Co., Ltd. (Jinan, China), with an induction period of 90 days) is light white and applied using a spray method. The plastic mulch (PM, supplied by Yangling Rui Feng Environ-mental Protection Technology Co., Ltd., (Yangling, China)) comprised polyethylene, with a thickness of 0.008 ± 0.001 mm, semi-transparent white in color, and a width of 100 cm. In the ridge cultivation plots, furrows were dug and ridges were formed, with a ridge height of 25 cm, a ridge width of 60 cm, and a ridge–furrow ratio of 1:1. Alfalfa was planted on the sides of the ridges and in the furrows, with four rows of alfalfa planted per ridge–furrow system, spaced 20 cm apart. In the flat-bed treatment plots, the alfalfa row spacing was 30 cm. Two nitrogen fertilizer types were applied: controlled-release nitrogen fertilizer (C, produced by Shandong Kingenta Ecological Engineering Group Co., Ltd. (Linyi, China); for polymer-coated controlled-release type, total nutrient content is 40%, N-P2O5-K2O mass fractions are 30%-4%-6%, respectively, coating thickness is 50 ± 5 μm, and particle size is 3–5mm.) and conventional urea (U; nitrogen content: 46.4%). Four nitrogen application rates were set: 0, 80, 160, and 240 kg·hm−2 (Table 5). A total of 21 treatment combinations were established, each with three replicates. The area of each plot was 42.9 m2 (5.5 m × 7.8 m). Fertilization and irrigation were performed via a drip irrigation system. In ridge-planted plots, the spacing between drip lines was 40 cm, whereas in flat-planted plots, it was 60 cm. Each dripper had a rated flow rate of 2 L·h−1. Water flow in each plot was regulated by valves and water meters (accuracy: 0.001 m3) installed on the irrigation pipes. Controlled-release nitrogen fertilizer was applied once as a basal dressing during the spring regrowth stage each year. Urea was applied in three split doses at a ratio of 6:2:2 before the first-cut regrowth stage (7 May in both 2023 and 2024), after the first harvest (20 June 2023, and 5 June 2024), and after the second harvest (6 August 2023, and 28 July 2024). Phosphorus fertilizer (single superphosphate, P2O5 content: 16%) and potassium fertilizer (potassium chloride, K2O content: 60%) were each applied at 50 kg·hm−2 as a one-time basal application before the first regrowth stage of each year. All cultivation and growth cycles involved full irrigation. The spring irrigation period for 2023 was April 20, and for 2024, it was April 25. Irrigation and other field management practices followed local standard alfalfa cultivation protocols. Alfalfa was harvested three times in 2023 (20 June, 29 July, and 12 September) and three times in 2024 (5 June, 28 July, and 25 September).

4.3. Measurement Items and Methods

4.3.1. Yield

At the early flowering stage of each cutting, alfalfa was harvested to determine hay yield using a combination of fresh biomass measurement and the fresh-to-dry weight ratio method. A 1 m × 1 m quadrat was placed at the center along the diagonal of each plot. After harvesting, the fresh biomass within the quadrat was weighed (M1, kg). Next to the main quadrat, a smaller 50 cm × 50 cm sub-quadrat was randomly selected. After harvesting, the fresh biomass in the sub-quadrat was weighed (M2, g) and then sealed in a paper envelope, inactivated at 105 °C for 30 min, and oven-dried at 75 °C until constant weight. Once cooled, the dry weight was recorded (M3, g). The fresh-to-dry ratio was calculated as M3/M2. The total hay yield of all three cuttings was used to calculate the annual yield.
The alfalfa hay yield (Y, kg·hm−2) was calculated using the following equation:
Y = ( M 1 × M 2 ) × 1000 M 2

4.3.2. Greenhouse Gas N2O

Soil N2O was collected using the closed static chamber method [79]. The chamber measured 60 × 60 × 60 cm, with a base of 60 × 60 × 15 cm, and the underground part was inserted 10 cm into the alfalfa field. During sampling, the chamber was placed on the base and sealed with a water groove on the upper edge. The left side of the chamber was equipped with gas sampling and fan power interfaces. Two 12 V mini fans were installed at the upper left and lower right corners of the chamber to mix the gas, powered by external batteries. During sampling, the chamber was placed on the base; at other times, it was removed to ensure consistent light, air temperature, soil temperature, and humidity between inside and outside the chamber. Gas was sampled between 9:00 and 11:00 a.m. At 0, 10, 20, and 30 min, 40 mL of gas was collected using a 50 mL syringe, which was pumped in and out twice through the sampling port. Samples were immediately taken back to the laboratory and analyzed using a gas chromatograph (Shimadzu GC-2010 Pro, Kyoto, Japan). N2O was sampled every 15 days starting from the beginning of the experiment.
The N2O flux (F, mg·m−2·h−1) was calculated using the following equation [80]:
F = ρ × H × d c d t × 273 ( 273 + T ) × 60
where ρ is the density of N2O under standard conditions (ρ = 2 × 14/22.4 = 1.25, kg·m−3); T is the average temperature (°C) inside the closed chamber during sampling; H is the height of the chamber (m); c is the volume mixing ratio of N2O; and dc/dt is the rate of change in the N2O concentration during sampling (mg·m−2·min−1).
A positive value of F indicates that the soil is emitting N2O, while a negative value indicates N2O uptake by the soil.
The cumulative N2O emissions (M, kg·hm−2) were calculated using the following equation [81]:
M = [ ( f i + 1 + f i ) × 0.5 ] × ( d i + 1 d i ) × 24 100
where f is the N2O flux (mg·m−2·h−1); i = 1, 2, … n is the sampling index; di+1di is the number of days between two consecutive samplings; and 100 is the unit conversion coefficient.
The global warming potential (GWP, kg CO2-eq·hm−2) was calculated using the following equation [2]:
G W P = M × 298
where M represents the cumulative N2O emissions during the measurement period (kg·hm−2).
The greenhouse gas emission intensity (GHGI, kg CO2-eq·kg−1) was calculated as
G H G I = G W P Y
where Y is the yield (kg·hm−2).

4.3.3. Soil Temperature

For PM and BM treatments, bent-stem thermometers were placed in the ridge–furrows of each plot. For the FP treatment, thermometers were placed between alfalfa rows in the center of each plot. During each N2O sampling event, soil temperature at a depth of 0~25 cm was measured at 5 cm intervals using bent-stem thermometers (produced by Wuqiang Hongxing Instrument Factory, Hebei Province, Hengshui, China).

4.3.4. Soil Volumetric Water Content

For PM and BM treatments, one time-domain reflectometry (TDR) probe (150 cm in length) was installed in the ridge–furrow of each plot. For the FP treatment, one TDR probe was placed between alfalfa rows in the center of the plot. During each N2O sampling event, a portable soil profile moisture meter (PI-CO-BT, IMKO, Ettlingen, Germany) was used to measure soil volumetric water content at 0~30 cm depth at 10 cm intervals.

4.3.5. Soil Nitrate and Ammonium Nitrogen

During each N2O sampling event, soil samples were collected using an “S”-shaped sampling method [82]. Soil NO3-N and NH4+-N concentrations in the 0~10 cm soil layer were determined using 2 mol·L−1 KCl extraction (5 g air-dried soil; soil-to-solution mass ratio of 1:10), followed by analysis with a UV–visible spectrophotometer (T6 New Century, Beijing Puxi General Instrument Co., Ltd., Beijing, China).

4.4. Statistics and Analysis of Data

Microsoft Excel 2021 was used for data collation; Origin 2021 was used for graphing. IBM SPSS Statistics 27.0 was used for principal component analysis, and one-way ANOVA and Duncan’s multiple range test, as well as two-way ANOVA, were used to analyze the interaction effects. The significance level was set at p < 0.05.

5. Conclusions

(1) Compared with urea, controlled-release nitrogen fertilizer increased alfalfa yield by 8.46%. Ridge mulching with biodegradable film and plastic film increased alfalfa yield by 23.49% and 18.65%, respectively, compared with conventional flat planting. The BMC2 treatment achieved the highest yield, which was 97.11% and 35.74% higher than that under FPN0 and FPU2, respectively.
(2) Cumulative N2O emissions and greenhouse gas emission intensity (GHGI) under the C application were reduced by 23.89% and 25.84%, respectively, compared with urea. Both N2O emission flux and cumulative emissions increased with higher nitrogen application rates. PM and BM increased cumulative N2O emissions by 18.52% and 7.45%, respectively, compared to FP. The BMC2 treatment exhibited the lowest cumulative N2O emissions and GHGI.
(3) Soil N2O emission flux was significantly positively correlated with NO3-N content, soil moisture content, and NH4+-N content.
(4) Principal component analysis showed that the BMC2 treatment significantly outperformed other treatments in improving yield and reducing N2O emissions and is therefore recommended as an optimal planting–fertilization regime for enhancing productivity and mitigating emissions in the Yellow River irrigation district of Gansu and similar ecological regions.

Author Contributions

Conceptualization, G.Q. and Y.M.; methodology, W.C. and M.Y.; software, Y.M. and H.L.; validation, Y.D. and Y.K.; formal analysis, M.Y., Y.M. and W.C.; investigation, Y.D., J.L. and Y.W.; resources, M.Y.; data curation, W.C.; writing—original draft preparation, W.C. and Y.L.; writing—review and editing, W.C. and M.Y.; visualization, Y.M.; supervision, Y.K.; project administration, J.W.; funding acquisition, G.Q. All authors have read and agreed to the published version of the manuscript.

Funding

This study was funded by the National Natural Science Foundation of China (NSFC) Regional Program (Grant Nos. 52069001 and 52269009); Gansu Agricultural University, the fifth batch of “Fuxi Young Talents” project (Grant No. Gaufx-05Y11); Gansu Agricultural University, the Youth Tutor Support Fund (Grant No. GAU-QDFC-2023-12), the Gansu Provincial Science and Technology Key R&D Program (Grant No. 22YF7NA110), and the Gansu Agricultural University “Innovation of Efficient Utilization of Soil and Water Resources for Specialty Crops in Northwest Arid Regions” Discipline Team Building Special Project (Grant No. GAU-XKTD-2022-09).

Data Availability Statement

All data supporting this study are included in the article.

Acknowledgments

The authors would like to thank all funding organizations and lab facilities. We also gratefully acknowledge the anonymous reviewers for their constructive comments.

Conflicts of Interest

The authors declare no conflicts of interest.

References

  1. Ren, Y.J.; Guo, W.S.; Sun, W. Annual forecasting of high-temperature days in China through grey wolf optimization-based support vector machine ensemble. Int. J. Climatol. 2023, 43, 25212540. [Google Scholar] [CrossRef]
  2. Hu, T.; Xiong, K.N.; Wang, J. Intercropping peanut under forests can reduce soil N2O emissions in karst desertification control. Forests 2023, 14, 1652. [Google Scholar] [CrossRef]
  3. IPCC. Climate Change 2023: Synthesis Report. Contribution of Working Groups I, II and III to the Sixth Assessment Report of the Intergovernmental Panel on Climate Change. 2023. Available online: https://www.ipcc.ch/report/ar6/syr/ (accessed on 28 April 2025).
  4. Wang, C.; Amon, B.; Schulz, K.; Mehdi, B. Factors that influence nitrous oxide emissions from agricultural soils as well as their representation in simulation models: A review. Agronomy 2021, 11, 770. [Google Scholar] [CrossRef]
  5. Good, A.G.; Beatty, P.H. Fertilizing Nature: A tragedy of excess in the commons. PLoS Biol. 2011, 9, e1001124. [Google Scholar] [CrossRef]
  6. Bolo, P.; Muna, M.M.; Kinyua, M.; George, A.; Nyawira, S.S.; Kihara, J. Nitrogen and phosphorus mineralization and their corresponding monetary values under long-term integrated soil fertility management practices. J. Sustain. Agric. Environ. 2024, 3, e12100. [Google Scholar] [CrossRef]
  7. Xu, C.L.; Huang, S.B.; Tian, B.; Ren, J.H.; Meng, Q.F.; Wang, P. Manipulating planting density and nitrogen fertilizer application to improve yield and reduce environmental impact in Chinese maize production. Front. Plant Sci. 2017, 8, 1234. [Google Scholar] [CrossRef] [PubMed]
  8. Wu, P.; Fu, L.; Li, H.; Cai, T.; Zhang, P.; Jia, Z.K. Suitable fertilizer application depth can increase nitrogen use efficiency and maize yield by reducing gaseous nitrogen losses. Sci. Total Environ. 2021, 781, 146787. [Google Scholar] [CrossRef]
  9. Verma, K.K.; Song, X.P.; Degu, H.D.; Guo, D.J.; Joshi, A.; Huang, H.; Xu, L.; Singh, M.; Huang, D.L.; Rajput, V.D.; et al. Recent advances in nitrogen and nano-nitrogen fertilizers for sustainable crop production: A mini-review. Chem. Biol. Technol. Agric. 2023, 10, 111. [Google Scholar] [CrossRef]
  10. Wang, X.; Wang, M.; Chen, L.; Shutes, B.; Yan, B.X.; Zhang, F.M.; Jiao, L.Y.; Zhu, H.L. Nitrogen migration and transformation in a saline-alkali paddy ecosystem with application of different nitrogen fertilizers. Environ. Sci. Pollut. Res. 2023, 30, 51665–51678. [Google Scholar] [CrossRef]
  11. Ibragimova, R.R.; Yartsev, G.F.; Baikasenov, R.K.; Aysuvakova, T.P.; Kartabayeva, B.B.; Tseiko, V.I.; KosColapov, B.M. Productivity and quality of spring soft wheat grain depending on root feeding with liquid nitrogen fertilizers on black soils of South Orenburg region. IOP Conf. Ser. Earth Environ. Sci. 2021, 901, 12061. [Google Scholar] [CrossRef]
  12. Ye, J.; Liu, C. Suitability of mulch and ridge-furrow techniques for maize across the precipitation gradient on the Chinese loess plateau. J. Agric. Sci. 2012, 4, 182. [Google Scholar] [CrossRef]
  13. Droma, D.; Zeng, K.; Yin, B.; Li, Q.; Yao, Y.L. Eliminating NH3, NO, and N2O emissions simultaneously in a wheat field by urea point placement. Chin. J. Soil Fert. 2024, 6, 18–26. [Google Scholar]
  14. Saravanakumar, S. Integrated nitrogen management in rice (Oryza sativa) under system rice intensification. Indian J. Agric. Sci. 2020, 90, 843–846. [Google Scholar] [CrossRef]
  15. Mohan, S. GPS and sensor-based technologies in variable rate fertilizer application. Int. J. Agric. Environ. Biotechnol. 2021, 14, 21–27. [Google Scholar] [CrossRef]
  16. Megersa, G.; Abdulahi, J. Irrigation system in Israel: A review. Int. J. Water Resour. Environ. Eng. 2015, 7, 29–37. [Google Scholar]
  17. Długosz, A.P.; Długosz, J.; Gryta, A.; Frąc, M. Responses of N-cycling enzyme activities and functional diversity of soil microorganisms to soil depth, pedogenic processes and cultivated plants. Agronomy 2022, 12, 264. [Google Scholar] [CrossRef]
  18. Bañeras, L.; Ruiz-Rueda, O.; López-Flores, R.; Quintana, X.D.; Hallin, S. The role of plant type and salinity in the selection for the denitrifying community structure in the rhizosphere of wetland vegetation. Int. Microbiol. 2012, 15, 89–99. [Google Scholar]
  19. Zhang, X.; Wang, R.; Liu, B.; Wang, Y.; Yang, L.; Zhao, J.; Xu, J.; Li, Z.; Zhang, X.; Han, Q. Optimization of ridge–furrow mulching ratio enhances precipitation collection before silking to improve maize yield in a semi–arid region. Agric. Water Manag. 2023, 275, 108041. [Google Scholar] [CrossRef]
  20. Liu, K.; Shi, Y.; Yu, Z.; Zhang, Z.; Zhang, Y. Improving photosynthesis and grain yield in wheat through ridge–furrow ratio optimization. Agronomy 2023, 13, 2413. [Google Scholar] [CrossRef]
  21. Pan, H.F.; Zhao, W.Y.; Shi, R.J.; Li, L.; Dai, F.; Deng, H.; Zhao, Y.M. Analysis and research on production effects of full-film double ridge-furrow mulching with polyethylene film and biodegradable film based on AquaCrop. Agronomy 2024, 14, 111. [Google Scholar] [CrossRef]
  22. Lou, D.J.; Zhang, X.L.; Cong, Z.Y.; Xue, Y.; Jiang, L.X. Temperature-increasing characteristics of mulching planting mode of the double-shallow-furrow in broader-row ridges in western Heilongjiang during maize seeding. Chin. J. Agrometeorol. 2021, 42, 666–675. [Google Scholar]
  23. Zhang, Y.F.; Li, H.W.; He, J.; Wang, Q.J.; Chen, Y.; Chen, W.Z.; Edemond, S.K. Effect of mulching with maize straw on water infiltration and soil loss at different initial soil moistures in a rainfall simulation. Front. Agr. Sci. Eng. 2016, 3, 161–170. [Google Scholar] [CrossRef]
  24. Li, Y.G.; Zhang, Z.H.; Zhang, J.Z.; Li, W.H. Effects of liquid mulch on physiological characteristics and yield of drip-irrigated cotton. J. Agric. Eng. 2015, 31, 105–112. [Google Scholar]
  25. Galetto, S.L.; Bini, Â.R.; Haliski, A.; Scharr, D.A.; Borszowskei, P.R.; Caires, E.F. Nitrogen fertilization in top dressing for wheat crop in succession to soybean under a no-till system. Bragantia 2017, 76, 282–291. [Google Scholar] [CrossRef]
  26. Chen, N.; Li, X.; Shi, H.; Yan, J.; Hu, Q.; Zhang, Y. Assessment and modeling of maize evapotranspiration and yield with plastic and biodegradable film mulch. Agric. For. Meteorol. 2021, 307, 108474. [Google Scholar] [CrossRef]
  27. Hu, G.H.; Wang, J.K.; Wang, Y.L.; Zhu, D.F.; Chen, H.Z.; Xiang, J.; Zhang, Y.K.; Zhang, Y.P. Effects of biodegradable film mulching on nitrogen use efficiency and yield of machine-transplanted rice. J. Ecol. Environ. 2020, 29, 977–986. [Google Scholar]
  28. Wei, J.T.; Guo, W.Z.; Yang, X.H.; Chen, F.; Zhang, N.F.; Diao, Q.Y. Effects of ramie substituting different ratios of alfalfa on growth performance, serum biochemical indexes and nutrient apparent digestibility of Boer goats. J. Anim. Nutr. 2018, 30, 4202–4209. [Google Scholar]
  29. Yin, M.H.; Ma, Y.L.; Kang, Y.X.; Jia, Q.; Qi, G.P.; Wang, J.H. Meta-analysis of the effect of nitrogen addition on yield and quality of alfalfa in China. J. Grass Ind. 2022, 31, 36–49. [Google Scholar]
  30. Gansu Animal Husbandry and Veterinary Bureau. Gansu to promote the transformation and upgrading of animal husbandry by switching from grain to fodder. China Anim. Husb. 2020, 19, 22–23. [Google Scholar]
  31. Yang, Y.Y.; Gao, Z.L.; Wang, X.J. Effects of organic and inorganic nitrogen fertilizer application on alfalfa yield, soil nitrate nitrogen and greenhouse gas emissions. J. Appl. Ecol. 2016, 27, 822–828. [Google Scholar]
  32. Zhao, Y.; Wang, Y.Q.; Sun, S.N.; Li, W.T.; Zhu, L.; Yan, X.B. Different forms and proportions of exogenous nitrogen promote the growth of alfalfa by increasing soil enzyme activity. Plants 2022, 11, 1057. [Google Scholar] [CrossRef] [PubMed]
  33. Wang, S.; Chen, X.L.; Li, W.Q.; Wang, X.J.; Sun, L.; Zhang, L.; Gu, X.J.; Liu, Y.; Pan, Y.Q.; Zhang, F.B.; et al. Effects of nitrogen utilization efficiency and soil inorganic nitrogen content. J. Ecol. Environ. 2013, 22, 387–391. [Google Scholar]
  34. Ma, Y.Y.; Sun, H.M.; Yang, Y.R.; Li, Z.; Li, P.; Qiao, Y.T.; Zhang, Y.J.; Zhang, K.; Bai, Z.Y.; Li, A.C.; et al. Long-term nitrogen fertilizer management for enhancing use efficiency and sustainable cotton (Gossypium Hirsutum L.). Front. Plant Sci. 2023, 14, 1271846. [Google Scholar] [CrossRef]
  35. Zhao, J.J.; Zheng, W.; Zhou, D.Y.; Ma, G.H.; Xiong, H.L. Effects of endophytic nitrogen-fixing bacteria on yield and photochemical efficiency of alfalfa under different nitrogen application levels. Grass Sci. 2025; in press. [Google Scholar]
  36. Lu, G.M.; Gu, L.F.; Liu, Y.X.; Ren, Z.; Shi, Y.; Xu, Z.R.; Zhou, G.S.; Lu, H.T.; Wang, X.S.; Zhang, W.D.; et al. Effects of planting density and nitrogen application interactions on growth performance and physiological characteristics of alfalfa in saline soil. Grass Sci. 2021, 38, 1570–1578. [Google Scholar]
  37. Belyaeva, O.; Ward, G.; Wijesinghe, T.; Chen, D.; Suter, H. Influence of soil organic matter, fertiliser formulation and season on fertilizer nitrogen use efficiency in temperate pastures. Nutr. Cycling Agroecosyst. 2024, 129, 133–150. [Google Scholar] [CrossRef]
  38. Gao, X.J.; Li, G.H.; Lu, W.P.; Lu, D.L. Effects of controlled-release urea and normal urea on yield and nitrogen uptake and utilization in glutinous maize. J. Plant Nutr. Fert. 2022, 28, 1614–1625. [Google Scholar]
  39. Sun, Y.Y.; Yuan, X.C.; Chen, K.R.; Wang, H.Y.; Luo, Y.H.; Guo, C.L.; Wang, Z.L.; Shu, C.H.; Yang, Y.G.; Weng, Y.J.; et al. Improving the yield and nitrogen use efficiency of hybrid rice through rational use of controlled-release nitrogen fertilizer and urea topdressing. Front. Plant Sci. 2023, 14, 1240238. [Google Scholar] [CrossRef]
  40. Gałczyńska, M.; Gamrat, R.; Burczyk, P. Effect of nitrogen fertilization on N2O emission in different soil reactions and grown grass species. Appl. Ecol. Environ. Res. 2018, 16, 6761–6777. [Google Scholar] [CrossRef]
  41. Ratke, R.F.; Verginassi, A.; Basto, D.D.; Morgado, H.S.; Souza, M.R.; Fernandes, E.P. Production and levels of foliar nitrogen in rocket salad fertilized with controlled-release nitrogen fertilizers and urea. Hortic. Bras. 2011, 29, 246–249. [Google Scholar] [CrossRef]
  42. Jin, H.Y.; Xie, Y.X.; Liu, Y.; Ma, D.Y.; Zhu, Y.Q.; Wang, Z.Y.; He, D.X. Research on the appropriate application rate and application method of short controlled release period urea on winter wheat. J. Plant Nutr. Fert. 2016, 22, 542–549. [Google Scholar]
  43. Wang, J.X.; Hu, J.Y.; Zhang, W.; Wei, Q.; Wang, T.; Wang, X.L.; Zhang, X.; Zhang, P.P. Effects of mulching on photosynthetic material production and water use efficiency of intercropped maize. Chin. Agric. Sci. 2025, 58, 460–477. [Google Scholar]
  44. Miceli, G.D.; Iacuzzi, N.; Leto, C.; Cozzolino, E.; Di Mola, I.; Ottaiano, L.; Mori, M.; Bella, S.L. Assessment of yield and quality of eggplant (Solanum melongena L.) fruits improved by biodegradable mulching film in two different regions of southern Italy. Agronomy 2024, 14, 867. [Google Scholar] [CrossRef]
  45. Samphire, M.; Chadwick, D.R.; Jones, D.L. Biodegradable plastic mulch films increase yield and promote nitrogen use efficiency in organic horticulture. Front. Agron. 2023, 5, 1141608. [Google Scholar] [CrossRef]
  46. Lv, Y.R.; Wang, J.H.; Yin, M.H.; Kang, Y.K.; Ma, Y.; Jia, Q.X.; Qi, G.P.; Jiang, Y.H.; Lu, Q.; Chen, X.L. Effects of planting and nitrogen application patterns on alfalfa yield, quality, water-nitrogen use efficiency, and economic benefits in the Yellow River irrigation region of Gansu province, China. Water 2023, 15, 251. [Google Scholar] [CrossRef]
  47. DeVetter, L.W.; Zhang, H.; Ghimire, S.; Watkinson, S.; Miles, C.A. Plastic biodegradable mulches reduce weeds and promote crop growth in day-neutral strawberry in western Washington. Hortscience 2017, 52, 1700–1706. [Google Scholar] [CrossRef]
  48. Li, F.; Li, X.G.; Javaid, M.M.; Ashraf, M.; Zhang, F. Ridge-furrow plastic film mulching farming for sustainable dryland agriculture on the Chinese Loess Plateau. Agron. J. 2020, 112, 3284–3294. [Google Scholar] [CrossRef]
  49. Lu, Q.; Qi, G.; Yin, M.; Kang, Y.; Ma, Y.; Jia, Q.; Wang, J.; Jiang, Y.; Wang, C.; Gao, Y. Alfalfa cultivation patterns in the Yellow River irrigation area on soil water and nitrogen use efficiency. Agronomy 2024, 14, 874. [Google Scholar] [CrossRef]
  50. Feng, Y.; Shi, H.; Jia, Y.; Miao, Q.; Jia, Q.; Wang, N. Infiltration and water use efficiency of maize fields with drip irrigation and biodegradable mulches in the West Liaohe Plain, China. Plants 2023, 12, 975. [Google Scholar] [CrossRef]
  51. Yang, L.; Zhang, X.; Ju, X. Linkage between N2O emission and functional gene abundance in an intensively managed calcareous fluvo-aquic soils. Sci. Rep. 2017, 7, 43283. [Google Scholar] [CrossRef]
  52. Oikawa, P.Y.; Ge, C.; Wang, J.; Eberwein, J.R.; Liang, L.L.; Allsman, L.A.; Grantz, D.A.; Jenerette, G.D. Unusually high soil nitrogen oxide emissions influence air quality in a high-temperature agricultural Region. Nat. Commun. 2015, 6, 8753. [Google Scholar] [CrossRef] [PubMed]
  53. Wu, K.; Zhang, Z.; Feng, L.; Bai, W.; Feng, C.; Song, Y.; Gong, P.; Meng, Y.; Zhang, L. Effects of corn stalks and urea on N2O production from corn field soil. Agronomy 2021, 11, 2009. [Google Scholar] [CrossRef]
  54. Yao, F.Y.; Wang, L.C.; Duo, X.Q.; Liu, Z.M.; Lu, Y.J.; Cao, Y.J.; Wei, W.W.; Wang, Y.J. Effects of different nitrogen fertilizers on annual emissions of greenhouse gas from maize field in Northeast China. J. Appl. Ecol. 2019, 30, 1303–1311. [Google Scholar]
  55. Zhao, Y.; Lu, G.; Jin, X.; Wang, Y.; Ma, K.; Zhang, H.; Yan, H.; Zhou, X. Effects of microbial fertilizer on soil fertility and Alfalfa rhizosphere microbiota in Alpine grassland. Agronomy 2022, 12, 1722. [Google Scholar] [CrossRef]
  56. Han, J.; Tao, L.; Wang, M. Well-to-wake analysis of ethanol-to-jet and sugar-to-jet pathways. Biotechnol. Biofuels 2017, 10, 21. [Google Scholar] [CrossRef]
  57. Song, L.; Niu, S.L. Increased soil microbial AOB amoA and narG abundances sustain long-term positive responses of nitrification and denitrification to N deposition. Soil Biol. Biochem. 2022, 166, 108539. [Google Scholar] [CrossRef]
  58. Song, L.; Pan, J.X.; Wang, J.S.; Yan, Y.J.; Niu, S.L. Nitrification derived N2O emission increases but denitrification derived N2O emission decreases with N enrichment in both topsoil and subsoil. Catena 2023, 222, 106890. [Google Scholar] [CrossRef]
  59. Feng, D.; Hao, Q.J.; Zhang, K.L.; Shi, J.L.; Shi, X.Y.; Jiang, C.S. Effects of plastic film mulching on N2O emissions from a vegetable field. Environ. Sci. 2017, 38, 4380–4389. [Google Scholar]
  60. Chen, Q.; Hu, N.; Zhang, Q.; Sun, H.; Zhu, L. Effects of biodegradable plastic film mulching on the global warming potential, carbon footprint, and economic benefits of garlic production. Agronomy 2024, 14, 504. [Google Scholar] [CrossRef]
  61. Meng, C.; Zhao, J.; Wang, N.; Yang, K.; Wang, F. Black plastic film mulching increases soil nitrous oxide emissions in arid potato fields. Int. J. Environ. Res. Public Health 2022, 19, 16030. [Google Scholar] [CrossRef]
  62. Han, W.; Chen, L.; Su, X.; Liu, D.; Jin, T.; Shi, S.; Li, T.; Liu, G. Effects of soil physico-chemical properties on plant species diversity along an elevation gradient over alpine grassland on the Qinghai-Tibetan Plateau, China. Front. Plant Sci. 2022, 13, 822268. [Google Scholar] [CrossRef] [PubMed]
  63. Li, N.; Qi, W.; Jiang, C.; Liu, H.; Liu, E. Effects of plastic film mulching on soil respiration and its sensitivity to temperature and water content. Environ. Technol. Innovation. 2024, 36, 103780. [Google Scholar] [CrossRef]
  64. Jia, H.; Wang, Z.; Zhang, J.; Li, W.; Ren, Z.; Jia, Z.; Wang, Q. Effects of biodegradable mulch on soil water and heat conditions, yield and quality of processing tomatoes by drip irrigation. J. Arid. Land. 2020, 12, 819–836. [Google Scholar] [CrossRef]
  65. Chen, H.; Hou, H.; Hu, H.; Shang, Z.; Zhu, Y.; Cai, H.; Qaisar, S. Aeration of different irrigation levels affects net global warming potential and carbon footprint for greenhouse tomato systems. Sci. Hortic. 2018, 242, 10–19. [Google Scholar] [CrossRef]
  66. Taylor, A.E.; Mellbye, B.L. Differential responses of the catalytic efficiency of ammonia and nitrite oxidation to changes in temperature. Front. Microbiol. 2022, 13, 817986. [Google Scholar] [CrossRef] [PubMed]
  67. Sun, S.X.; Tao, R.; Yang, S.L.; Mao, H.M.; Bi, Y.F. Correlation study between the content of alfalfa FAN cellulose and in vitro digestibility. Southwest J. Agric. 2012, 25, 2356–2359. [Google Scholar]
  68. Chen, H.; Shang, Z.; Cai, H.; Zhu, Y. Response of soil N2O emissions to soil microbe and enzyme activities with aeration at two irrigation levels in greenhouse tomato (Lycopersicon esculentum mill.) fields. Atmosphere 2019, 10, 72. [Google Scholar] [CrossRef]
  69. Mumford, M.T.; Rowlings, D.W.; Scheer, C.; De Rosa, D.; Grace, P.R. Effect of irrigation scheduling on nitrous oxide emissions in intensively managed pastures. Agric. Ecosyst. Environ. 2019, 272, 126–134. [Google Scholar] [CrossRef]
  70. Arriero, S.S.; Almeida, W.F.; Paz, V.P.; Damasceno, L.F. Yield of eggplant using low quality water and pulse drip irrigation. Rev. Bras. Eng. Agríc. Ambient. 2020, 24, 822–826. [Google Scholar] [CrossRef]
  71. Wang, H.; Yan, Z.; Ju, X.; Song, X.; Zhang, J.; Li, S.; Zhu-Barker, X. Quantifying nitrous oxide production rates from nitrification and denitrification under various moisture conditions in agricultural soils: Laboratory study and literature synthesis. Front. Microbiol. 2023, 13, 1110151. [Google Scholar] [CrossRef]
  72. Krichels, A.H.; Jenerette, G.D.; Shulman, H.; Piper, S.; Greene, A.C.; Andrews, H.M.; Botthoff, J.; Sickman, J.O.; Aronson, E.L.; Homyak, P.M. Bacterial denitrification drives elevated N2O emissions in arid southern california drylands. Sci. Adv. 2023, 9, 1989. [Google Scholar] [CrossRef] [PubMed]
  73. Şenbayram, M.; Chen, R.; Budai, A.; Bakken, L.R.; Dittert, K. N2O emission and the N2O/(N2O+N2) product ratio of denitrification as controlled by available carbon substrates and nitrate concentrations. Agric. Ecosyst. Environ. 2012, 147, 4–12. [Google Scholar] [CrossRef]
  74. Wang, W.; Guo, L.P.; Li, Y.C.; Su, M.; Lin, Y.B.; Perthuis, C.D.; Ju, X.T.; Lin, E.; Moran, D. Greenhouse gas intensity of three main crops and implications for low-carbon agriculture in China. Clim. Change 2014, 128, 57–70. [Google Scholar] [CrossRef]
  75. Chen, H.; Liu, J.; Zhang, A.; Chen, J.; Cheng, G.; Sun, B.; Pi, X.; Dyck, M.; Cheng, B.; Zhao, Y.; et al. Effects of straw and plastic film mulching on greenhouse gas emissions in loess plateau, China: A field study of 2 consecutive wheat-maize rotation cycles. Sci. Total Environ. 2017, 579, 814–824. [Google Scholar] [CrossRef]
  76. Zeng, Y.; Li, F.S. Impacts of nitrogen fertilizer substitution on greenhouse gas emission in a paddy field of South China under ridge irrigation. J. Soil Sci. Plant Nutr. 2021, 22, 837–847. [Google Scholar] [CrossRef]
  77. Wang, X.; Cao, B.; Zhou, Y.; Zhao, M.; Chen, Y.; Zhang, J.; Wang, J.; Liang, L. Effects of long-term controlled-release urea on soil greenhouse gas emissions in an open-field lettuce system. Plants 2024, 13, 1071. [Google Scholar] [CrossRef] [PubMed]
  78. Jing, J.Y.; Cong, W.F.; Bezemer, T.M. Legacies at work: Plant-soil-microbiome interactions underpinning agricultural sustainability. Trends Plant Sci. 2022, 27, 781–792. [Google Scholar] [CrossRef]
  79. Zhao, Z.J.; Hao, Q.J.; Tu, T.T.; Hu, M.L.; Zhang, X.Y.; Jiang, C.S. Effect of ferric-carbon micro-electrolysis on greenhouse gas emissions from constructed wetlands. Environ. Sci. 2021, 42, 3482–3493. [Google Scholar]
  80. Zou, J.W.; Hang, Y.; Zong, L.G.; Zheng, X.H.; Wang, Y.S. A field study on CO2, CH4 and N2O emissions from rice paddy and impact factors. J. Environ. Sci. 2003, 6, 758–764. [Google Scholar]
  81. Lu, J.J.; Nie, Y.F.; Wei, J.J.; Shen, H.Y.; Hua, M.X.; Xu, M.C.; Wang, Y.L. Effects of different nitrogen application measures on NH3 volatilization and N2O emission from wolfberry soil. J. Agric. Sci. 2022, 41, 210–220. [Google Scholar]
  82. Li, M.W.; Zhu, Q.H.; Liu, H.; Xia, X.M.; Huang, D.Y. Method for detecting soil total nitrogen contents based on pyrolysis and artificial olfaction. Int. J. Agric. Biol. Eng. 2022, 15, 167–176. [Google Scholar] [CrossRef]
Figure 1. Impact of nitrogen application patterns on alfalfa yields. Note: Error bars indicate 95% confidence intervals. Different lowercase letters indicate significant differences between treatments (p < 0.05): (a,c) alfalfa yields with controlled-release nitrogen fertilizer applied in 2023 and 2024, respectively; (b,d) alfalfa yields with urea applied in 2023 and 2024. N0 represents no nitrogen application; C1, C2, and C3 represent controlled-release nitrogen fertilizer applications of 80 kg·hm−2, 160 kg·hm−2, and 240 kg·hm−2, respectively; and U1, U2, and U3 represent urea applications of 80 kg·hm−2, 160 kg·hm−2, and 240 kg·hm−2, respectively.
Plants 14 02022 g001
Figure 2. The impact of planting nitrogen application patterns on soil N2O emission fluxes. Note: Error bars and dots in the figure represent 95% confidence intervals and emission fluxes, respectively, and dashed arrows represent urea application: (ac) flat planting without mulching, biodegradable film mulching, and plastic film mulching, respectively, in 2023; (df) flat planting without mulching, biodegradable film mulching, and plastic film mulching, respectively, in 2024. N0 represents no nitrogen application; C1, C2, and C3 represent controlled-release nitrogen fertilizer applications of 80 kg·hm−2, 160 kg·hm−2, and 240 kg·hm−2, respectively; and U1, U2, and U3 represent urea applications of 80 kg·hm−2, 160 kg·hm−2, and 240 kg·hm−2, respectively.
Plants 14 02022 g002
Figure 3. The impact of planting nitrogen application patterns on cumulative soil N2O emissions: (a,b) cumulative soil N2O emissions in 2023 and 2024, respectively. Error bars indicate 95% confidence intervals. Different lowercase letters indicate significant differences between treatments (p < 0.05).
Plants 14 02022 g003
Figure 4. The impact of cropping nitrogen application patterns on GWP: GWP in 2023 and 2024, respectively.
Plants 14 02022 g004
Figure 5. The impact of planting nitrogen application pattern on N2O emission intensity: GHGI in 2023 and 2024, respectively.
Plants 14 02022 g005
Figure 6. The impact of planting nitrogen application pattern on soil temperature: (ac) flat planting without mulching, biodegradable film mulching, and plastic film mulching treatments, respectively.
Plants 14 02022 g006
Figure 7. The impact of planting nitrogen application pattern on soil water content: (ac) flat planting without mulching, biodegradable film mulching, and plastic film mulching treatments, respectively.
Plants 14 02022 g007
Figure 8. The correlation of soil N2O emission fluxes with soil environmental factors. Data in the figure are averaged; dots indicate N2O emission fluxes; straight lines indicate linear fit curves for N2O emission fluxes; shaded bands indicate 95% confidence bands for N2O emission fluxes.
Plants 14 02022 g008
Figure 9. The composite score of yield increase and emission reduction of alfalfa grassland under the planting nitrogen application mode.
Plants 14 02022 g009
Figure 10. Schematic layout of the test plot.
Plants 14 02022 g010
Table 1. Analysis of variance for the impact of planting nitrogen application patterns on alfalfa yield.
YearMNBM × NM × BN × BM × N × B
2023*********ns**
2024********ns***
In the table, M is the cropping pattern, N is the nitrogen application level, and B is the type of nitrogen fertilizer. **, *, and ns denote p < 0.01, p < 0.05 and p > 0.05, respectively.
Table 2. Analysis of variance of soil N2O cumulative emissions by planting nitrogen application pattern.
YearMNBM × NM × BN × BM × N × B
2023******nsns*ns
2024******nsns**ns
In the table, M is the cropping pattern, N is the nitrogen application level, and B is the type of nitrogen fertilizer. **, *, and ns denote p < 0.01, p < 0.05 and p > 0.05, respectively.
Table 3. The effect of planting nitrogen application regime on the soil’s quick-acting nitrogen content.
Nitrogen ManagementNO3-N Content (mg·kg−1)NH4+-N Content (mg·kg−1)
FPBMPMFPBMPM
N05.38 ± 0.33 a5.81 ± 1.11 a6.25 ± 0.46 a1.64 ± 0.19 a1.72 ± 016 a1.79 ± 0.25 a
C18.86 ± 0.46 b9.35 ± 0.49 b10.01 ± 0.41 b2.36 ± 0.63 ab2.96 ± 0.39 ab3.02 ± 0.42 ab
C213.47 ± 0.60 d15.25 ± 0.75 c16.98 ± 1.52 c3.69 ± 1.66 ab4.21 ± 0.29 bc4.67 ± 0.41 c
C314.84 ± 0.66 e15.28 ± 0.71 c17.06 ± 0.59 c5.44 ± 0.23 bc5.67 ± 0.41 ab6.21 ± 0.69 d
U110.33 ± 0.58 c12.86 ± 0.61 c14.23 ± 0.58 c2.28 ± 0.98 c2.96 ± 0.18 d3.32 ± 0.36 b
U214.21 ± 0.45 de16.79 ± 1.38 c17.22 ± 0.28 c3.14 ± 0.68 bc4.88 ± 0.63 cd5.08 ± 0.71 cd
U317.56 ± 0.75 f19.19 ± 0.24 d20.78 ± 1.47 d5.28 ± 0.77 c5.75 ± 1.34 d6.23 ± 0.92 d
M****
N**ns
B****
M × N**
M × Bnsns
N × B**ns
M × N × Bnsns
In the table, M is the cropping pattern, N is the nitrogen application level, and B is the type of nitrogen fertilizer. Different lowercase letters indicate significant differences between treatments (p< 0.05). **, *, and ns denote p < 0.01, p < 0.05 and p > 0.05, respectively.
Table 4. Principal component factor loadings and variance contributions.
IngredientFactor Load
Principal Component 1Principal Component 2Principal Component 3
T0.4860.0600.720
W0.4530.415−0.324
Y0.2620.7560.498
N0.6210.512−0.426
A0.5850.516−0.378
E0.674−0.729−0.100
GWP0.674−0.729−0.100
GHGI0.890−0.0590.324
Eigenvalue2.9382.3421.320
Variance contribution rate/%36.72329.2816.498
Cumulative contribution rate/%36.72366.00382.502
Table 5. Field trial treatment design.
Cropping PatternsNitrogen Fertilizer Management
Nitrogen Fertilizer TypesNitrogen Application Levels
(kg·hm−2)
Application Rate Between
First, Second and Third Crops
Flat planting without mulching
(FP)
Urea
(U)
806:2:2
1606:2:2
2406:2:2
Controlled-release
nitrogen fertilizer
(C)
801:0:0
1601:0:0
2401:0:0
0
Biodegradable film
(BM)
Urea
(U)
806:2:2
1606:2:2
2406:2:2
Controlled-release
nitrogen fertilizer
(C)
801:0:0
1601:0:0
2401:0:0
0
Plastic film
(PM)
Urea
(U)
806:2:2
1606:2:2
2406:2:2
Controlled-release
nitrogen fertilizer
(C)
801:0:0
1601:0:0
2401:0:0
0
Disclaimer/Publisher’s Note: The statements, opinions and data contained in all publications are solely those of the individual author(s) and contributor(s) and not of MDPI and/or the editor(s). MDPI and/or the editor(s) disclaim responsibility for any injury to people or property resulting from any ideas, methods, instructions or products referred to in the content.