Abstract
Plant responses to heat stress include complex transcriptional networks and protein regulations in which BTB/POZ-MATH (BPM) proteins participate as a part of ubiquitin-mediated protein degradation. Arabidopsis thaliana contains six BPM genes involved in responses to environmental changes, including heat. Seedlings overexpressing BPM1 (oeBPM1), seedlings with downregulation of BPM1, 4, 5, and 6 (amiR-bpm) and wild type were exposed to 37 °C for 6 h. Treatment caused stronger decline of photosynthesis in oeBPM1 than in amiR-bpm and wild type, although all seedlings recovered after 24 h at 24 °C. The activity of the antioxidant enzymes catalase, guaiacol peroxidase, and ascorbate peroxidase remained unchanged in oeBPM1, but increased in amiR-bpm and wild type. Heat stress induced HSP70 and HSP90 in all seedlings but expression remained notably higher in amiR-bpm after recovery. DREB2A and HSFA3 expression increased in all seedlings immediately after stress, with the strongest induction in amiR-bpm. In amiR-bpm and wild type, BPM2 expression was induced immediately after exposure, while BPM1, BPM3, BPM4, and BPM6 were upregulated in wild type after recovery. In oeBPM1 seedlings, BPM4 expression decreased and BPM6 expression increased immediately after treatment at 37 °C for 6 h. The results suggest that BPM proteins modulate heat stress response by influencing photosynthesis, activation of antioxidant enzymes, accumulation of HSPs, and expression of heat-responsive genes, thus contributing to the different physiological strategies observed in A. thaliana lines with altered expression of BPM genes.
1. Introduction
Proteostasis, or protein homeostasis, is essential for the maintenance of cellular function under optimal and stress conditions. The ubiquitin–proteasome system (UPS) is an important pathway that is responsible for selective protein degradation; it ensures the effective removal of misfolded, damaged, or unnecessary proteins [1]. Within this system, the BTB/POZ-MATH (BPM) proteins act as substrate adaptors that target specific proteins for degradation by the cullin3-RING E3 ubiquitin ligase complex [2]. Six BPM genes (BPM1-6) have been identified in Arabidopsis thaliana (L.) Heynh. and their functions are gradually being elucidated. BPM proteins regulate numerous developmental and stress-related processes by mediating the degradation of transcription factors, signalling proteins and enzymes. A study by Weber and Hellmann [3] showed that BPM proteins interact with transcription factors of the APETALA2/ethylene response factor (AP2/ERF) family, which play a crucial role in plant stress responses. The regulation of AP2/ERFs represents the final step in the ethylene signalling pathway, which controls the biosynthesis of important phytohormones such as ethylene, cytokinins, gibberellins, and abscisic acid (ABA) [4,5]. Further research revealed that BPM proteins interact directly with another transcription factor, the homeobox–leucine zipper protein ATHB6, a negative regulator of the ABA signalling pathway [6]. BPM proteins are also involved in fatty acid metabolism as they interact with the transcriptional activator wrinkled 1 (WRI1), an important regulator of lipid biosynthesis [7]. In addition, the BPM proteins influence the stability of MYB-domain protein 56 (MYB56), a negative regulator of flowering, further emphasizing their role in developmental control [8]. Recently, a novel function of the BPM1 protein beyond the UPS has been proposed, showing that it directly interacts with the proteins defective in meristem silencing 3 (DMS3) and RNA-directed DNA methylation 1 (RDM1), both of which are integral components of the RNA-directed DNA methylation (RdDM) mechanism [9]. BPM1-6 transcripts have been detected in various organs of A. thaliana seedlings, including cotyledons, hypocotyls, and roots [10], and BPM proteins are expressed in different cell types such as guard cells, mesophyll cells, and epidermal root cells [6,11]. Their subcellular localisation in the nucleus and cytosol suggests their involvement in the regulation of various stress-related signalling pathways [3,12].
One of the major environmental factors affecting the survival and productivity of plants is heat stress. The global rise in temperature poses a serious threat to agricultural yields, as even moderately elevated temperatures can disrupt cellular homeostasis and cause irreversible damage to proteins and membranes [13,14,15]. Photosynthesis is one of the most heat-sensitive physiological processes, as it is highly dependent on the fluidity and functionality of membranes, protein complexes, and many enzymes. Photosystem II (PSII) is an important component of the photochemical reactions of photosynthesis and is very sensitive to elevated temperatures leading to a decrease in photosynthetic performance [16,17]. A widely used technique to assess PSII functionality is the induction of chlorophyll a (Chl a) fluorescence and analysis by the JIP-test. Measured and calculated parameters obtained by this method, such as the maximum quantum yield of PSII photochemistry (FV/FM) and the performance index on absorption basis (PIABS), describe the overall efficiency of photosynthesis. Additionally, the specific energy fluxes associated with PSII activity include light absorption (ABS), trapping of excitation energy (TR0), conversion to electron transport (ET0), and dissipation of excess energy, mainly in the form of heat (DI0), all of which are generally expressed per active reaction centre (RC) of PSII [18,19]. Heat stress also affects the composition of photosynthetic pigments (chlorophylls and carotenoids), which can be a useful indication of the stress-induced changes [17,20]. Various abiotic and biotic stress factors, including elevated temperatures, lead to the formation of reactive oxygen species (ROS) [21]. The main source of ROS in plant cells are photosynthetic reactions in the chloroplasts, but ROS are also formed in other cell compartments and membranes. They are involved in many signalling pathways, but excessive production of ROS, especially hydrogen peroxide (H2O2) and superoxide radicals (O2•−), can cause oxidative damage to lipids, proteins, and nucleic acids, ultimately compromising cellular integrity [21,22,23]. To mitigate the accumulation of ROS, plants have developed complex antioxidant defence systems consisting of enzymatic and non-enzymatic components. Key antioxidant enzymes, including superoxide dismutase (SOD), catalase (CAT), ascorbate peroxidase (APX), and guaiacol peroxidase (G-POD), play a crucial role in neutralising ROS and preventing oxidative damage [21,24]. In addition, biochemical markers such as malondialdehyde (MDA), a by-product of lipid peroxidation, and proline, an osmoprotectant with ROS-scavenging properties, serve as indicators of oxidative stress level [24,25]. As signalling molecules, ROS can activate heat shock factors (HSFs), a family of transcription factors that regulate the response to heat stress [26,27]. Activated HSFs induce the expression of heat shock proteins (HSPs), molecular chaperones that aid in protein folding, prevent aggregation and facilitate the degradation of misfolded proteins. These protective mechanisms are essential for maintaining cellular homeostasis under heat stress, as uncontrolled protein misfolding and aggregation can lead to cellular dysfunction and ultimately cell death [28,29].
Despite the increasing knowledge about the function of BPM proteins, our understanding of their role in the adaptation of plants to heat stress is still limited. BPM proteins interact with dehydration-responsive element-binding protein 2A (DREB2A), an important transcription factor that regulates the response to heat and drought stress, suggesting that they may modulate stress adaptation by controlling DREB2A stability [12]. In particular, DREB2A plays a central role in the activation of heat-stress-responsive genes by inducing the transcription of HSFA3, which in turn regulates a broad network of stress-responsive genes [30,31]. Further evidence for the involvement of BPM proteins in the response to heat stress is that BPM1 is induced and remains stable at elevated temperatures, particularly at 37 °C [11]. Regardless of these findings, the broader physiological and biochemical functions of BPM proteins during heat stress and their regulatory mechanisms are still poorly understood. Considering their role in protein turnover, further research is needed to elucidate how BPM proteins contribute to heat stress adaptation, in particular their potential to modulate stress-responsive transcription factors, protein stability, oxidative stress balance, and photosynthetic performance.
This study aims to elucidate the role of BPM proteins in heat stress adaptation by analysing the physiological, biochemical, and molecular responses of A. thaliana seedlings with altered expression of BPM genes. The seedling stage is particularly sensitive to unfavourable temperatures and is therefore ideal for studying responses to heat stress, as it directly influences the subsequent survival and development of the plants [32]. Therefore, we investigated the following aspects: (1) photosynthetic performance, assessed by Chl a fluorescence parameters and pigment content; (2) oxidative stress markers, including H2O2, MDA, and proline, alongside the activity of key antioxidant enzymes (G-POD, APX, CAT, and SOD); and (3) the expression of heat-stress-responsive proteins (HSP70, HSP90) and genes (DREB2A, HSFA3, and BPM1-6) in A. thaliana seedlings with overexpression of the BPM1 gene (oeBPM1) and seedlings with reduced expression of the BPM1, 4, 5, and 6 genes (amiR-bpm). We have shown that BPM proteins regulate the response of plants to heat stress by modulating photosynthetic performance, antioxidant defence, and stress-responsive proteins and genes. By elucidating their functional role under heat stress, this study contributes to the existing knowledge on the role of BPM proteins in proteostasis and thermotolerance, providing new insights into the adaptive strategies that plants use to cope with increasing temperatures.
2. Results
2.1. Photosynthetic Responses to Heat Stress in A. thaliana Lines with Altered BPMs Gene Expression
The impact of moderate heat stress (i.e., treated vs. control seedlings) and the tested lines (i.e., wild type vs. oeBPM1 vs. amiR-bpm seedlings) on the photosynthetic efficiency of A. thaliana seedlings was assessed using the JIP-test. The focus was on the analysis of two fluorescence parameters describing photosynthetic efficiency—FV/FM and PIABS.
A two-way ANOVA revealed that only heat treatment significantly affected FV/FM immediately after heat exposure (F = 23.6, p ≤ 0.0001). Accordingly, treated oeBPM1 and amiR-bpm seedlings had significantly lower FV/FM than the control seedlings of these lines (Figure 1a). In contrast, wild-type seedlings showed no significant change in FV/FM after heat stress. PIABS measured immediately after heat treatment differed significantly between control and treated seedlings (F = 22.83, p ≤ 0.0001) and between the tested lines (F = 7.14, p ≤ 0.01). In oeBPM1 and wild-type seedlings, PIABS was significantly reduced in response to heat stress, while no significant changes were observed in amiR-bpm seedlings compared to the corresponding control (Figure 1b). When comparing heat-treated seedlings of different lines, amiR-bpm seedlings showed significantly higher PIABS levels than oeBPM1 and wild-type seedlings. Under control conditions, no significant differences were found between the three lines.
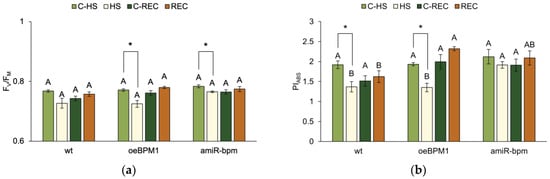
Figure 1.
(a) Maximum quantum yield of PSII photochemistry (FV/FM) and (b) performance index on absorption basis (PIABS) in Arabidopsis thaliana seedlings with BPM1 overexpression (oeBPM1), seedlings with BPM1, 4, 5, and 6 downregulation (amiR-bpm), and wild-type (wt) seedlings. Measurements were taken at two time points: immediately after exposure to 37 °C for 6 h (HS) and after a 24 h recovery at 24 °C (REC). The control groups (C-HS and C-REC) were kept at 24 °C throughout the experiment. Data are expressed as mean ± standard error (n = 5 biological replicates). Differences between two groups—control and heat-treated seedlings sampled at the same time point (immediately after the treatment or after 24 h recovery, i.e., C-HS vs. HS, or C-REC vs. REC)—were determined using Student’s t-test, with significant differences (p ≤ 0.05) indicated by asterisk (*). For comparisons of the tested lines (wild type vs. oeBPM1 vs. amiR-bpm) exposed to the same treatment condition (C-HS, HS, C-REC, or REC), a one-way ANOVA followed by Tukey’s HSD post hoc test was performed, with significant differences (p ≤ 0.05) indicated by different uppercase letters.
After a 24 h recovery period, FV/FM did not differ significantly between control and treated seedlings or between the tested lines. In contrast, the tested lines remained a significant factor influencing PIABS (F = 8.76, p ≤ 0.01). Accordingly, no significant differences were found between control and treated seedlings in all three lines (Figure 1b). However, when comparing the heat-treated seedlings of three tested lines, the oeBPM1 seedlings showed a significantly higher PIABS value than the wild type (Figure 1b), while the amiR-bpm seedlings showed no significant differences compared to the other two lines.
2.2. Specific Energy Fluxes in Photosystem II
To further investigate the observed changes in photosynthetic efficiency, four key parameters of energy flux contributing to PIABS were analysed—ABS/RC, TR0/RC, ET0/RC, and DI0/RC.
Significant changes in ABS/RC observed immediately after heat stress were caused by heat treatment (F = 5.98, p ≤ 0.05), tested lines (F = 4.93, p ≤ 0.05), and their interactions (F = 4.26, p ≤ 0.05). Consequently, a significant increase in ABS/RC was observed in heat-treated oeBPM1 seedlings, while no significant changes were observed in amiR-bpm or wild-type seedlings after heat exposure, compared to the corresponding control (Table 1). When comparing the control seedlings of all three lines, oeBPM1 and amiR-bpm showed significantly lower ABS/RC than the wild type. However, no significant differences were found between the heat-treated seedlings of the tested lines. For TR0/RC and ET0/RC, a significant interaction was observed between heat treatment and the tested lines (TR0/RC: F = 6.74, p ≤ 0.01; ET0/RC: F = 12.21, p ≤ 0.001). A significant reduction in both parameters was observed in heat-treated wild-type seedlings, while no significant differences were observed when comparing the heat-treated and control seedlings of the oeBPM1 and amiR-bpm lines (Table 1). When comparing the control seedlings of three tested lines, both oeBPM1 and amiR-bpm seedlings showed significantly lower TR0/RC and ET0/RC values than the wild type. A significant effect of heat treatment (F = 15.87, p ≤ 0.001) and tested lines (F = 5.42, p ≤ 0.05) was also found for DI0/RC. Heat-treated oeBPM1 and amiR-bpm seedlings had significantly higher DI0/RC compared to the corresponding controls (Table 1), while no significant changes were observed in wild-type seedlings. The comparison of the control seedlings of three tested lines revealed that the oeBPM1 and amiR-bpm seedlings had a significantly lower DI0/RC value than the wild-type seedlings.

Table 1.
Specific energy fluxes—absorption (ABS/RC), trapping (TR0/RC), electron transport (ET0/RC), and dissipation of energy as heat (DI0/RC) per active PSII reaction centre (RC)—in Arabidopsis thaliana seedlings with BPM1 overexpression (oeBPM1), seedlings with BPM1, 4, 5, and 6 downregulation (amiR-bpm), and wild-type (wt) seedlings. Measurements were taken at two time points: immediately after exposure to 37 °C for 6 h (HS) and after a 24 h recovery at 24 °C (REC). The control groups (C-HS and C-REC) were kept at 24 °C throughout the experiment. Data are expressed as mean ± standard error (n = 5 biological replicates). Differences between two groups—control and heat-treated seedlings sampled at the same time point (immediately after the treatment or after 24 h recovery, i.e., C-HS vs. HS, or C-REC vs. REC)—were determined using Student’s t-test. Significant differences (p ≤ 0.05) between C-HS and HS are marked with an asterisk (*). No significant differences were found between C-REC and REC. For comparisons of the tested lines (wild type vs. oeBPM1 vs. amiR-bpm) exposed to the same treatment condition (C-HS, HS, C-REC, or REC), a one-way ANOVA followed by Tukey’s HSD post hoc test was performed, with significant differences (p ≤ 0.05) indicated by different uppercase letters.
After a 24 h recovery period, ABS/RC was significantly affected by the tested lines (F = 7.14, p ≤ 0.01). Thus, when comparing heat-treated and control seedlings, no significant changes were observed, regardless of the line tested (Table 1). However, when comparing the heat-treated seedlings of three A. thaliana lines, oeBPM1 showed significantly lower ABS/RC than the wild type. For TR0/RC and ET0/RC, two-way ANOVA showed no significant effect of heat treatment, the lines tested or their interaction after recovery. In contrast, the tested lines had a significant effect on DI0/RC (F = 8.80, p ≤ 0.01). Accordingly, no significant differences in DI0/RC were found when comparing heat-treated and control seedlings (Table 1). However, when comparing the lines, the DI0/RC of the heat-treated oeBPM1 and amiR-bpm seedlings were significantly lower than those of the wild type.
2.3. Impact of Heat Stress and Modified BPMs Gene Expression on Pigment Composition
In addition to chlorophyll fluorescence, we measured pigment content in wild-type, oeBPM1, and amiR-bpm seedlings to gain a deeper understanding of how the different tested lines affected the photosynthetic performance of the plants under both stress and optimal conditions.
The Chl a content measured immediately after heat treatment was significantly influenced by the interaction between heat stress and the tested lines (F = 4.41, p ≤ 0.05). A significant reduction in Chl a content was observed in heat-treated oeBPM1 seedlings, while no significant changes were observed in heat-treated amiR-bpm or wild-type seedlings compared to the respective controls (Table 2). Comparisons between the control seedlings of all three lines showed that oeBPM1 seedlings had a significantly higher Chl a content than amiR-bpm seedlings. Wild-type seedlings did not differ significantly from the two transgenic lines. Chlorophyll b (Chl b) content remained unchanged in all three A. thaliana lines, with no significant effects of heat treatment, the lines tested, or their interactions (Table 2). In contrast, the interaction between heat stress and the tested lines (F = 4.38, p ≤ 0.05) had a significant effect on the total carotenoids (Cars) content immediately after heat exposure. Accordingly, a significant decrease in Cars content was observed in heat-treated oeBPM1 and wild-type seedlings compared to their respective controls (Table 2). When comparing the control seedlings of the three lines tested, the oeBPM1 seedlings showed a significantly higher Cars content than the amiR-bpm seedlings, while the wild-type seedlings did not differ significantly from the other two lines.
Table 2.
Chlorophyll a (Chl a), chlorophyll b (Chl b), and total carotenoids (Cars) content in Arabidopsis thaliana seedlings with BPM1 overexpression (oeBPM1), seedlings with BPM1, 4, 5, and 6 downregulation (amiR-bpm), and wild-type (wt) seedlings. Samples were collected at two time points: immediately after exposure to 37 °C for 6 h (HS) and after a 24 h recovery at 24 °C (REC). The control groups (C-HS and C-REC) were kept at 24 °C throughout the experiment. Data are expressed as mean ± standard error (n = 5 biological replicates). Differences between two groups—control and heat-treated seedlings sampled at the same time point (immediately after the treatment or after 24 h recovery, i.e., C-HS vs. HS, or C-REC vs. REC)—were determined using Student’s t-test. Significant differences (p ≤ 0.05) between C-HS and HS are marked with an asterisk (*). No significant differences were found between C-REC and REC. For comparisons of the tested lines (wild type vs. oeBPM1 vs. amiR-bpm) exposed to the same treatment condition (C-HS, HS, C-REC, or REC), a one-way ANOVA followed by Tukey’s HSD post hoc test was performed, with significant differences (p ≤ 0.05) indicated by different uppercase letters.
After a recovery period of 24 h, the heat treatment, the tested lines and their interactions had no significant effect on any of the pigments analysed.
2.4. Contribution of Heat Stress and Modified BPMs Gene Expression to Oxidative Stress Levels
To assess heat-induced cell damage in wild-type, oeBPM1, and amiR-bpm seedlings, the level of oxidative stress was determined by measuring characteristic biochemical markers—H2O2, MDA, and proline content.
Immediately after heat stress, H2O2 content was significantly affected by heat treatment (F = 10.64, p ≤ 0.01), the tested lines (F = 17.20, p ≤ 0.0001), and their interactions (F = 6.37, p ≤ 0.01). Heat-treated amiR-bpm and wild-type seedlings showed a significant reduction in H2O2 content, while no significant changes were observed in treated oeBPM1 seedlings compared to the respective controls (Figure 2a). In addition, the difference between the control seedlings and the heat-treated seedlings was more pronounced in the amiR-bpm line than in the wild type. The comparison of the control seedlings of the three tested lines showed that the amiR-bpm seedlings had a significantly higher H2O2 content than the oeBPM1 and wild-type seedlings. On the other hand, the heat-treated seedlings of all three tested lines showed no significant differences. The level of lipid peroxidation, expressed as MDA content, was significantly affected only by the tested lines (F = 8.79, p ≤ 0.01). Consequently, no significant differences in MDA content were observed between the control and the heat-treated seedlings, regardless of the line tested (Figure 2b). Although the difference was not statistically significant, heat-treated amiR-bpm seedlings had a 1.6-fold lower MDA content compared to the corresponding control. When comparing control seedlings of different lines, amiR-bpm seedlings had significantly higher MDA levels than oeBPM1 and wild-type seedlings. Immediately after heat treatment, the proline content was significantly affected by both the heat treatment (F = 16.49, p ≤ 0.001) and the tested lines (F = 60.90, p ≤ 0.0001). A significant reduction in proline content was observed in heat-treated oeBPM1 and wild-type seedlings, while no significant changes were observed in the heat-treated amiR-bpm seedlings compared to the respective control (Figure 2c). When comparing the lines, both the heat-treated and control amiR-bpm seedlings had significantly higher proline content than the oeBPM1 and wild-type seedlings.

Figure 2.
(a) Hydrogen peroxide (H2O2), (b) malondialdehyde (MDA), and (c) proline content in Arabidopsis thaliana seedlings with BPM1 overexpression (oeBPM1), seedlings with BPM1, 4, 5, and 6 downregulation (amiR-bpm), and wild-type (wt) seedlings. Samples were collected at two time points: immediately after exposure to 37 °C for 6 h (HS) and after a 24 h recovery at 24 °C (REC). The control groups (C-HS and C-REC) were kept at 24 °C throughout the experiment. Data are expressed as mean ± standard error (n = 5 biological replicates). Differences between two groups—control and heat-treated seedlings sampled at the same time point (immediately after the treatment or after 24 h recovery, i.e., C-HS vs. HS, or C-REC vs. REC)—were determined using Student’s t-test, with significant differences (p ≤ 0.05) indicated by asterisk (*). For comparisons of the tested lines (wild type vs. oeBPM1 vs. amiR-bpm) exposed to the same treatment condition (C-HS, HS, C-REC, or REC), a one-way ANOVA followed by Tukey’s HSD post hoc test was performed, with significant differences (p ≤ 0.05) indicated by different uppercase letters.
After a 24 h recovery period, only the tested lines had a significant effect on the H2O2 content (F = 5.74, p ≤ 0.01). Accordingly, no significant differences in H2O2 content were observed between control and heat-treated seedlings, regardless of the line tested (Figure 2a). Although not statistically significant, the H2O2 content in heat-treated wild-type seedlings was 1.3-fold lower compared to the corresponding control. When comparing the control seedlings of the different lines, no significant differences in H2O2 content were found. However, when comparing the heat-treated seedlings, the amiR-bpm seedlings had a significantly higher H2O2 content than the wild type. MDA content was significantly affected by both the heat treatment (F = 12.36, p ≤ 0.01) and the tested lines (F = 41.49, p ≤ 0.0001). A significant reduction in MDA content was observed in heat-treated wild-type seedlings compared to the corresponding control (Figure 2b). Interestingly, a comparison of the lines showed that both the control and heat-treated amiR-bpm seedlings had significantly higher MDA content than the oeBPM1 and wild-type seedlings. After the recovery period, the tested lines continued to have a significant influence (F = 94.03, p ≤ 0.0001) on the proline content. Accordingly, no significant differences were found between the heat-treated and control seedlings, regardless of the line tested (Figure 2c). Although not statistically significant, the proline content in heat-treated oeBPM1 seedlings increased 1.3-fold compared to the corresponding control. When comparing the lines, the analysis showed that both the heat-treated and control seedlings of amiR-bpm had significantly higher proline levels than the oeBPM1 and wild-type seedlings. In addition, the oeBPM1 control seedlings had a significantly lower proline content than the wild type.
2.5. Antioxidant Activity in Response to Heat Stress and Modified BPMs Gene Expression
To assess the plant’s ability to attenuate oxidative stress and prevent cell damage, the activity of four antioxidant enzymes—G-POD, APX, CAT, and SOD—was measured.
Immediately after heat exposure, G-POD activity was significantly influenced by the treatment (F = 5.83, p ≤ 0.05). A significant increase in G-POD activity was observed in heat-treated amiR-bpm seedlings compared to the corresponding control (Figure 3a). In contrast, no significant changes were observed in treated oeBPM1 and wild-type seedlings. Although not statistically significant, G-POD activity increased 1.3-fold in treated wild-type seedlings compared to the control. APX activity was also significantly affected by heat treatment (F = 4.54, p ≤ 0.05), while CAT activity was influenced by both heat treatment (F = 10.0, p ≤ 0.01) and the tested lines (F = 7.32, p ≤ 0.01). A significant increase in APX and CAT activity was observed in the treated wild-type seedlings compared to the corresponding control (Figure 3b,c). In contrast, no significant differences were observed between the heat-treated and control seedlings of the oeBPM1 and amiR-bpm lines, although CAT activity increased 1.3-fold in the treated amiR-bpm seedlings. When comparing enzyme activity between lines, CAT activity was significantly lower in the amiR-bpm control seedlings than in the oeBPM1 control seedlings. In addition, heat-treated amiR-bpm seedlings had significantly lower CAT activity than treated wild-type seedlings. SOD activity was significantly influenced by the tested lines (F = 22.81, p ≤ 0.0001). Accordingly, no significant differences were found between the heat-treated and control seedlings, regardless of the line tested (Figure 3d). Although not statistically significant, SOD activity increased 1.3-fold in heat-treated wild-type seedlings compared to the control. When comparing the control seedlings of the three lines, oeBPM1 and amiR-bpm seedlings showed significantly lower SOD activity than the wild-type seedlings. In the heat-treated seedlings, SOD activity was significantly lower in amiR-bpm seedlings compared to the wild type.
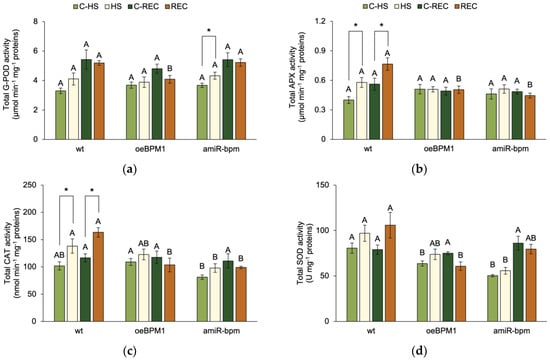
Figure 3.
The total activity of (a) guaiacol peroxidase (G-POD), (b) ascorbate peroxidase (APX), (c) catalase (CAT) and (d) superoxide dismutase (SOD) in Arabidopsis thaliana seedlings with BPM1 overexpression (oeBPM1), seedlings with BPM1, 4, 5, and 6 downregulation (amiR-bpm), and wild-type (wt) seedlings. Samples were collected at two time points: immediately after exposure to 37 °C for 6 h (HS) and after a 24 h recovery at 24 °C (REC). The control groups (C-HS and C-REC) were kept at 24 °C throughout the experiment. Data are expressed as mean ± standard error (n = 5 biological replicates). Differences between two groups—control and heat-treated seedlings sampled at the same time point (immediately after the treatment or after 24 h recovery, i.e., C-HS vs. HS, or C-REC vs. REC)—were determined using Student’s t-test, with significant differences (p ≤ 0.05) indicated by asterisk (*). For comparisons of the tested lines (wild type vs. oeBPM1 vs. amiR-bpm) exposed to the same treatment condition (C-HS, HS, C-REC, or REC), a one-way ANOVA followed by Tukey’s HSD post hoc test was performed, with significant differences (p ≤ 0.05) indicated by different uppercase letters.
After the 24 h recovery period, only the tested lines had a significant effect on G-POD (F = 3.53, p ≤ 0.05) and SOD activity (F = 5.41, p ≤ 0.05). Consequently, no significant differences in enzyme activities were observed between the control seedlings and the heat-treated seedlings, regardless of the line tested (Figure 3a,d). However, heat-treated wild-type seedlings showed a 1.4-fold higher SOD activity compared to the control. When comparing enzyme activity between lines, G-POD and SOD activity was significantly lower in heat-treated oeBPM1 seedlings compared to wild-type seedlings, and G-POD activity was also lower in oeBPM1 seedlings than in amiR-bpm seedlings. The activity of APX and CAT was significantly influenced by the tested lines (APX: F = 10.78, p ≤ 0.001; CAT: F = 5.52, p ≤ 0.05) and the interaction between treatment and tested lines (APX: F = 3.91, p ≤ 0.05; CAT: F = 4.72, p ≤ 0.05). Both APX and CAT activity were significantly higher in the heat-treated wild-type seedlings compared to the respective control (Figure 3b,c). However, no significant differences were observed between the heat-treated and control seedlings of the oeBPM1 and amiR-bpm lines. When comparing the seedlings between lines, the treated oeBPM1 and amiR-bpm seedlings showed significantly lower APX and CAT activity than the treated wild-type seedlings.
2.6. Heat-Responsive Proteins and Genes in Seedlings with Altered BPMs Expression
To investigate the activation of heat stress response mechanisms in wild-type, oeBPM1, and amiR-bpm seedlings, we measured the expression of HSP70 and HSP90 proteins as well as DREB2A, HSFA3, and BPM genes.
Immediately after heat stress, HSP70 protein expression increased 1.7-fold in heat-treated oeBPM1 seedlings and 1.6-fold in wild-type seedlings, compared to the respective controls (Figure 4a). Conversely, heat-treated amiR-bpm seedlings showed no notable increase in HSP70 expression immediately after heat treatment. Interestingly, the comparison between the control seedlings of the three lines revealed that amiR-bpm seedlings had a 1.5-fold higher HSP70 expression than the wild-type control seedlings at the first time point. In contrast to HSP70, the expression of HSP90 was strongly induced in all heat-treated seedlings. Expression increased 2.6-fold in both oeBPM1 and wild-type seedlings, while a 3.5-fold increase was observed in amiR-bpm seedlings (Figure 4b).

Figure 4.
Immunodetection of (a) HSP70 and (b) HSP90 proteins in Arabidopsis thaliana seedlings with BPM1 overexpression (oeBPM1), seedlings with BPM1, 4, 5, and 6 downregulation (amiR-bpm), and wild-type (wt) seedlings. Samples were collected at two time points: immediately after exposure to 37 °C for 6 h (HS) and after a 24 h recovery at 24 °C (REC). The control groups (C-HS and C-REC) were kept at 24 °C throughout the experiment. Ponceau staining of the respective lane for each sample was used as a qualitative loading and transfer control (only a portion of the stained membrane was shown). The graphical representation shows the relative band intensity of HSP70 and HSP90 normalised to the wt C-HS and wt C-REC (set as 1). Immunodetection was performed on three biological replicates, with one representative biological replicate selected for presentation.
After a 24 h recovery period at 24 °C, HSP70 expression was increased 1.6-fold in heat-treated amiR-bpm seedlings compared to the corresponding control (Figure 4a). In contrast, HSP70 levels returned to control levels in both oeBPM1 and wild-type seedlings during the recovery period. HSP90 expression continued to increase during the recovery period, reaching a 5.8-fold higher level in oeBPM1 and 6.8-fold higher level in amiR-bpm seedlings, while it remained at a 2.7-fold higher level in wild-type seedlings compared to the corresponding controls (Figure 4b). Comparison of the lines after recovery showed that the oeBPM1 control seedlings had a 3.2-fold lower HSP90 expression than the wild-type control seedlings.
The expression of DREB2A and HSFA3 was significantly influenced by heat exposure (DREB2A: F = 17.38, p ≤ 0.001; HSFA3: F = 39.22, p ≤ 0.001), tested lines (DREB2A: F = 8.72, p ≤ 0.001; HSFA3: F = 20.26, p ≤ 0.001), and their interactions (DREB2A: F = 13.47, p ≤ 0.001; HSFA3: F = 45.13, p ≤ 0.001). Accordingly, the expression of both DREB2A and HSFA3 was significantly upregulated in all heat-treated seedlings immediately after heat stress compared to the respective controls (Figure 5a,b). Comparison of the three lines showed that the induction of DREB2A was more pronounced in amiR-bpm and wild-type seedlings immediately after heat exposure than in oeBPM1. Although DREB2A expression decreased after recovery in all three lines, it remained higher than in control seedlings, with amiR-bpm seedlings showing the highest expression. The expression of HSFA3 followed a similar pattern and showed significant upregulation in response to heat stress in all three lines compared to the corresponding control. The highest induction immediately after exposure was observed in amiR-bpm seedlings. Although HSFA3 expression remained significantly increased after recovery, no differences were observed between the lines tested.

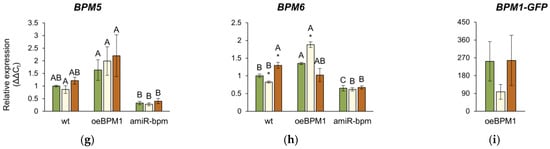
Figure 5.
Relative expression of (a) DREB2A, (b) HSFA3, (c) BPM1, (d) BPM2, (e) BPM3, (f) BPM4, (g) BPM5, (h) BPM6, and (i) BPM1-GFP in Arabidopsis thaliana seedlings. All gene expressions, except the BPM1-GFP transgene, were analysed in seedlings with BPM1 overexpression (oeBPM1), seedlings with BPM1, 4, 5, and 6 downregulation (amiR-bpm) and wild-type (wt) seedlings. Transgene expression (BPM1-GFP) was only measured in the oeBPM1 line. Seedlings were collected before exposure to 37 °C (C), immediately after exposure to 37 °C (HS), and after 24 h recovery at 24 °C (REC). Results are presented as relative mean of three biological replicates ± standard error, normalized to wt C (set as 1). Asterisks show significant differences (Student’s t-test) between C and HS or C and REC for each line at p ≤ 0.05 (*), p ≤ 0.01 (**) and p ≤ 0.001 (***). For comparisons of tested lines (wild type vs. oeBPM1 vs. amiR-bpm) exposed to the C, HS, or REC, a one-way ANOVA followed by Tukey’s HSD post hoc test was performed, with significant differences (p ≤ 0.05) indicated by different uppercase letters.
The relative expression of the endogenous BPM1-6 genes was analysed in all three lines. Additionally, in the oeBPM1 line, which contains BPM1-GFP transgene, the expression of the transgene was also evaluated. Considering both time points, two-way ANOVA revealed that heat treatment significantly affected the expression of five BPM genes—BPM1 (F = 28.92, p ≤ 0.001), BPM2 (F = 15.84, p ≤ 0.001), BPM3 (F = 9.56, p ≤ 0.01), BPM4 (F = 2.73, p ≤ 0.05), and BPM6 (F = 23.44, p ≤ 0.001). Significant changes in the expression of BPM2, BPM4, and BPM6 were observed immediately after heat stress. Specifically, the expression of BPM2 increased significantly in heat-treated amiR-bpm and wild-type seedlings, while no significant changes were observed in oeBPM1 seedlings compared to the respective control (Figure 5d). Conversely, BPM4 expression decreased significantly in heat-treated oeBPM1 seedlings, while BPM6 expression increased in the same seedlings compared to the control seedlings (Figure 5f,h). In contrast, BPM6 expression decreased significantly in heat-treated wild-type seedlings compared to the corresponding control. After the 24 h recovery period, significant changes in BPMs gene expression were observed only in heat-treated wild-type seedlings, where a significant upregulation of BPM1, BPM3, BPM4, and BPM6 was observed compared to control values (Figure 5c,e,f,h). The expression of BPM5 remained unchanged in all analysed lines compared to the respective controls (Figure 5g). Although the expression of the BPM1-GFP transgene decreased 2.58-fold immediately after heat stress, the change was not statistically significant compared to the control values (Figure 5i). When comparing BPMs expression between control seedlings of the three lines confirmed that amiR-bpm seedlings had reduced expression of BPM1, BPM4, BPM5, and BPM6 compared to oeBPM1 and wild-type seedlings. Interestingly, the wild-type control seedlings showed lower expression of BPM3 and BPM6 than the oeBPM1 seedlings.
3. Discussion
A. thaliana seedlings overexpressing the BPM1 gene (oeBPM1) and seedlings with reduced expression of the BPM1, 4, 5, and 6 genes (amiR-bpm) were used as plant models to investigate the role of BPM proteins in plant response to moderate heat stress (37 °C for 6 h). Different stress strategies were revealed that can be attributed to the balance of stress perception, signal transduction, and proteostasis regulation.
3.1. BPM1 Overexpression Increases the Sensitivity of Photosynthesis to Heat Stress
In recent years, numerous studies have confirmed that photosynthesis is one of the physiological processes most sensitive to heat. The decline in photosynthetic efficiency often occurs at temperatures lower than those affecting other physiological processes [17,33,34]. In our study, the measurement of Chl a fluorescence using the JIP-test generally showed the influence of heat on the photosynthetic performance and functionality of PSII. The parameter FV/FM, which indicates the maximum quantum efficiency of PSII photochemistry, is widely recognized as a reliable marker of heat-induced inhibition of PSII activity [35,36,37,38]. Under non-stress conditions, FV/FM values are typically between 0.7 and 0.83 [39]. Consistently, all control seedlings, including the transgenic lines and the wild type, showed values in this range, indicating optimal activity of PSII. However, the heat-treated oeBPM1 and amiR-bpm seedlings showed a significant decrease in FV/FM immediately after heat exposure, while the wild-type seedlings showed a similar trend, although the difference was not significant. Another parameter derived from the JIP-test, PIABS, serves as a comprehensive indicator of the vitality of the photosynthetic apparatus and quantifies the efficiency with which the absorbed light energy is utilised in photochemical reactions [35,40]. In the present study, PIABS was significantly reduced in both oeBPM1 and wild-type seedlings after heat stress. Furthermore, the simultaneous and significant decrease in PIABS and FV/FM in the oeBPM1 line indicates an increased sensitivity of the photosynthetic machinery to moderate heat stress. In contrast, only FV/FM was reduced in the amiR-bpm line and only PIABS in the wild type suggesting that the extent of photosynthetic impairment was more pronounced in the oeBPM1 seedlings. This observation is consistent with the results in wild barley (Hordeum spontaneum), where heat-sensitive cultivars showed significantly lower FV/FM and PIABS values under stress than more heat-tolerant genotypes [41].
To further investigate the effects of heat stress on photosynthetic efficiency, four parameters of energy fluxes contributing to PIABS were evaluated: absorption (ABS/RC), energy trapping (TR0/RC), electron transport (ET0/RC), and energy dissipation (DI0/RC). Increased ABS/RC and DI0/RC values were observed in oeBPM1 seedlings immediately after heat treatment, indicating higher energy absorption and dissipation. Such trends have been documented in plants exposed to elevated temperatures [42,43]. According to Strasser et al. [35], the increase in ABS/RC and DI0/RC in heat-treated plants is generally attributed to the partial inactivation of RCs, which leads to a greater energy load per remaining active RCs and increased energy dissipation as a protective mechanism. In addition, the increased ABS/RC and DI0/RC levels observed in heat-treated oeBPM1 seedlings could also be a consequence of reduced pigment content. A decrease in photosynthetic pigments limits the light-harvesting capacity of the plant, which reduces photosynthetic efficiency and increases the dissipation of energy absorbed per functional RC [44,45]. Indeed, a significant reduction in pigment content was observed in oeBPM1 seedlings immediately after heat exposure, supporting the observed increases in ABS/RC and DI0/RC. Interestingly, the amiR-bpm line, characterised by downregulation of BPM1, 4, 5, and 6 [6], showed a more stable photosynthetic response, suggesting that depletion of BPMs expression may have protective effects. These results are consistent with those of Morimoto et al. [12], who reported improved survival and chlorophyll retention in A. thaliana plants with silenced BPM1-6 genes under severe heat stress. It has been suggested that BPM proteins, particularly BPM2, influence the response to heat stress by negatively regulating the transcription factor DREB2A—a key regulator of thermotolerance [12]. In our study, 98-fold overexpression of BPM1 in the oeBPM1 line was associated with significantly decreased expression of DREB2A and its downstream target HSFA3 immediately after heat exposure, compared to amiR-bpm and wild-type seedlings. Since HSFA3 regulates the expression of several heat shock proteins and stress-related genes [29,30,31], its decreased expression could impair the activation of protective mechanisms during heat stress. In other words, the reduced expression of DREB2A and HSFA3 in oeBPM1 seedlings may have impaired the induction of chaperones and antioxidant defence mechanisms, ultimately rendering the photosynthetic apparatus more susceptible to damage and contributing to the observed decrease in FV/FM, PIABS, and pigment content. However, after a 24 h recovery period, photosynthetic parameters returned to control values in all lines, supporting the idea that exposure to 37 °C represents a moderate and reversible stress for A. thaliana.
3.2. Overexpression of BPM1 Reduces Activation of Antioxidant Defence
Heat stress often leads to secondary stress in plant cells, known as oxidative stress, which results from the overproduction of ROS and the subsequent disruption of cellular redox homeostasis [46,47]. Therefore, to determine whether moderately elevated temperature induces oxidative stress and to evaluate the antioxidant capacity in A. thaliana seedlings with altered BPMs expression, the levels of H2O2, MDA, and proline as well as the activity of key antioxidant enzymes including G-POD, APX, CAT, and SOD were measured.
Among the ROS produced, H2O2 is one of the most studied molecules due to its relative stability and its dual role in plant cells, both as a signalling molecule and as a potential source of oxidative damage [21,29,48]. In this study, a significant reduction in H2O2 content was observed in heat-treated amiR-bpm and wild-type seedlings, while no significant change was observed in oeBPM1 seedlings, suggesting a BPM1-related response to oxidative stress. Previous studies have shown that H2O2 accumulation is typically more pronounced under severe heat stress (above 40 °C), while moderate stress (around 35–37 °C) does not significantly increase ROS levels [49]. Moreover, activation of the antioxidant defence system is considered to be a crucial mechanism by which plants mitigate ROS-induced cell damage [50,51]. Increased activity of enzymes involved in H2O2 scavenging—namely G-POD, APX, and CAT—was detected in both amiR-bpm and wild-type seedlings immediately after heat treatment. These results indicate that the applied moderate heat stress (37 °C for 6 h) was sufficient to induce antioxidant defence in these lines and thus prevent excessive ROS accumulation. This interpretation is further supported by the MDA content, a commonly used indicator of lipid peroxidation and membrane damage during oxidative stress [52]. No significant increase in MDA content was observed in any of the BPM-modified lines or in the wild type, suggesting that cell membranes remained largely protected during heat stress. Of particular note was the response of the oeBPM1 line, in which neither the H2O2 and MDA content nor the activity of antioxidant enzymes changed significantly after heat treatment, indicating that no oxidative stress was induced under the conditions tested. It is possible that the decreased expression of DREB2A and HSFA3 in the oeBPM1 seedlings impaired the activation of these downstream antioxidant defence mechanisms, but the basal antioxidant capacity appeared to be sufficient to prevent oxidative damage under the mild stress conditions used. Alternatively, the absence of oxidative stress symptoms in oeBPM1 could represent an adaptive response in which photosynthetic activity is downregulated to limit ROS production. As previously discussed, photosynthesis in this line was significantly reduced after heat stress, possibly minimising the generation of ROS and thus reducing the need for an enhanced antioxidant response. After recovery, photosynthetic activity returned to normal levels, further supporting the notion of a transient and regulated response to moderate heat stress. As for SOD activity, no significant changes in activity were observed in any of the lines, either immediately after heat exposure or after recovery. As SOD catalyses the conversion of O2•− to H2O2, its stable activity is consistent with the observed H2O2 dynamics, which were either unchanged or reduced in all lines. Similar results were reported for garlic (Allium sativum) exposed to 35 °C, where no significant increase in SOD activity was observed until the plants were exposed to a higher temperature [53]. These results also confirm that the 37 °C applied in this study represents moderate heat stress.
In addition to the enzymatic defence mechanisms, proline accumulation was monitored as a non-enzymatic marker of oxidative stress. Proline has multiple functions under different stress conditions, including osmoregulation, free radical scavenging, protein stabilisation, and maintenance of cellular redox balance [54,55,56]. Contrary to expectations, a significant decrease in proline content was observed in heat-treated oeBPM1 and wild-type seedlings, indicating that the applied heat treatment did not promote proline synthesis. Similar results were observed in cotton (Gossypium hirsutum) and wheat (Triticum aestivum) under comparable thermal conditions [49,57]. The reduction in proline levels after heat stress could be due to an energy shift in the plant cells. As the efficiency of photosynthesis decreases under heat stress, the energy balance within the cell changes. Proline metabolism is closely linked to cellular energy regulation, in particular the NAD+/NADH and NADP+/NADPH couples, which are crucial for energy transfer during stress responses [58]. Essentially, the NADH and NADPH produced during proline degradation could be used for various metabolic processes, including energy production and redox balance maintenance, especially under heat stress conditions.
Interestingly, the amiR-bpm line showed increased levels of H2O2, MDA, and proline under control conditions. These differences in baseline levels of these parameters compared to oeBPM1 and wild type suggest that downregulation of BPM1, 4, 5, and 6 may disrupt proteostasis and redox homeostasis, leading to mild physiological stress even under optimal growth conditions. The increased MDA content was likely a consequence of the increased H2O2 level, as lipid peroxidation is a known result of ROS accumulation [51,52]. One possible explanation for the increased H2O2 content is an altered regulation of glycolate oxidase (GOX), the key enzyme responsible for H2O2 production in photosynthetic tissues [59]. Bauer et al. [60] identified GOX2 as a potential interaction partner of BPM1 by tandem affinity purification and mass spectrometry experiments. Of the three known GOX isoforms (GOX1-3) in A. thaliana, GOX2 is the most efficient H2O2 producer [61]. Since BPM proteins act as substrate adaptors in the ubiquitin–proteasome system and promote the degradation of specific proteins, it is plausible that reduced BPM expression in the amiR-bpm line impairs GOX2 turnover and thereby increases H2O2 production. However, this hypothesis needs to be further validated. In parallel, the increased proline content in amiR-bpm supports the findings of Vitko et al. [62], who proposed that the BPM1–DREB2A interaction regulates proline metabolism. DREB2A is known to suppress proline catabolism by downregulating enzymes such as proline dehydrogenase and prolyl 4-hydroxylase, as shown in transgenic Robinia pseudoacacia plants overexpressing DREB2A [63]. Therefore, the greatly increased DREB2A expression in amiR-bpm likely inhibited proline degradation, leading to its accumulation. Despite the increased levels H2O2 and MDA, no increase in antioxidant enzyme activity was observed in the amiR-bpm line under control conditions. This suggests that proline may have contributed significantly to ROS detoxification. Indeed, proline has been shown to act as an ROS scavenger and plays a key role in maintaining cellular redox balance [54,55,56].
3.3. Reduced BPMs Expression Prolongs Elevated HSP Levels During Recovery from Heat Stress
Since heat stress is known to induce the expression of HSPs, the focus in this part of the study was on analysing HSP90 and HSP70 protein levels. As expected, all heat-treated seedlings showed a significant increase in HSP90 expression compared to the respective controls. This observation is consistent with previous studies that described a pronounced induction of molecular chaperones, particularly HSP90, in response to elevated temperatures [64,65,66]. Interestingly, HSP90 expression remained elevated even after a 24 h recovery period. This result is in agreement with the study by Charng et al. [67], which showed that HSP90 levels in A. thaliana seedlings peaked approximately 3 h after exposure to 37 °C, then gradually decreased and returned to control levels after a recovery period of 72 h. These results suggest that, despite the moderate and transient nature of the stress applied in our study, the effects on the cellular proteome may persist beyond the initial stress event. Elevated HSP90 levels during the recovery phase may play a crucial role in cellular repair by supporting the refolding or stabilisation of denatured proteins that are damaged during the heat episode [68]. Although HSP70 proteins are constitutively expressed in most cells and are highly upregulated in response to stress conditions, including heat, some members of the HSP70 family exhibit a rapid and transient induction pattern. These are referred to as “hit-and-run” chaperones due to their rapid activation and short-lived expression during stress responses [69,70]. This behaviour was also observed in the present study, in which HSP70 levels increased immediately after heat stress, but returned to baseline levels after 24 h in heat-treated oeBPM1 and wild-type seedlings. Remarkably, HSP70 and HSP90 levels remained comparatively higher in heat-treated amiR-bpm seedlings than in oeBPM1 and wild-type seedlings after recovery. The prolonged induction of HSPs may be attributed to differences in upstream regulatory pathways, possibly reflecting the increased expression of HSFA3 observed in amiR-bpm seedlings. Since HSFA3 is a key transcriptional regulator for heat-responsive genes and is activated by DREB2A, its increased expression in amiR-bpm likely contributed to the prolonged induction of HSPs expression following heat stress. Indeed, transgenic tobacco plants (Nicotiana tabacum) overexpressing DREB2A show higher expression of downstream genes such as HSP70-3 and Hsp18p when exposed to salt and osmotic stress compared to wild-type plants [71].
In this study, expression of BPM2 increased in amiR-bpm and wild-type seedlings immediately after heat stress, which is consistent with the findings of Morimoto et al. [12], who identified BPM2 as the major inducible BPM gene in response to elevated temperatures. No such induction was observed in oeBPM1, where BPM1 was constitutively overexpressed. Considering that BPM1 and BPM2 proteins are closely related [72], it is plausible that high levels of BPM1 in oeBPM1 seedlings functionally suppressed BPM2 induction. Morimoto et al. [12] also showed that all BPMs can interact with DREB2A, although BPM2 appears to play the predominant role. This suggests that increased BPM1 levels in the oeBPM1 line could compensate for BPM2 and enhance DREB2A degradation, thereby reducing HSFA3 and HSPs expression. In addition, Škiljaica et al. [11] have shown that the BPM1 protein accumulates at 37 °C. This observation supports the idea that BPM1 protein remained elevated in the oeBPM1 line under heat stress and attenuated the DREB2A to HSFA3 cascade. Since BPM proteins mediate the degradation of DREB2A, the higher BPM1 levels in oeBPM1—accompanied by lower levels in amiR-bpm [6]—could explain the decreased DREB2A and HSFA3 expression in oeBPM1 and their enhancement in amiR-bpm. Notably, only wild-type seedlings showed upregulation of several native BPM genes during the recovery phase, possibly to buffer excessive DREB2A activity and maintain the balance between growth and response to stress [12]. The absence of such a compensatory response in both transgenic lines suggests that their regulatory capacity is unbalanced—overexpression of BPM1 in oeBPM1 might override the plasticity of the native BPM network, while in amiR-bpm reduced BPMs expression restricts overall regulation following stress and possibly prolongs DREB2A signalling.
4. Materials and Methods
4.1. Plant Material, Growth Conditions, and Treatment
This study was carried out on the model plant Arabidopsis thaliana (L.) Heynh., ecotype Columbia-0 (Col-0). The experimental setup included the wild type and two transgenic lines with altered BPMs gene expression: (1) the oeBPM1 line, which overexpresses the BPM1 gene and was generated by introducing the BPM1-GFP transgene under the control of the CaMV 35S promoter, allowing constitutive expression [11]; (2) the amiR-bpm line, in which the expression of BPM1, BPM4, BPM5, and BPM6 was reduced by artificial microRNA technology [6].
For each line, approximately 3.5 mg of seeds were weighed into individual microtubes, with a total of 20 microtubes prepared per line. One microtube represented one biological replicate. Seeds were surface sterilised according to the protocol described by Vuković et al. [43] and transferred to sterile Petri dishes (6 cm diameter) containing 1 mL of liquid Murashige and Skoog (MS) medium [73] supplemented with vitamins and minerals (M5519, Sigma-Aldrich, Saint Louis, MO, USA), 1% (w/v) sucrose and 2.5 mM 2-(N-morpholino)ethanesulfonic acid (MES), adjusted to pH 5.7. The seeds were then stratified at 4 °C for three days before being transferred to a growth chamber to germinate and grow at 24 ± 1 °C, with a light intensity of 120–130 μmol m−2 s−1 and long-day conditions (16 h light/8 h dark). In the following 12 days, 1 mL of fresh MS medium, as described above, was added twice to each Petri dish under sterile conditions. On day 12, when the seedlings had two rosette leaves and reached developmental stage 1.02 [74], each of the three plant lines was divided into two experimental groups: (1) the control group, which was kept in the growth chamber at 24 °C; (2) the heat-treated group, which was placed in a preheated incubator (Hood TH 30, Edmund Bühler, Germany) at 37 °C. After 6 h of incubation, samples of the heat-treated seedlings (HS) were taken from half of the Petri dishes for physiological and biochemical analyses. Sampling immediately after 6 h of heat treatment represented the first time point. The remaining Petri dishes were returned to the growth chamber for a 24 h recovery period at 24 °C. The seedlings were collected after 24 h and labelled as the REC group, which represented the second time point. The control groups—C-HS and C-REC—were sampled at the same time points as HS and REC, respectively. For the molecular analysis, i.e., the analysis of gene expression, the seedlings were sampled at three time points—before treatment (C), immediately after treatment (HS), and after a recovery period of 24 h (REC). Prior to analysis, all seedlings were rinsed with distilled water to remove the MS medium.
4.2. Determination of Photosynthetic Efficiency
Photosynthetic efficiency and energy fluxes in PSII were evaluated using the JIP-test, which measures polyphasic Chl a fluorescence in dark-adapted plants [35]. Fluorescence induction and measurement was performed using a FluorPen FP 100 fluorometer (Photon Systems Instruments, Drásov, Czech Republic). For each measurement, approximately 50 seedlings per line and experimental group were pooled, representing one biological replicate. The seedlings were kept in the dark at 24 °C for 30 min on a tray covered with several layers of moist filter paper to prevent the seedlings from drying out. The polyphasic fluorescence increase was triggered by a blue light pulse (peak emission at 455 nm, photon flux density of 3000 μmol m−2 s−1). The FluorPen FP 100 recorded Chl a fluorescence intensity at 50 μs (F0), 2 ms (FJ), 30 ms (FI) and after reaching the maximum fluorescence (FM). Fluorescence parameters describing the functional properties of PSII were read and analysed with the FluorPen 1.1 software: maximum quantum yield of PSII photochemistry (FV/FM), performance index on absorption basis (PIABS), absorption flux per active reaction centre (ABS/RC), trapped energy flux per reaction centre (TR0/RC), electron transport flux per reaction centre (ET0/RC), and dissipated energy flux per reaction centre (DI0/RC). All results were expressed in arbitrary units (a.u.).
4.3. Measurement of Photosynthetic Pigment Content
Contents of Chl a, Chl b, and total Cars were determined according to the method of Wellburn [75]. For pigment extraction, approximately 50 mg of fresh plant tissue was homogenised in an ice-cold mortar and pestle with the addition of 1 mL of chilled 80% (v/v) acetone and approximately 20 mg of calcium carbonate. The homogenised mixture was centrifuged (5000× g, 10 min, 4 °C) and the supernatant collected, while the pellet was resuspended in 500 μL of chilled acetone, mixed, and centrifuged again under the same conditions. The supernatants were combined, and the final volume of each sample was adjusted to 1.5 mL with chilled acetone. Absorbance was measured at 470, 646, and 663 nm, and 80% (v/v) acetone was used as a blank. Pigment concentrations were calculated according to Wellburn [75], and the results were expressed as a portion of pigments in fresh tissue weight (μg g−1 FW).
4.4. Measurement of Hydrogen Peroxide, Malondialdehyde, and Proline Content
The hydrogen peroxide (H2O2) content was measured using the ferrous oxidation-xylenol orange (FOX) assay according to the method described by Mátai and Hideg [76]. The method is based on the oxidation of iron(II) ions (Fe2+) to iron(III) ions (Fe3+) by H2O2 under acidic conditions, whereby Fe3+ forms a coloured complex with xylenol orange, which is quantified spectrophotometrically. To prepare the plant extract, approximately 50 mg of fresh tissue was homogenised in an ice-cold mortar and pestle with 500 μL of chilled 70% (v/v) ethanol. The homogenised tissue was centrifuged (15,000× g, 10 min, 4 °C) and the supernatant was used for the determination of H2O2. The FOX reagent contained 124 μM xylenol orange, 99 mM sorbitol, and 0.248 mM ammonium iron(II) sulphate hexahydrate prepared in 2.5 M sulphuric acid. For each measurement, 1 mL of the FOX reagent was combined with 50 μL of the plant extract, briefly mixed, and incubated for 15 min at room temperature. The absorbance was measured at 560 nm against a blank sample prepared with 50 μL 70% (v/v) ethanol. The H2O2 concentration was calculated using a standard curve constructed from known H2O2 concentrations (1.82–72.8 μmol L−1) and expressed as nmol g−1 FW.
Lipid peroxidation was determined by measuring the level of malondialdehyde (MDA), a marker of membrane lipid damage, using the thiobarbituric acid (TBA) assay [77]. Approximately 200 mg of fresh tissue was homogenised in 2 mL of ice-cold 0.1% (w/v) trichloroacetic acid (TCA) with 20 mg polyvinylpolypyrrolidone (PVPP). The homogenate was centrifuged (15,000× g, 10 min, 4 °C) and the supernatant was collected. An aliquot of this extract was also used for the quantification of proline. For MDA quantification, 750 μL of 0.5% (w/v) TBA in 20% (w/v) TCA was added to 250 μL of each sample, followed by incubation at 100 °C for 30 min. After rapid cooling on ice, the samples were centrifuged (15,000× g, 5 min, 4 °C) and the supernatant was used to measure absorbance at 440, 532, and 600 nm. To correct for flavonoid interferences, absorbance at 532 and 600 nm was also measured in samples prepared with 750 μL of 20% (w/v) TCA without TBA and which underwent the same processing steps as the TBA-treated samples. Blanks were prepared with 250 μL 0.1% (w/v) TCA. The MDA content was calculated according to Hodges et al. [77] and expressed as nmol g−1 FW.
The proline content was determined using the ninhydrin reaction method described by Bates et al. [78] with slight modifications. As previously mentioned, the extract prepared for the determination of MDA was used. In brief, 400 μL of the extract was mixed with an equal volume (400 μL) of glacial acetic acid and 400 μL of acidic ninhydrin solution (0.14 M ninhydrin dissolved in a mixture of glacial acetic acid and 6 M phosphoric acid in a volume ratio of 1.5:1). The reaction mixture was thoroughly mixed and incubated for 1 h at 100 °C. After incubation, the mixture was cooled for 5 min. The reaction product was then extracted with 1 mL of toluene and the absorbance was measured at 520 nm with toluene as blank. The proline concentration was quantified using a standard curve constructed from known proline concentrations (1–500 μM) and expressed as µmol g−1 FW.
4.5. Protein Extraction and Antioxidant Enzyme Activity Assays
Total soluble proteins were extracted by homogenising approximately 150 mg of fresh seedlings with 15 mg of PVPP in an extraction buffer containing 100 mM potassium phosphate buffer (pH 7.0) and 0.1 mM ethylenediaminetetraacetic acid (EDTA). The homogenate was then centrifuged (20,000× g, 30 min, 4 °C) and the resulting supernatant was used for enzyme activity assays. Since total soluble protein extracts were used, the measured activities represent the combined (total) activity of all isoforms present in the seedlings without distinguishing between subcellular localisations. The protein concentration was determined using the Bradford assay [79] and calculated from a standard curve generated with bovine serum albumin (BSA) in a concentration range of 0.1–0.8 mg mL−1.
The activity of guaiacol peroxidase (G-POD, EC 1.11.1.7) was determined according to Maehly and Chance [80]. The reaction mixture (980 μL) consisted of 50 mM potassium phosphate buffer (pH 7.0), 18 mM guaiacol, and 4.5 mM H2O2. After addition of 20 μL of protein extract, the mixture was briefly mixed, and the absorbance was monitored at 470 nm every 15 s for 3 min. The enzyme activity was calculated using the extinction coefficient (26.6 mM cm−1) and expressed as μmol min−1 mg−1 proteins.
The activity of ascorbate peroxidase (APX, EC 1.11.1.11) was measured according to Nakano and Asada [81]. The reaction mixture consisted of 50 mM potassium phosphate buffer (pH 7.0) containing 0.1 mM EDTA, 20 mM ascorbate, and 12 mM H2O2, with a final volume of 1 mL, 180 μL of which was protein extract. After brief mixing, the absorbance was recorded at 290 nm every second for 15 s. Activity was determined using the extinction coefficient (2.8 mM cm−1) and expressed as μmol min−1 mg−1 proteins.
The catalase activity (CAT, EC 1.11.1.6) was determined as described by Aebi [82]. The reaction was started by adding 50 μL of protein extract to a mixture (950 μL) containing 50 mM potassium phosphate buffer (pH 7.0) and 10 mM H2O2. Enzyme activity was recorded as a decrease in absorbance at 240 nm every 10 s for 2 min, calculated using the extinction coefficient (40 mM cm−1) and expressed as nmol min−1 mg−1 proteins.
The activity of superoxide dismutase (SOD, EC 1.15.1.1) was determined according to the method of Beauchamp and Fridovich [83]. The reaction mixture consisted of 825 μL of SOD buffer (50 mM potassium phosphate buffer, pH 7.8, containing 0.1 mM EDTA, and 75 μM nitro blue tetrazolium chloride), 75 μL of 10.8 mM xanthine, 50 μL of 0.05 U mL−1 xanthine oxidase, 45 μL of protein extraction buffer, and 5 μL of protein extract. Absorbance was monitored at 560 nm every 30 s for 3 min. SOD activity was determined using a calibration curve (0.005–1 U μL−1) and expressed as U mg−1 proteins.
4.6. Immunodetection of Heat Shock Protein 70 and Heat Shock Protein 90
Soluble proteins were extracted from 50 mg of fresh seedlings with a Tris-HCl buffer (pH 8.0) containing 0.1 M Tris, 0.5 M sucrose, 6.5 mM dithiothreitol, and 8.25 mM cysteine–HCl. The samples were homogenised with 5 mg of PVPP and centrifuged (20,000× g, 30 min, 4 °C). The protein concentration was measured using the Bradford assay [79]. To denature the proteins, Laemmli sample buffer containing 87.5 mM Tris-HCl (pH 6.8), 2% (w/v) sodium dodecyl sulphate (SDS), 45% (v/v) glycerol, 12.5% (v/v) 2-mercaptoethanol, and 0.0125% (w/v) bromophenol blue was added [84], and the samples were heated at 95 °C for 5 min. For each sample, a volume containing 4 μg of proteins was calculated and loaded onto a gel. The denatured samples were separated by sodium dodecyl sulphate–polyacrylamide gel electrophoresis (SDS-PAGE) in a mini-vertical gel system (Mini-PROTEAN 3 Cell, BioRad, Hercules, CA, USA). Two acrylamide/bis-acrylamide gels with different pH values were used: a 4% stacking gel (pH 6.8) and a 12% resolving gel (pH 8.8). The running buffer (pH 8.3) contained 25 mM Tris, 192 mM glycine, and 0,1% (w/v) SDS. The separated proteins were transferred to a 0.45 µm nitrocellulose membrane at 60 V for 1 h using a wet transfer system (Mini Trans-Blot cell, BioRad). The transfer buffer (pH 8.3) consisted of 28 mM Tris, 192 mM glycine, and 10% (v/v) methanol. The efficiency of the transfer and equal loading of the samples were confirmed by staining the membrane with 0.05% (w/v) Ponceau S prepared in 5% (v/v) acetic acid, as described by Romero-Calvo et al. [85]. The dye was washed off by rinsing the membranes several times in dH2O. After blocking in 5% (w/v) non-fat milk in 1× Tris-buffered saline with 1% (v/v) Tween® 20 (TBS-T) for 1 h at room temperature, the membranes were incubated overnight at 4 °C with primary antibodies against HSP70 (AS08371, Agrisera, Vännäs, Sweden) and HSP90 (AS08346, Agrisera), each diluted 1:3000 in blocking solution. After washing twice for 5 min in 1× TBS-T, the membranes were incubated with horseradish peroxidase (HRP)-conjugated secondary antibodies (goat anti-rabbit IgG, Merck Millipore, Burlington, MA, USA), diluted 1:10,000 in blocking solution, for 1 h at room temperature. Protein detection was performed using a chemiluminescent substrate (Immobilon Forte Western HRP, Merck Millipore) and blots were visualised using the C-DiGit Blot Scanner (LI-COR Biosciences, Lincoln, NE, USA). Band intensities were quantified using Image Studio™ Lite 5.2 software (LI-COR Biosciences).
4.7. Quantification of DREB2A, HSFA3 and BPMs Expression
Total RNA was extracted from approximately 20 mg of whole A. thaliana seedlings using the MagMAX™ Plant RNA Isolation Kit (Thermo Fisher Scientific, Waltham, MA, USA). The concentration and purity of RNA was determined using a NanoDrop™ 1000 spectrophotometer. A total of 1 µg of the isolated RNA was used for cDNA synthesis in a 20 µL reaction mixture containing 200 U RevertAid H Minus Reverse Transcriptase (Thermo Fisher Scientific), 1× Reaction Buffer (Thermo Fisher Scientific), 20 U RiboLock RNase Inhibitor (Thermo Fisher Scientific), 1 mM dNTP mix (Sigma-Aldrich), and 2.5 µM Oligo(dT)18 Primer (Thermo Fisher Scientific). The reaction was incubated at 65 °C for 5 min, at 42 °C for 45 min, and at 70 °C for 15 min. The resulting cDNA was diluted to a final concentration of 10 ng μL−1. To assess the quality of the cDNA, a standard PCR reaction was performed using ACT non-isoform-specific primers (Table 3). PCR products were analysed by electrophoresis on a 2% (w/v) agarose gel in 1× Tris–acetate–EDTA buffer (1 mM EDTA in 40 mmol L−1 Tris–acetate, pH 8.0).
For quantitative PCR analysis (qPCR), the final reaction mixture (15 μL) contained 2 μL of cDNA, 1× GoTaq® qPCR Master Mix (Promega, Madison, WI, USA) and 200 nM gene-specific primers (Table 3). Reactions were run on a Magnetic Induction Cycler (Mic qPCR, Bio Molecular Systems, Upper Coomera, QLD, Australia) under the following thermal cycling conditions: 1 cycle at 95 °C for 5 min, 40 cycles at 95 °C for 5 s, followed by 1 cycle at 60 °C for 10 s. The specificity of the amplification was confirmed by melting curve analysis in which the temperature increased from 50 °C to 95 °C at a rate of 0.5 °C per s. The internal control genes OGIO and PUX7 (Table 3) were used for normalisation [86]. Relative gene expression levels were calculated using the ΔΔCt method [87,88] and normalised to the wild-type control seedlings sampled before treatment (wt C). For the BPM1-GFP transgene, expression was also normalised, but to the endogenous BPM1 gene in the control oeBPM1 seedlings sampled before treatment (oeBPM1 C).
Table 3.
Primers used for the amplification of the genes of interest in standard (*) and quantitative real-time PCR. Primer efficiencies were calculated using the PCR analysis software 2.12.7 of the real-time PCR instrument (Mic qPCR Analysis Software, Bio Molecular Systems).
Table 3.
Primers used for the amplification of the genes of interest in standard (*) and quantitative real-time PCR. Primer efficiencies were calculated using the PCR analysis software 2.12.7 of the real-time PCR instrument (Mic qPCR Analysis Software, Bio Molecular Systems).
| Gene | Accession Number | 5′ → 3′ Sequence (Forward/Reverse) | Primer Efficiency | Reference |
|---|---|---|---|---|
| ACT * | At3g53750 | CTGGCATCATACTTTCTACAATG CACCACTGAGCACAATGTTAC | / | [43] |
| DREB2A | At5g05410 | CAGTGTTGCCAACGGTTCAT AAACGGAGGTATTCCGTAGTTGAG | 0.87 | [86] |
| HSFA3 | At5g03720 | AGTTTGCCAGAATCATACTTCCA AGCAAGTTTGGTTGGATTGTGG | 0.82 | [11] |
| BPM1 | At5g19000 | CCCGGTTGCACTGAATGGGA ACGATTCATTGTACTTGCTAGATCCGATT | 0.90 | [11] |
| BPM2 | At3g06190 | TCTATCCGGGTAATAAGATCGAAGA CCTTGGAAACCCTAATTGTGTC | 0.86 | [11] |
| BPM3 | At2g39760 | AGTGATAGACGACATCGAACCT CAAGGTCATAGAGGTCAGCA | 0.86 | [11] |
| BPM4 | At3g03740 | GAAGTTACTGACATGGAGCCT CACTGACTCGCACATTAGAC | 0.84 | [11] |
| BPM5 | At5g21010 | CGTTTGCCTTAAGTTTACTGCC ACTGTTACTACCTTCCTCGTG | 0.78 | [89] |
| BPM6 | At3g43700 | AAGGGTCAGGCAGCGAACCA CCGCTTCCCTTTCATTCGGTACA | 0.94 | [89] |
| BPM1-GFP | / | AGTGGAAGACGAGTGAAGC CTGAACTTGTGGCCGTTTAC | 0.85 | [89] |
| OGIO | At5g51880 | ATCCAAGAGCAGTTCAAGCAAG GAGAGCCATACCTTCCACTG | 0.82 | [86] |
| PUX7 | At1g14570 | GTTTCTCAGACTATCAAAGCCA ATCAATTACAAGCACCACGG | 0.86 | [86] |
Abbreviations: ACT—gene family encoding actin isoforms; BPM1-6—gene family encoding MATH-BTB proteins in Arabidopsis thaliana; DREB2A—gene encoding dehydration-responsive element-binding protein 2A; HSFA3—gene encoding heat stress transcription factor A-3; OGIO—gene encoding 2-oxoglutarate (2OG) and Fe(II)-dependent oxygenase superfamily protein; PUX7—gene encoding plant UBX-domain-containing protein.
4.8. Statistical Analysis
Each experiment was performed independently three times, and one representative result was presented. Before performing statistical analyses, the data were checked for outliers using Tukey’s fences, with k set to 1.5. The distribution of variables was assessed using the Shapiro–Wilk W test, while variance homogeneity was assessed with Levene’s test. Data were considered normally distributed, and variances were considered equal if p > 0.05. As the data followed a normal distribution and showed equal variances, parametric statistical analyses were applied.
A two-way ANOVA was performed to evaluate the effects of the heat treatment, the tested lines, and their interactions on the measured parameters. This analysis was used to determine whether the observed changes were significantly influenced by the treatment, the tested lines, or the combination of both factors. If the two-way ANOVA revealed a statistically significant effect, we conducted further analyses to determine specific group differences. For comparisons involving only two groups (C-HS vs. HS, or C-REC vs. REC within wild type, oeBPM1, or amiR-bpm), Student’s t-test for independent samples was used. For comparisons involving plant lines (wild type vs. oeBPM1 vs amiR-bpm) exposed to the same treatment condition (C-HS, HS, C-REC, or REC), a one-way ANOVA followed by Tukey’s HSD post-hoc test was performed.
Gene expression was analysed in seedling tissue sampled at three different time points (before heat exposure, immediately after exposure and after a 24 h recovery period). Therefore, a two-way repeated measures ANOVA was performed. For the analysis, the tested lines were defined as fixed factors and the time points as repeated factors. To assess changes in gene expression within each line, paired Student’s t-test was performed comparing the C and HS groups or the C and REC groups. For comparisons involving the same treatment condition (C, HS, or REC) between wild type, oeBPM1, and amiR-bpm, a one-way ANOVA followed by Tukey’s HSD post-hoc test was performed.
All differences were considered significant at p ≤ 0.05. Statistical analyses were performed with Statistica 14.0 (TIBCO Software Inc., Palo Alto, CA, USA).
5. Conclusions
This study provides new insights into the role of BPM proteins in modulating the response of A. thaliana to moderate heat stress. By analysing A. thaliana lines with altered expression of BPM genes, we demonstrated that BPM proteins influence important physiological and molecular processes, including photosynthesis, antioxidant activity, the accumulation of HSPs, and the expression of heat-responsive genes. The results suggest that overexpression of BPM1 can disrupt the balance between stress signalling and cellular homeostasis, while reduced expression of several BPM genes, as in the amiR-bpm line, may enable a more sustained yet regulated activation of heat-responsive pathways such as DREB2A to HSFA3 cascade, promoting a more adaptive response to moderate heat stress. The response to heat stress was also associated with line-specific changes in the expression of BPM genes, supporting the regulatory interplay between BPM proteins and heat signalling components. Our results emphasise the importance of balanced expression of BPMs in coordinating stress responses and suggest that BPM1 and possibly other BPM proteins contribute to different physiological strategies. In addition, this study provides a basis for future research on the stress response regulated by BPM proteins, their involvement in proteostasis, and their potential application to improve heat stress tolerance in plants.
Author Contributions
Conceptualization, D.L.-L. and Ž.V.-C.; methodology, S.V., N.B. and Ž.V.-C.; formal analysis, S.V.; investigation, S.V.; resources, N.B., D.L.-L. and Ž.V.-C.; writing—original draft preparation, S.V.; writing—review and editing, D.L.-L., N.B. and Ž.V.-C.; supervision, N.B. and Ž.V.-C.; project administration, D.L.-L.; funding acquisition, D.L.-L., N.B. and Ž.V.-C. All authors have read and agreed to the published version of the manuscript.
Funding
This research was funded by Croatian Science Foundation (project PhytoMethDev; grant number IP 2016-06-6229 and project SpliceFun; grant number IP-2022-10-7874) and the University of Zagreb Research Grant.
Data Availability Statement
Data are included in the article.
Acknowledgments
The line amiR-bpm was kindly provided by Pascal Genschik research group, Institute of Molecular Biology of Plants, Strasbourg, France.
Conflicts of Interest
The authors declare no conflicts of interest.
References
- Xu, F.Q.; Xue, H.W. The Ubiquitin-Proteasome System in Plant Responses to Environments. Plant Cell Environ. 2019, 42, 2931–2944. [Google Scholar] [CrossRef] [PubMed]
- Ban, Z.; Estelle, M. CUL3 E3 Ligases in Plant Development and Environmental Response. Nat. Plants 2021, 7, 6–16. [Google Scholar] [CrossRef]
- Weber, H.; Hellmann, H. Arabidopsis thaliana BTB/POZ-MATH Proteins Interact with Members of the ERF/AP2 Transcription Factor Family. FEBS J. 2009, 276, 6624–6635. [Google Scholar] [CrossRef]
- De Boer, K.; Tilleman, S.; Pauwels, L.; Vanden Bossche, R.; De Sutter, V.; Vanderhaeghen, R.; Hilson, P.; Hamill, J.D.; Goossens, A. APETALA2/ETHYLENE RESPONSE FACTOR and Basic Helix-Loop-Helix Tobacco Transcription Factors Cooperatively Mediate Jasmonate-Elicited Nicotine Biosynthesis. Plant J. 2011, 66, 1053–1065. [Google Scholar] [CrossRef] [PubMed]
- Qi, W.; Sun, F.; Wang, Q.; Chen, M.; Huang, Y.; Feng, Y.Q.; Luo, X.; Yang, J. Rice Ethylene-Response AP2/ERF Factor OsEATB Restricts Internode Elongation by Down-Regulating a Gibberellin Biosynthetic Gene. Plant Physiol. 2011, 157, 216–228. [Google Scholar] [CrossRef] [PubMed]
- Lechner, E.; Leonhardt, N.; Eisler, H.; Parmentier, Y.; Alioua, M.; Jacquet, H.; Leung, J.; Genschik, P. MATH/BTB CRL3 Receptors Target the Homeodomain-Leucine Zipper ATHB6 to Modulate Abscisic Acid Signaling. Dev. Cell 2011, 21, 1116–1128. [Google Scholar] [CrossRef]
- Chen, L.; Lee, J.H.; Weber, H.; Tohge, T.; Witt, S.; Roje, S.; Fernie, A.R.; Hellmann, H. Arabidopsis BPM Proteins Function as Substrate Adaptors to a CULLIN3-Based E3 Ligase to Affect Fatty Acid Metabolism in Plants. Plant Cell 2013, 25, 2253–2264. [Google Scholar] [CrossRef]
- Chen, L.; Bernhardt, A.; Lee, J.; Hellmann, H. Identification of Arabidopsis MYB56 as a Novel Substrate for CRL3 BPM E3 Ligases. Mol. Plant 2015, 8, 242–250. [Google Scholar] [CrossRef]
- Jagić, M.; Vuk, T.; Škiljaica, A.; Markulin, L.; Vičić Bočkor, V.; Tokić, M.; Miškec, K.; Razdorov, G.; Habazin, S.; Šoštar, M.; et al. BPM1 Regulates RdDM-Mediated DNA Methylation via a Cullin 3 Independent Mechanism. Plant Cell Rep. 2022, 41, 2139–2157. [Google Scholar] [CrossRef]
- Waese, J.; Fan, J.; Pasha, A.; Yu, H.; Fucile, G.; Shi, R.; Cumming, M.; Kelley, L.A.; Sternberg, M.J.; Krishnakumar, V.; et al. ePlant: Visualizing and Exploring Multiple Levels of Data for Hypothesis Generation in Plant Biology. Plant Cell 2017, 29, 1806–1821. [Google Scholar] [CrossRef]
- Škiljaica, A.; Lechner, E.; Jagić, M.; Majsec, K.; Malenica, N.; Genschik, P.; Bauer, N. The Protein Turnover of Arabidopsis BPM1 Is Involved in Regulation of Flowering Time and Abiotic Stress Response. Plant Mol. Biol. 2020, 102, 359–372. [Google Scholar] [CrossRef] [PubMed]
- Morimoto, K.; Ohama, N.; Kidokoro, S.; Mizoi, J.; Takahashi, F.; Todaka, D.; Mogami, J.; Sato, H.; Qin, F.; Kim, J.-S.; et al. BPM-CUL3 E3 Ligase Modulates Thermotolerance by Facilitating Negative Regulatory Domain-Mediated Degradation of DREB2A in Arabidopsis. Proc. Natl. Acad. Sci. USA 2017, 114, E8528–E8536. [Google Scholar] [CrossRef] [PubMed]
- Wahid, A.; Gelani, S.; Ashraf, M.; Foolad, M.R. Heat Tolerance in Plants: An Overview. Environ. Exp. Bot. 2007, 61, 199–223. [Google Scholar] [CrossRef]
- Jagadish, S.V.K.; Way, D.A.; Sharkey, T.D. Plant Heat Stress: Concepts Directing Future Research. Plant Cell. Environ. 2021, 44, 1992–2005. [Google Scholar] [CrossRef]
- Sato, H.; Mizoi, J.; Shinozaki, K.; Yamaguchi-Shinozaki, K. Complex Plant Responses to Drought and Heat Stress under Climate Change. Plant J. 2024, 117, 1873–1892. [Google Scholar] [CrossRef] [PubMed]
- Marutani, Y.; Yamauchi, Y.; Kimura, Y.; Mizutani, M.; Sugimoto, Y. Damage to Photosystem II Due to Heat Stress without Light-Driven Electron Flow: Involvement of Enhanced Introduction of Reducing Power into Thylakoid Membranes. Planta 2012, 236, 753–761. [Google Scholar] [CrossRef]
- Hu, S.; Ding, Y.; Zhu, C. Sensitivity and Responses of Chloroplasts to Heat Stress in Plants. Front. Plant Sci. 2020, 11, 375. [Google Scholar] [CrossRef]
- Strasser, R.J.; Tsimilli-Michael, M.; Srivastava, A. Analysis of the Chlorophyll a Fluorescence Transient. In Chlorophyll a Fluorescence. Advances in Photosynthesis and Respiration; Papageorgiou, G.C., Govindjee, Eds.; Springer: Dordrecht, The Netherlands, 2004; Volume 19, pp. 321–362. [Google Scholar] [CrossRef]
- Stirbet, A. Govindjee on the Relation Between the Kautsky Effect (Chlorophyll a Fluorescence Induction) and Photosystem II: Basics and Applications of the OJIP Fluorescence Transient. J. Photochem. Photobiol. B 2011, 104, 236–257. [Google Scholar] [CrossRef]
- Magaña Ugarte, R.; Escudero, A.; Gavilán, R.G. Metabolic and Physiological Responses of Mediterranean High-Mountain and Alpine Plants to Combined Abiotic Stresses. Physiol. Plant. 2019, 165, 403–412. [Google Scholar] [CrossRef]
- Sharma, P.; Jha, A.B.; Dubey, R.S.; Pessarakli, M. Reactive Oxygen Species, Oxidative Damage, and Antioxidative Defense Mechanism in Plants under Stressful Conditions. J. Bot. 2012, 2012, 217037. [Google Scholar] [CrossRef]
- Pospíšil, P.; Kumar, A.; Prasad, A. Reactive Oxygen Species in Photosystem II: Relevance for Oxidative Signaling. Photosynth. Res. 2022, 152, 245–260. [Google Scholar] [CrossRef] [PubMed]
- Foyer, C.H.; Hanke, G. ROS Production and Signalling in Chloroplasts: Cornerstones and Evolving Concepts. Plant J. 2022, 111, 642–661. [Google Scholar] [CrossRef] [PubMed]
- Tiwari, S.; Tiwari, S.; Singh, M.; Singh, A.; Mohan Prasad, S. Generation Mechanisms of Reactive Oxygen Species in the Plant Cell: An Overview. In Reactive Oxygen Species in Plants: Boon or Bane—Revisiting the Role of ROS; Singh, V.P., Singh, S., Kumar Tripathi, D., Mohan Prasad, S., Kumar Chauhan, D., Eds.; John Wiley & Sons Ltd.: Chichester, UK, 2017; pp. 1–22. [Google Scholar] [CrossRef]
- Sadeghipour, O. Cadmium Toxicity Alleviates by Seed Priming with Proline or Glycine Betaine in Cowpea (Vigna unguiculata (L.) Walp.). Egypt. J. Agron. 2020, 42, 163–170. [Google Scholar] [CrossRef]
- Fang, C.; Dou, L.; Liu, Y.; Yu, J.; Tu, J. Heat Stress-Responsive Transcriptome Analysis in Heat Susceptible and Tolerant Rice by High-Throughput Sequencing. Ecol. Genet. Genom. 2018, 6, 33–40. [Google Scholar] [CrossRef]
- Galsurker, O.; Doron-Faigenboim, A.; Teper-Bamnolker, P.; Daus, A.; Lers, A.; Eshel, D. Differential Response to Heat Stress in Outer and Inner Onion Bulb Scales. J. Exp. Bot. 2018, 69, 4047–4064. [Google Scholar] [CrossRef]
- Kotak, S.; Larkindale, J.; Lee, U.; von Koskull-Döring, P.; Vierling, E.; Scharf, K.D. Complexity of the Heat Stress Response in Plants. Curr. Opin. Plant Biol. 2007, 10, 310–316. [Google Scholar] [CrossRef]
- Ohama, N.; Sato, H.; Shinozaki, K.; Yamaguchi-Shinozaki, K. Transcriptional Regulatory Network of Plant Heat Stress Response. Trends Plant Sci. 2017, 22, 53–65. [Google Scholar] [CrossRef]
- Schramm, F.; Larkindale, J.; Kiehlmann, E.; Ganguli, A.; Englich, G.; Vierling, E.; Von Koskull-Döring, P. A Cascade of Transcription Factor DREB2A and Heat Stress Transcription Factor HsfA3 Regulates the Heat Stress Response of Arabidopsis. Plant J. 2008, 53, 264–274. [Google Scholar] [CrossRef]
- Yoshida, T.; Ohama, N.; Nakajima, J.; Kidokoro, S.; Mizoi, J.; Nakashima, K.; Maruyama, K.; Kim, J.-M.; Seki, M.; Todaka, D.; et al. Arabidopsis HsfA1 Transcription Factors Function as the Main Positive Regulators in Heat Shock-Responsive Gene Expression. Mol. Genet. Genom. 2011, 286, 321–332. [Google Scholar] [CrossRef]
- Finch-Savage, W.E.; Bassel, G.W. Seed Vigour and Crop Establishment: Extending Performance beyond Adaptation. J. Exp. Bot. 2016, 67, 567–591. [Google Scholar] [CrossRef]
- Crafts-Brandner, S.J.; Salvucci, M.E. Sensitivity of Photosynthesis in a C4 Plant, Maize, to Heat Stress. Plant Physiol. 2002, 129, 1773–1780. [Google Scholar] [CrossRef] [PubMed]
- Ashraf, M.; Harris, P.J.C. Photosynthesis under Stressful Environments: An Overview. Photosynthetica 2013, 51, 163–190. [Google Scholar] [CrossRef]
- Strasser, R.J.; Srivastava, A.; Tsimilli-Michael, M. The Fluorescence Transient as a Tool to Characterize and Screen Photosynthetic Samples. In Probing Photosynthesis: Mechanisms, Regulation and Adaptation; Yunus, M., Pathre, U., Mohanty, P., Eds.; Taylor and Francis Group, LLC: Abingdon, UK, 2000; pp. 445–483. [Google Scholar]
- Chen, L.-S.; Cheng, L. Photosystem 2 Is More Tolerant to High Temperature in Apple (Malus domestica Borkh.) Leaves than in Fruit Peel. Photosynthetica 2009, 47, 112–120. [Google Scholar] [CrossRef]
- Zushi, K.; Kajiwara, S.; Matsuzoe, N. Chlorophyll a Fluorescence OJIP Transient as a Tool to Characterize and Evaluate Response to Heat and Chilling Stress in Tomato Leaf and Fruit. Sci. Hortic. 2012, 148, 39–46. [Google Scholar] [CrossRef]
- Jägerbrand, A.K.; Kudo, G. Short-Term Responses in Maximum Quantum Yield of PSII (Fv/Fm) to ex situ Temperature Treatment of Populations of Bryophytes Originating from Different Sites in Hokkaido, Northern Japan. Plants 2016, 5, 22. [Google Scholar] [CrossRef]
- Ritchie, G.A. Chlorophyll Fluorescence: What Is It and What Do the Numbers Mean? In National Proceedings: Forest and Conservation Nursery Associations—2005; Riley, L.E., Dumroese, R.K., Landis, T.D., Eds.; Department of Agriculture, Forest Service, Rocky Mountain Research Station: Fort Collins, CO, USA, 2006; pp. 34–42. [Google Scholar]
- Živčák, M.; Brestič, M.; Olšovská, K.; Slamka, P. Performance Index as a Sensitive Indicator of Water Stress in Triticum aestivum L. Plant Soil Environ. 2008, 54, 133–139. [Google Scholar] [CrossRef]
- Jedmowski, C.; Brüggemann, W. Imaging of Fast Chlorophyll Fluorescence Induction Curve (OJIP) Parameters, Applied in a Screening Study with Wild Barley (Hordeum spontaneum) Genotypes under Heat Stress. J. Photochem. Photobiol. B 2015, 151, 153–160. [Google Scholar] [CrossRef]
- Shanker, A.K.; Amirineni, S.; Bhanu, D.; Yadav, S.K.; Jyothilakshmi, N.; Vanaja, M.; Singh, J.; Sarkar, B.; Maheswari, M.; Singh, V.K. High-Resolution Dissection of Photosystem II Electron Transport Reveals Differential Response to Water Deficit and Heat Stress in Isolation and Combination in Pearl Millet [Pennisetum glaucum (L.) R. Br.]. Front. Plant Sci. 2022, 13, 892676. [Google Scholar] [CrossRef]
- Vuković, M.; Kutnjak, M.; Vitko, S.; Tkalec, M.; Vidaković-Cifrek, Ž. Heat Priming Modifies Heat Stress Response in BPM1-Overexpressing Arabidopsis thaliana (L.) Heynh. J. Plant Growth Regul. 2025, 44, 1695–1712. [Google Scholar] [CrossRef]
- Jin, H.; Li, M.; Duan, S.; Fu, M.; Dong, X.; Liu, B.; Feng, D.; Wang, J.; Wang, H.B. Optimization of Light-Harvesting Pigment Improves Photosynthetic Efficiency. Plant Physiol. 2016, 172, 1720–1731. [Google Scholar] [CrossRef]
- Simkin, A.J.; Kapoor, L.; Doss, C.G.P.; Hofmann, T.A.; Lawson, T.; Ramamoorthy, S. The Role of Photosynthesis Related Pigments in Light Harvesting, Photoprotection and Enhancement of Photosynthetic Yield in Planta. Photosynth. Res. 2022, 152, 23–42. [Google Scholar] [CrossRef] [PubMed]
- Qu, A.L.; Ding, Y.F.; Jiang, Q.; Zhu, C. Molecular Mechanisms of the Plant Heat Stress Response. Biochem. Biophys. Res. Commun. 2013, 432, 203–207. [Google Scholar] [CrossRef] [PubMed]
- Azhar, M.T.; Wani, S.H.; Chaudhary, M.T.; Jameel, T.; Kaur, P.; Du, X. Heat Tolerance in Cotton: Morphological, Physiological, and Genetic Perspectives. In Heat Stress Tolerance in Plants: Physiological, Molecular and Genetic Perspectives; Wani, S.H., Kumar, V., Eds.; John Wiley & Sons Ltd.: Chichester, UK, 2020; pp. 1–22. [Google Scholar] [CrossRef]
- Volkov, R.A.; Panchuk, I.I.; Mullineaux, P.M.; Schöffl, F. Heat Stress-Induced H2O2 Is Required for Effective Expression of Heat Shock Genes in Arabidopsis. Plant Mol. Biol. 2006, 61, 733–746. [Google Scholar] [CrossRef] [PubMed]
- Kumar, S.; Kaur, R.; Kaur, N.; Bhandhari, K.; Kaushal, N.; Gupta, K.; Bains, T.S.; Nayyar, H. Heat-Stress Induced Inhibition in Growth and Chlorosis in Mungbean (Phaseolus aureus Roxb.) Is Partly Mitigated by Ascorbic Acid Application and Is Related to Reduction in Oxidative Stress. Acta Physiol. Plant. 2011, 33, 2091–2101. [Google Scholar] [CrossRef]
- Mittler, R. Oxidative Stress, Antioxidants and Stress Tolerance. Trends Plant Sci. 2002, 7, 405–410. [Google Scholar] [CrossRef]
- Zhou, R.; Kong, L.; Yu, X.; Ottosen, C.-O.; Zhao, T.; Jiang, F.; Wu, Z. Oxidative Damage and Antioxidant Mechanism in Tomatoes Responding to Drought and Heat Stress. Acta Physiol. Plant. 2019, 41, 20. [Google Scholar] [CrossRef]
- Larkindale, J.; Knight, M.R. Protection against Heat Stress-Induced Oxidative Damage in Arabidopsis Involves Calcium, Abscisic Acid, Ethylene, and Salicylic Acid. Plant Physiol. 2002, 128, 682–695. [Google Scholar] [CrossRef]
- Ji, H.S.; Bang, S.G.; Ahn, M.-A.; Kim, G.; Kim, E.; Eom, S.H.; Hyun, T.K. Molecular Cloning and Functional Characterization of Heat Stress-Responsive Superoxide Dismutases in Garlic (Allium sativum L.). Antioxidants 2021, 10, 815. [Google Scholar] [CrossRef]
- Ozden, M.; Demirel, U.; Kahraman, A. Effects of Proline on Antioxidant System in Leaves of Grapevine (Vitis vinifera L.) Exposed to Oxidative Stress by H2O2. Sci. Hortic. 2009, 119, 163–168. [Google Scholar] [CrossRef]
- Gill, S.S.; Tajrishi, M.; Madan, M.; Tuteja, N. A DESD-Box Helicase Functions in Salinity Stress Tolerance by Improving Photosynthesis and Antioxidant Machinery in Rice (Oryza sativa L. cv. PB1). Plant Mol. Biol. 2013, 82, 1–22. [Google Scholar] [CrossRef]
- Li, J.; Guo, X.; Zhang, M.; Wang, X.; Zhao, Y.; Yin, Z.; Zhang, Z.; Wang, Y.; Xiong, H.; Zhang, H.; et al. OsERF71 Confers Drought Tolerance via Modulating ABA Signaling and Proline Biosynthesis. Plant Sci. 2018, 270, 131–139. [Google Scholar] [CrossRef] [PubMed]
- Gür, A.; Demirel, U.; Özden, M.; Kahraman, A.; Çopur, O. Diurnal Gradual Heat Stress Affects Antioxidant Enzymes, Proline Accumulation and Some Physiological Components in Cotton (Gossypium hirsutum L.). Afr. J. Biotechnol. 2010, 9, 1008–1015. [Google Scholar] [CrossRef]
- Kavi Kishor, P.B.; Suravajhala, P.; Rathnagiri, P.; Sreenivasulu, N. Intriguing Role of Proline in Redox Potential Conferring High Temperature Stress Tolerance. Front. Plant Sci. 2022, 13, 867531. [Google Scholar] [CrossRef] [PubMed]
- Noctor, G.; Veljovic-Jovanovic, S.; Driscoll, S.; Novitskaya, L.; Foyer, C.H. Drought and Oxidative Load in the Leaves of C3 Plants: A Predominant Role for Photorespiration? Ann. Bot. 2002, 89, 841–850. [Google Scholar] [CrossRef]
- Bauer, N.; Leljak-Levanić, D.; Vuković, R.; Razdorov, G. MATH-BTB Domain Protein AtBPM1 Directly Interact with DMS3, Important of RNA-Directed DNA Methylation in Plants. In Proceedings of the FEBS-EMBO 2014, Paris, France, 30 August–4 September 2014; p. 306. [Google Scholar]
- Kerchev, P.; Waszczak, C.; Lewandowska, A.; Willems, P.; Shapiguzov, A.; Li, Z.; Alseekh, S.; Mühlenbock, P.; Hoeberichts, F.A.; Huang, J.; et al. Lack of GLYCOLATE OXIDASE1, but Not GLYCOLATE OXIDASE2, Attenuates the Photorespiratory Phenotype of CATALASE2-Deficient Arabidopsis. Plant Physiol. 2016, 171, 1704–1719. [Google Scholar] [CrossRef]
- Vitko, S.; Bauer, N.; Leljak-Levanić, D.; Vidaković-Cifrek, Ž. Effect of Moderate Heat Stress on Arabidopsis thaliana with Modified BPMs Expression. Acta Bot. Croat. 2022, 81, 140–148. [Google Scholar] [CrossRef]
- Xiu, Y.; Iqbal, A.; Zhu, C.; Wu, G.; Chang, Y.; Li, N.; Cao, Y.; Zhang, W.; Zeng, H.; Chen, S.; et al. Improvement and Transcriptome Analysis of Root Architecture by Overexpression of Fraxinus pennsylvanica DREB2A Transcription Factor in Robinia pseudoacacia L. “Idaho”. Plant Biotechnol. J. 2016, 14, 1456–1469. [Google Scholar] [CrossRef]
- Finka, A.; Mattoo, R.U.H.; Goloubinoff, P. Meta-Analysis of Heat-and Chemically Upregulated Chaperone Genes in Plant and Human Cells. Cell Stress Chaperones 2011, 16, 15–31. [Google Scholar] [CrossRef] [PubMed]
- Finka, A.; Sharma, S.K.; Goloubinoff, P. Multi-Layered Molecular Mechanisms of Polypeptide Holding, Unfolding and Disaggregation by HSP70/HSP110 Chaperones. Front. Mol. Biosci. 2015, 2, 29. [Google Scholar] [CrossRef]
- Guihur, A.; Fauvet, B.; Finka, A.; Quadroni, M.; Goloubinoff, P. Quantitative Proteomic Analysis to Capture the Role of Heat-Accumulated Proteins in Moss Plant Acquired Thermotolerance. Plant Cell Environ. 2021, 44, 2117–2133. [Google Scholar] [CrossRef]
- Charng, Y.; Liu, H.; Liu, N.; Hsu, F.; Ko, S. Arabidopsis Hsa32, a Novel Heat Shock Protein, Is Essential for Acquired Thermotolerance during Long Recovery after Acclimation. Plant Physiol. 2006, 140, 1297–1305. [Google Scholar] [CrossRef]
- Hasanuzzaman, M.; Nahar, K.; Alam, M.M.; Roychowdhury, R.; Fujita, M. Physiological, Biochemical, and Molecular Mechanisms of Heat Stress Tolerance in Plants. Int. J. Mol. Sci. 2013, 14, 9643–9684. [Google Scholar] [CrossRef]
- Lämke, J.; Brzezinka, K.; Altmann, S.; Bäurle, I. A Hit-and-run Heat Shock Factor Governs Sustained Histone Methylation and Transcriptional Stress Memory. EMBO J. 2016, 35, 162–175. [Google Scholar] [CrossRef]
- Kozeko, L. Different Roles of Inducible and Constitutive HSP70 and HSP90 in Tolerance of Arabidopsis thaliana to High Temperature and Water Deficit. Acta Physiol. Plant. 2021, 43, 58. [Google Scholar] [CrossRef]
- Agarwal, P.; Agarwal, P.K.; Joshi, A.J.; Sopory, S.K.; Reddy, M.K. Overexpression of PgDREB2A Transcription Factor Enhances Abiotic Stress Tolerance and Activates Downstream Stress-Responsive Genes. Mol. Biol. Rep. 2010, 37, 1125–1135. [Google Scholar] [CrossRef]
- Juranić, M.; Dresselhaus, T. Phylogenetic Analysis of the Expansion of the MATH-BTB Gene Family in the Grasses. Plant Signal Behav. 2014, 9, e28242. [Google Scholar] [CrossRef]
- Murashige, T.; Skoog, F. A Revised Medium for Rapid Growth and Bio Assays with Tobacco Tissue Cultures. Physiol. Plant. 1962, 15, 473–497. [Google Scholar] [CrossRef]
- Boyes, D.C.; Zayed, A.M.; Ascenzi, R.; Mccaskill, A.J.; Hoffman, N.E.; Davis, K.R.; Görlach, J. Growth Stage-Based Phenotypic Analysis of Arabidopsis: A Model for High Throughput Functional Genomics in Plants. Plant Cell 2001, 13, 1499–1510. [Google Scholar] [CrossRef]
- Wellburn, A.R. The Spectral Determination of Chlorophylls a and b, as Well as Total Carotenoids, Using Various Solvents with Spectrophotometers of Different Resolution. J. Plant Physiol. 1994, 144, 307–313. [Google Scholar] [CrossRef]
- Mátai, A.; Hideg, É. A Comparison of Colorimetric Assays Detecting Hydrogen Peroxide in Leaf Extracts. Anal. Methods 2017, 9, 2357–2360. [Google Scholar] [CrossRef]
- Hodges, D.M.; DeLong, J.M.; Forney, C.F.; Prange, R.K. Improving the Thiobarbituric Acid-Reactive-Substances Assay for Estimating Lipid Peroxidation in Plant Tissues Containing Anthocyanin and Other Interfering Compounds. Planta 1999, 207, 604–611. [Google Scholar] [CrossRef]
- Bates, L.S.; Waldren, R.A.; Teare, I.D. Rapid Determination of Free Proline for Water-Stress Studies. Plant Soil 1973, 39, 205–207. [Google Scholar] [CrossRef]
- Bradford, M.M. A Rapid and Sensitive Method for the Quantitation of Microgram Quantities of Protein Utilizing the Principle of Protein-Dye Binding. Anal. Biochem. 1976, 72, 248–254. [Google Scholar] [CrossRef]
- Maehly, A.C.; Chance, B. The Assay of Catalases and Peroxidases. Methods Biochem. Anal. 1954, 1, 358–423. [Google Scholar] [CrossRef]
- Nakano, Y.; Asada, K. Hydrogen Peroxide Is Scavenged by Ascorbate-Specific Peroxidase in Spinach Chloroplasts. Plant Cell Physiol. 1981, 22, 867–880. [Google Scholar] [CrossRef]
- Aebi, H. [13] Catalase in vitro. Methods Enzymol. 1984, 105, 121–126. [Google Scholar] [CrossRef]
- Beauchamp, C.; Fridovich, I. Superoxide Dismutase: Improved Assays and an Assay Applicable to Acrylamide Gels. Anal. Biochem. 1971, 44, 276–287. [Google Scholar] [CrossRef]
- Laemmli, U.K. Cleavage of Structural Proteins during the Assembly of the Head of Bacteriophage T4. Nature 1970, 227, 680–685. [Google Scholar] [CrossRef]
- Romero-Calvo, I.; Ocón, B.; Martínez-Moya, P.; Suárez, M.D.; Zarzuelo, A.; Martínez-Augustin, O.; de Medina, F.S. Reversible Ponceau Staining as a Loading Control Alternative to Actin in Western Blots. Anal. Biochem. 2010, 401, 318–320. [Google Scholar] [CrossRef]
- Škiljaica, A.; Jagić, M.; Vuk, T.; Leljak Levanić, D.; Bauer, N.; Markulin, L. Evaluation of Reference Genes for RT-qPCR Gene Expression Analysis in Arabidopsis thaliana Exposed to Elevated Temperatures. Plant Biol. 2022, 24, 367–379. [Google Scholar] [CrossRef]
- Pfaffl, M.W. Quantification Strategies in Real-Time PCR. In AZ of Quantitative PCR; Bustin, S.A., Ed.; International University Line: La Jolla, CA, USA, 2004; pp. 89–113. [Google Scholar]
- Vandesompele, J.; De Preter, K.; Pattyn, F.; Poppe, B.; Van Roy, N.; De Paepe, A.; Speleman, F. Accurate Normalization of Real-Time Quantitative RT-PCR Data by Geometric Averaging of Multiple Internal Control Genes. Genome Biol. 2002, 3, research0034.1. [Google Scholar] [CrossRef] [PubMed]
- Vitko, S. Response of Arabidopsis thaliana (L.) Heynh. with Modified BPM and DMS3 Gene Expression to Heat Stress. Ph.D. Thesis, University of Zagreb, Faculty of Science, Zagreb, Croatia, 2024. [Google Scholar]
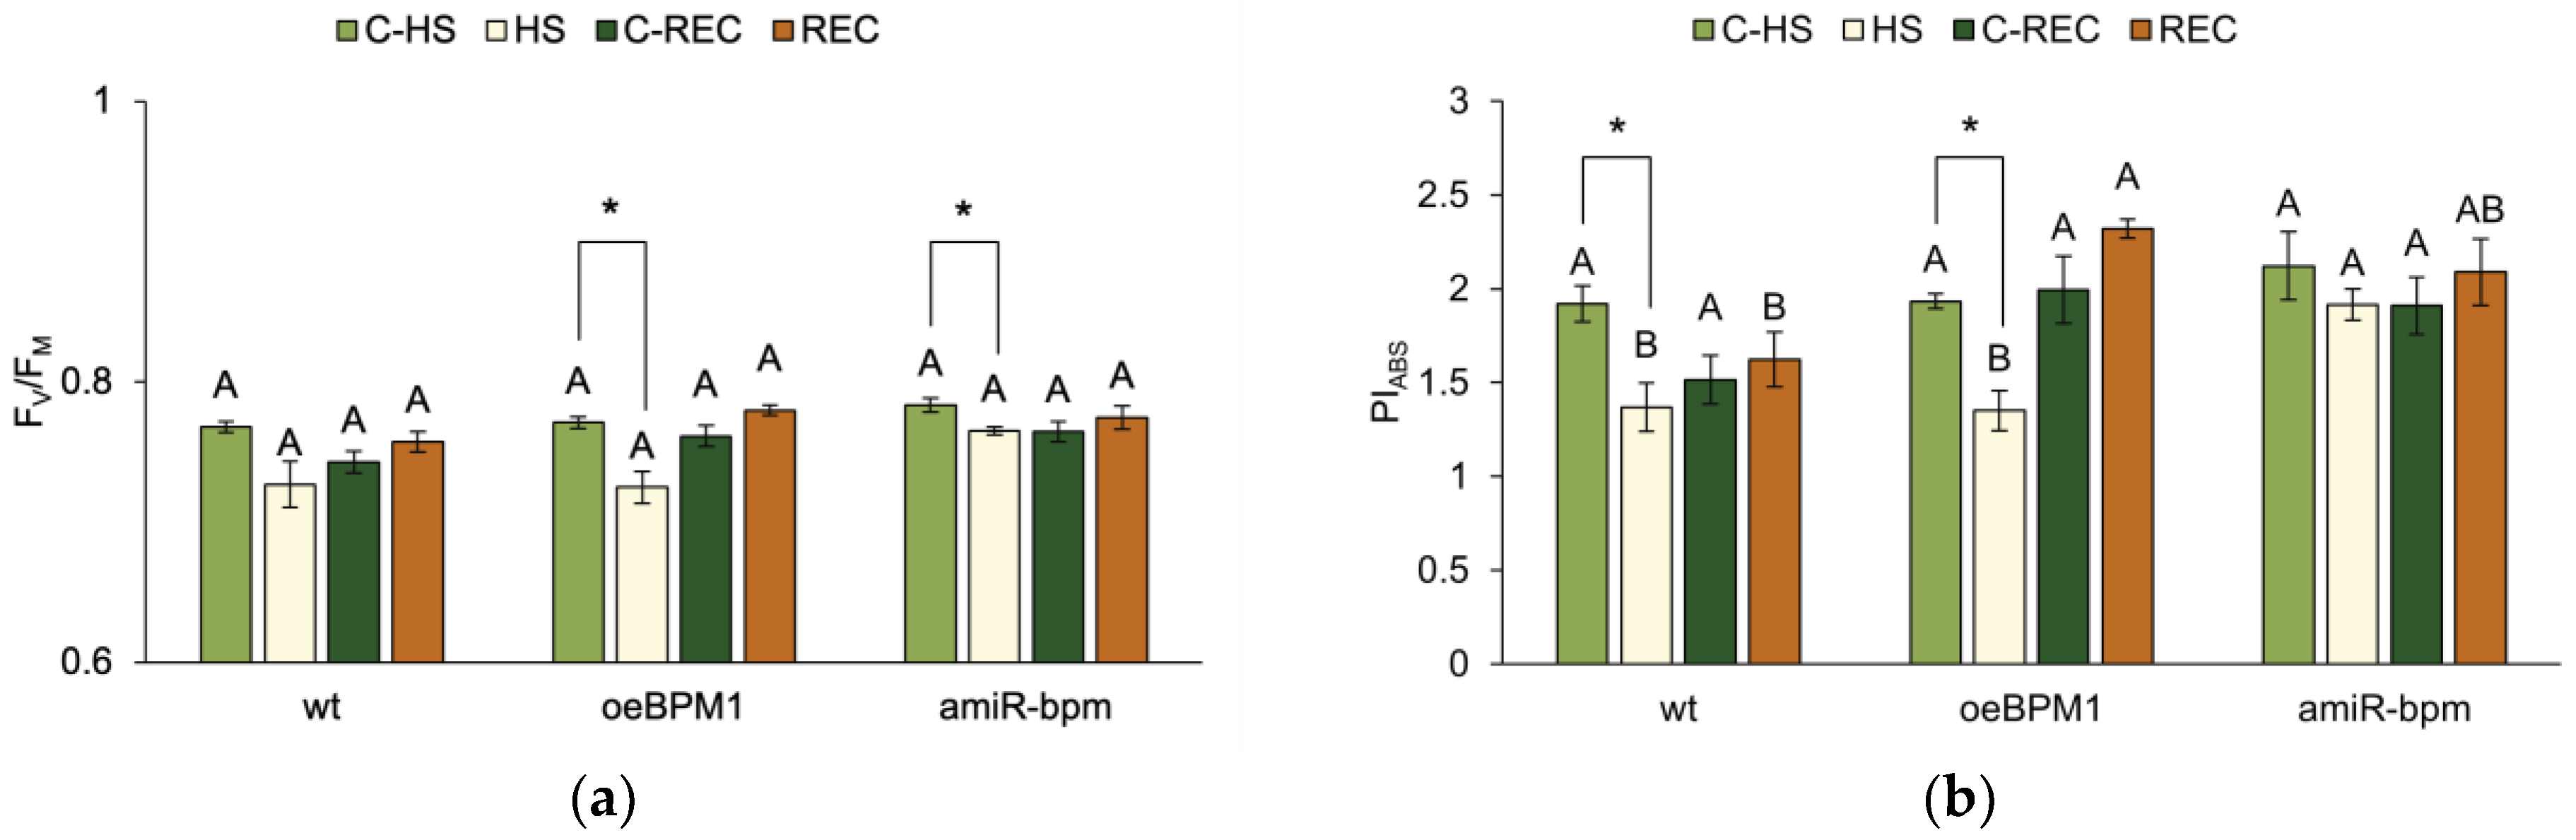
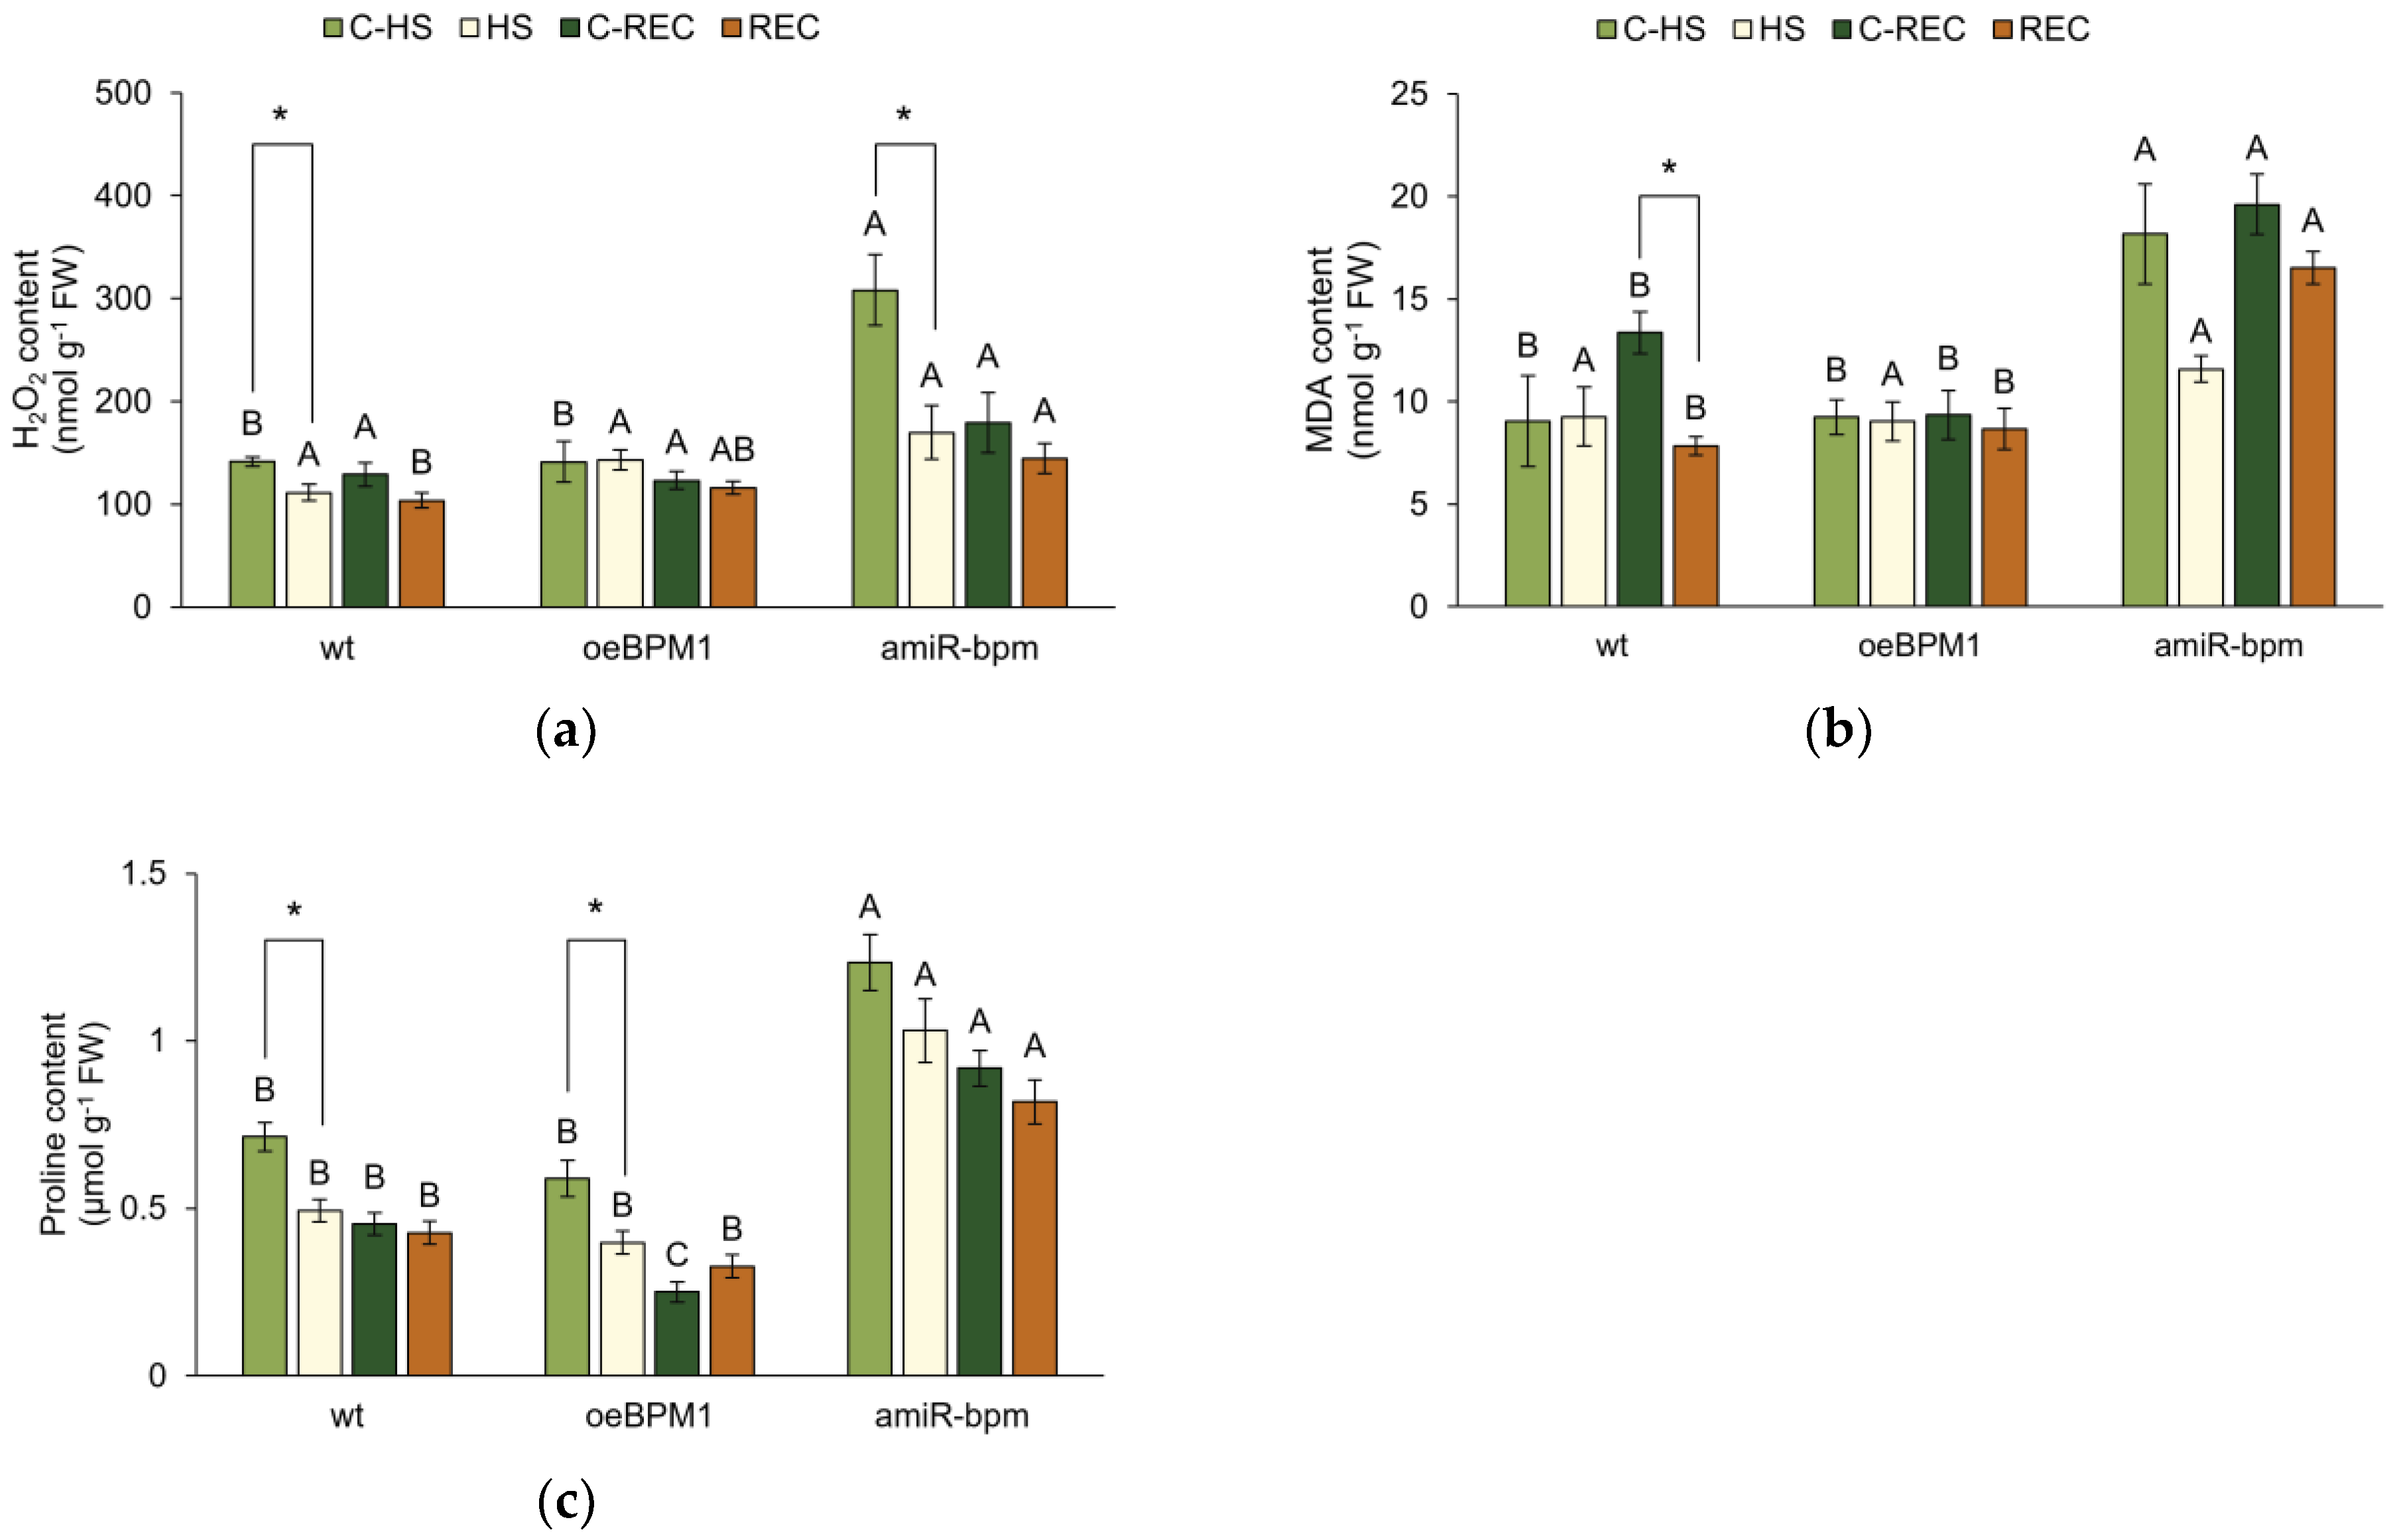
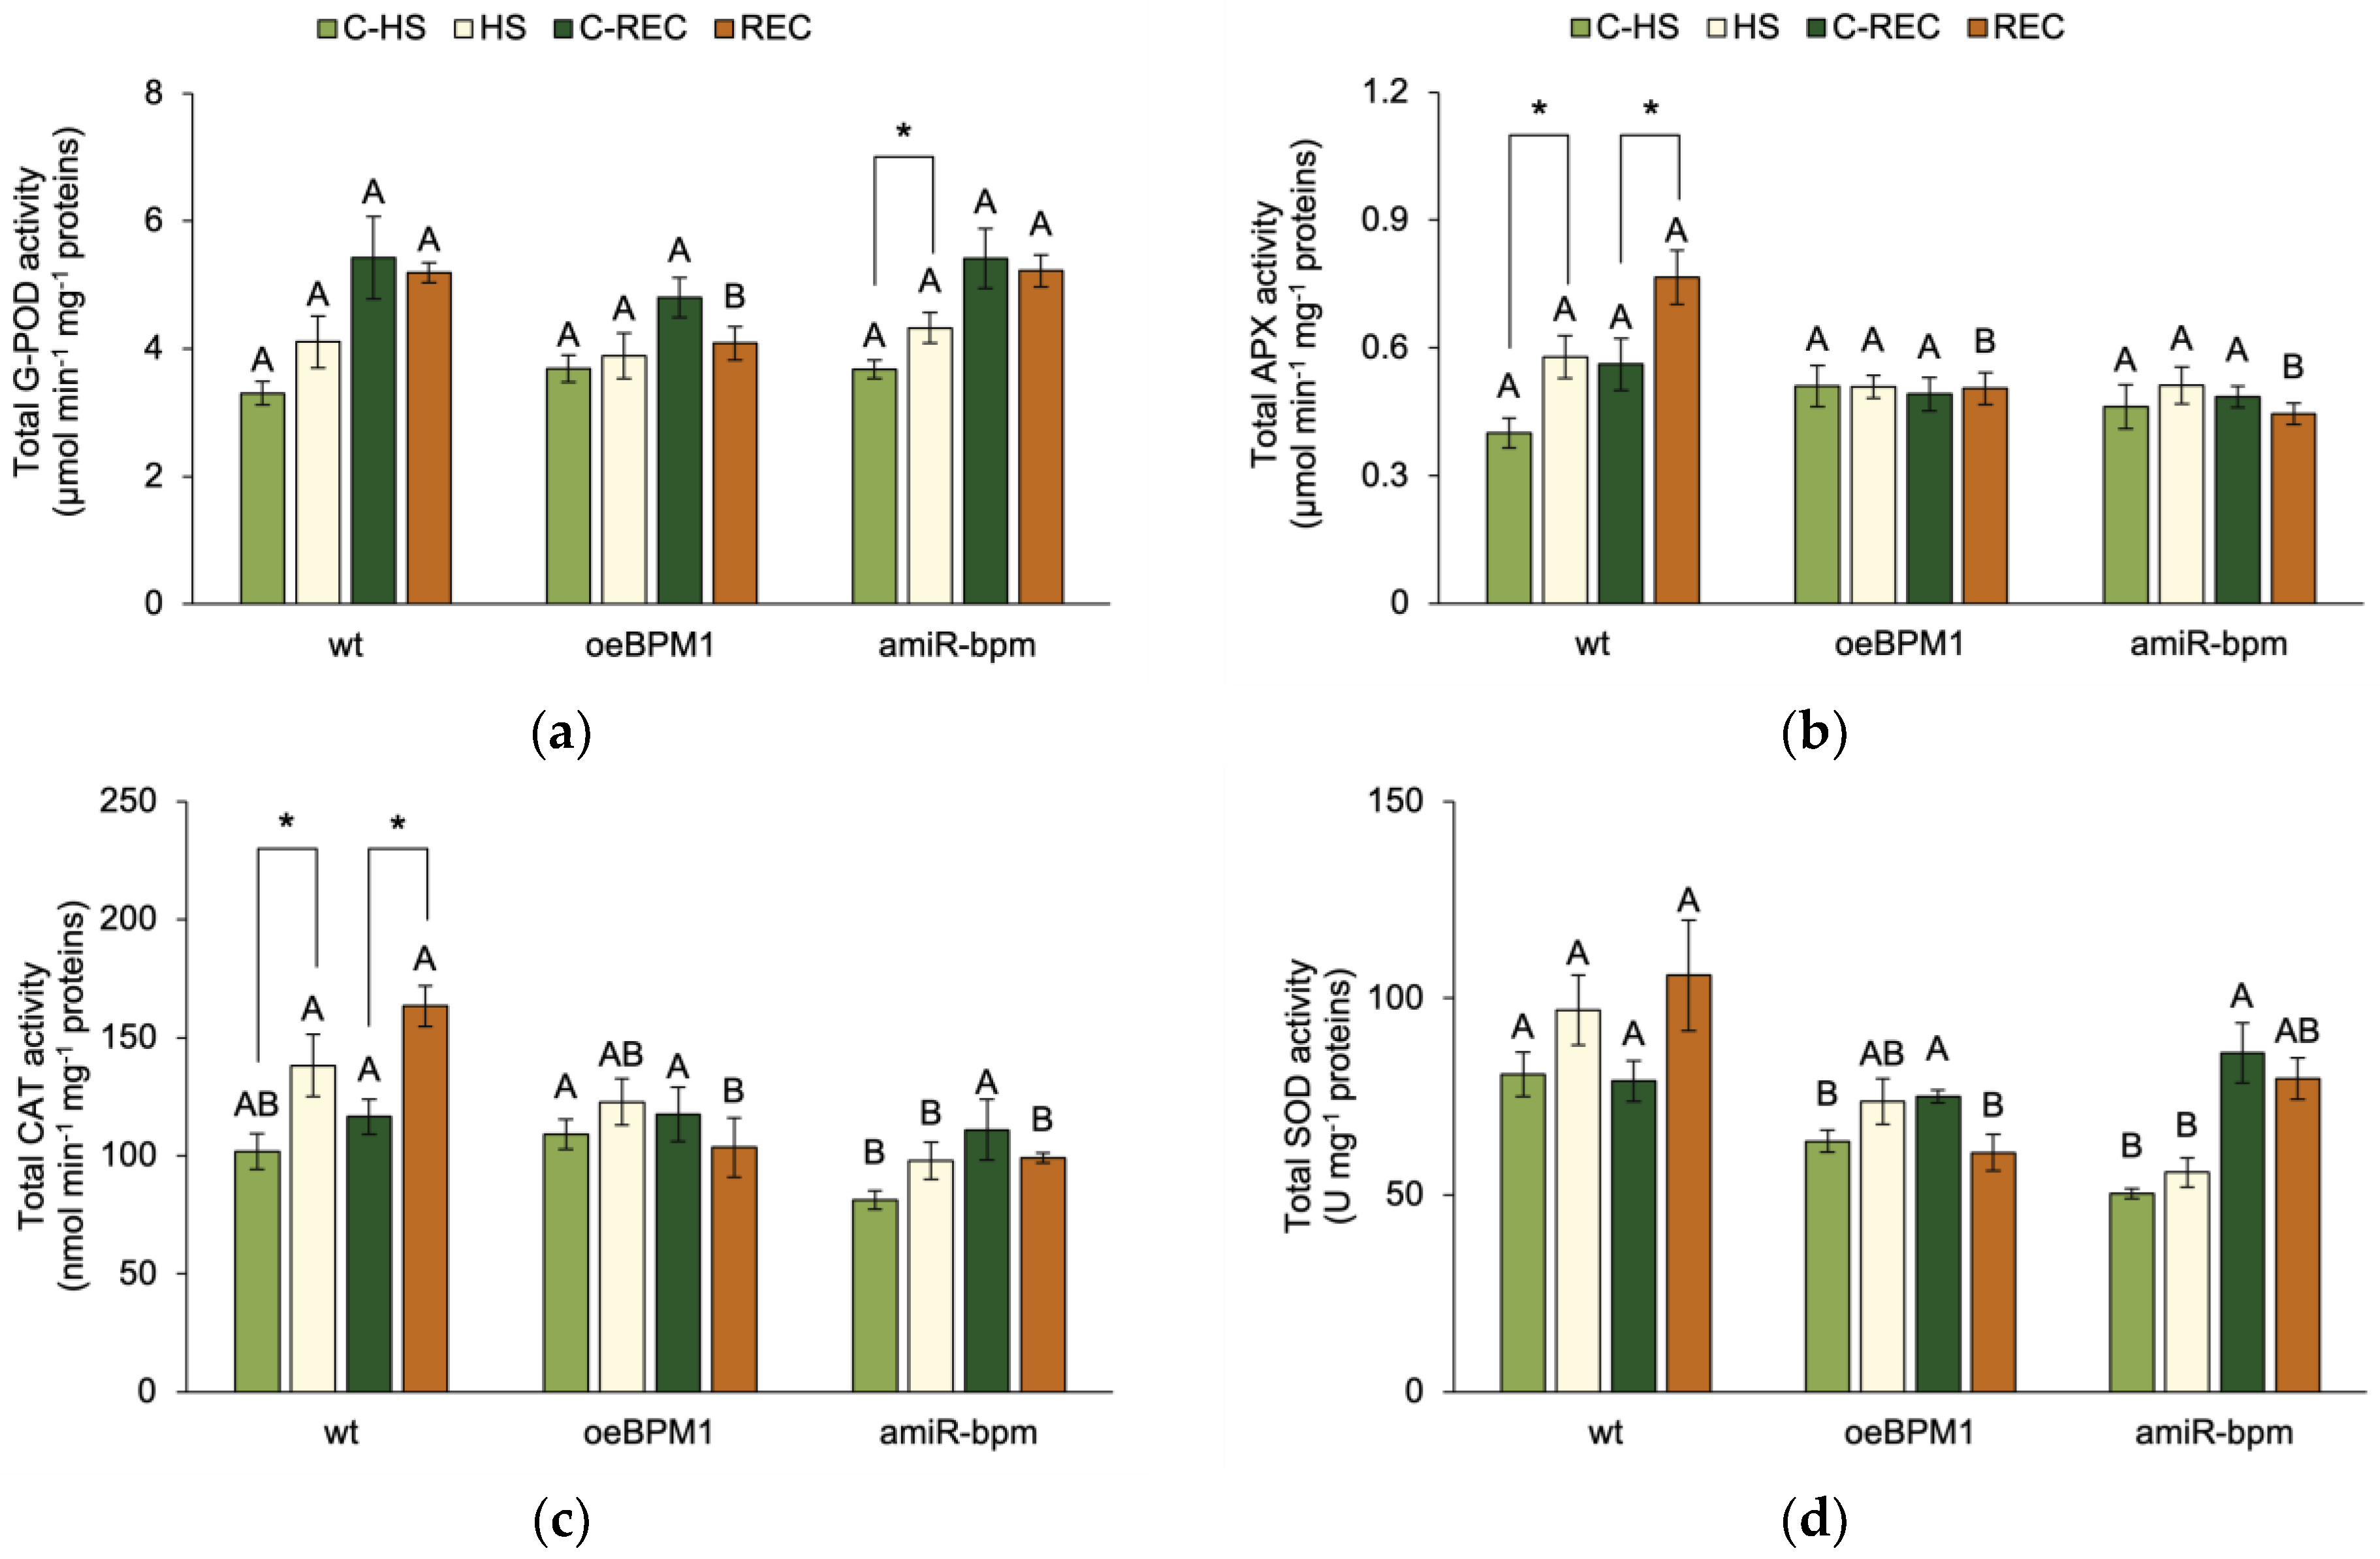
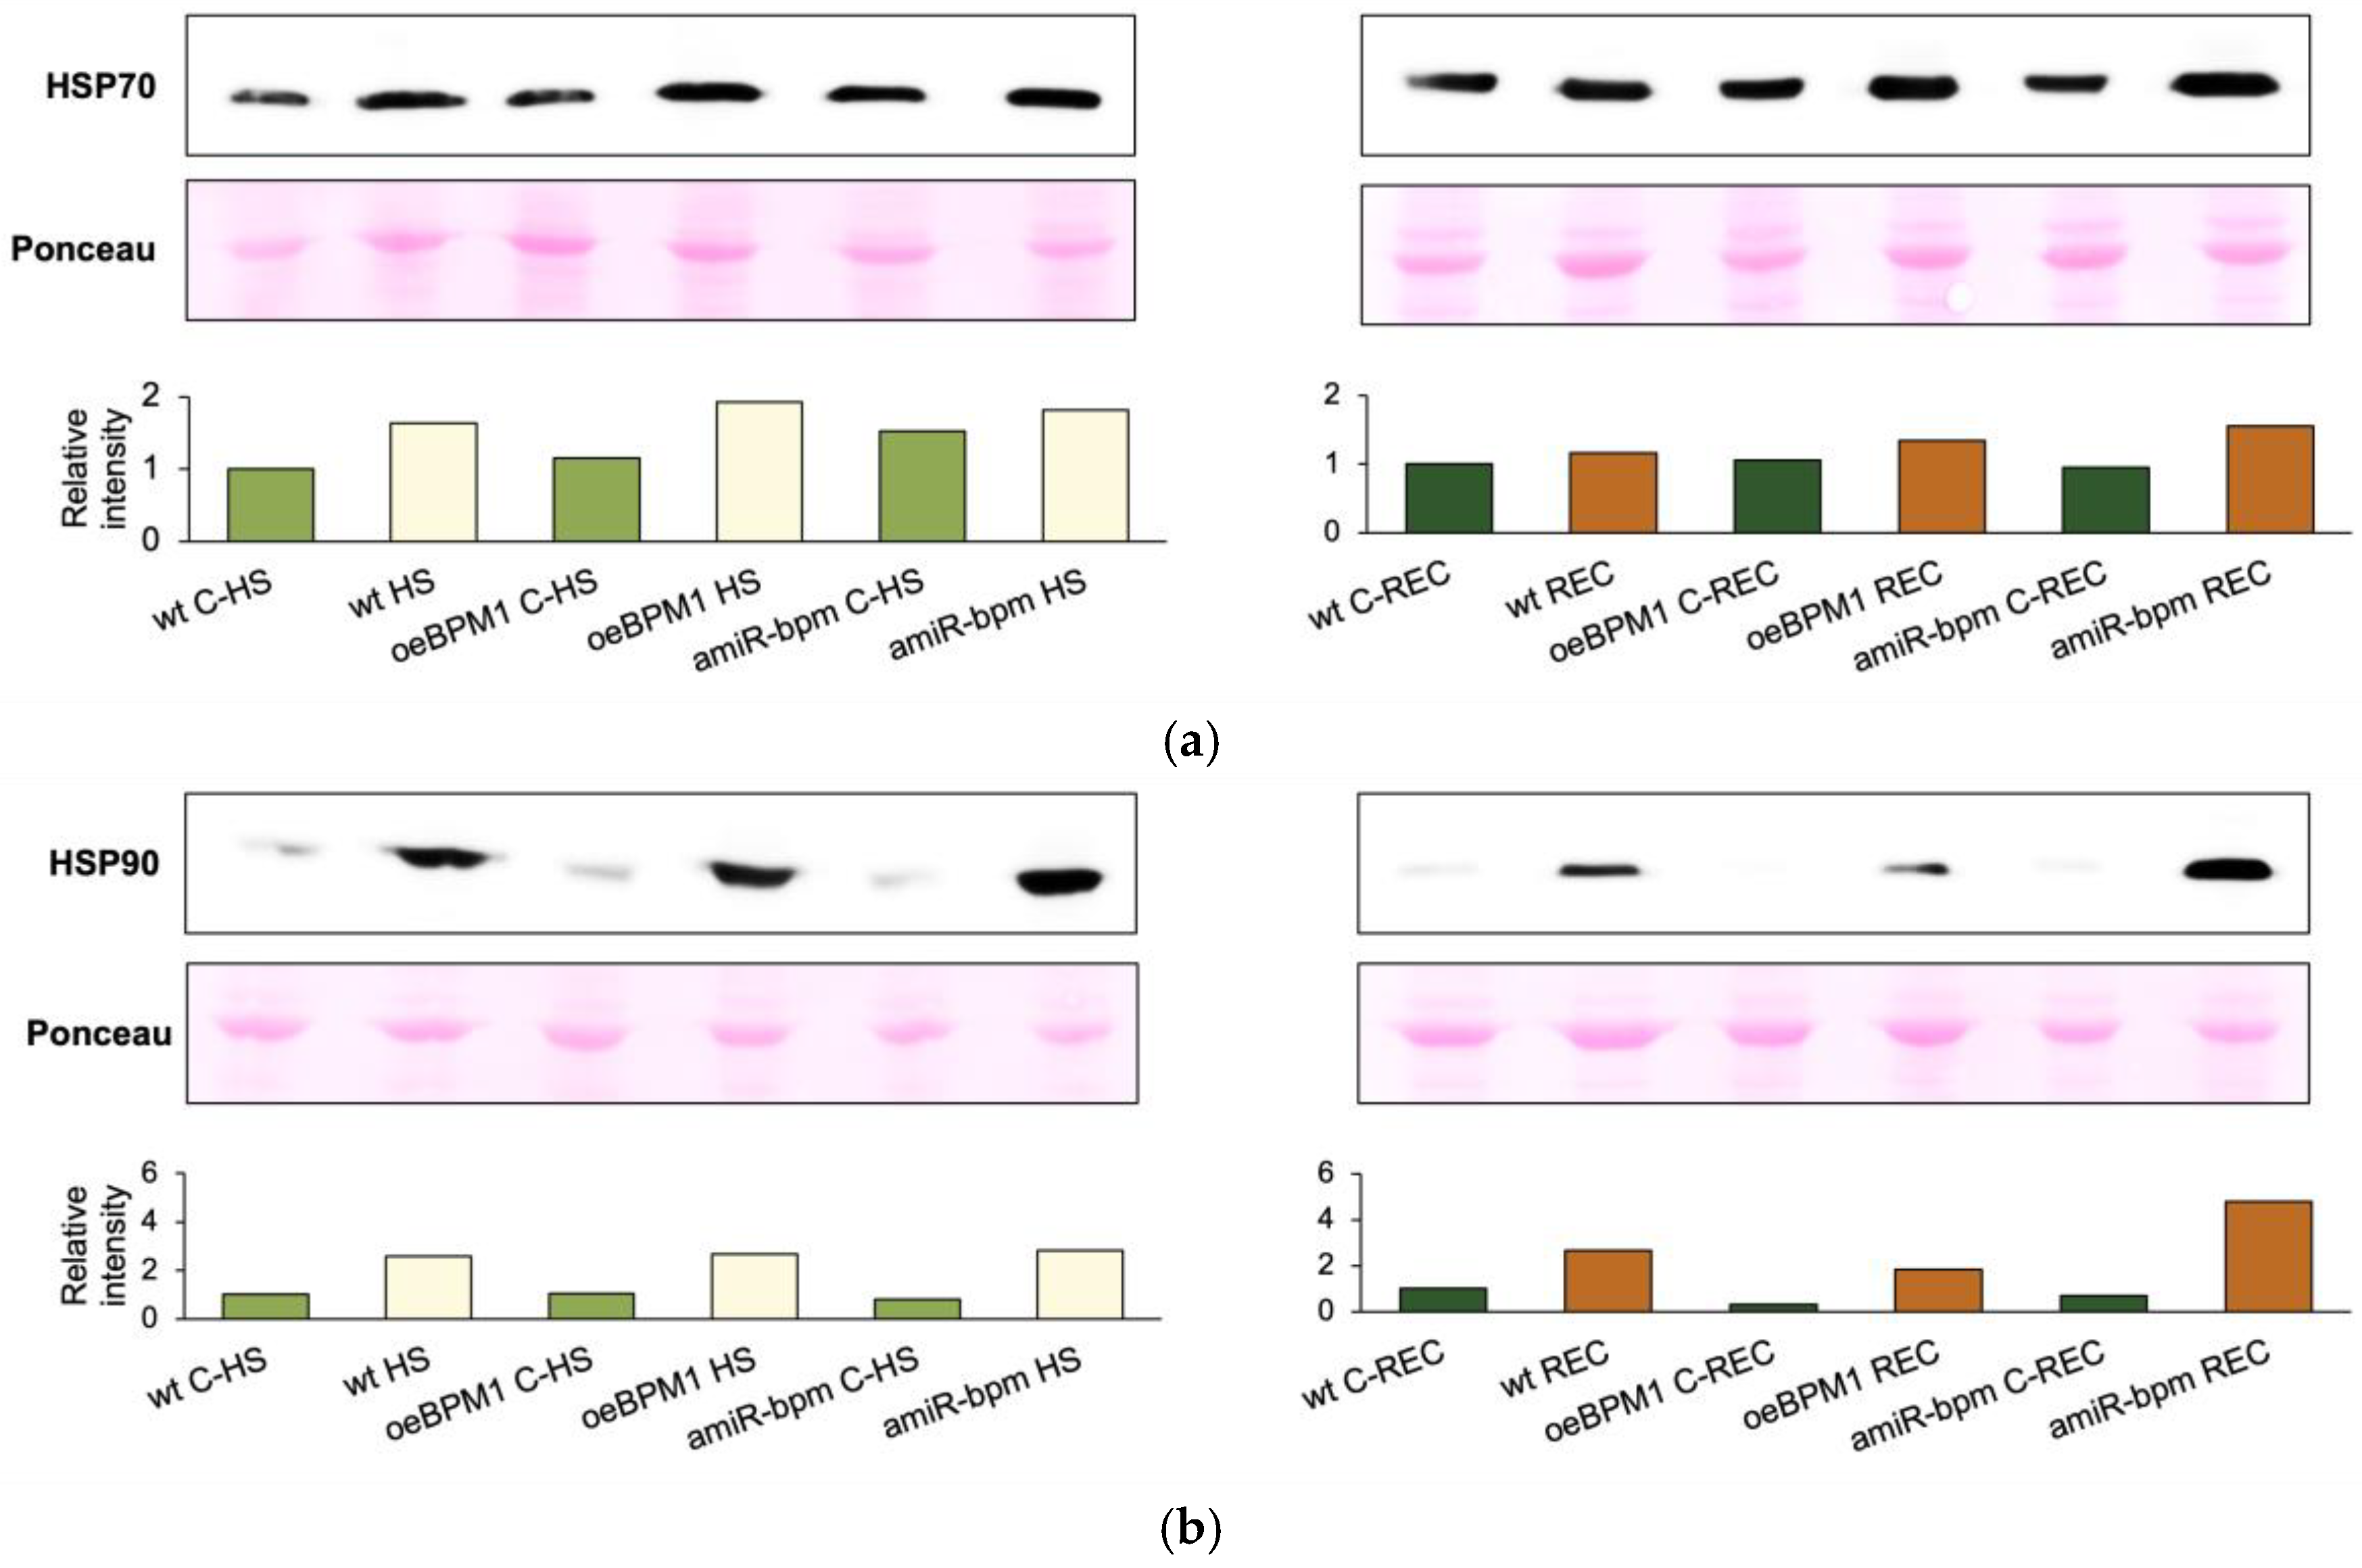
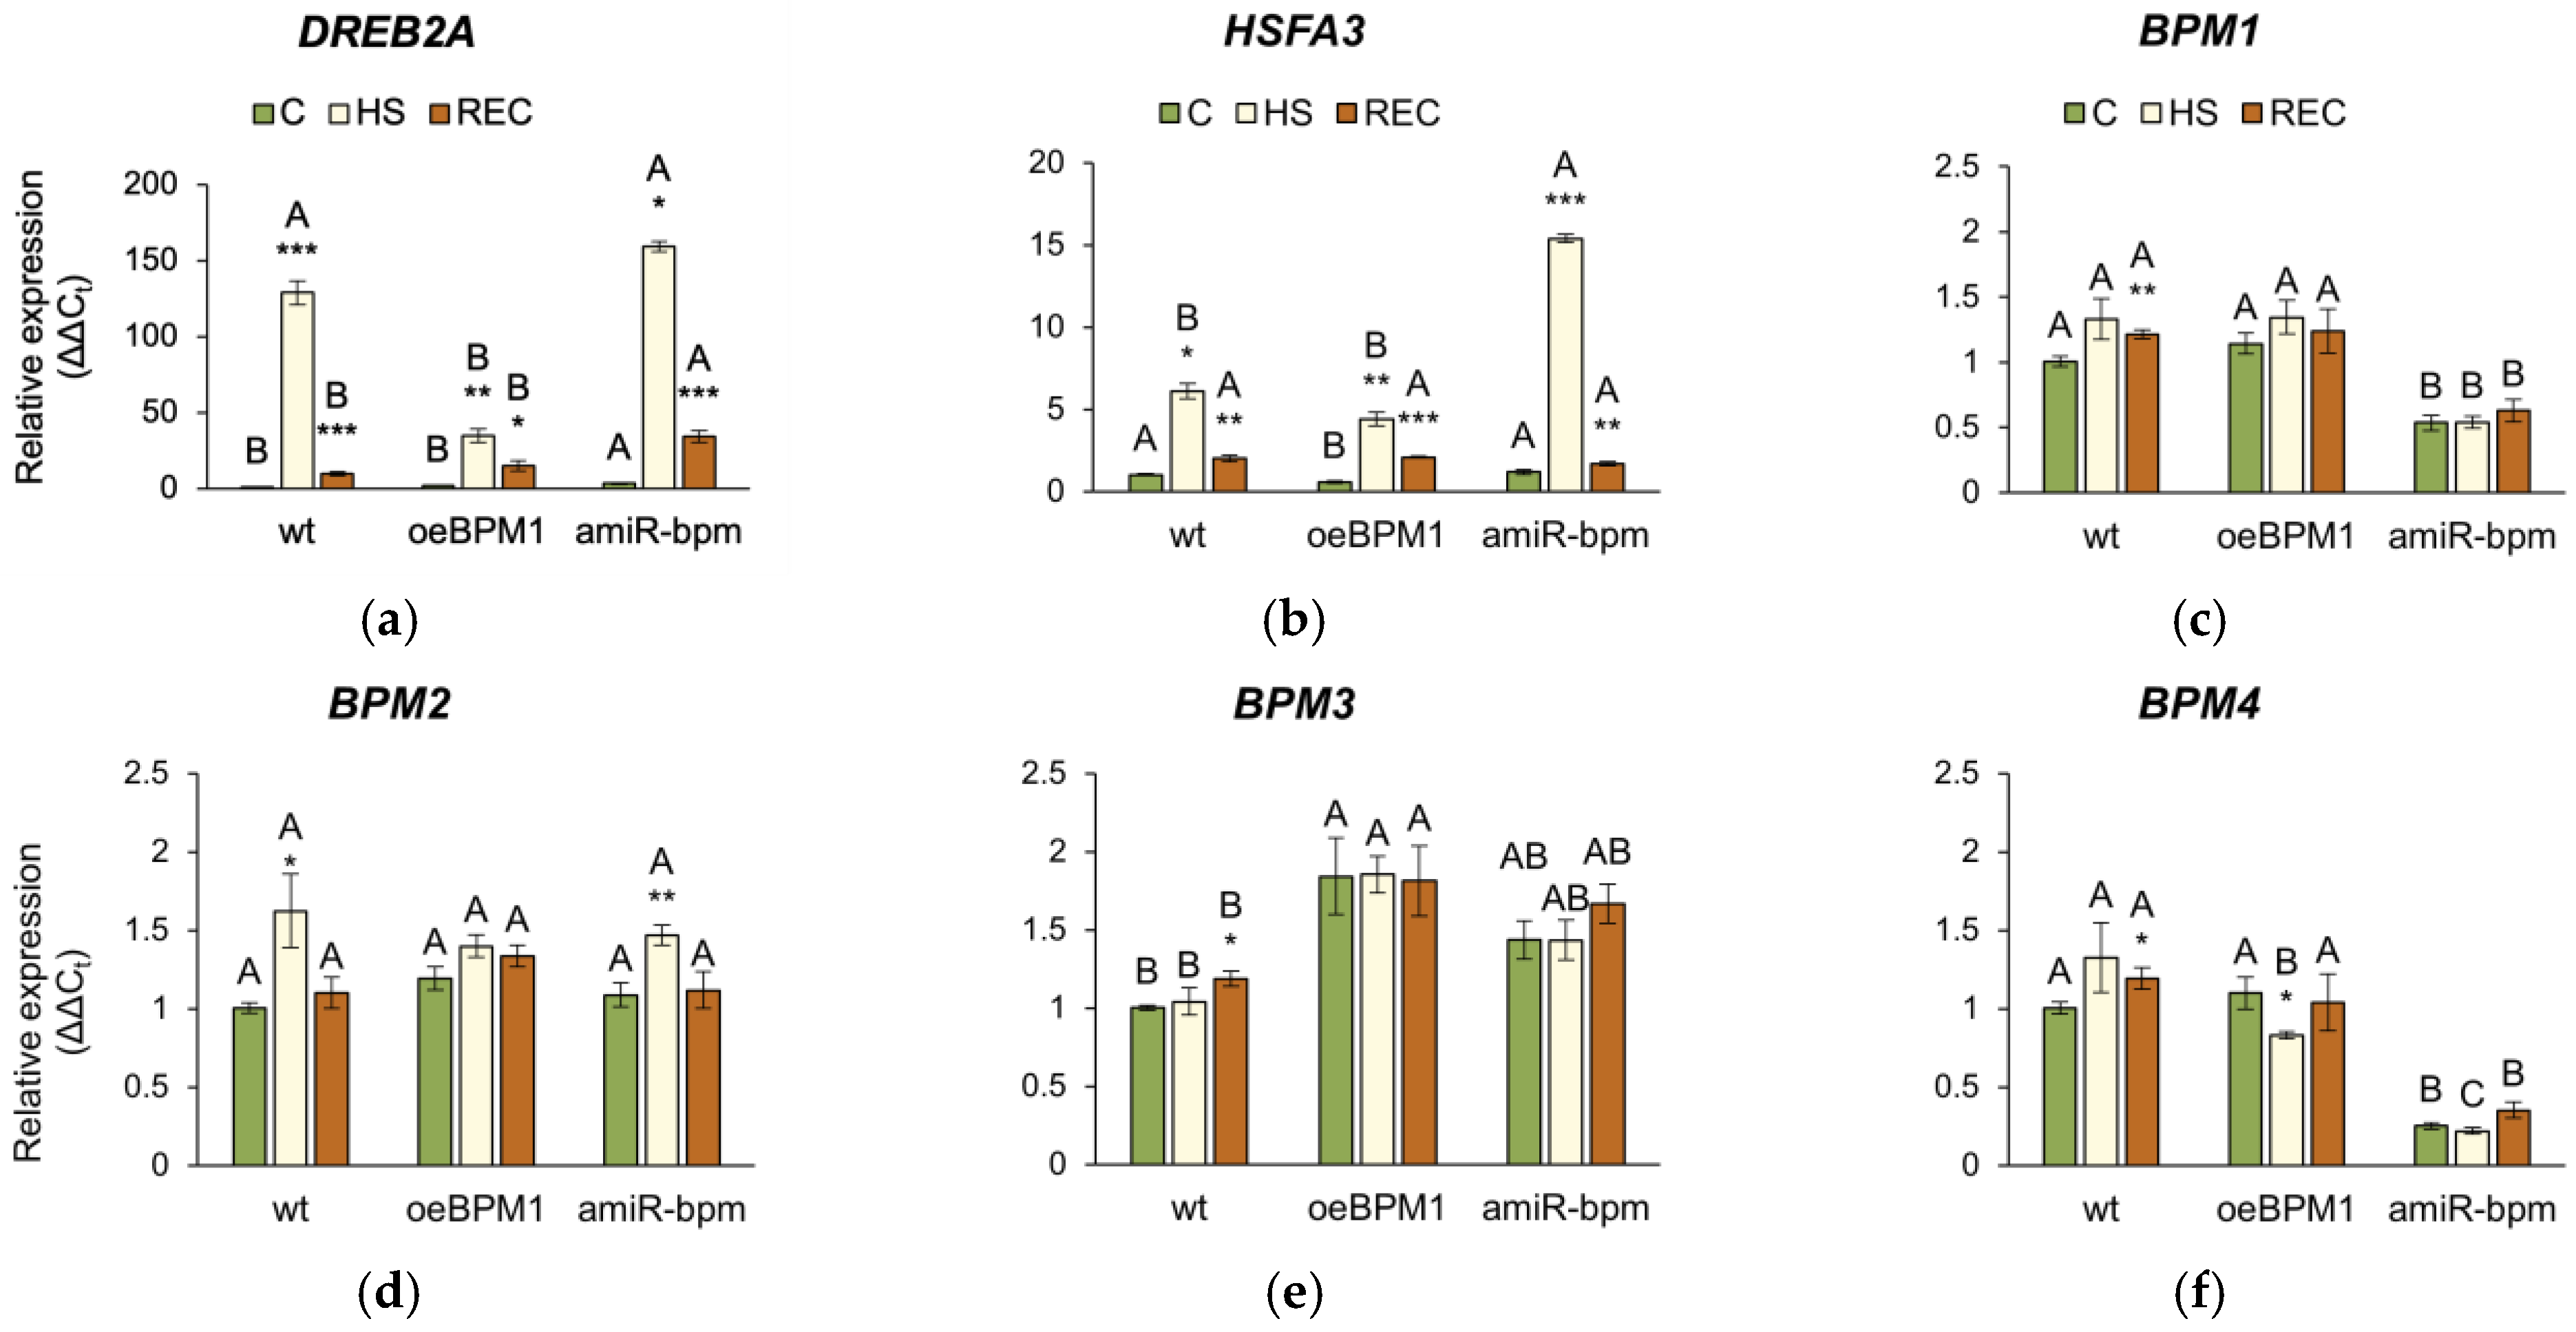
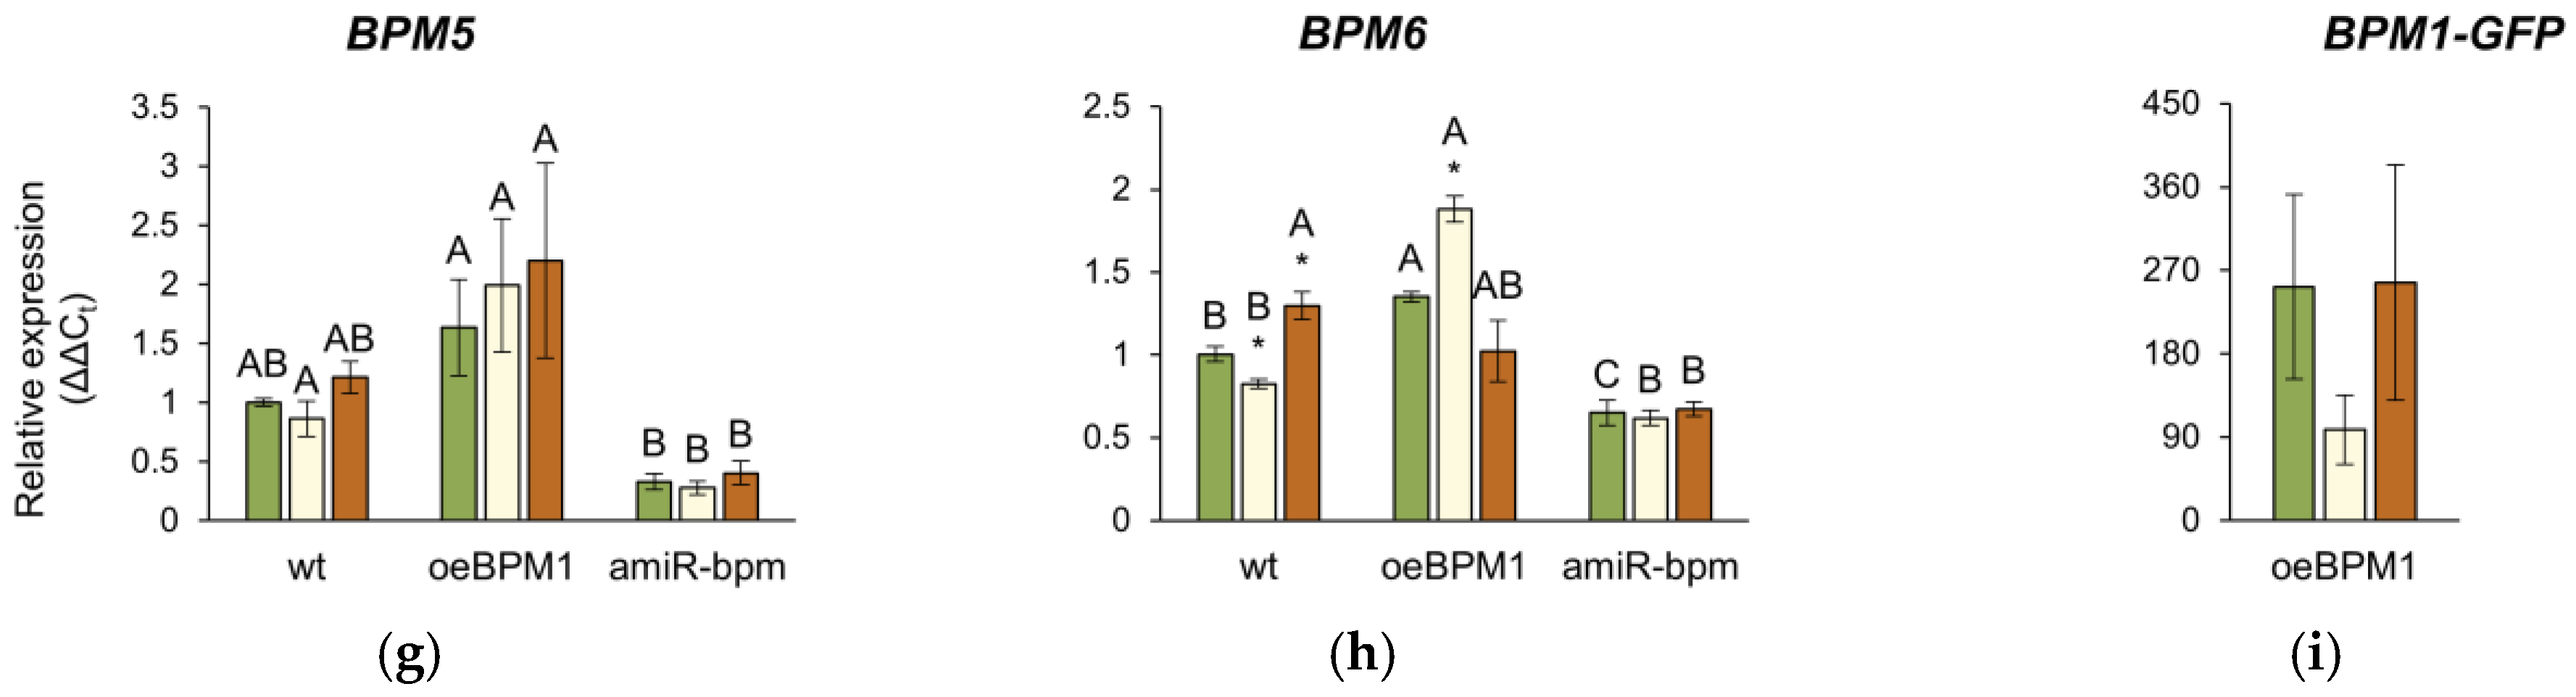
Disclaimer/Publisher’s Note: The statements, opinions and data contained in all publications are solely those of the individual author(s) and contributor(s) and not of MDPI and/or the editor(s). MDPI and/or the editor(s) disclaim responsibility for any injury to people or property resulting from any ideas, methods, instructions or products referred to in the content. |
© 2025 by the authors. Licensee MDPI, Basel, Switzerland. This article is an open access article distributed under the terms and conditions of the Creative Commons Attribution (CC BY) license (https://creativecommons.org/licenses/by/4.0/).