Article

Genetic Diversity and Connectivity of Reef-Building Halimeda macroloba in the Indo-Pacific Region

1
State Key Laboratory of Breeding Biotechnology and Sustainable Aquaculture, Institute of Oceanology, Chinese Academy of Sciences, Qingdao 266000, China
2
Laboratory for Marine Biology and Biotechnology, Qingdao Marine Science and Technology Center, Qingdao 266200, China
3
Algal Ecophysiology (AlgaE) Laboratory, Marine Science Institute, University of the Philippines, Quezon City 1101, Philippines
4
Laboratory of Marine Organism Taxonomy and Phylogeny, Qingdao Key Laboratory of Marine Biodiversity and Conservation, Institute of Oceanology, Chinese Academy of Sciences, Qingdao 266071, China
5
Melbourne Integrative Genomics, School of Biosciences, University of Melbourne, Melbourne, VIC 3010, Australia
*
Author to whom correspondence should be addressed.
Plants 2025, 14(10), 1497; https://doi.org/10.3390/plants14101497
Submission received: 22 March 2025 / Revised: 4 May 2025 / Accepted: 14 May 2025 / Published: 16 May 2025
(This article belongs to the Special Issue Epigenetics, Ecology and Evolution in Algae)

Abstract

:
Understanding population genetic connectivity is crucial for the sustainability and persistence of marine biodiversity. As a fundamental reef-building macroalga of the coastal ecosystem, Halimeda macroloba Decaisne is one of the dominant intertidal seaweeds in the Indo-Pacific region. However, its genetic structure and population connectivity have been poorly recognized. Here, we explored the population genetic structure and genetic connectivity of H. macroloba using chloroplast tufA, rps3-rpl14, and rbcL. Our results indicated low genetic diversity and shallow population genetic structure at the intraspecific level, uncovering five genetic groups with six subdivided lineages in tufA and two genetic clusters in rps3-rpl14. We detected demographic expansion in the last glacial period of the Pleistocene and significantly asymmetric gene flow among different geographical units. We suggest that the southwestward ocean currents under the influence of northeast monsoon in the Indo-Pacific region are the main factor in shaping the present genetic structure, and the asexual reproduction of H. macroloba also plays an important role of the low genetic diversity pattern; in addition, the divergence between genetic clusters might be related to the historical isolation led by the paleoclimate oscillation in the Pleistocene. The Xisha Islands in the northern South China Sea might serve as a potential refugium of H. macroloba, which needs extra attention to conservation management. Given the limitation of sample size, we need to conduct more field work and carry out further research at a larger scale in the future. Our study provided new insights into the theory of population connectivity in the Indo-Pacific region and provided scientific basis for tropical costal seaweed conservation.

1. Introduction

Connectivity conservation is essential for maintaining biodiversity and adapting to climate change across all biomes and spatial scales [1,2]. Increasing connectivity can increase ecosystem resilience and facilitate population recovery [3]. Compared with terrestrial ecosystems, marine ecosystems have higher dynamic and lower spatial heterogeneity, and it is difficult to distinguish habitat patches between different ecosystems, which undoubtedly increases the difficulty of biological connectivity research and application [4]. In recent years, intensive anthropogenic activities and climate change have led to the loss and fragmentation of coastal ecosystems [5], which has forced us to accelerate research on coastal connectivity to develop better conservation strategies.
As a crucial producer of the coastal ecosystem, seaweeds possess substantial economic, ecological, and social value, providing extensive resources such as food, medicine, oxygen, shelter, and habitat for both humans and marine organisms [6]. As highly calcareous green algae, the genus Halimeda (Bryopsidales, Chlorophyta) serves as one of the most important reef-building macroalgae in the global coastal coral reef ecosystem [7,8,9]. Recent studies have revealed that the Halimeda species have an intricate evolutionary history related to the paleoclimate oscillation in the Indo-Pacific region [10,11], which is a well-known hotspot of marine biodiversity around the world with complex geological history, coastal topography, hydrological conditions, and marine environment [12]. However, the research on intraspecific genetic connectivity of Halimeda species in tropical coastal waters is still lacking. Consequently, studying the genetic connectivity of Halimeda species can provide insight into the conservation of calcified algae resources in the Indo-Pacific region and provide scientific evidence for the protection of tropical coral reef ecosystems.
Among Halimeda species, Halimeda macroloba Decaisne acts as an important carbonate contributor in the tropical intertidal ecosystem [13]. Halimeda macroloba is widely distributed in the Indo-Pacific region and functions as the dominant species around the Thai–Malay Peninsula, with the distribution pattern affected by the water depth, sea surface temperature, and phosphate concentration [14]. Previous studies have demonstrated that it seemed to harbour low genetic variation in the Indo-Pacific region [15,16], but the genetic connectivity at the intraspecific level remains poorly acknowledged.
The chloroplast genetic markers were extensively employed for phylogenetic and phylogeographic studies of the macroalgae belonging to Bryopsidales due to the advantages of high sequence conservation and stability of maternal inheritance [17,18,19]. In order to acquire broader molecular data and easier integration of published data, we selected three chloroplast markers (tufA, rps3-rpl14, and rbcL) for amplification experiments, which have been utilized in many studies of Halimeda species [20,21,22]. In this study, we investigated the genetic diversity and population structure of H. macroloba in the Indo-Pacific region and estimated the genetic connectivity mechanism maintaining present distribution patterns at the intraspecific level. Our results could enrich the tropical seaweed genetic theory and further our understanding of the biodiversity conservation of reef-building macroalgae.

2. Results

2.1. Genetic Diversity and Population Genetic Structure

We obtained 308 tufA sequences and 181 rps3-rpl14 sequences, with 13 and 6 haplotypes, respectively (Table S1). Unexpectedly, the amplification of rbcL was challenging, and we eventually obtained 43 sequences and two haplotypes (Table S1). Apart from two Chinese populations (YX and TP) which displayed moderate haplotype diversity in tufA, all other populations exhibited the pattern of low haplotype diversity and low nucleotide diversity (Table S1). Because of the limited sample size of four Vietnamese sites (Table S1), we combined the Vietnamese sequences as one population named VN (Figure 1).
Due to the limited number of rbcL sequences available for population analysis, we utilized the tufA and rps3-rpl14 datasets to investigate the population genetic structure. In tufA, congruent results were found both in the phylogenetic relationship and haplotype network, which indicated two main clades and six sub-lineages at the intraspecific level (Figure 1C,D). Specifically, lineage 1 was mainly distributed along the Thai–Malay Peninsula; lineage 2 only occurred in Phuket in Thailand and Taiping Island in China; lineage 3 was restricted to along the Gulf of Thailand; lineage 5 was widely found along the coast of the South China Sea; the two small remaining lineages (lineage 4 and lineage 6) were limited to the Xisha Islands of China (Figure 1A). The YX population consisted of haplotypes from four lineages, acting as the place with richest genetic diversity in the studying area (Figure 1A; Table S1). The population genetic structure by PCoA analysis was slightly different from the haplotype network, which demonstrated five genetic groups. The populations along the coast of the Thai–Malay Peninsula and the South China Sea belonged to distinct genetic groups (group A and group D) (Figure 1B). Additionally, the Phuket population (PK) and Pi-Tak population (PT) in Thailand formed independent genetic groups, respectively, whereas the two Surat Thani populations (MS and RAB) along the Gulf of Thailand constituted a single genetic group collectively (Figure 1B).
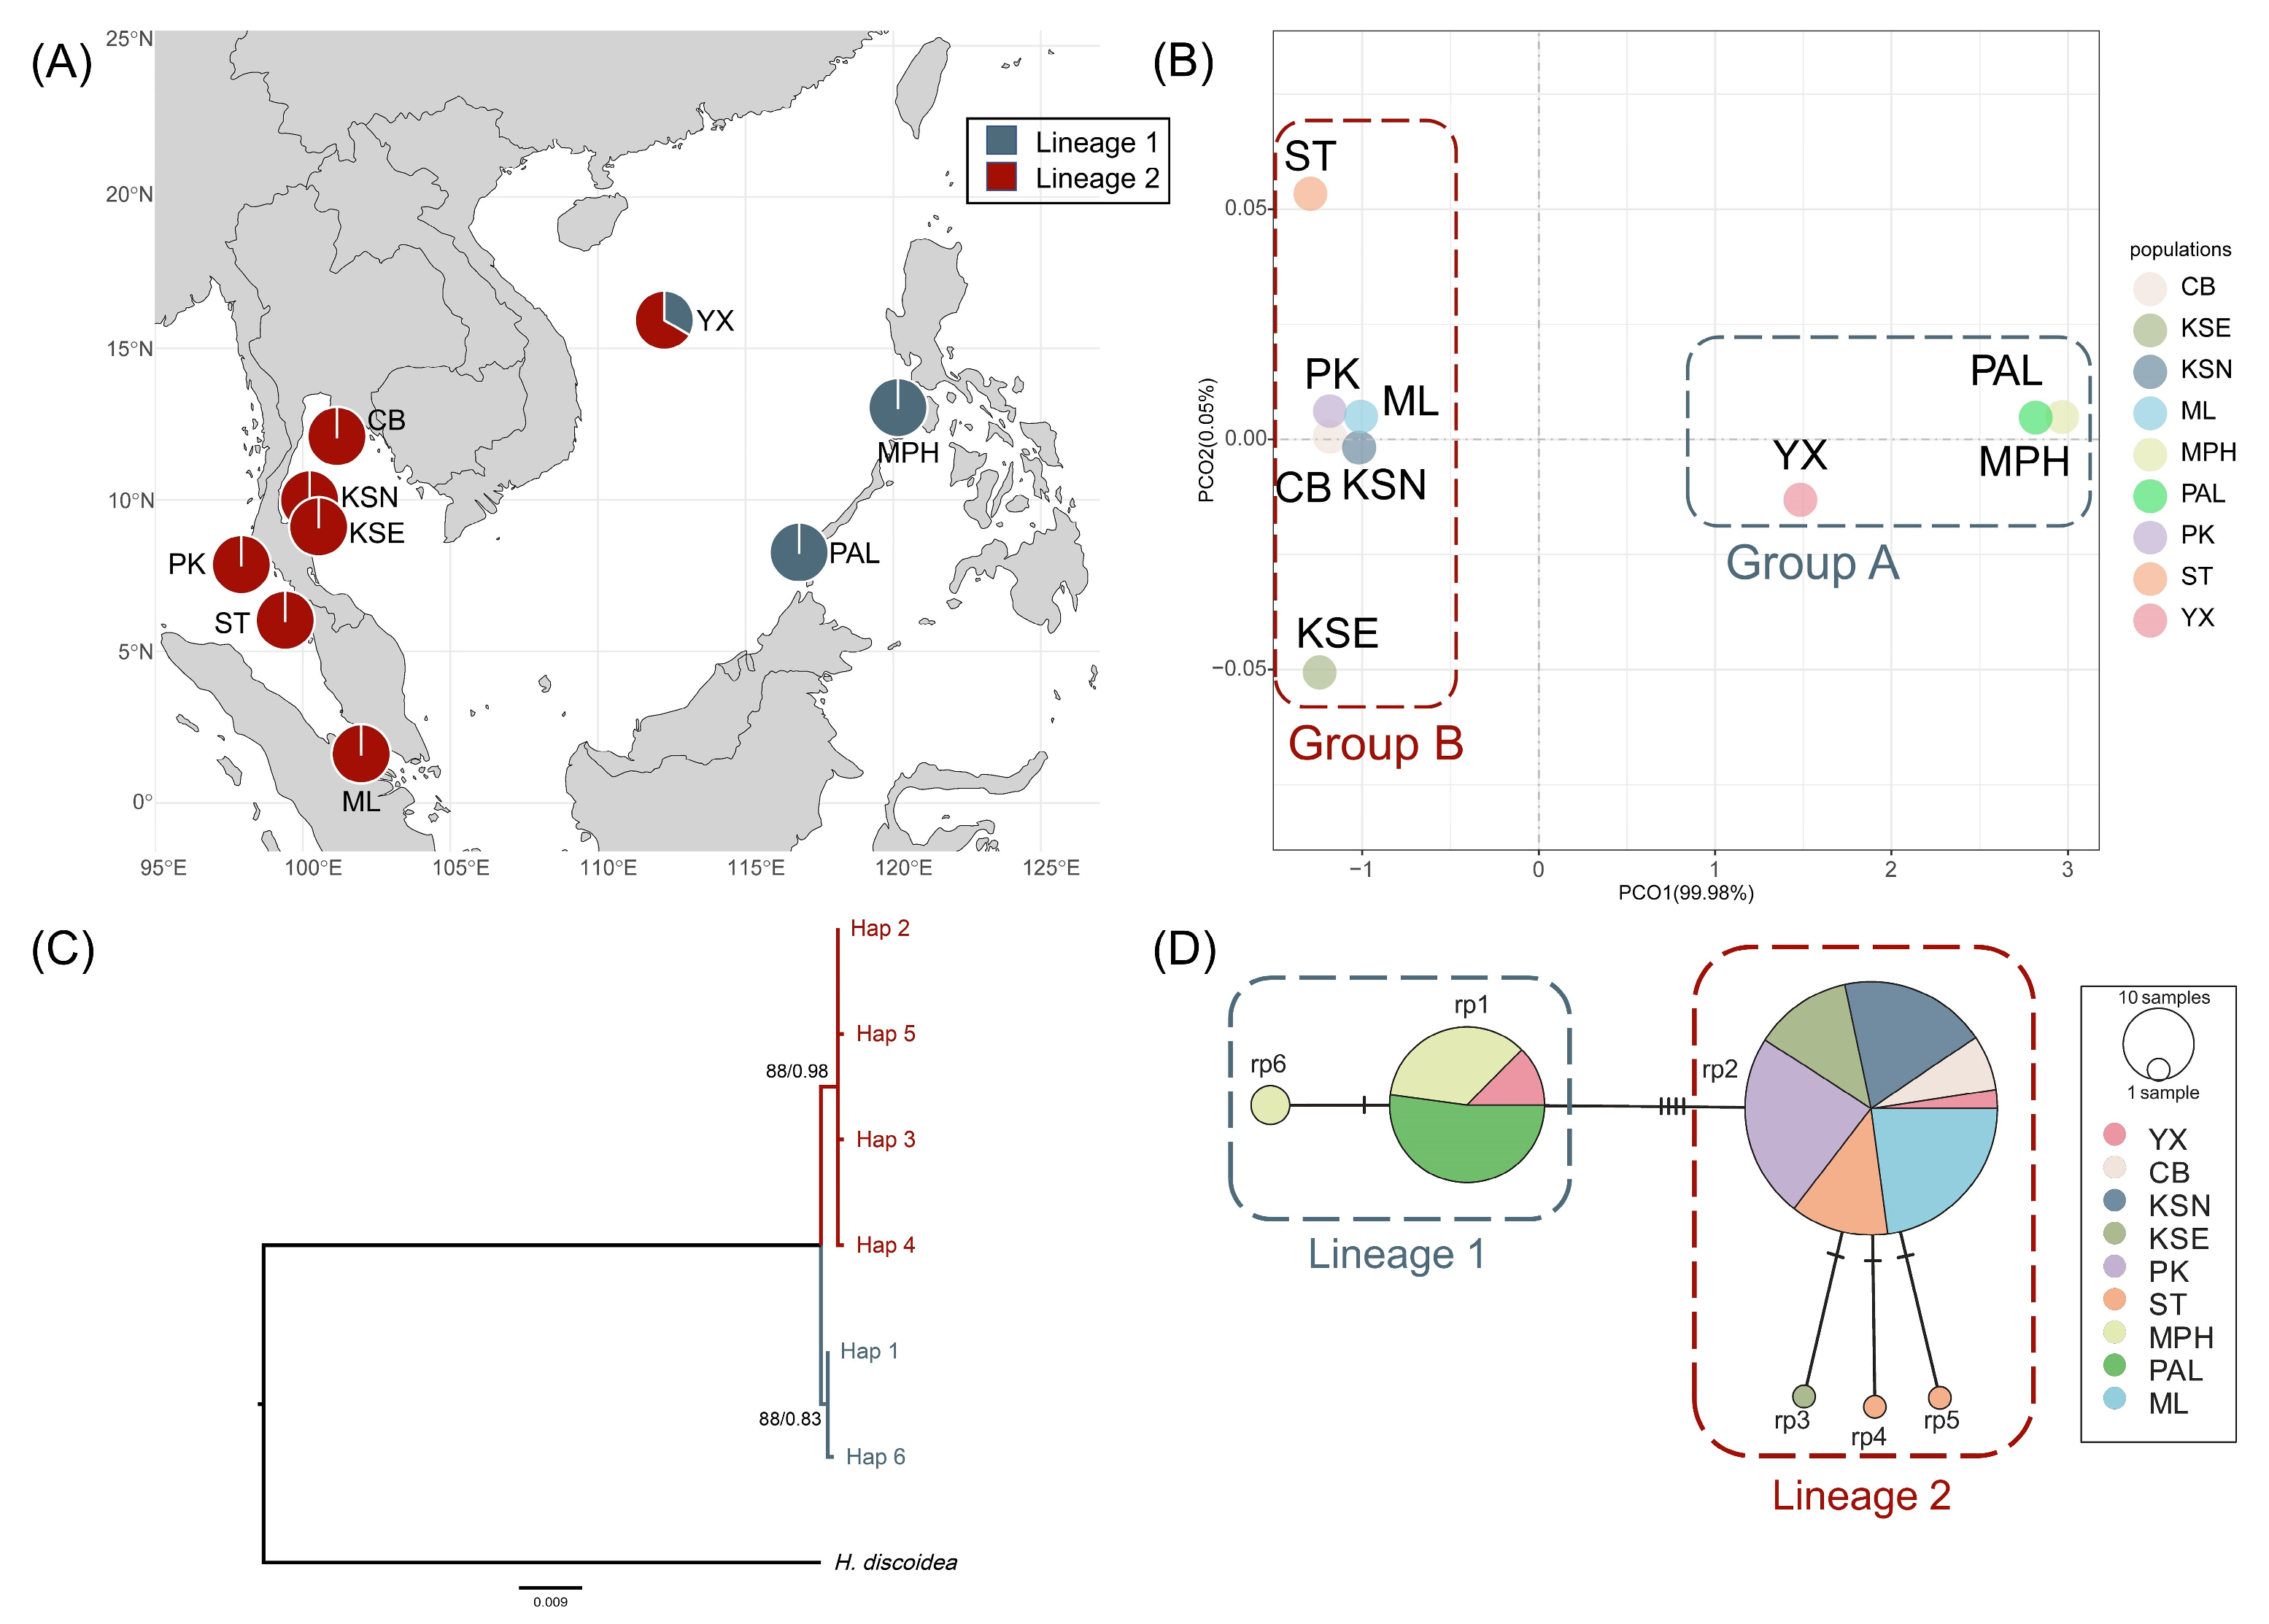
In rps3-rpl14, concordant patterns were observed across the population genetic structure, phylogenetic relationship, and the haplotype network, which indicated two genetic clusters at the intraspecific level (Figure 2). Group A occurred in Chinese and Philippine populations (YX, MPH, and PAL), and group B covered the entire Thai–Malay Peninsula and the northern South China Sea (Figure 2).
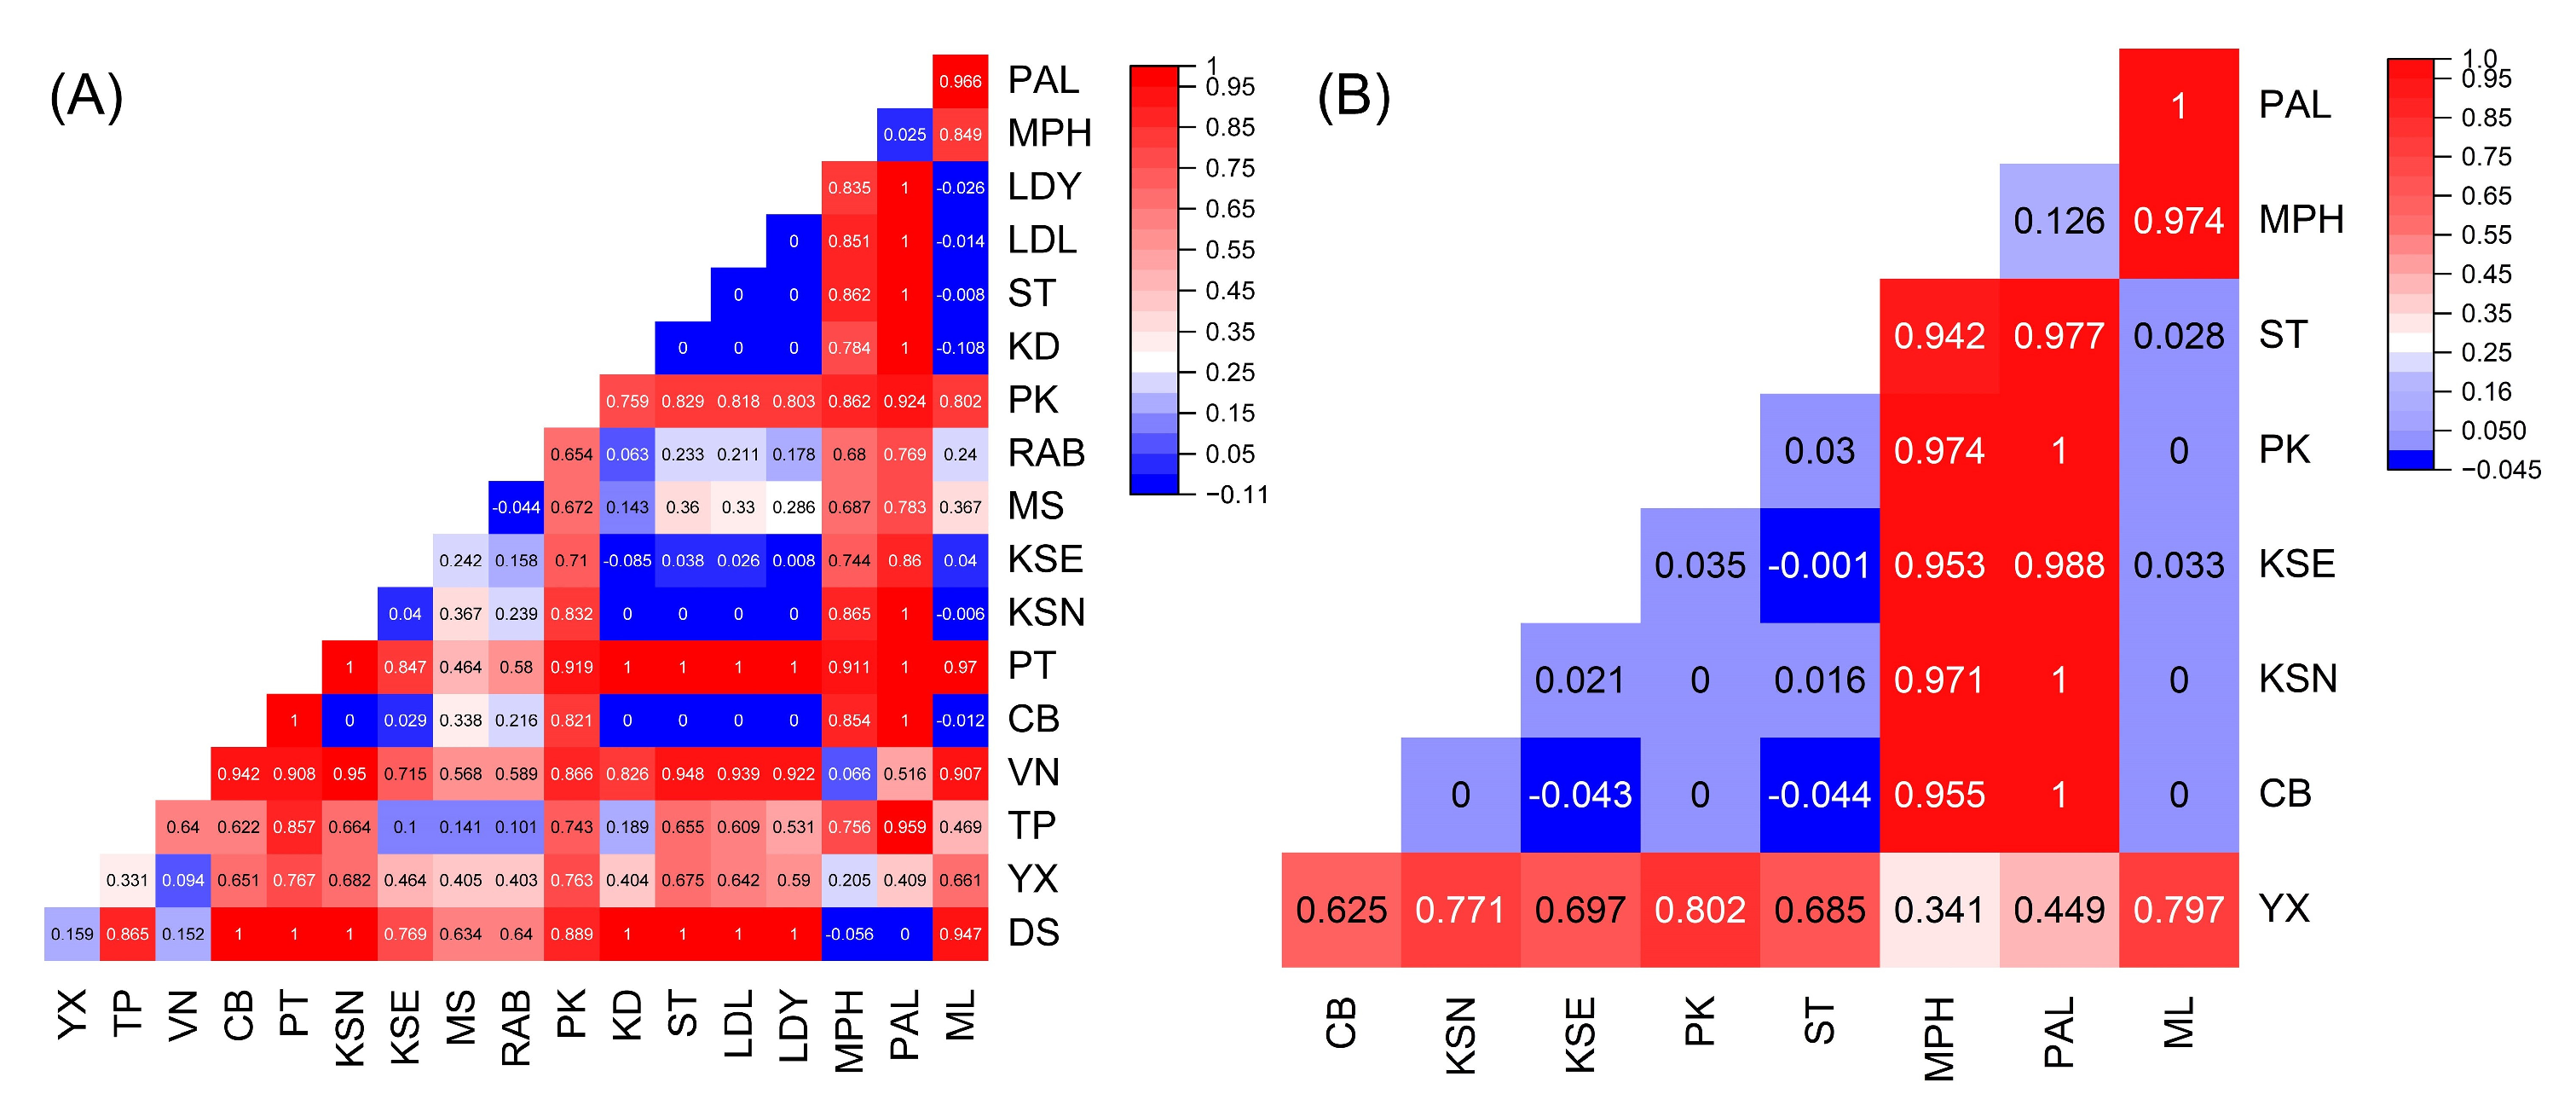
In order to examine the genetic differentiation of H. macroloba, we conducted analysis of molecular variance (AMOVA) and analysis of the pairwise fixation index (Fst) both on tufA and rps3-rpl14. The AMOVA results showed that the genetic differentiation mainly occurred among genetic groups and within populations (Table S2). The pairwise Fst of tufA suggested that most populations had obvious genetic differentiation, and in particular, the differentiations between populations belonging to different genetic groups were more significant (Figure 3A). The pairwise Fst of rps3-rpl14 showed consistency with the genetic structure, indicating that significant genetic differentiation was observed between populations in the South China Sea (group A) and populations along the Thai–Malay Peninsula (group B), whereas no considerable differentiation was detected among populations within the same group (Figure 3B).

2.2. Demographical Population History

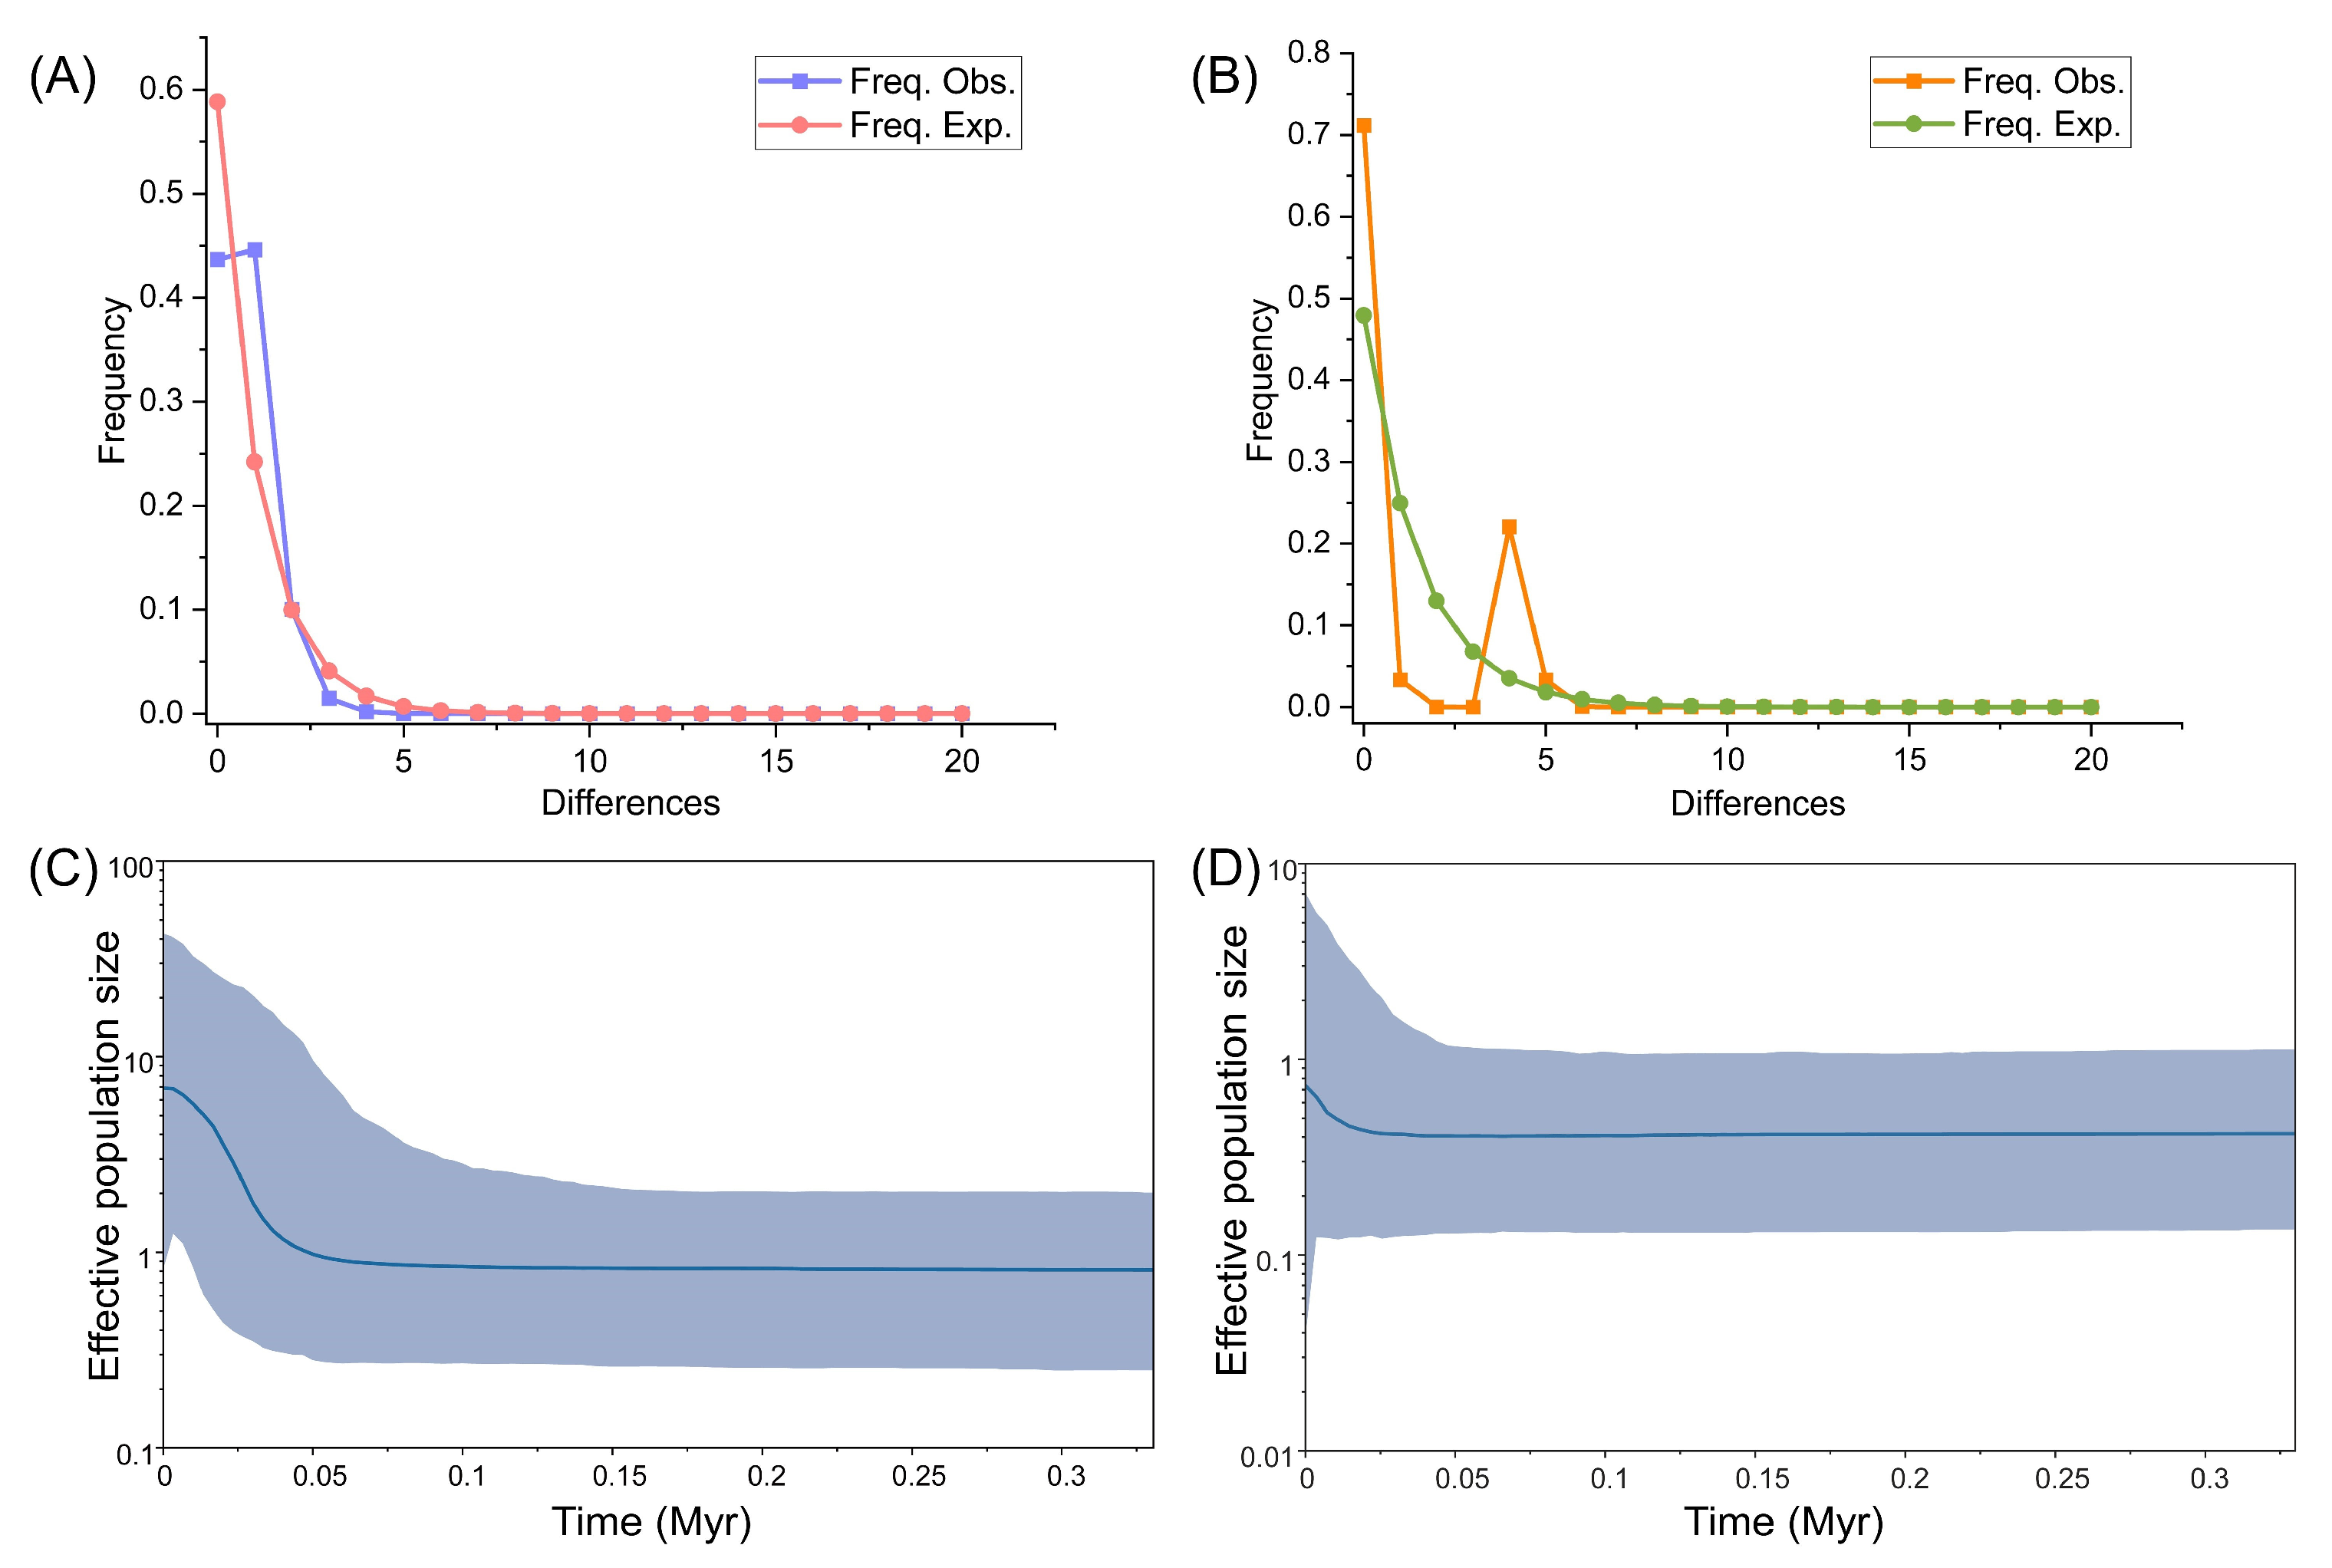
With the timeframe proposed by Verbruggen et al. (2009) [23], the Halimeda genus diverged at about 144 Myr before present. Therefore, we calibrated that the molecular clock of tufA and rps3-rpl14 as 0.093–0.095%/Myr and 0.108–0.11%/Myr, respectively. Mismatch analysis showed unimodal distribution patterns based on tufA and rps3-rpl14, which supported the recent demographical expansion model (Figure 4A,B). Furthermore, in Bayesian skyline plot (BSP) analyses, the intraspecific dynamics initiated approximately 0.363 Myr ago both in tufA and rps3-rpl14 (Figure 4C,D). Corresponding to the results of mismatch analysis, demographic expansions were detected in both markers. In tufA, we found significant expansion from 0.05 Myr ago (Figure 4C); in rps3-rpl14, we found that H. macroloba remained stable during a long period and then expanded slightly from about 0.025 Myr ago (Figure 4D). In addition, we conducted a neutral test (Tajima’s D and Fu’s Fs) of tufA and rps3-rpl14 at the population level. Although the p value of most results was not significant, we found potential expansion in some populations (KSE, ST, MPH, and ML) and potential contraction in several others (YX, MS, RAB, and PK) (Table S3).

2.3. Population Gene Flow

We used the tufA dataset to infer the population gene flow (Nm) due to more extensive geographical populations than rps3-rpl14 dataset. The Bayesian migration analysis inferred from tufA revealed asymmetric gene flow among eight sub-units in the Indo-Pacific region (Figure 5). On the one hand, we found a high level of genetic exchange in the vast South China Sea region, including three Chinese populations (1, 2, and 3), Vietnamese populations (4), and Philippine populations (7). Strong bidirectional gene flow was detected among Chinese and Vietnamese units, and the greatest gene flow was found from the Dongsha Islands to the Xisha Islands (1 → 2: Nm = 198.85). However, all the gene flows from the Philippine unit to other units were extremely low. On the other hand, asymmetric gene flow occurred between the populations in the South China Sea region and the populations in the Gulf of Thailand (5), the Andaman Sea (6), and the Malacca Strait (8). Southwestward gene flow from Vietnam (4) to the Gulf of Thailand (5) was significantly higher than that in the opposite direction (4 → 5: Nm = 23.23; 5 → 4: Nm = 7.15) (Figure 5). Meanwhile, gene flow from Vietnam (4) to the Malacca Strait (8) was also fractionally higher than that in the opposite direction (4 → 8: Nm = 24.41; 8 → 4: Nm = 20.78) (Figure 5). Similarly, the southwestward genetic exchange from the Gulf of Thailand to the Andaman Sea was obviously higher than that in the opposite direction (5 → 6: Nm = 7.13; 6 → 5: Nm = 0.37). Notably, we found high genetic exchange from the Malacca Strait (8) to the Andaman Sea (6) and the Gulf of Thailand (5) (Figure 5).

3. Discussion

3.1. Genetic Connectivity Derived by Ocean Currents

Genetic diversity serves as a fundamental pillar for ecosystem resilience, facilitating species adaptation to environmental changes, and underpinning nature’s essential contributions to humanity [24,25]. Among marine organisms, population connectivity has a significant impact on the differentiation and population genetic structure [26]. Ocean currents can facilitate gene flow between populations to promote genetic homogeneity; conversely, they can also lead to increased genetic differentiation among populations as physical barriers [27,28,29]. Based on the three chloroplast molecular datasets, a pattern of low genetic diversity and high homogeneity within H. macroloba was displayed generally (Figure 5, Table S1). Meanwhile, we discovered a shallow population genetic structure and strong gene flow at the intraspecific level (Figure 1, Figure 2, and Figure 5), which was contrary to the general notion that Halimeda species had limited dispersal [10,22]. The species exhibiting high fecundity and dispersal capabilities usually lack significant spatial genetic structure [30]. Although mature Halimeda thalli are unlikely to be long-distance travellers due to the characteristic of strong calcification and rapid sinking as sediment [31], previous research has proposed that the propagules and the juvenile uncalcified thalli might act as the main force of dispersal [32]. Therefore, the phylogeographical pattern of H. macroloba was likely caused by the influence of ocean currents in the Indo-Pacific region.
Our integrated results suggested that the gene flow directionality corresponded to the southwestward ocean currents in the Indo-Pacific region. In the northern and central parts of the South China Sea, the bidirectional gene flow was strong between populations (1, 2, 3, and 4), and there was little gene flow from the eastern coast of the South China Sea to the northern or central South China Sea (Figure 5). Meanwhile, the gene flow from the populations of the South China Sea to populations of the Gulf of Thailand and the Andaman Sea exhibited a significant southwestward pattern (Figure 5). Such a genetic connectivity pattern might be mediated by the southwest surface currents in this region. Affected by the seasonal monsoon climate in the Indo-Pacific region, the ocean current system was complicated and intense, characterized by opposite flow directions in winter and summer; the surface circulation in winter flows mainly from northeast to southwest, which could facilitate the genetic exchange at the intraspecific level [33]. During the winter monsoon period, the South China Sea throughflow (SCSTF) enters the South China Sea through the Luzon Strait and flows westward and southward along the northern boundary of the South China Sea, while the current on the eastern side is weaker; meanwhile, a branch from the northwestern direction flows southeastward into the Mindoro Strait [34]. This might explain the strong gene flows toward the southwest from the populations of the South China Sea to the populations of the Thai–Malay Peninsula and reveal the reason why the gene flow from the eastern edge of the South China Sea to the central and northern regions was weaker. Additionally, the strong bidirectional gene flow in the northern and western South China Sea might result from the comprehensive influence of ocean surface circulations changing direction throughout the year and stepping stones provided by numerous islands [35,36].
Remarkably, we found obvious gene flow toward the north along the coast of the Malacca Strait (Figure 5). This might be related to the hydrological conditions of the Malacca Strait during the winter monsoon as well. Located within the equatorial doldrums, the current of the Malacca Strait is influenced by the equatorial low-pressure zone and the topography of the coastline, and due to the impact of the winter monsoon, the winter surface current in the Malacca Strait generally moves from the southeast to the northwest towards the Andaman Sea (flowing from areas of higher to lower water volume) [37], which corresponds to the stronger northward gene flow from units 8 to 6 (Figure 5).
Similar conditions were documented in other seaweed species and adjacent seas. For Sargassum species, which are widespread with a high capability of dispersal (with air vesicles providing buoyancy), the ocean currents also played a dominant role in their genetic structure [38,39]; furthermore, the southwestern current in the Indo-Pacific region might act as a critical factor affecting their dispersal and colonization [40,41]. Our results demonstrated the importance of ocean currents in shaping the genetic connectivity of marine plants. Nevertheless, many studies have illustrated that the seaweeds in the Indo-Pacific region hold rich genetic diversity and a highly divergent structure, implying limited genetic exchange between different populations [42,43]; some research has indicated that genetic differentiation might arise from the topographical isolation and hydrological barrier of Thai–Malay Peninsula [44,45]. Therefore, extensive sample collection and further integrated studies are needed to shed light on the theory of seaweed genetic connectivity here.

3.2. Intraspecific Phylogeographical Pattern of H. macroloba

Based on the three chloroplast molecular datasets, the molecular diversity within H. macroloba displayed a pattern of low haplotype diversity and low nucleotide diversity (Table S1). However, we discovered more genetic variations in the tufA dataset than rps3-rpl14, indicating that the tufA gene marker might have a higher resolution in population genetic research and retain more historical relics in the evolutionary process. This result was in contrast to the findings of a previous study of Mediterranean H. tuna that more genetic variation was documented in rps2-rpl14 than tufA [22]. This might be connected with the fact that the integrated data of tufA in this study were more extensive than the rps3-rpl14 data. Meanwhile, we might obtain less genetic variation in the rps3-rpl14 dataset because of the shorter length of sequencing. Five genetic groups and six subdivided genetic lineages were found in tufA (Figure 1B,C), and four lineages were located around the Xisha Islands (YX) in southern China (Figure 1A). Also, in rps3-rpl14, the YX population was composed of haplotypes containing both genetic lineages (Figure 2A). Moreover, the YX population displayed the highest haplotype diversity in this study (Table S1). The populations in glacial refugia usually retained higher genetic diversity and particular haplotypes than recolonized populations [46]. Hence, we hypothesized that the Xisha Islands might serve as a potential historical refugium for H. macroloba, which highlights the value of extra conservation and management here. But due to the limited sample size of this population, the reliability of the hypothesis still needs further study to be confirmed. In previous studies of other marine organisms, the Xisha Islands were regarded as a transfer station for genetic exchange rather than a diversity centre [47]. It is necessary to enlarge the collection range and quantity to ensure the accuracy of research results.
In addition, a previous study revealed that Halimeda species primarily reproduce asexually in their natural environment, and the abundant biomass on coral reefs is partially due to the ability of this genus to propagate asexually via vegetative fragmentation [31]. Thus, we assumed that the notably low genetic diversity of H. macroloba in the Indo-Pacific region may be associated with asexual reproduction (Table S1), and the separate genetic cluster in Phuket (PK) and Pi-Tak Island (PT) in Thailand might be the consequence of a local enrichment of one unique haplotype by vegetative fragmentation (Figure 1B).
Furthermore, the low genetic diversity and simple phylogeographical pattern could be correlated with historical vicariance caused by paleoclimate changes. Despite the lack of deep divergence, we still found genetic structures in different datasets (Figure 1 and Figure 2). Recent rapid expansion might lead to the simplification of genetic structure. The star-like haplotype network and unimodal distribution in mismatch together supported the population expansion, and the BSP directly showed the obvious expansion occurred during the Pleistocene (Figure 1D, Figure 2D and Figure 4). So, the present genetic structure may also be related to the historical demographical dynamics in the Pleistocene. Based on the BSP results, the divergence of this species in the Indo-Pacific region originated 0.363 Myr ago and then underwent expansion from 0.05 Myr to 0.025 Myr before present (Figure 4C,D), which occurred during the last glacial period in the Pleistocene. During this period, the extremely global cooling and ice sheet extension led to a significant drop in sea levels and large land exposure, resulting in the emergence of Sundaland and a reduction in the South China Sea, which became an inland sea only connected to the Pacific by the Bashi Strait during the Last Glacial Maximum [48,49,50]. Therefore, the division of dominant genetic lineages among the populations of the South China Sea and the Thai–Malay Peninsula (lineages 1 and 5 in tufA, lineage 1 and 2 in rps3-rpl14) (Figure 1 and Figure 2) might arise from the long-term geographical isolation caused by the glacial climate oscillation, which resembled the cases that occurred in other Halimeda species. For example, Verbruggen et al. (2005) proposed that the distribution pattern of H. cuneata could be explained using the global cooling and isolation in the Plio-Pleistocene [51]; Rindi et al. (2020) represented a genetic break in H. tuna between the eastern and western Mediterranean Sea caused by the Pleistocene glaciation [22]; Zhang et al. (2024) discovered that the polyploidization timing of H. opuntia coincided with that of the sea level drop in the Pliocene [11]. Furthermore, we found respective unique lineages on east and west side of the Thai–Malay Peninsula (lineages 2 and 3 in tufA) (Figure 1A), just like previous finding in other seaweeds [15,44,52]. The heterogeneity could also be attributed to the regional isolation by topography and historical isolation. This suggested that the ancestor of H. macroloba underwent a complex historical process during the last glacial period during the Pleistocene, and the current genetic structure may be the consequence of historical isolation and subsequent genetic mixture through sea level fluctuation [53,54,55]. These findings hinted at the necessity of considering the historical climate and geological events in research on seaweed genetic diversity distribution and evolutionary patterns.

3.3. Conservation and Management

The low genetic diversity and simple population genetic structure underscored the importance of genetic diversity protection of H. macroloba. We propose establishing two management units (MUs) in the South China Sea basin and the Thai–Malay Peninsula for separate conservation [56]. Moreover, given the higher haplotype diversity, probable population contraction risk, and potential glacial refugium of the Xisha population in China (Figure 1A, Tables S1 and S3), we suggest more attention should be paid to the management of seaweed source conservation in the Xisha Islands. Additionally, in view of variant genetic lineages on both sides of the Thai–Malay Peninsula, we recommend that separate management strategies should be considered for marine conservation.

4. Materials and Methods

4.1. Sample Collection, DNA Extraction, and Amplification

From 2019 to 2025, we collected H. macroloba samples in the Indo-Pacific convergence region along the coast of China, Thailand, Malaysia, and the Philippines (Table S1). Total genomic DNA was extracted using the Hi-DNAsecure Plant Kit (TIANGEN, Beijing, China, DP350-03) following the manufacturer’s instructions, and the quality was checked using 0.7% agarose gel electrophoresis and the OD260/OD280 ratio.
The chloroplast-encoded tufA, rps3-rpl14, and rbcL were amplified as molecular markers. For tufA, the amplification was carried out using the primer pairs tufA-F (5′-TGAAACAGAAMAWCGTCATTATGC-3′) and tufA-R (5′-CCTTCNCGAATMGCRAAWCGC-3′) [57] and the PCR procedures described in Cremen et al. (2016) [58]. For rps3-rpl14, the amplification was carried out with the primers rps3F (5′-ACACAACCGCATTTATCACA-3′) and rpl14R (5′-CAGCAACATTWACAYAACTTTCAG-3′) using the PCR procedures described in Rindi et al. (2020) [22]. For rbcL, the amplification was carried out with the primers U1-1 and U3-2 [59], and the PCR procedures were performed according to the procedures described by Curtis et al. (2008) [60]. The PCR products were checked in 1% agarose gel electrophoresis. Purification and sequencing of PCR products were performed using a BigDye Terminator Cycle sequencing kit and an ABI3730 automated sequencer (Applied Bio-systems, Foster City, CA, USA).

4.2. Molecular Diversity and Phylogenetic Relationship

To enlarge the sample size and geographical scale of the research, we integrated the newly discovered sequences in this study and published sequences available in GenBank and other studies (Table S4). The obtained sequence datasets were aligned with the MUSCLE model in MEGA X [61]. After manual adjusting for false or missing gaps, we computed the haplotype diversity, nucleotide diversity, variable sites, and parsimony informative sites for all populations in Arlequin 3.5.2.2 [62].
After testing the optimal substitution model of each dataset based on the Corrected Akaike Information Criterion (AICc) in jModelTest 2.1.7 [63], we reconstructed the phylogenetic relationships of each dataset based on maximum likelihood (ML) and Bayesian inference (BI). Phylogenetic ML trees were constructed based on 1,000 bootstrap replicates using a nearest-neighbour interchange heuristic method in PhyML 3.1 [64]. The BI trees were constructed based on 10,000,000 MCMC iteration chains, with the first 2,500,000 chains discarded as ‘burn-in’ in Beast 2.7.5 [65]. The convergence of the output tree dataset was checked in Tracer 1.7.1 [66] when the effective sample sizes (ESSs) > 200. The condensed tree was summarized in TreeAnnotator in Beast 2.7.5 with a 25% ‘burn-in’. The sequences of congeneric species H. discoidea, H. heteromorpha, H. kanaloana, H. taenicola, and H. tuna were selected as outgroups (Table S4). All trees were visualized using FigTree 1.4.4 (http://tree.bio.ed.ac.uk/software/Figtree/ accessed on 15 October 2024).

4.3. Population Genetic Structure and Differentiation

We estimated the population pairwise differentiation (Fst) with 1000 permutations in Arlequin. The genealogic network diagrams based on the haplotypes of each dataset were drawn using the median-joining algorithm in POPART [67].
The population genetic structure of each dataset was detected using principal component analysis (PCoA) based on the population pairwise genetic distances in GenAlex 6.5.2.2 [68]. In addition, analysis of molecular variance (AMOVA) was conducted to explore the genetic differentiation of subdivisions based on the result of population genetic structure.

4.4. Divergence Time and Demographic History

We conducted the mismatch analysis using tufA and rps3-rpl14 datasets in DnaSP v5.0 [69] to assess the historical population dynamics. We executed the neutral tests (Tajima’s D and Fu’s Fs) of each population in Arlequin 3.5.2.2. We calibrated the molecular clock of H. macroloba using the timeframe proposed by Verbruggen et al. (2009) [23]. The divergence time of the Halimeda genus was estimated as 144 Myr ago, so we calculated the substitution rates of tufA and rps3-rpl14 based on the genetic divergence between haplotypes of Halimeda species (H. macroloba and H. discoidea).
Aiming to study the population demographic history, the coalescent Bayesian skyline plot (BSP) analysis was performed in Beast v2.7.5 based on tufA and rps3-rpl14. Molecular clocks of the two genes were chosen as relaxed clock log normal with calculated substitution rates. MCMC chains were set as 8 × 10⁸ iterations, followed by 2 × 10⁸ iterations discarded as burn-in, with sampling every 80,000 iterations.

4.5. Intraspecific Genetic Connectivity

In order to investigate the gene flow between populations, we estimated the migration rates and effective population size based on tufA datasets in Migrate-n 4.4.3 [70]. We delineated 8 sub-units corresponding to the geographical distributions and population genetic structure (Figure 5). The analysis was conducted based on four long chains and ten replicates with a 10,000 ‘burn-in’ and a total of 50,000 steps along with sampling per 100 steps. Heating was set with four temperatures (1.0, 1.5, 2.5, and 5.0) with a static scheme.

Supplementary Materials

The following supporting information can be downloaded at: https://www.mdpi.com/article/10.3390/plants14101497/s1. Table S1: Molecular diversity inferred from chloroplast tufA, rps3-rpl14, and rbcL of Halimeda macroloba in the Indo-Pacific region. Table S2: Analysis of molecular variance (AMOVA) based on tufA and rps3-rpl14. Table S3: Neutral test of Halimeda macroloba populations based on tufA and rps3-rpl14. Table S4: The tufA sequences retrieved in GenBank and other research utilized in this study.

Author Contributions

Conceptualization, D.D., J.Y., and X.S.; methodology, X.S., Y.L. (Yanshuo Liang), R.X., and D.D.; investigation, X.S., J.Y., M.Y.R., and Y.L. (Yude Lin); resources, J.Y., M.Y.R., Y.L. (Yude Lin), and S.M.C.G.; data curation, X.S., Y.L. (Yanshuo Liang), and Y.D.; writing—original draft, X.S.; writing—review and editing, D.D. and X.S.; visualization, X.S.; supervision, D.D.; project administration, D.D. and X.S.; funding acquisition, D.D. and X.S. All authors have read and agreed to the published version of the manuscript.

Funding

This research was supported by the Strategic Priority Research Program of the Chinese Academy of Sciences (XDB42030203), the Qingdao Postdoc Project (QDBSH20240102101), and the Thailand Research Fund (RDG6130002).

Data Availability Statement

The newly discovered tufA haplotypes of H. macroloba in this study are available in GenBank with the accession numbers PQ824573–PQ824582. The rps3-rpl14 haplotypes has been submitted to GenBank with a submission ID 2939450. The rbcL haplotypes have been submitted to GenBank with the submission ID 2939478. The newly discovered tufA sequences of H. discoidea in this study are available in GenBank with the accession numbers PV368846–PV368848.

Acknowledgments

We would like to thank the members of the Seagrass & Seaweed Research Unit of the Prince of Songkla University (Thailand) for their help with sampling, Eka S. Prasedya in University of Mataram (Indonesia) for help with H. discoidea collection, Supattra Pongparadon of the Prince of Songkla University (Thailand) for providing Thai tufA sequence information, and Stefano G. A. Draisma of the Prince of Songkla University (Thailand) for revision and polishing of the English writing of this manuscript.

Conflicts of Interest

The authors declare no conflicts of interest.

Abbreviations

The following abbreviations are used in this manuscript:
AICcAkaike Information Criterion
MLMaximum likelihood
BIBayesian inference
ESSEffective sample size
PCoAPrincipal component analysis
AMOVAAnalysis of molecular variance
FstFixation index
BSPBayesian skyline plot
HPDHighest posterior density
NmMigration rates
MyrMillion years
SCSTFSouth China Sea throughflow
MUManagement unit

References

  1. Jones, G.P.; Srinivasan, M.; Almany, G.R. Population connectivity and conservation of marine biodiversity. Oceanography 2007, 20, 100–111. [Google Scholar] [CrossRef]
  2. IUCN-WCPA. Guidelines for Conserving Connectivity Through Ecological Networks and Corridors. 2020. Available online: https://iucn.org/resources/publication/guidelines-conserving-connectivity-through-ecological-networks-and-corridors (accessed on 8 May 2024).
  3. Krosby, M.; Tewksbury, J.; Haddad, N.M.; Hoekstra, J. Ecological connectivity for a changing climate. Conserv. Biol. 2010, 24, 1686–1689. [Google Scholar] [CrossRef]
  4. Steele, J.H.; Brink, K.H.; Scott, B.E. Comparison of marine and terrestrial ecosystems: Suggestions of an evolutionary perspective influenced by environmental variation. ICES J. Mar. Sci. 2019, 76, 355. [Google Scholar] [CrossRef]
  5. Hughes, T.P.; Baird, A.H.; Bellwood, D.R.; Card, M.; Connolly, S.R.; Folke, C.; Grosberg, R.; Hoegh-Guldberg, O.; Jackson, J.B.C.; Kleypas, J.; et al. Climate change, human impacts, and the resilience of coral reefs. Science 2003, 301, 929–933. [Google Scholar] [CrossRef]
  6. Kemppainen, P.; van Nes, S.; Ceder, C.; Ceder, C.; Johannesson, K. Refuge function of marine algae complicates selection in an intertidal snail. Oecologia 2005, 143, 402–411. [Google Scholar] [CrossRef] [PubMed]
  7. Wefer, G. Carbonate production by algae Halimeda, Penicillus and Padina. Nature 1980, 285, 323–324. [Google Scholar] [CrossRef]
  8. Rees, S.A.; Opdyke, B.N.; Wilson, P.A.; Henstock, T.J. Significance of Halimeda bioherms to the global carbonate budget based on a geological sediment budget for the Northern Great Barrier Reef, Australia. Coral Reefs 2007, 26, 177–188. [Google Scholar] [CrossRef]
  9. Nelson, W.A. Calcified macroalgae—Critical to coastal ecosystems and vulnerable to change: A review. Mar. Freshw. Res. 2009, 60, 787–801. [Google Scholar] [CrossRef]
  10. Verbruggen, H.; Tyberghein, L.; Pauly, K.; Vlaeminck, C.; Nieuwenhuyze, K.V.; Kooistra, W.H.C.F.; Leliaert, F.; De Clerck, O. Macroecology meets macroevolution: Evolutionary niche dynamics in the seaweed Halimeda. Glob. Ecol. Biogeogr. 2009, 18, 393–405. [Google Scholar] [CrossRef]
  11. Zhang, H.; Wang, X.; Qu, M.; Yu, H.; Yin, J.; Liu, X.; Liu, Y.; Zhang, B.; Zhang, Y.; Wei, Z.; et al. Genome of Halimeda opuntia reveals differentiation of subgenomes and molecular bases of multinucleation and calcification in algae. Proc. Natl. Acad. Sci. USA 2024, 121, e2403222121. [Google Scholar] [CrossRef]
  12. Du, Y.; Wang, F.; Wang, T.Y.; Liu, W.W.; Liang, L.L.; Zhang, Y.; Chen, Y.F.; Liu, J.X.; Wu, W.; Yu, K.F.; et al. Multi-scale ocean dynamical processes in the Indo-Pacific Convergence Zone and their climatic and ecological effects. Earth Sci. Rev. 2023, 237, 104313. [Google Scholar] [CrossRef]
  13. Mayakun, J.; Prathep, A. Calcium carbonate productivity by Halimeda macroloba in the tropical intertidal ecosystem: The significant contributor to global carbonate budgets. Phycol. Res. 2019, 67, 94–101. [Google Scholar] [CrossRef]
  14. Stankovic, M.; Draisma, S.G.A.; Pongparadon, S.; Wichachucherd, B.; Noiraksar, T.; Hu, Z.M. Predicting macroalgal species distributions along the Thai-Malay Peninsula. Estuar. Coast. Shelf Sci. 2022, 267, 107760. [Google Scholar] [CrossRef]
  15. Pongparadon, S.; Zuccarello, G.C.; Phang, S.M.; Kawai, H.; Hanyuda, T.; Prathep, A. Diversity of Halimeda (Chlorophyta) from the Thai-Malay Peninsula. Phycologia 2015, 54, 349–366. [Google Scholar] [CrossRef]
  16. Nguyen, T.H.; Nguyen, N.N.T.; Nguyen, X.T.; Nguyen, X.V. Morphological variation and haplotype diversity of Halimeda macroloba and H. opuntia (Chlorophyta: Halimedaceae) from southern Vietnam. Vietnam J. Mar. Sci. Technol. 2022, 22, 165–176. [Google Scholar] [CrossRef]
  17. Garrick, R.C.; Bonatelli, I.A.; Hyseni, C.; Morales, A.; Pelletier, T.A.; Perez, M.F.; Rice, E.; Satler, J.D.; Symula, R.E.; Thomé, M.T.C.; et al. The evolution of phylogeographic data sets. Mol. Ecol. 2015, 24, 1164–1171. [Google Scholar] [CrossRef]
  18. Shaw, J.; Shafer, H.L.; Leonard, O.R.; Kovach, M.J.; Schorr, M.; Morris, A.B. Chloroplast DNA sequence utility for the lowest phylogenetic and phylogeographic inferences in angiosperms: The tortoise and the hare IV. Am. J. Bot. 2014, 101, 1987–2004. [Google Scholar] [CrossRef]
  19. Verbruggen, H.; Vlaeminck, C.; Sauvage, T.; Sherwood, A.R.; Leliaert, F.; De Clerck, O. Phylogenetic analysis of Pseudochlorodesmis strains reveals cryptic diversity above the family level in the Siphonous green algae (Bryopsidales, Chlorophyta). J. Phycol. 2009, 45, 726–731. [Google Scholar] [CrossRef]
  20. Dijoux, L.; Verbruggen, H.; Mattio, L.; Duong, N.; Payri, C. Diversity of Halimeda (Bryopsidales, Chlorophyta) in New Caledonia: A combined morphological and molecular study. J. Phycol. 2012, 48, 1465–1481. [Google Scholar] [CrossRef]
  21. Kojima, R.; Hanyuda, T.; Kawai, H. Taxonomic re-examination of Japanese Halimeda species using genetic markers, and proposal of a new species Halimeda ryukyuensis (Bryopsidales, Chlorophyta). Phycol. Res. 2015, 63, 178–188. [Google Scholar] [CrossRef]
  22. Rindi, F.; Pasella, M.M.; Lee, M.E.; Verbruggen, H. Phylogeography of the Mediterranean green seaweed Halimeda tuna (Ulvophyceae, Chlorophyta). J. Phycol. 2020, 56, 1109–1113. [Google Scholar] [CrossRef] [PubMed]
  23. Verbruggen, H.; Ashworth, M.; LoDuca, S.T.; Vlaeminck, C.; Cocquyt, E.; Sauvage, T.; Zechman, F.W.; Littler, D.S.; Littler, M.; Leliaert, F.; et al. A multi-locus time-calibrated phylogeny of the siphonous green algae. Mol. Phylogenet. Evol. 2009, 50, 642–653. [Google Scholar] [CrossRef]
  24. Des Roches, S.; Pendleton, L.H.; Shapiro, B.; Palkovacs, E.P. Conserving intraspecific variation for nature’s contributions to people. Nat. Ecol. Evol. 2021, 5, 574–582. [Google Scholar] [CrossRef]
  25. Legrand, T.; Fragkopoulou, E.; Vapillon, L.; Gouvêa, L.; Serrão, E.A.; Assis, J. Unravelling the role of oceanographic connectivity in the distribution of genetic diversity of marine forests at the global scale. Glob. Ecol. Biogeogr. 2024, 33, e13857. [Google Scholar] [CrossRef]
  26. White, C.; Selkoe, K.A.; Watson, J.; Siegel, D.A.; Zacherl, D.C.; Toonen, R.J. Ocean currents help explain population genetic structure. Proc. R. Soc. B Biol. Sci. 2010, 277, 1685–1694. [Google Scholar] [CrossRef] [PubMed]
  27. Cardona, L.; Hays, G.C. Ocean currents, individual movements and genetic structuring of populations. Mar. Biol. 2018, 165, 10. [Google Scholar] [CrossRef]
  28. Fontana, S.; Wang, W.L.; Tseng, K.Y.; Draisma, S.G.A.; Dumilag, R.V.; Hu, Z.M.; Li, J.J.; Lai, P.H.; Mattio, L.; Sherwood, A.R.; et al. Seaweed diversification driven by Taiwan’s emergence and the Kuroshio Current: Insights from the cryptic diversity and phylogeography of Dichotomaria (Galaxauraceae, Rhodophyta). Front. Ecol. Evol. 2024, 12, 1346199. [Google Scholar] [CrossRef]
  29. Peluso, L.; Faúndez, J.; Navarrete, S.A.; Broitman, B.R.; Aiken, C.M.; Saenz-Agudelo, P. Oceanographical-driven dispersal and environmental variation explain genetic structure in an upwelling coastal ecosystem. Sci. Rep. 2024, 14, 21942. [Google Scholar] [CrossRef]
  30. Gagnaire, P.A.; Broquet, T.; Aurelle, D.; Viard, F.; Souissi, A.; Bonhomme, F.; Arnaud-Haond, S.; Bierne, N. Using neutral, selected, and hitchhiker loci to assess connectivity of marine populations in the genomic era. Evol. Appl. 2015, 8, 769–786. [Google Scholar] [CrossRef]
  31. Walters, L.J.; Smith, C.M.; Coyer, J.A.; Hunter, C.L.; Beach, K.S.; Vroom, P.S. Asexual propagation in the coral reef macroalga Halimeda (Chlorophyta, Bryopsidales): Production, dispersal and attachment of small fragments. J. Exp. Mar. Biol. Ecol. 2002, 278, 47–65. [Google Scholar] [CrossRef]
  32. Kooistra, W.H.C.F.; Verbruggen, H. Genetic patterns in the calcified tropical seaweeds Halimeda opuntia, H. distorta, H. hederacea, and H. minima (BRYOPSIDALES, CHLOROPHYTA) provide insights in species boundaries and interoceanic dispersal. J. Phycol. 2005, 41, 177–187. [Google Scholar] [CrossRef]
  33. Hu, J.; Kawamura, H.; Hong, H.; Qi, Y. A Review on the Currents in the South China Sea: Seasonal Circulation, South China Sea Warm Current and Kuroshio Intrusion. J. Oceanogr. 2000, 56, 607–624. [Google Scholar] [CrossRef]
  34. Qu, T.; Song, Y.T.; Yamagata, T. An introduction to the South China Sea throughflow: Its dynamics, variability, and application for climate. Dyn. Atmos. Oceans 2009, 47, 3–14. [Google Scholar] [CrossRef]
  35. Gilpin, M.E. The role of stepping-stone islands. Theor. Popul. Biol. 1980, 17, 247–253. [Google Scholar] [CrossRef] [PubMed]
  36. Vlasova, G.A.; Demenok, M.N.; Xuan, N.B.; Long, B.H. The role of atmospheric circulation in spatial and temporal variations in the structure of currents in the western South China Sea. Izv. Atmos. Ocean. Phys. 2016, 52, 317–327. [Google Scholar] [CrossRef]
  37. Ibrahim, Z.Z.; Yanagi, T. The influence of the Andaman Sea and the South China Sea on water mass in the Malacca Strait. La Mer 2006, 43, 33–42. [Google Scholar]
  38. Chan, S.W.; Cheang, C.C.; Chirapart, A.; Gerung, G.; Tharith, C.; Ang, P. Homogeneous population of the brown alga Sargassum polycystum in Southeast Asia: Possible role of recent expansion and asexual propagation. PLoS ONE 2013, 8, e77662. [Google Scholar] [CrossRef] [PubMed]
  39. Li, J.J.; Hu, Z.M.; Gao, X.; Sun, Z.M.; Choi, H.G.; Duan, D.L.; Endo, H. Oceanic currents drove population genetic connectivity of the brown alga Sargassum thunbergii in the north-west Pacific. J. Biogeogr. 2017, 44, 230–242. [Google Scholar] [CrossRef]
  40. Liang, Y.S.; Zhang, S.S.; Yan, C.X.; Draisma, S.G.A.; Kantachumpoo, A.; Li, Z.; Lin, Y.D.; Zhu, J.; Zhang, J.; Duan, D.L. Influence of Indo-Pacific ocean currents on the distribution and demographic patterns of the brown seaweed Sargassum polycystum in tropical east Asia. Front. Mar. Sci. 2022, 9, 895554. [Google Scholar] [CrossRef]
  41. Lin, Y.D.; Zhang, J.; Du, Y.Q.; Zhang, S.S.; Liu, L.; Draisma, S.G.A.; Duan, D.L. Marine conditions in Andaman Sea shape the unique genetic structure of Sargassum plagiophyllum C. Agardh. J. Appl. Phycol. 2024, 36, 501–511. [Google Scholar] [CrossRef]
  42. Boo, G.H.; Leliaert, F.; Le Gall, L.; Coppejans, E.; De Clerck, O.; Nguyen, T.V.; Payri, C.E.; Miller, K.A.; Yoon, H.S. Ancient Tethyan vicariance and long-distance dispersal drive global diversification and cryptic speciation in the red seaweed Pterocladiella. Front. Plant Sci. 2022, 13, 849476. [Google Scholar] [CrossRef] [PubMed]
  43. Lagourgue, L.; Leliaert, F.; Payri, C.E. Historical biogeographical analysis of the Udoteaceae (Bryopsidales, Chlorophyta) elucidates origins of high species diversity in the Central Indo-Pacific, Western Indian Ocean and Greater Caribbean regions. Mol. Phylogenet. Evol. 2022, 169, 107412. [Google Scholar] [CrossRef] [PubMed]
  44. Wichachucherd, B.; Prathep, A.; Zuccarello, G.C. Phylogeography of Padina boryana (Dictyotales, Phaeophyceae) around the Thai-Malay Peninsula. Eur. J. Phycol. 2014, 49, 313–323. [Google Scholar] [CrossRef]
  45. Bulan, J.; Maneekat, S.; Zuccarello, G.C.; Muangmai, N. Phylogeographic patterns in cryptic species Bostrychia tenella (Rhodomelaceae, Rhodophyta) across the Thai-Malay Peninsula. Algae 2022, 37, 123–133. [Google Scholar] [CrossRef]
  46. Maggs, C.A.; Castilho, R.; Foltz, D.; Henzler, C.; Jolly, M.T.; Kelly, J.; Olsen, J.; Perez, K.E.; Stam, W.; Väinölä, R.; et al. Evaluating signatures of glacial refugia for north Atlantic benthic marine taxa. Ecology 2008, 89, S108–S122. [Google Scholar] [CrossRef] [PubMed]
  47. Huang, W.H.; Zhang, Z.X.; Zhong, J. The genetic structure and connectivity of eight fish species in the Indo-Pacific convergence region. J. Trop. Oceanogr. 2025, 44, 9–23, (In Chinese with English Abstract). [Google Scholar]
  48. Molengraaff, G. Modern deep-sea research in the East Indian Archipelago. Geogr. J. 1921, 57, 95–118. [Google Scholar] [CrossRef]
  49. Bird, M.I.; Taylor, D.; Hunt, C. Palaeoenvironments of insular Southeast Asia during the Last Glacial Period: A savanna corridor in Sundaland? Quat. Sci. Rev. 2005, 24, 2228–2242. [Google Scholar] [CrossRef]
  50. Wang, P.X. Response of western Pacific marginal seas to glacial cycles: Paleoceanographic and sedimentological features. Mar. Geol. 1999, 156, 5–39. [Google Scholar] [CrossRef]
  51. Verbruggen, H.; De Clerck, O.; Schils, T.; Kooistra, W.H.C.F.; Coppejans, E. Evolution and phylogeography of Halimeda section Halimeda (Bryopsidales, Chlorophyta). Mol. Phylogenet. Evol. 2005, 37, 789–803. [Google Scholar] [CrossRef]
  52. Saengkaew, J.; Muangmai, N.; Zuccarello, G.C. Cryptic diversity of the mangrove-associated alga Bostrychia (Rhodomelaceae, Rhodophyta) from Thailand. Bot. Mar. 2016, 59, 363–371. [Google Scholar] [CrossRef]
  53. Hewitt, G. The genetic legacy of the Quaternary ice ages. Nature 2000, 405, 907–913. [Google Scholar] [CrossRef]
  54. Hoarau, G.; Coyer, J.A.; Veldsink, J.H.; Stam, W.T.; Olsen, J.L. Glacial refugia and recolonization pathways in the brown seaweed. Mol. Ecol. 2007, 16, 3606–3616. [Google Scholar] [CrossRef]
  55. Hu, Z.M.; Kantachumpoo, A.; Liu, R.Y.; Sun, Z.M.; Yao, J.T.; Komatsu, T.; Uwai, S.; Duan, D.L. A late Pleistocene marine glacial refugium in the south-west of Hainan Island, China: Phylogeographical insights from the brown alga. J. Biogeogr. 2018, 45, 355–366. [Google Scholar] [CrossRef]
  56. Carpenter, K.E.; Barber, P.H.; Crandall, E.D.; Ablan-Lagman, C.A.; Ambariyanto; Mahardika, G.N.; Manjaji-Matsumoto, B.M.; Juinio-Meñez, M.A.; Santos, M.D.; Starger, C.J.; et al. Comparative phylogeography of the coral triangle and implications for marine management. J. Mar. Biol. 2011, 2011, 396982. [Google Scholar] [CrossRef]
  57. Famà, P.; Wysor, B.; Kooistra, W.H.C.F.; Zuccarello, G.C. Molecular phylogeny of the genus Caulerpa (Caulerpales, Chlorophyta) inferred from chloroplast tufA gene. J. Phycol. 2002, 38, 1040–1050. [Google Scholar] [CrossRef]
  58. Cremen, M.C.M.; Huisman, J.M.; Marcelino, V.R.; Verbruggen, H. Taxonomic revision of Halimeda (Bryopsidales, Chlorophyta) in south-western Australia. Aust. Syst. Bot. 2016, 29, 41–54. [Google Scholar] [CrossRef]
  59. Hanyuda, T.; Arai, S.; Ueda, K. Variability in the rbcL introns of Caulerpalean algae (Chlorophyta, Ulvophyceae). J. Plant Res. 2000, 113, 403–413. [Google Scholar] [CrossRef]
  60. Curtis, N.E.; Dawes, C.J.; Pierce, S.K. Phylogenetic analysis of the large subunit RUBISCO gene supports the exclusion of Avrainvillea and Cladocephalus from the Udoteaceae (Bryopsidales, Chlorophyta). J. Phycol. 2008, 44, 761–767. [Google Scholar] [CrossRef]
  61. Kumar, S.; Stecher, G.; Li, M.; Knyaz, C.; Tamura, K. MEGA X: Molecular evolutionary genetics analysis across computing platforms. Mol. Biol. Evol. 2018, 35, 1547–1549. [Google Scholar] [CrossRef]
  62. Excoffier, L.; Lischer, H.E.L. Arlequin suite ver 3.5: A new series of programs to perform population genetics analyses under Linux and Windows. Mol. Ecol. Resour. 2010, 10, 564–567. [Google Scholar] [CrossRef]
  63. Darriba, D.; Taboada, G.L.; Doallo, R.; Posada, D. jModelTest 2: More models, new heuristics and parallel computing. Nat. Methods 2012, 9, 772. [Google Scholar] [CrossRef] [PubMed]
  64. Guindon, S.; Gascuel, O. A simple, fast, and accurate algorithm to estimate large phylogenies by maximum likelihood. Syst. Biol. 2003, 52, 696–704. [Google Scholar] [CrossRef]
  65. Bouckaert, R.; Vaughan, T.G.; Barido-Sottani, J.; Duchene, S.; Fourment, M.; Gavryushkina, A.; Heled, J.; Jones, G.; Kuhnert, D.; De Maio, N.; et al. BEAST 2.5: An advanced software platform for Bayesian evolutionary analysis. PLoS Comput. Biol. 2019, 15, e1006650. [Google Scholar] [CrossRef]
  66. Rambaut, A.; Drummond, A.J.; Xie, D.; Baele, G.; Suchard, M.A. Posterior summarization in Bayesian phylogenetics using Tracer 1.7. Syst. Biol. 2018, 67, 901–904. [Google Scholar] [CrossRef]
  67. Leigh, J.W.; Bryant, D. POPART: Full-feature software for haplotype network construction. Methods Ecol. Evol. 2015, 6, 1110–1116. [Google Scholar] [CrossRef]
  68. Peakall, R.; Smouse, P.E. GenAlEx 6.5: Genetic analysis in Excel. Population genetic software for teaching and research-an update. Bioinformatics 2012, 28, 2537–2539. [Google Scholar] [CrossRef] [PubMed]
  69. Librado, P.; Rozas, J. DnaSP v5: A software for comprehensive analysis of DNA polymorphism data. Bioinformatics 2009, 25, 1451–1452. [Google Scholar] [CrossRef]
  70. Beerli, P.; Mashayekhi, S.; Sadeghi, M.; Khodaei, M.; Shaw, K. Population genetic inference with MIGRATE. Curr. Protoc. Bioinform. 2019, 68, e87. [Google Scholar] [CrossRef]
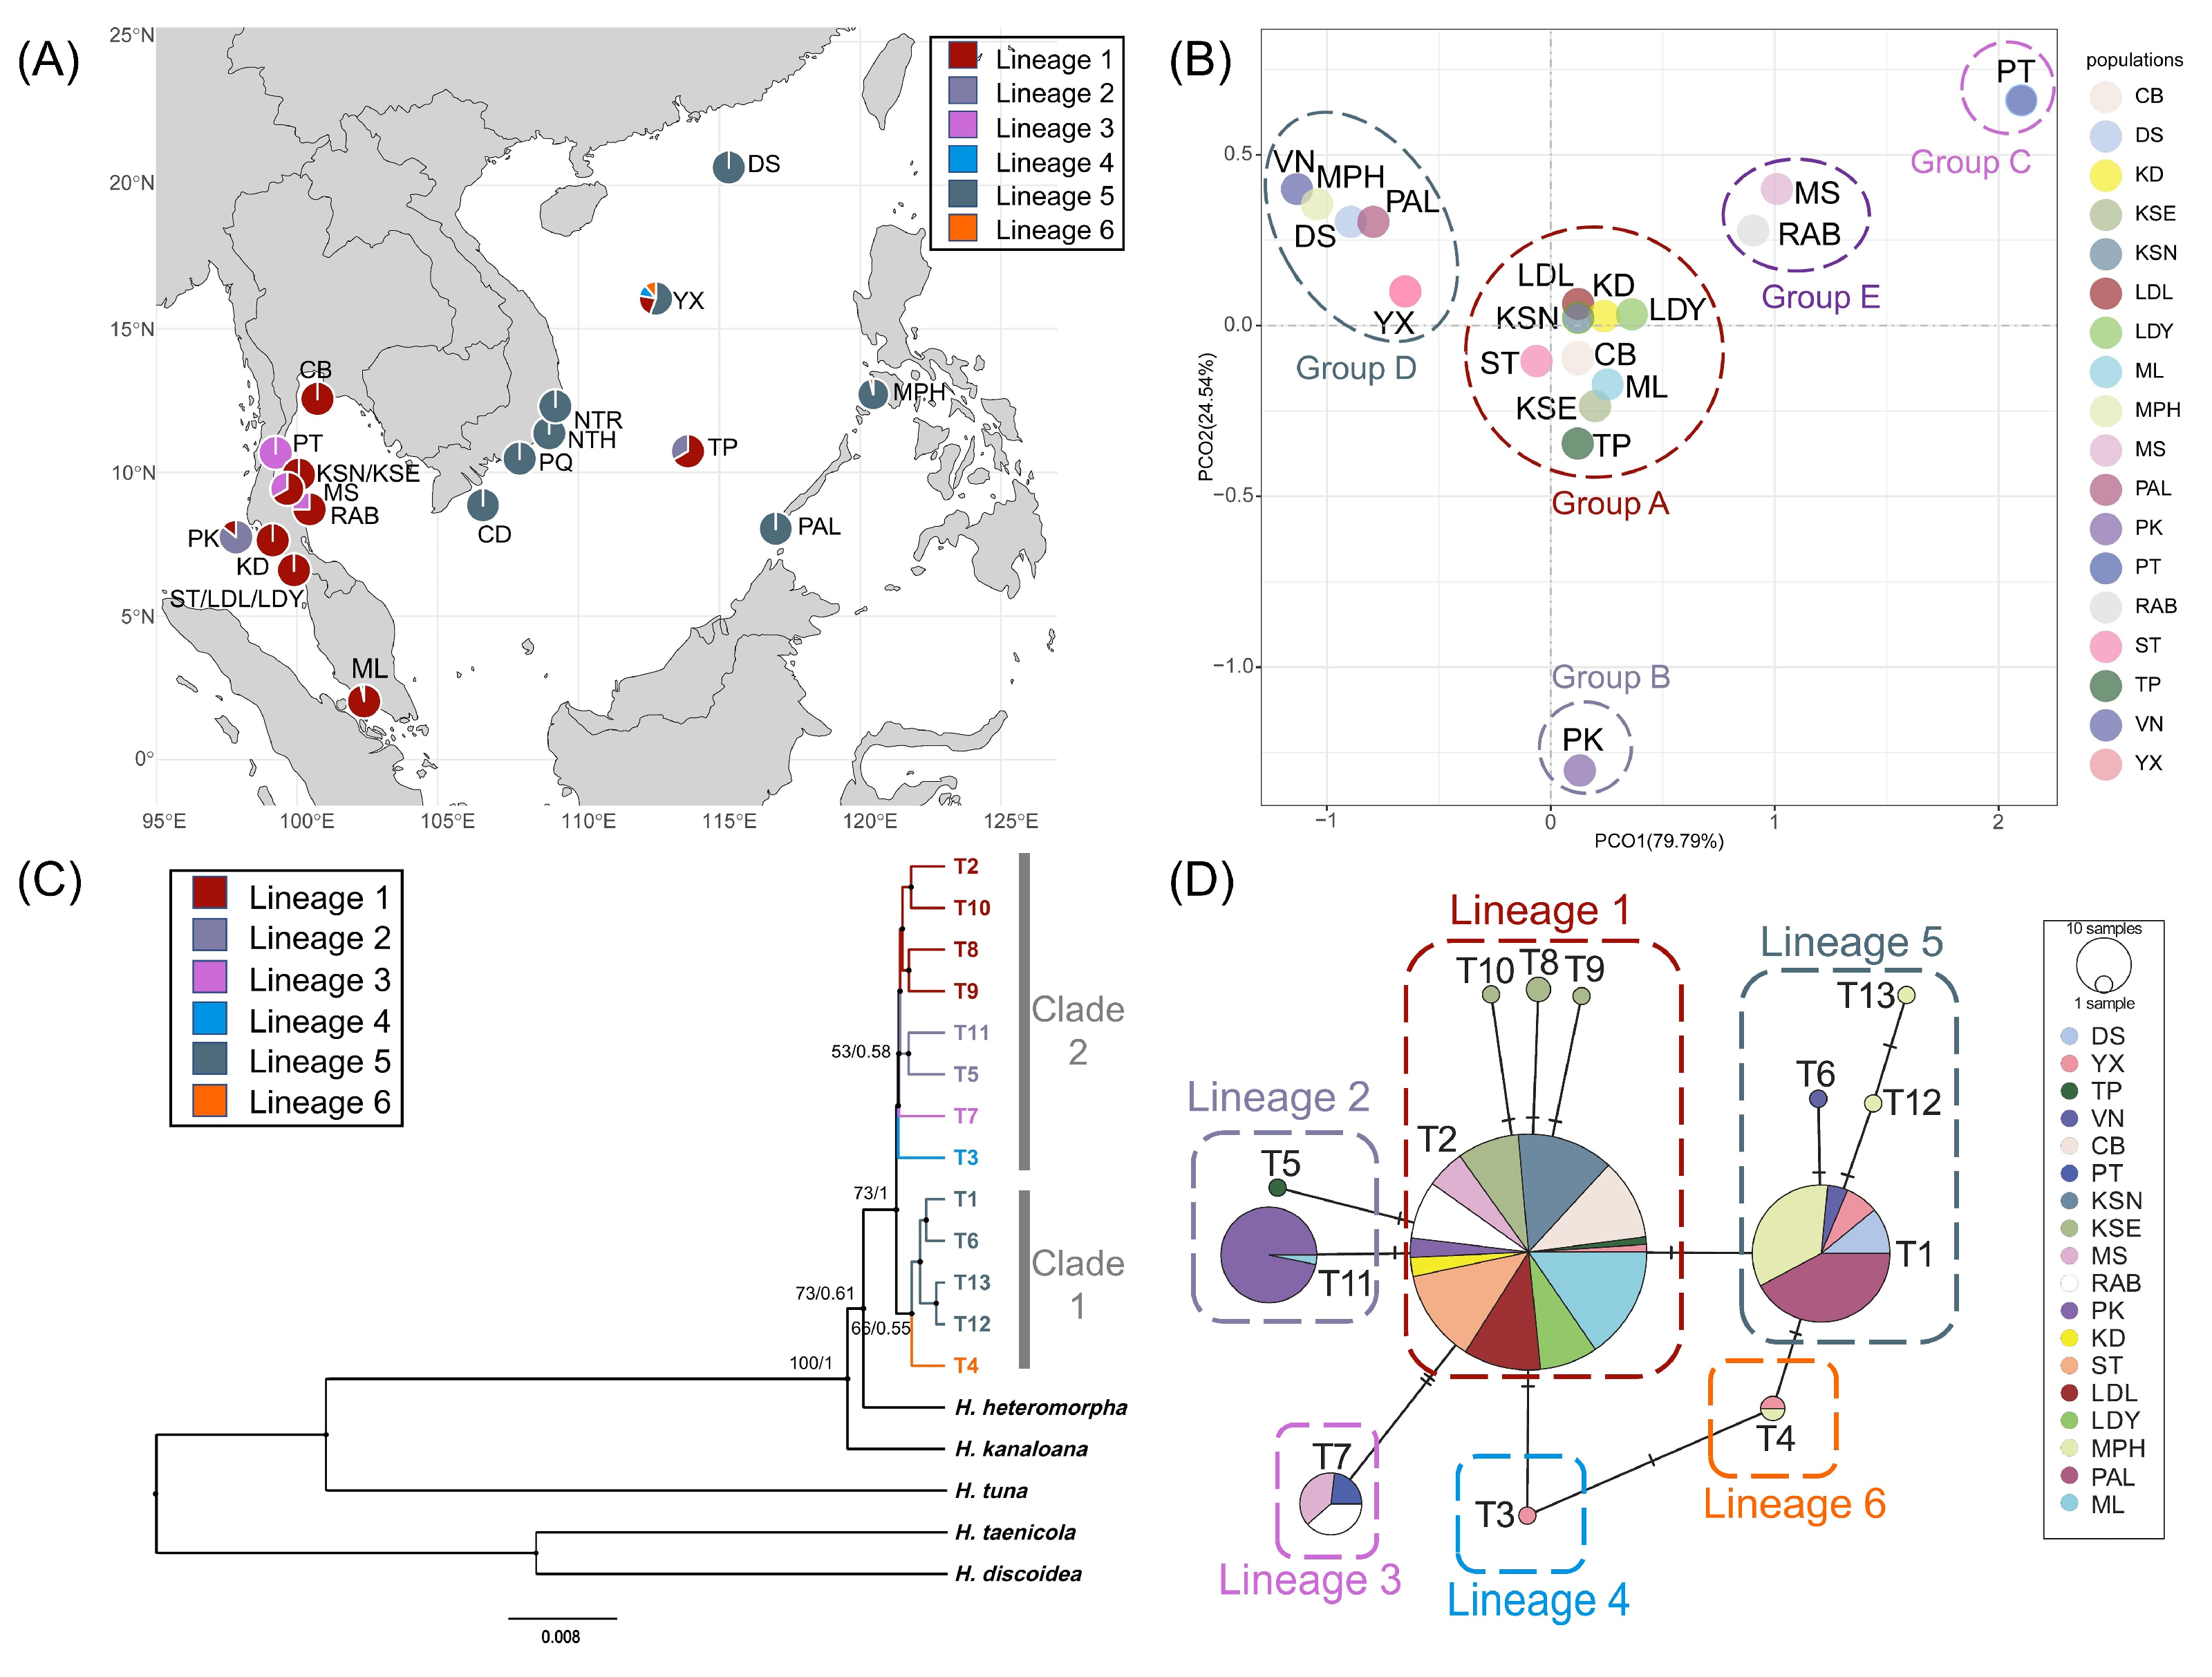
Figure 1. The phylogeographical structure of H. macroloba in tufA. (A) The geographical distribution of 6 lineages in the Indo-Pacific region. (B) Population genetic structure based on PCoA analysis. (C) Phylogenetic relationship of H. macroloba based on tufA haplotypes. Numbers above or near branches are Maximum likelihood bootstrap values (left)/Bayesian posterior probabilities (right). Values < 50% or <0.50 are not shown. (D) Median-joining network based on tufA haplotypes. The circle size represents the sample size. The number of bars on the connecting lines represents the genetic steps.
Plants 14 01497 g001
Figure 2. The phylogeographical structure of H. macroloba in rps3-rpl14. (A) The geographical distribution of 2 lineages in the Indo-Pacific region. (B) Population genetic structure based on PCoA analysis. (C) Phylogenetic relationship of H. macroloba based on rps3-rpl14 haplotypes. Numbers above or near branches are Maximum likelihood bootstrap values (left)/Bayesian posterior probabilities (right). Values < 50% or <0.50 are not shown. (D) Median-joining network based on rps3-rpl14 haplotypes. The circle size represents the sample size. The number of bars on the connecting lines represents the genetic steps.
Plants 14 01497 g002
Figure 3. Pairwise genetic differentiation (Fst) between populations based on tufA (A) and rps3-rpl14 (B). Values less than 0.25 were indicated in blue, and values greater than 0.25 were indicated in red.
Plants 14 01497 g003
Figure 4. Demographic dynamics of H. macroloba in tufA and rps3-rpl14. (A) Mismatch distribution of tufA. (B) Mismatch distribution of rps3-rpl14. (C) BSP results of tufA. The horizontal axis represents the time in the past in the unit of million years (Myr) ago, and the vertical axis represents the effective population size. The blue intervals represent the 95% highest posterior density (HPD). The blue curve represents the median value. (D) BSP results of rps3-rpl14. The horizontal axis represents the time in the past in the unit of million years (Myr) ago, and the vertical axis represents the effective population size. The blue intervals represent the 95% highest posterior density (HPD). The blue curve represents the median value.
Plants 14 01497 g004
Figure 5. Gene flow (Nm) between 8 sub-units based on tufA. Numbers above/below the arrows represent migration rates in the direction of the arrow. Arrow thickness was scaled according to the value.
Plants 14 01497 g005
Disclaimer/Publisher’s Note: The statements, opinions and data contained in all publications are solely those of the individual author(s) and contributor(s) and not of MDPI and/or the editor(s). MDPI and/or the editor(s) disclaim responsibility for any injury to people or property resulting from any ideas, methods, instructions or products referred to in the content.