
Estimation of Leaf Phosphorus Content in Cotton Using Fractional Order Differentially Optimized Spectral Indices

 , ,
, ,
Abstract
1. Introduction
2. Materials and Methods
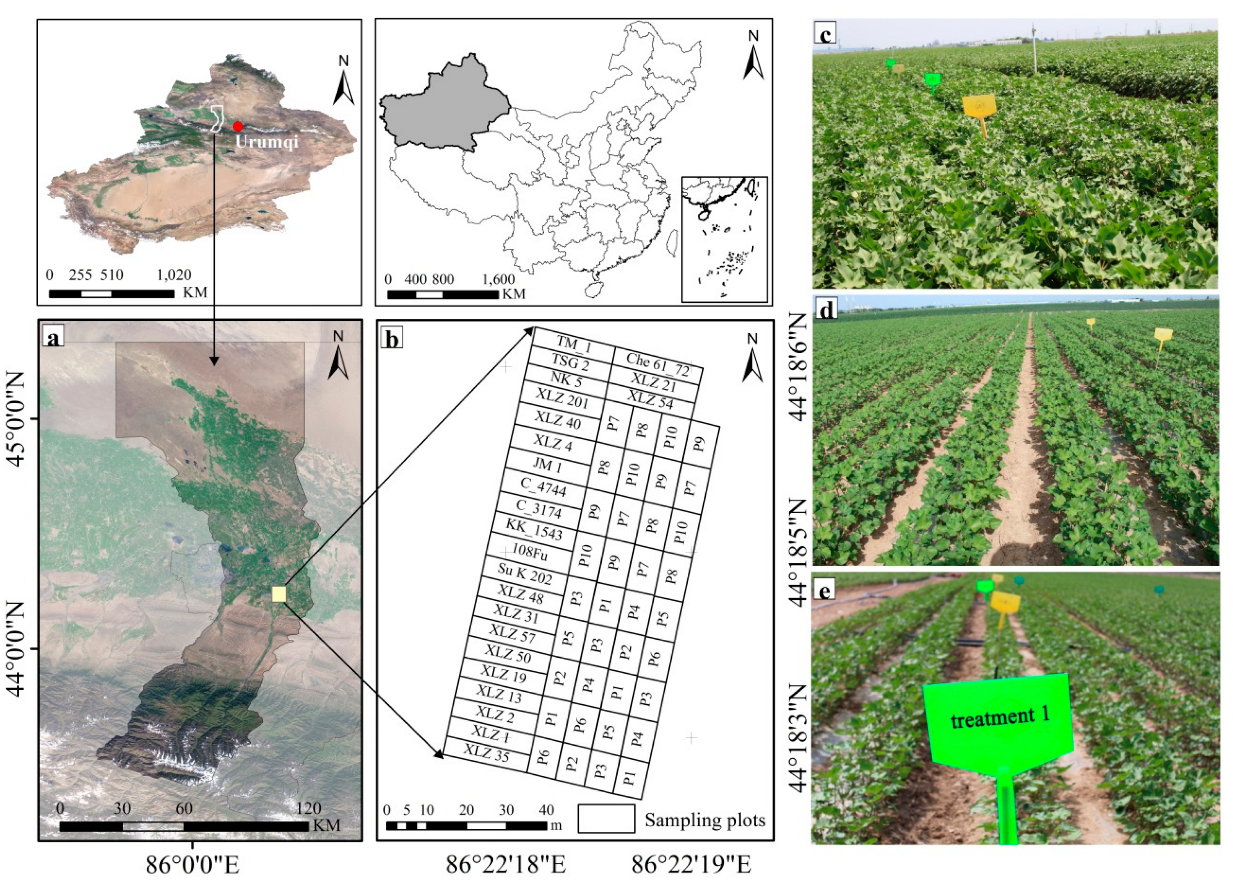
2.1. Research Area and Experimental Design
2.2. Determination of Cotton Leaf Phosphorus Content (LPC)
2.3. Spectral Data Measurement and Processing
2.3.1. Reflectance Data Acquisition
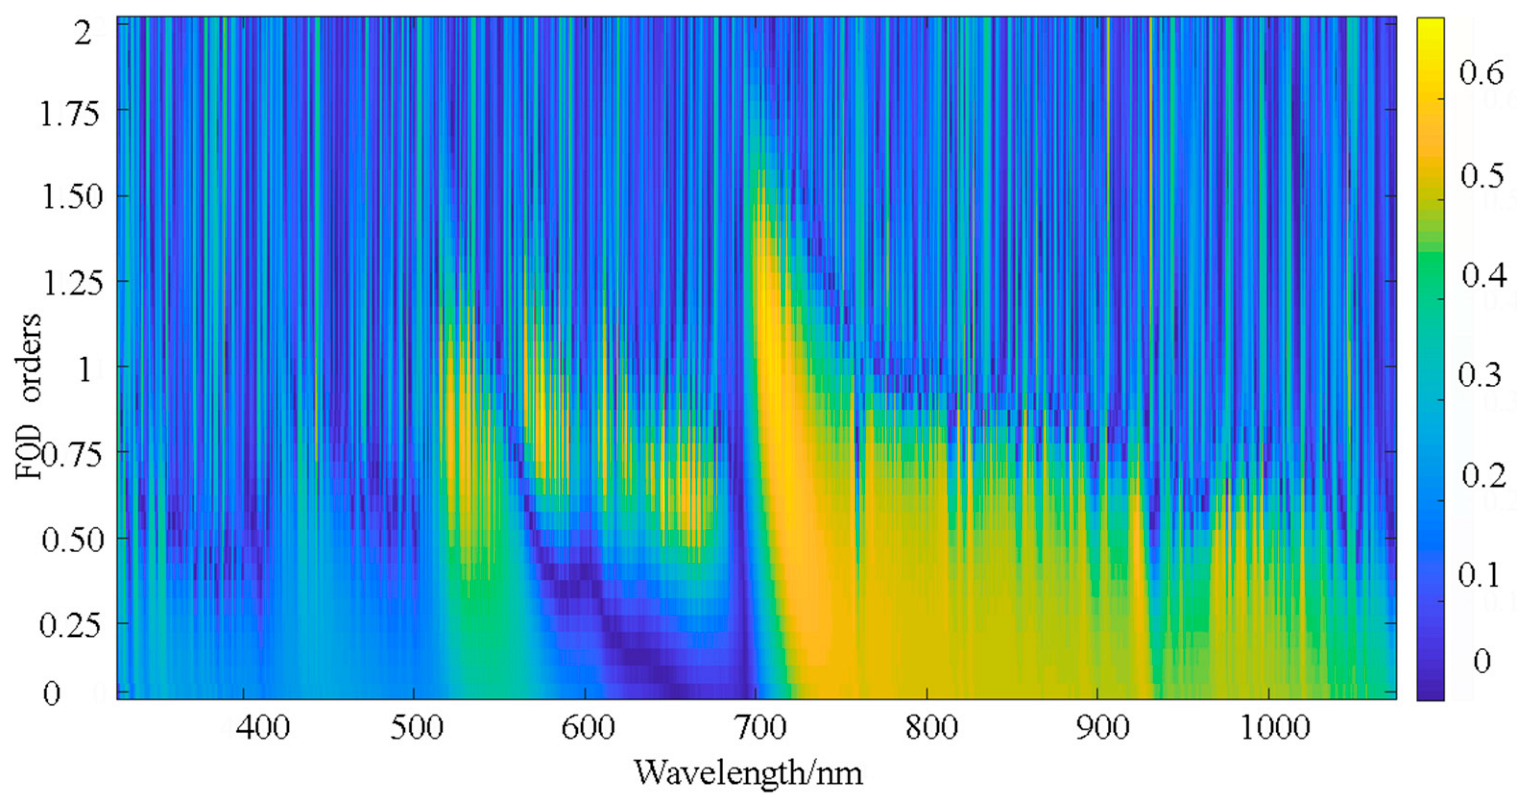
2.3.2. Fractional Differential Order
2.3.3. Optimized Spectral Indices
2.4. Algorithm and Modeling
3. Results
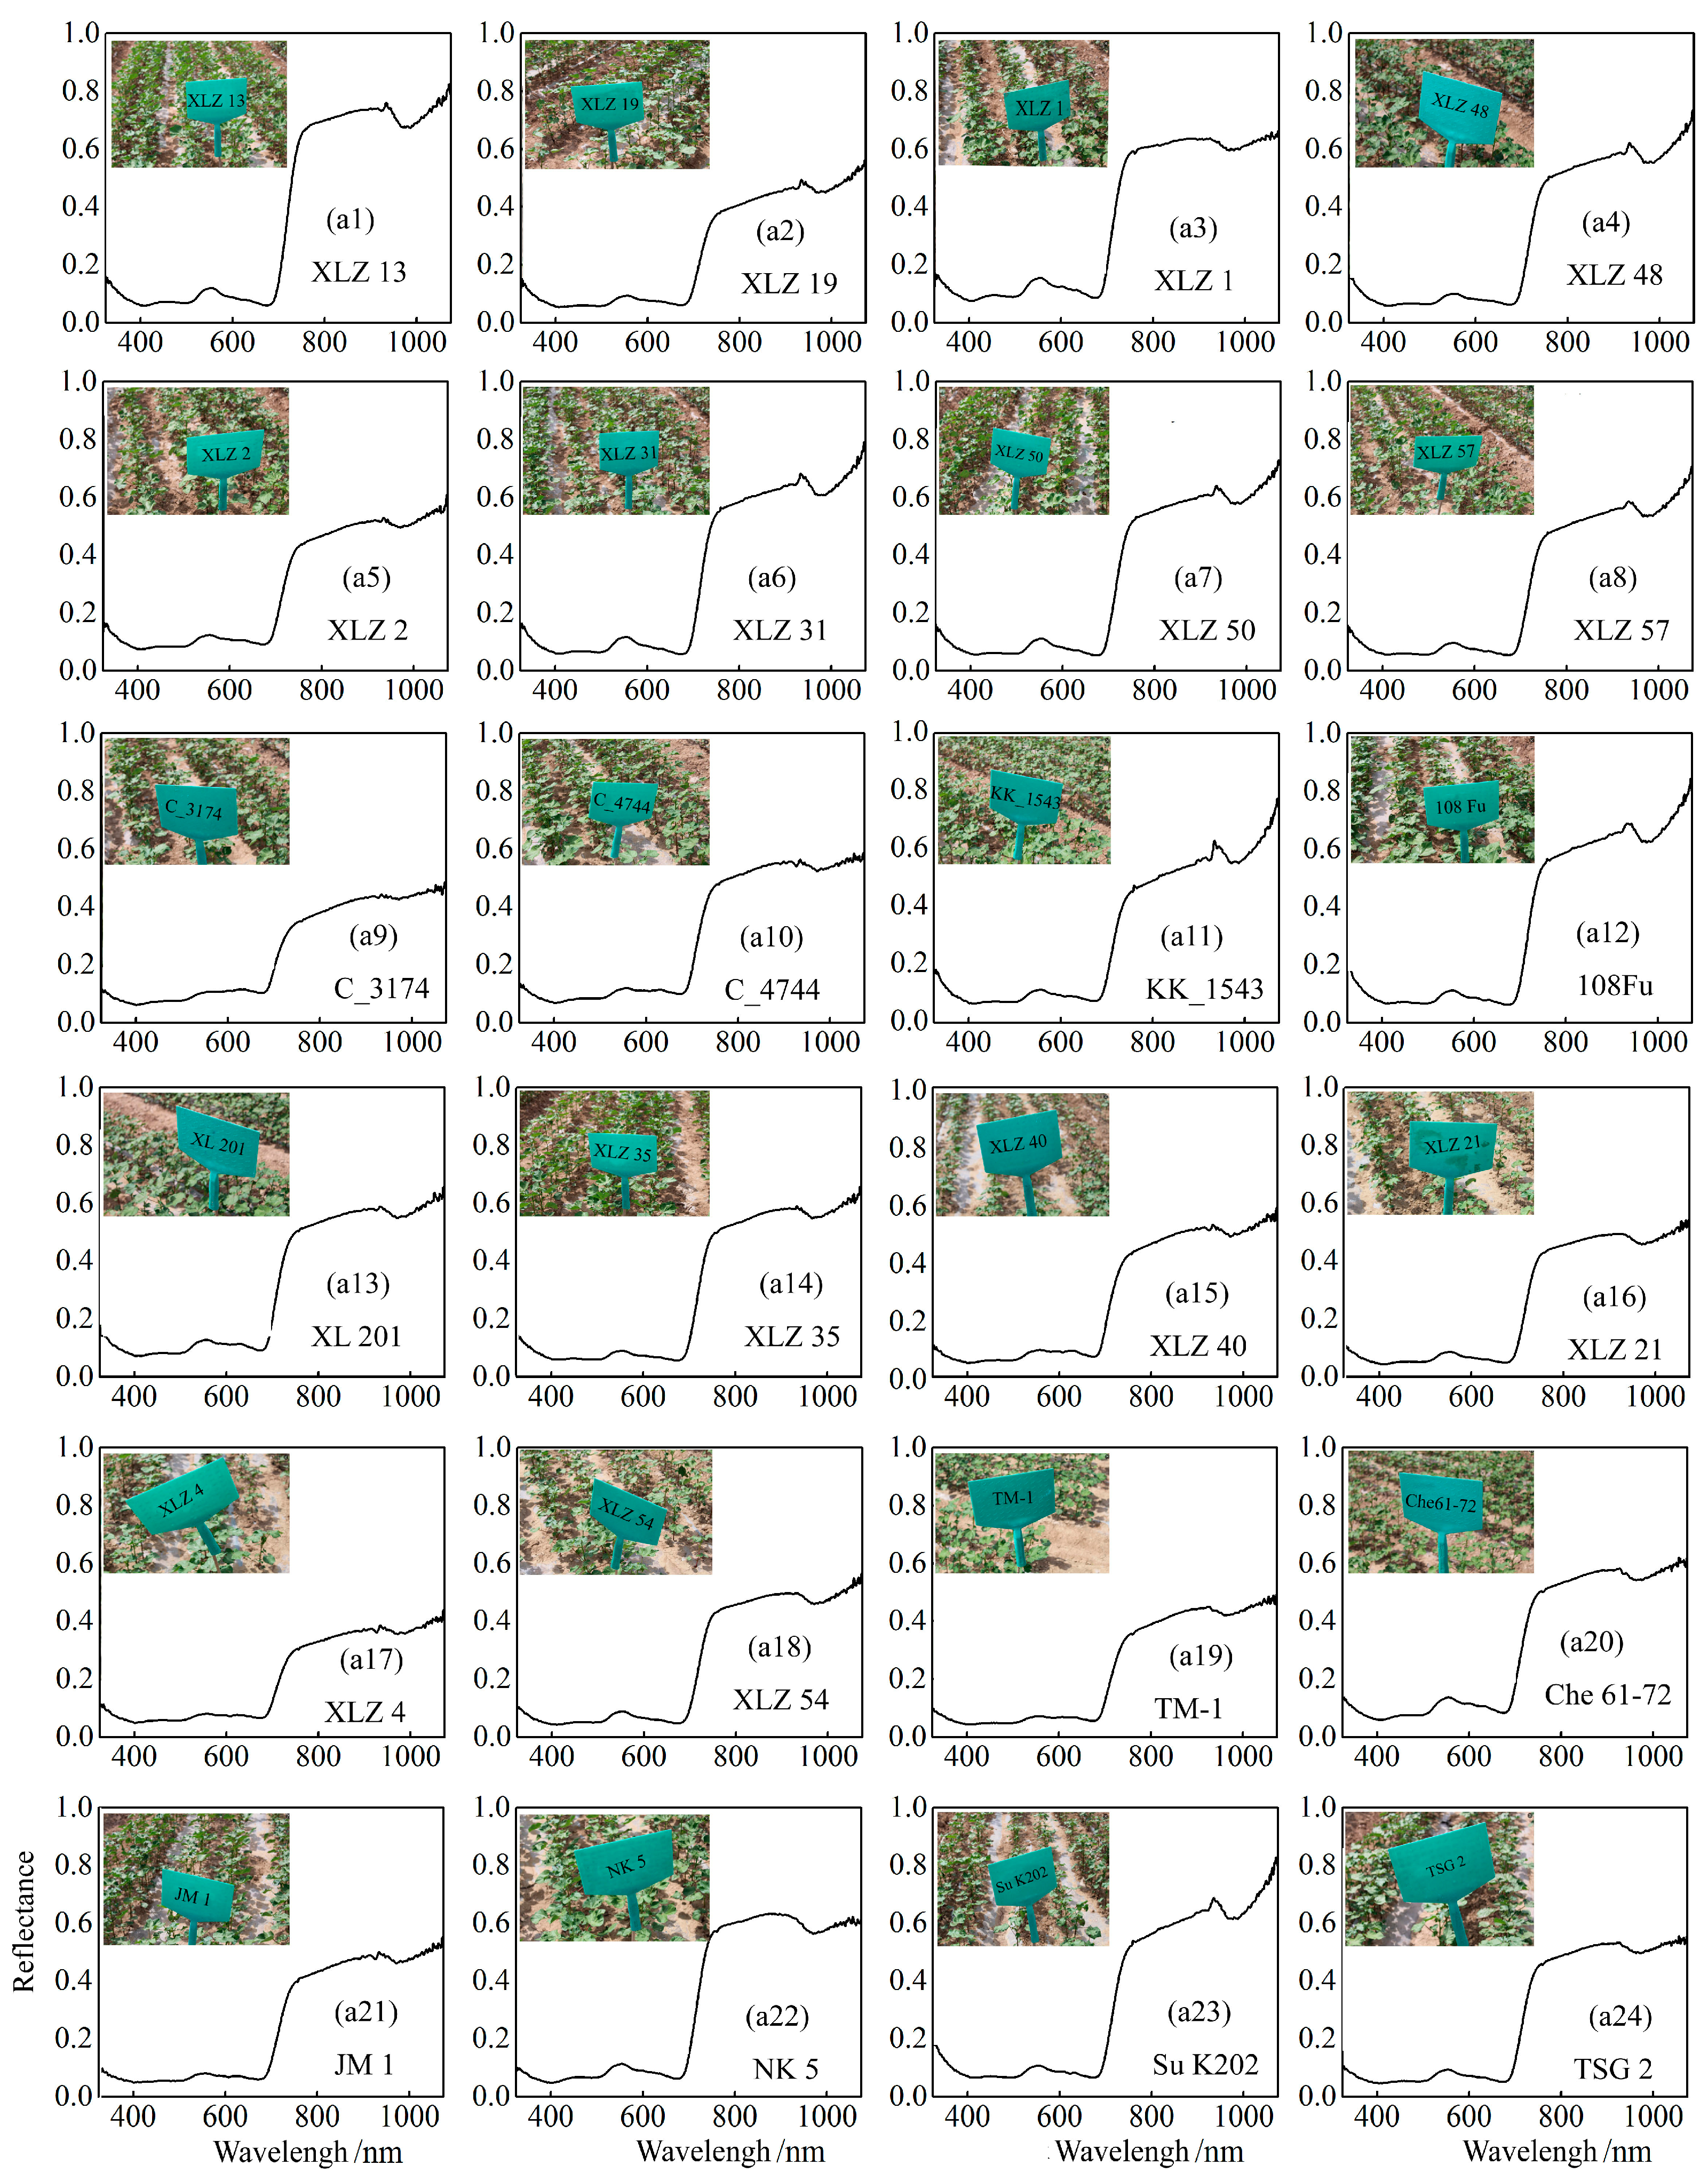
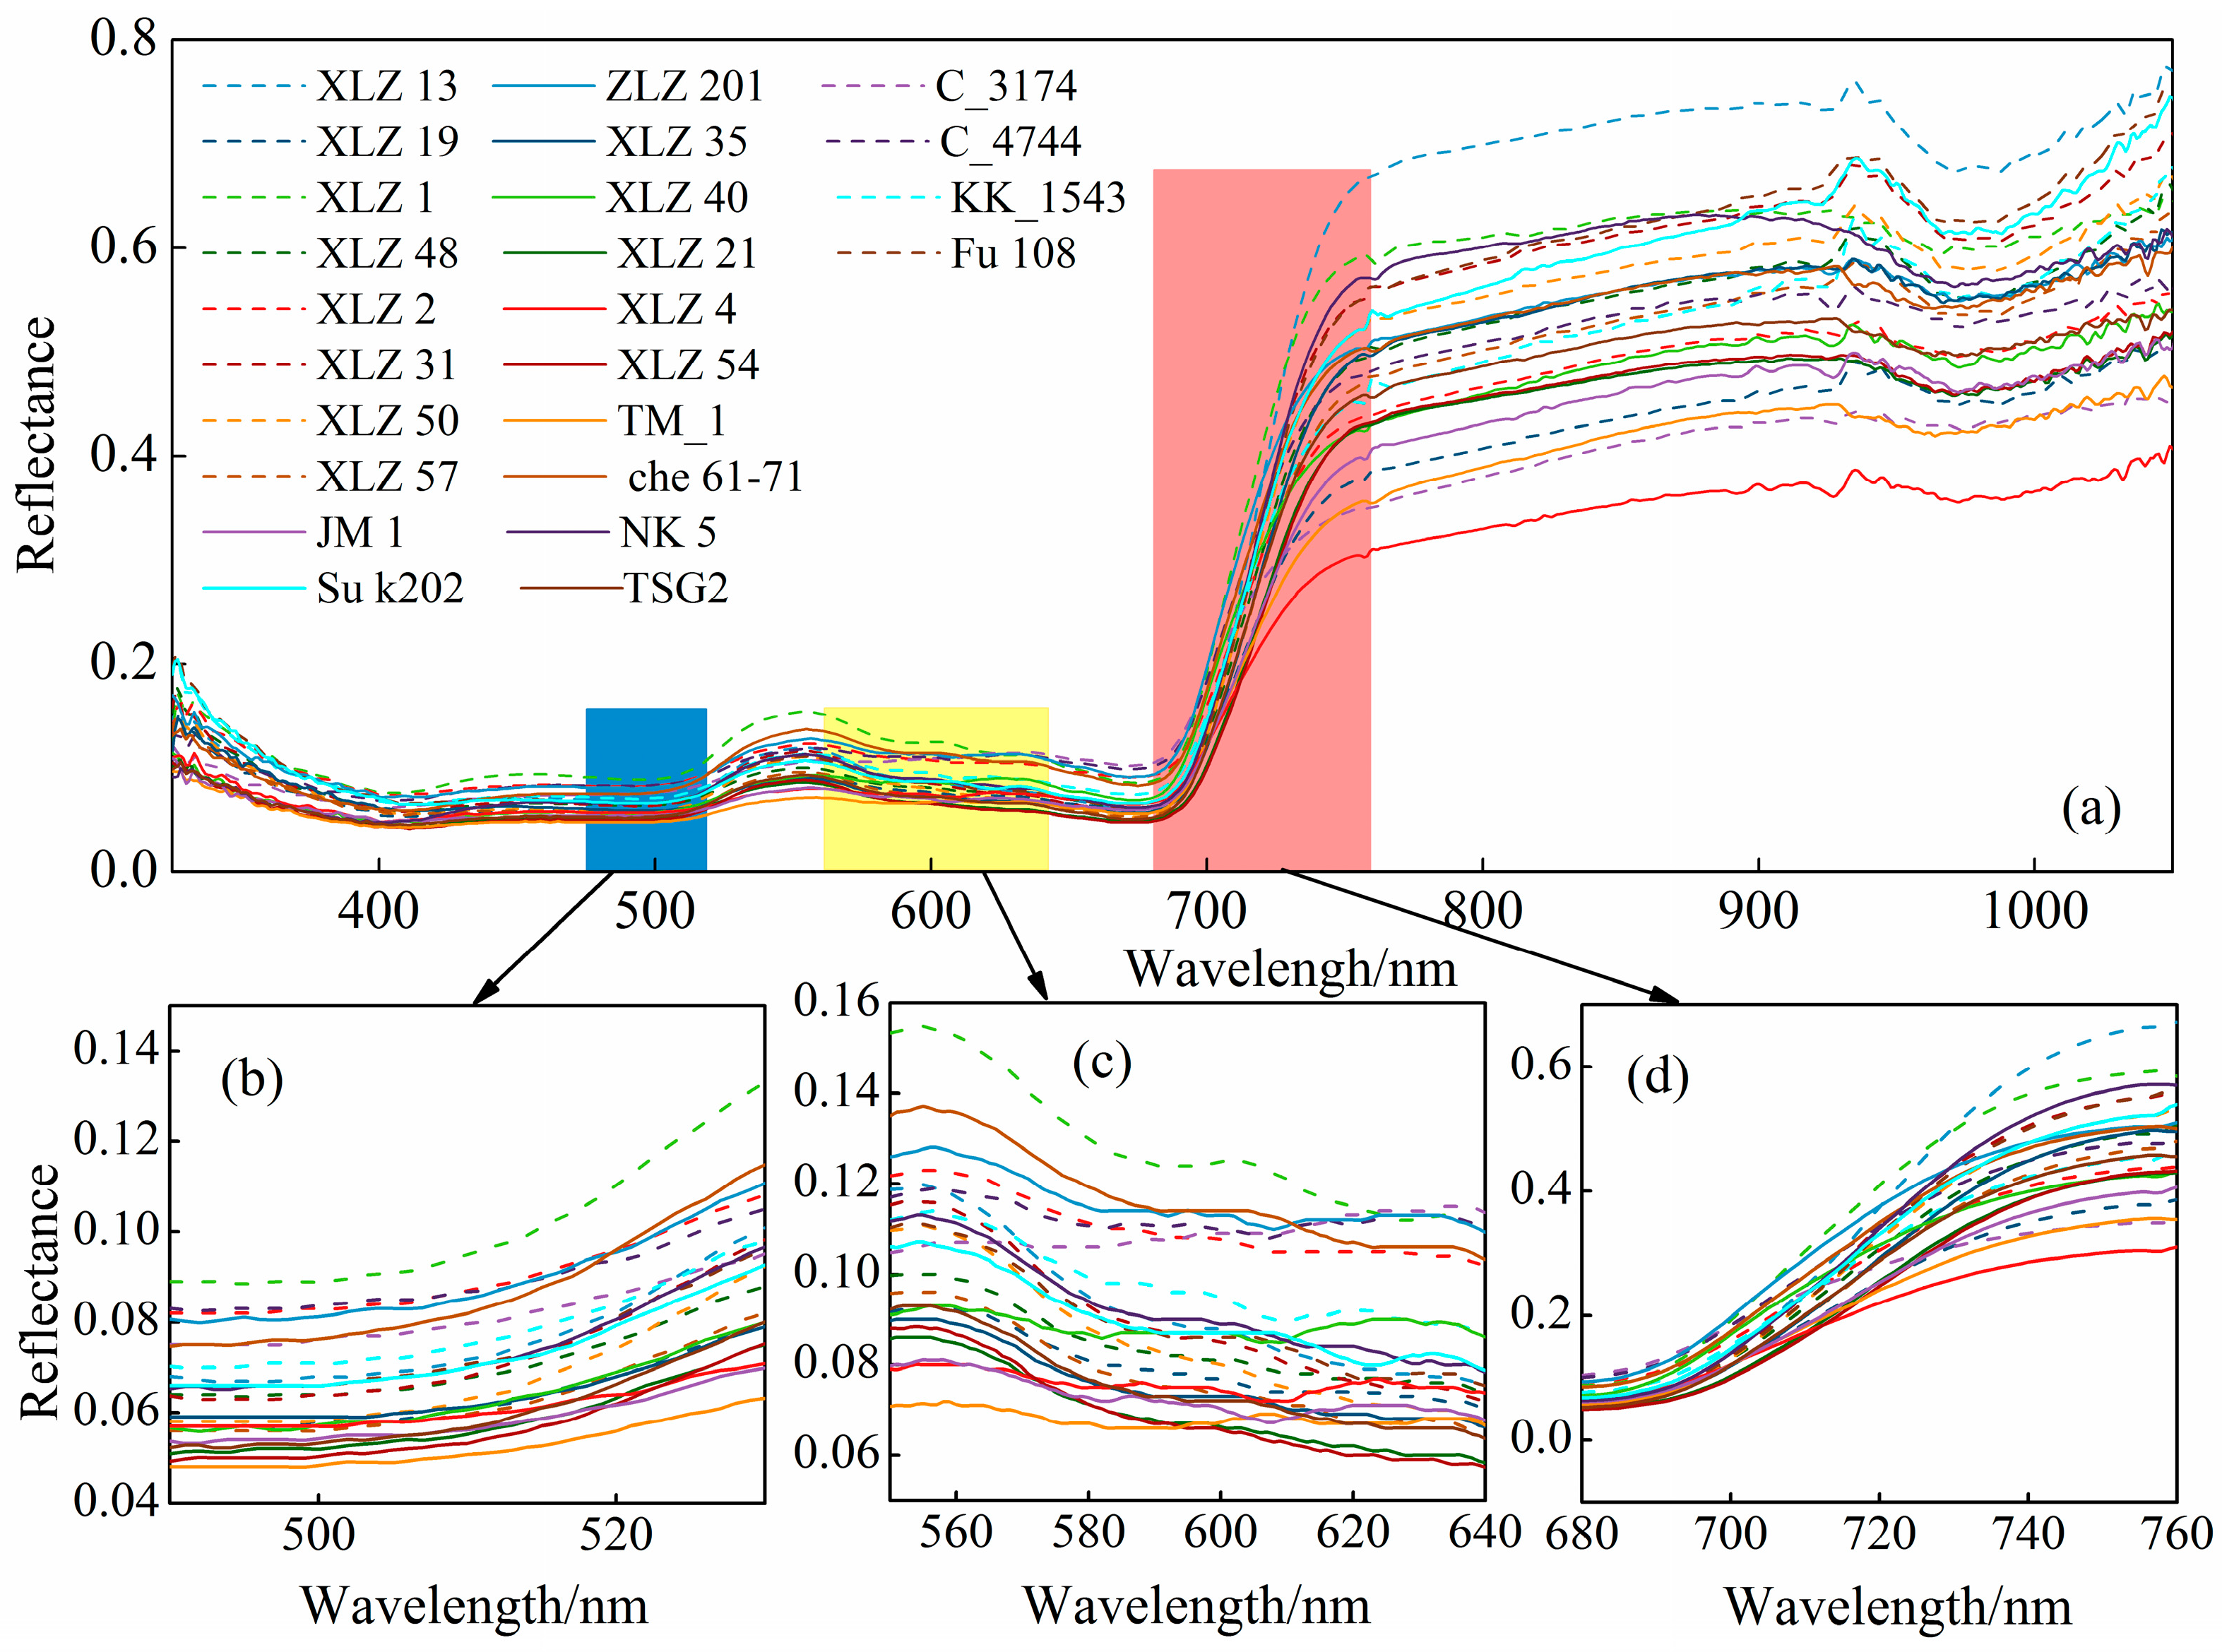
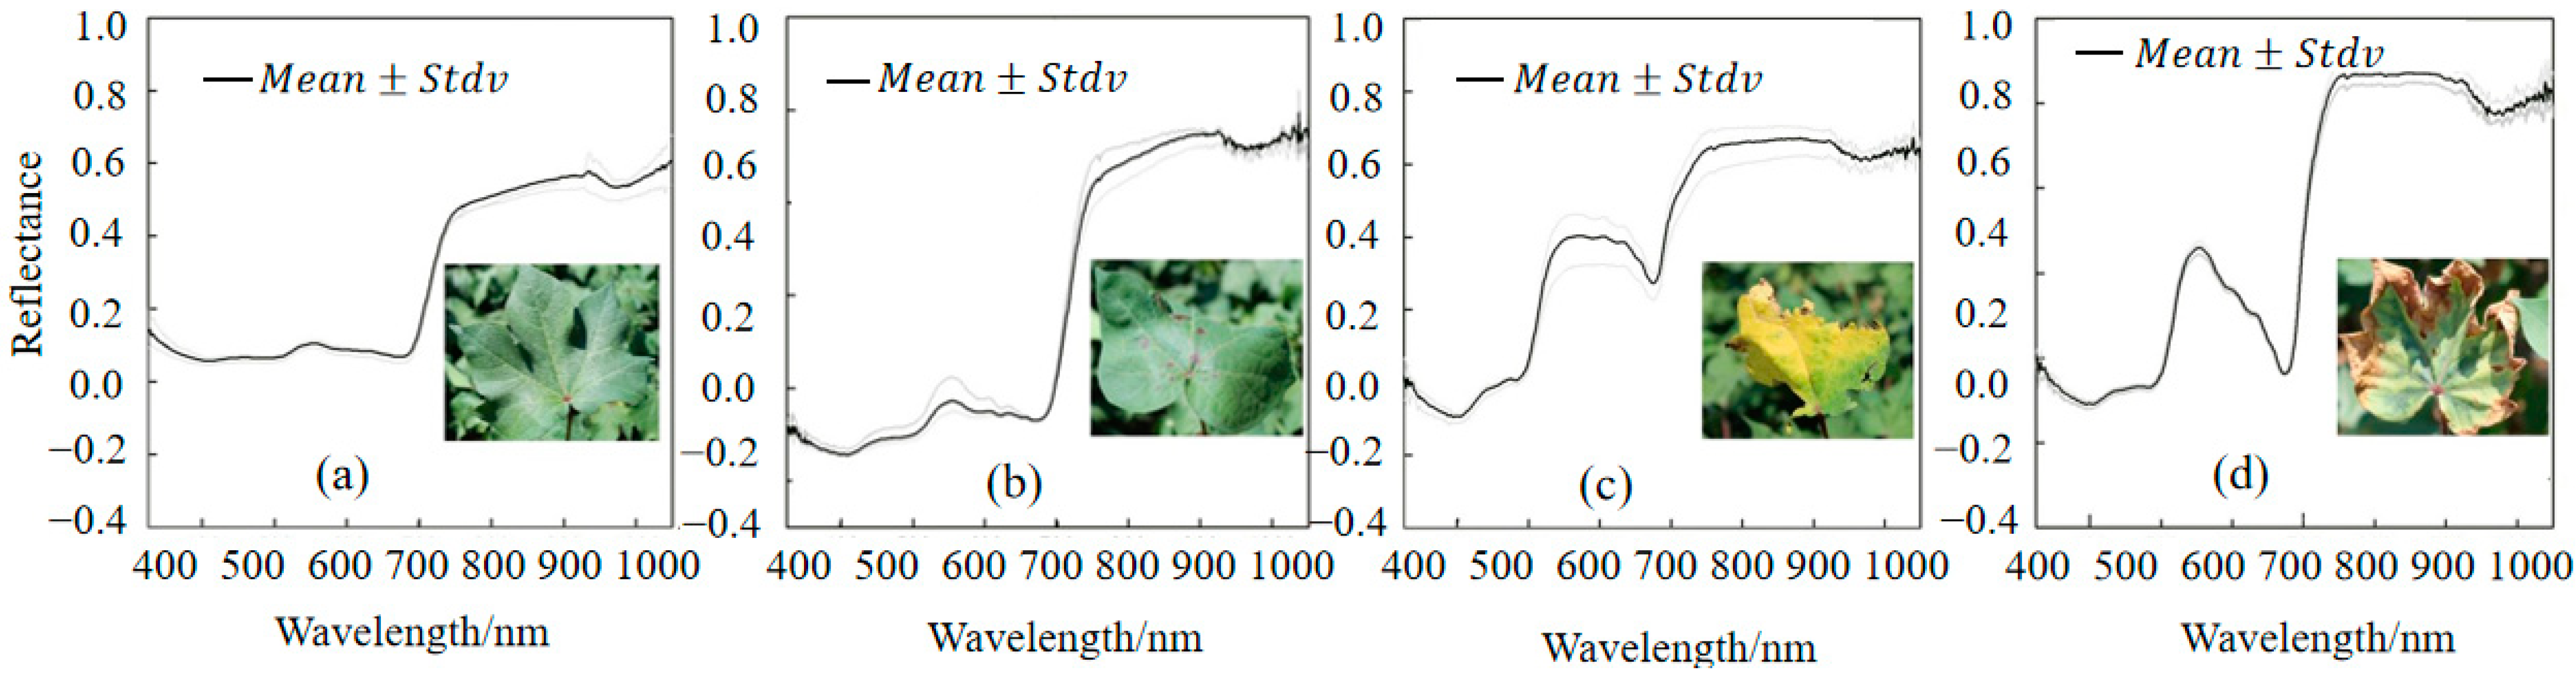
3.1. Spectral Analysis of Different Cotton Varieties
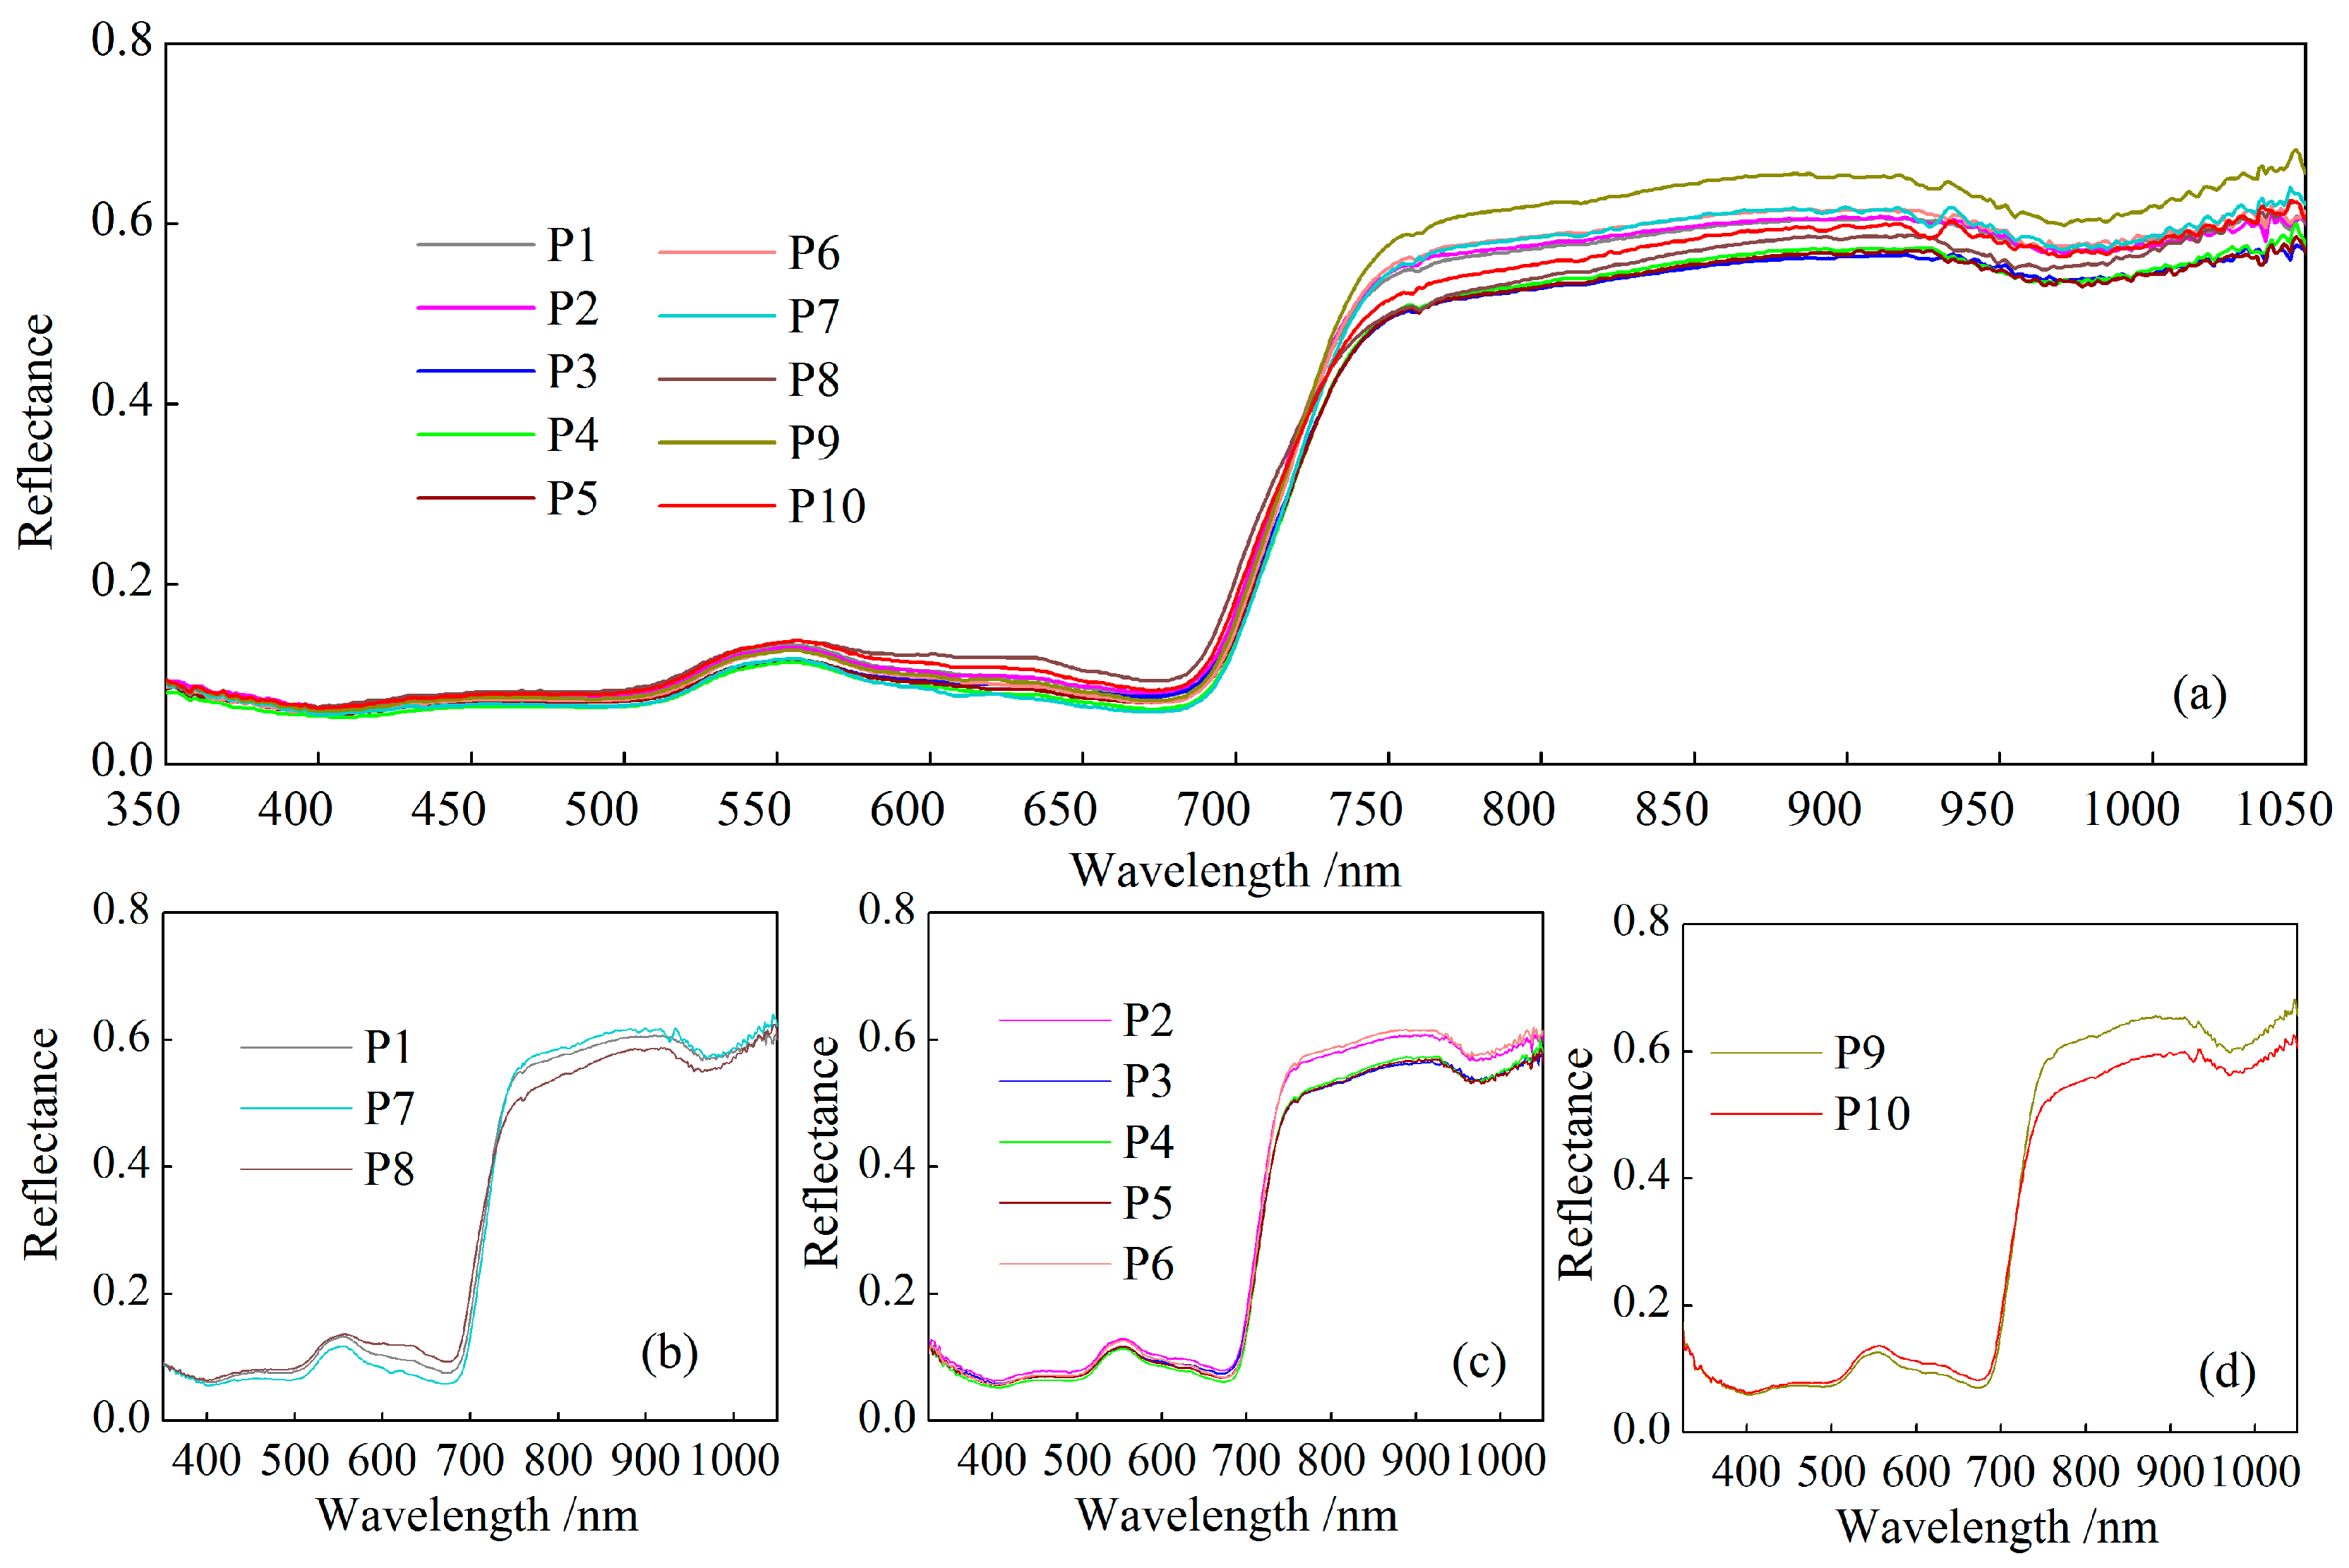
3.2. Spectral Analysis of Cotton Under Different Phosphorus Treatments
3.3. Correlation Between Spectral Parameters and LPC
3.3.1. Correlation Between Spectra and LPC
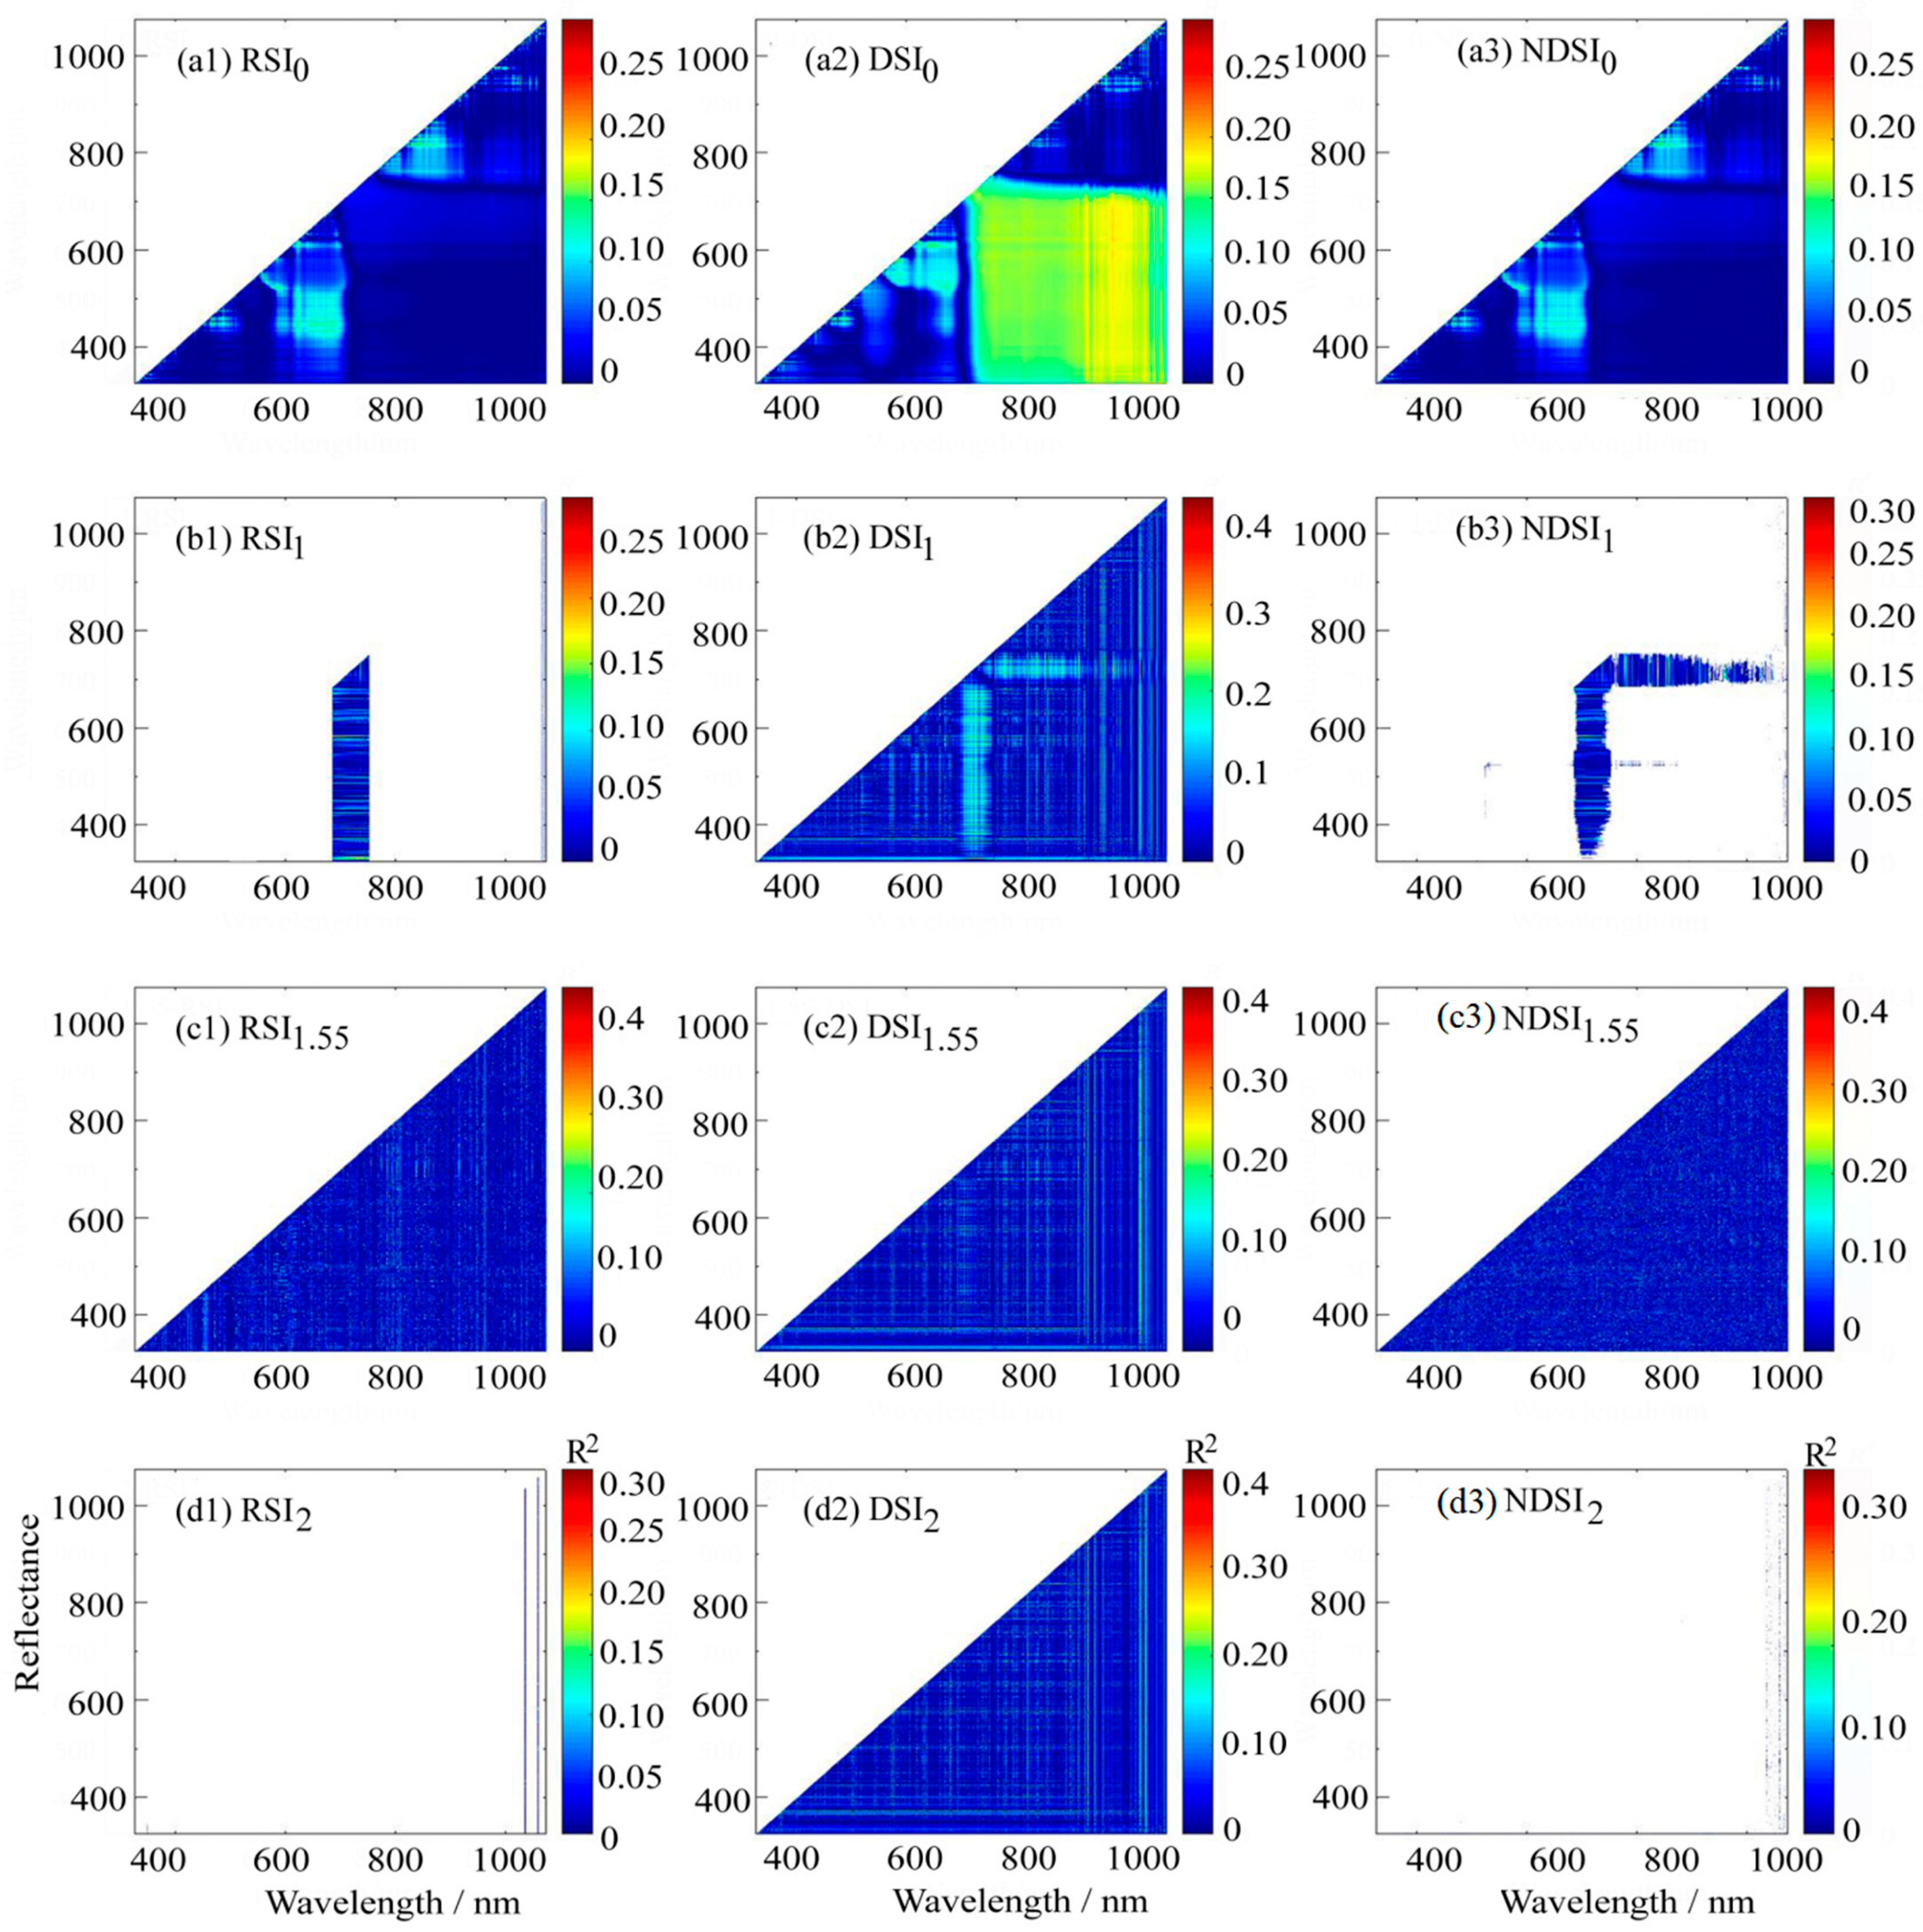
3.3.2. Correlation Between Optimized Spectral Indices and LPC
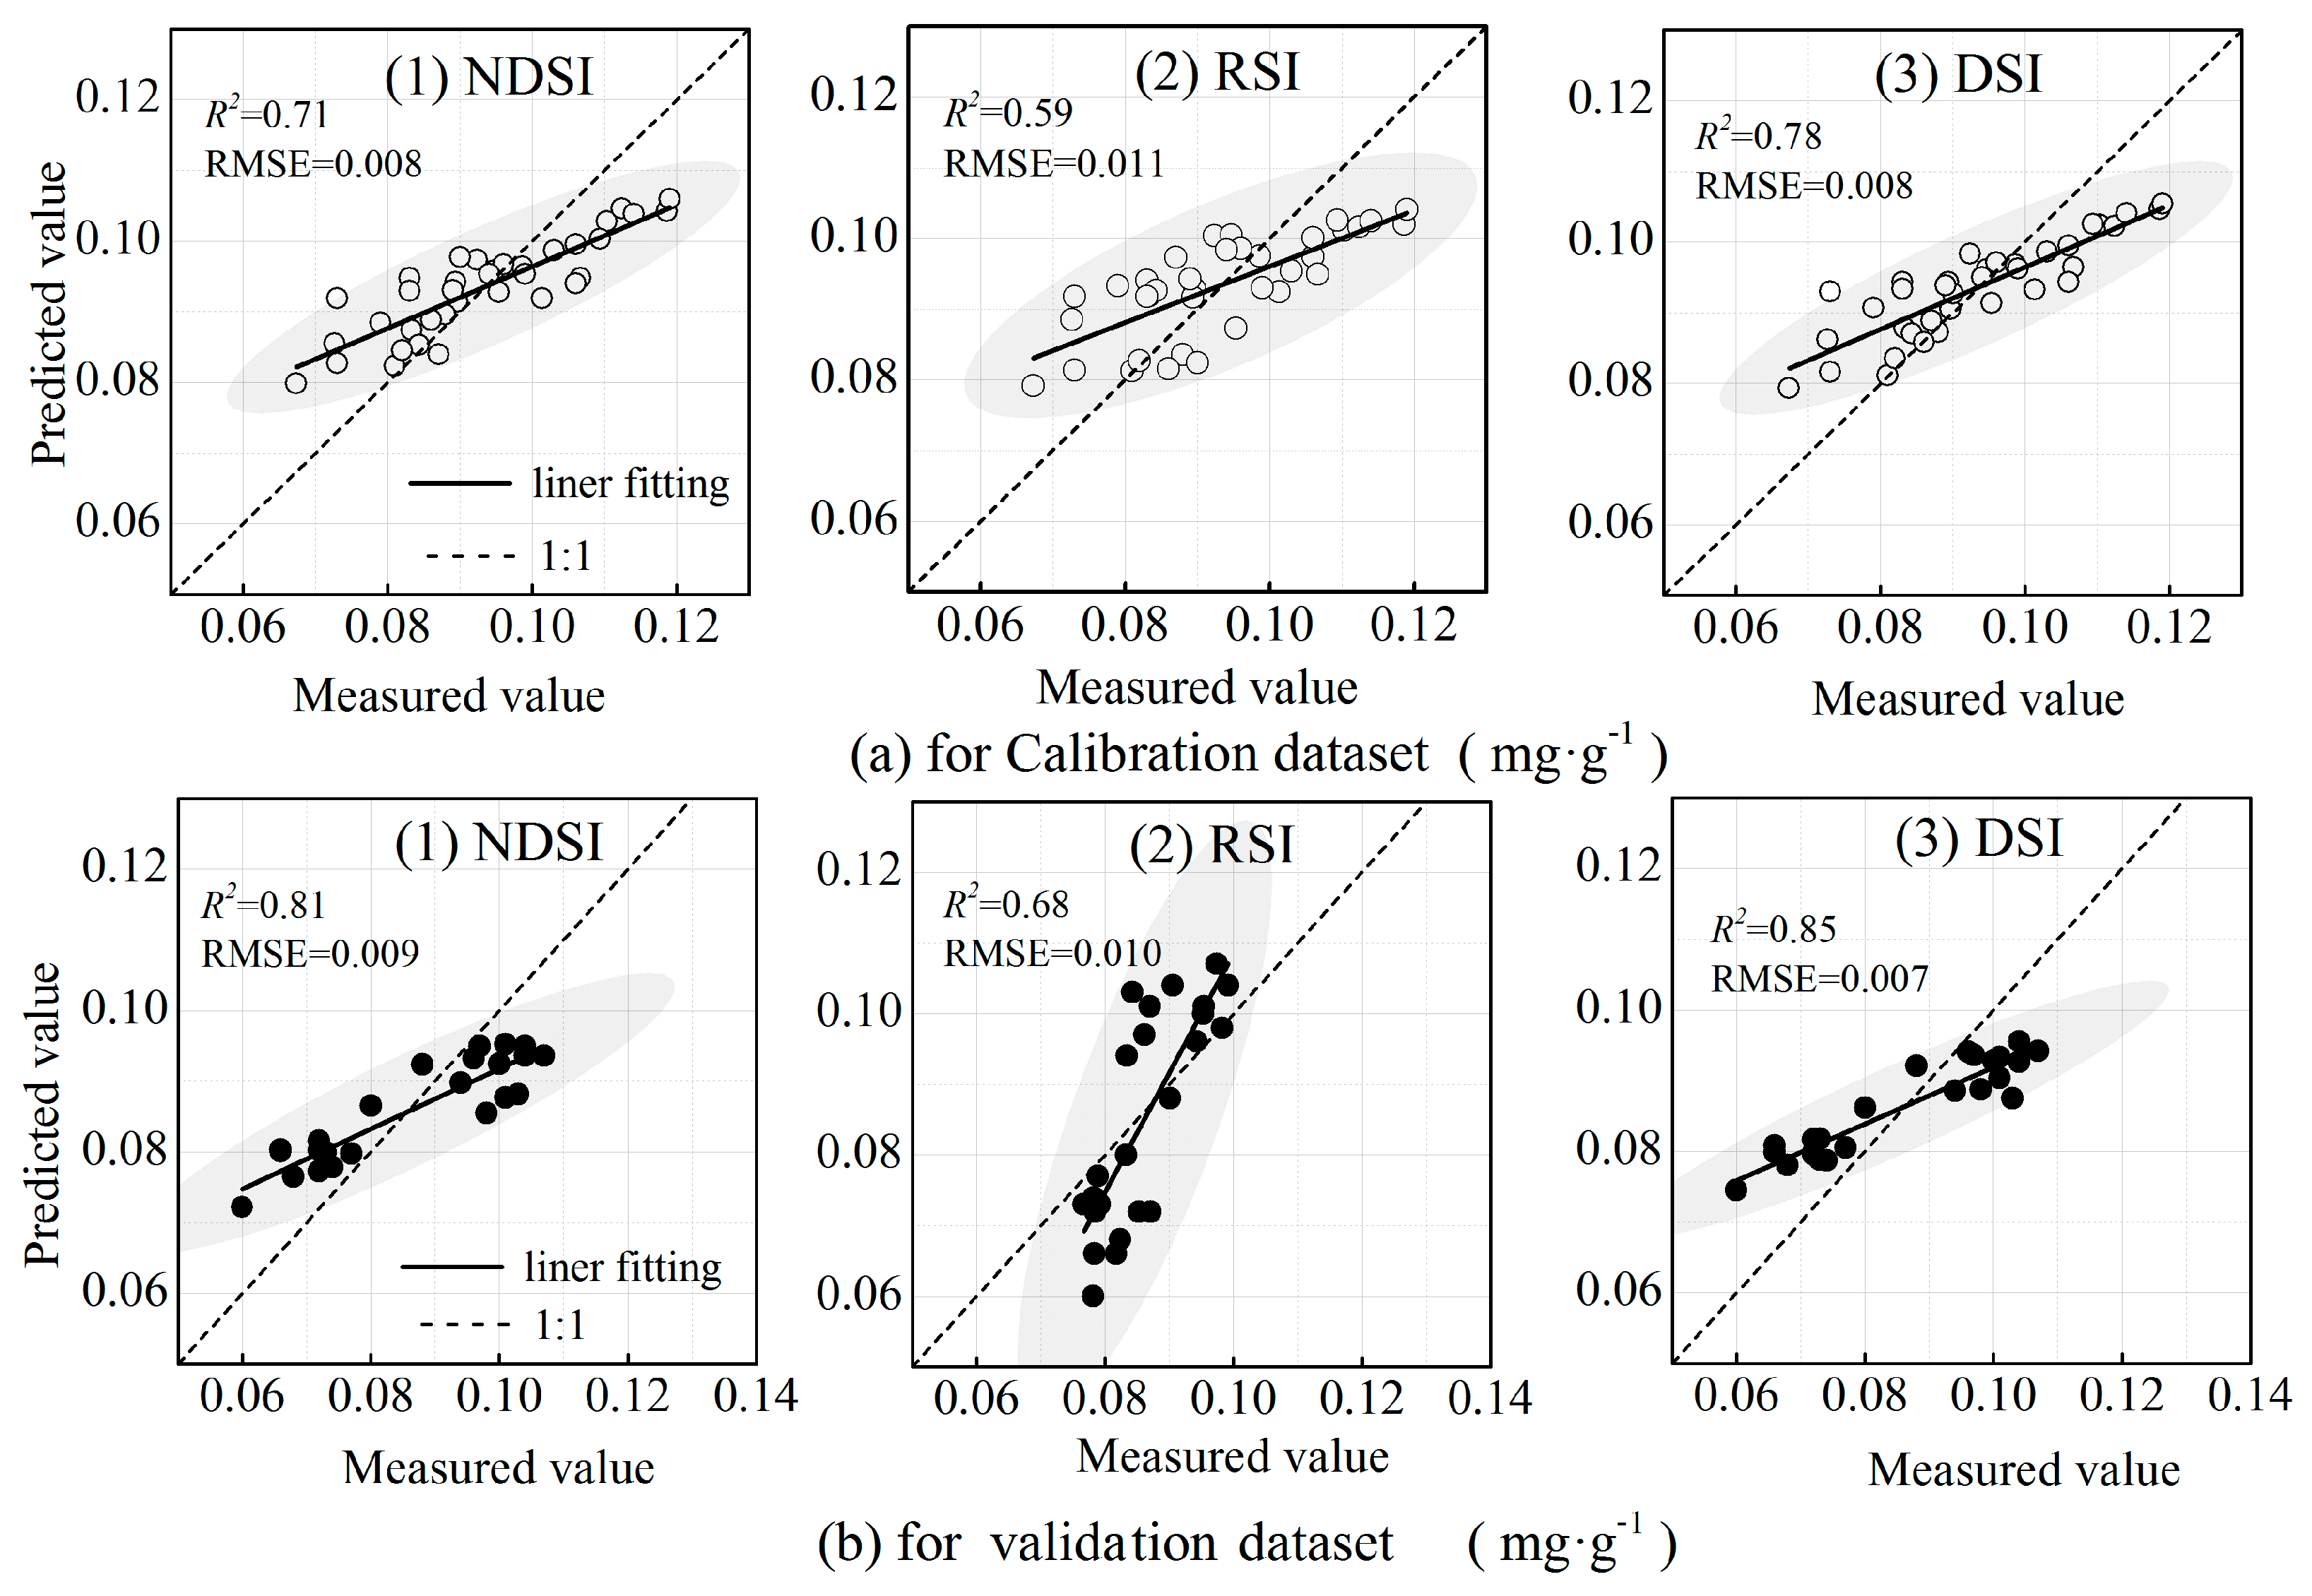
3.4. Estimation Model for LPC Based on Optimized Spectral Indices
4. Discussion
5. Conclusions
- (1)
- The spectral changes of 24 cotton cultivars are basically consistent.
- (2)
- In the visible region, the reflectance of cotton under phosphorus treatments did not show obvious regularity, while in the NIR, the reflectance of cotton increased with the increase in phosphorus content, showing a certain difference in phosphorus gradient.
- (3)
- The DSI+FOD coupling with the RF model is superior to the other two spectral index models (the NDSI and RSI). This study provides a new perspective to effectively estimate the phosphorus content in cotton leaves. However, spectral data enhancement, the optimization of the random forest algorithm, and the full growth stages of cotton all warrant further investigation.
Author Contributions
Funding
Data Availability Statement
Acknowledgments
Conflicts of Interest
References
- de Oliveira, K.M.; Furlanetto, R.H.; Rodrigues, M.; dos Santos, G.L.A.A.; Reis, A.S.; Teixeira Crusiol, L.G.; Rafael Nanni, M.; Cezar, E.; de Oliveira, R.B. Assessing Phosphorus Nutritional Status in Maize Plants Using Leaf-Based Hyperspectral Measurements and Multivariate Analysis. Int. J. Remote Sens. 2022, 43, 2560–2580. [Google Scholar] [CrossRef]
- Li, N.; Zhang, Y.; Shi, K.; Zhang, Y.; Sun, X.; Wang, W.; Qian, H.; Yang, H.; Niu, Y. Real-Time and Continuous Tracking of Total Phosphorus Using a Ground-Based Hyperspectral Proximal Sensing System. Remote Sens. 2023, 15, 507. [Google Scholar] [CrossRef]
- Ramoelo, A.; Skidmore, A.K.; Cho, M.A.; Mathieu, R.; Heitkönig, I.M.A.; Dudeni-Tlhone, N.; Schlerf, M.; Prins, H.H.T. Non-Linear Partial Least Square Regression Increases the Estimation Accuracy of Grass Nitrogen and Phosphorus Using in Situ Hyperspectral and Environmental Data. ISPRS J. Photogramm. Remote Sens. 2013, 82, 27–40. [Google Scholar] [CrossRef]
- Lu, J.; Li, W.; Yu, M.; Zhang, X.; Ma, Y.; Su, X.; Yao, X.; Cheng, T.; Zhu, Y.; Cao, W.; et al. Estimation of Rice Plant Potassium Accumulation Based on Non-Negative Matrix Factorization Using Hyperspectral Reflectance. Precis. Agric. 2021, 22, 51–74. [Google Scholar] [CrossRef]
- Osborne, S.L.; Schepers, J.S.; Francis, D.D.; Schlemmer, M.R. Detection of Phosphorus and Nitrogen Deficiencies in Corn Using Spectral Radiance Measurements. Agron. J. 2002, 94, 1215–1221. [Google Scholar] [CrossRef]
- Ban, S.; Tian, M.; Chang, Q.; Qi, W.; Li, F. Estimation of rice leaf phosphorus content using UAV-based hyperspectral images. Trans. Chin. Soc. Agric. Mach. 2021, 52, 163–171. [Google Scholar]
- Zhang, H. Estimation of Phosphorus Content in Corn Leaves Based on Hyperspectral Remote Sensing. Master’s Thesis, Inner Mongolia Agricultural University, Hohhot, Inner Mongolia, 2022. [Google Scholar] [CrossRef]
- Mahajan, G.R.; Sahoo, R.N.; Pandey, R.N.; Gupta, V.K.; Kumar, D. Using Hyperspectral Remote Sensing Techniques to Monitor Nitrogen, Phosphorus, Sulphur and Potassium in Wheat (Triticum aestivum L.). Precis. Agric. 2014, 15, 499–522. [Google Scholar] [CrossRef]
- Mahajan, G.R.; Pandey, R.N.; Sahoo, R.N.; Gupta, V.K.; Datta, S.C.; Kumar, D. Monitoring Nitrogen, Phosphorus and Sulphur in Hybrid Rice (Oryza sativa L.) Using Hyperspectral Remote Sensing. Precis. Agric. 2017, 18, 736–761. [Google Scholar] [CrossRef]
- Zhu, X.-C.; Zhao, G.-X.; Dong, F.; Wang, L.; Lei, T.; Zhan, B. Monitoring models for phosphorus content of apple flowers based on hyperspectrum. Ying Yong Sheng Tai Xue Bao 2009, 20, 2424–2430. [Google Scholar]
- Sembiring, H.; Raun, W.R.; Johnson, G.V.; Stone, M.L.; Solie, J.B.; Phillips, S.B. Detection of Nitrogen and Phosphorus Nutrient Status in Bermudagrass Using Spectral Radiance. J. Plant Nutr. 1998, 21, 1189–1206. [Google Scholar] [CrossRef]
- Song, K.; Li, L.; Li, S.; Tedesco, L.; Hall, B.; Li, L. Hyperspectral Remote Sensing of Total Phosphorus (TP) in Three Central Indiana Water Supply Reservoirs. Water Air Soil Pollut. 2012, 223, 1481–1502. [Google Scholar] [CrossRef]
- Evaluating Models of Leaf Phosphorus Content of Winter Oilseed Rape Based on Hyperspectral Data. Available online: http://www.tcsae.org/en/article/doi/10.11975/j.issn.1002-6819.2016.14.028 (accessed on 23 March 2025).
- Siedliska, A.; Baranowski, P.; Pastuszka-Woźniak, J.; Zubik, M.; Krzyszczak, J. Identification of Plant Leaf Phosphorus Content at Different Growth Stages Based on Hyperspectral Reflectance. BMC Plant Biol. 2021, 21, 28. [Google Scholar] [CrossRef] [PubMed]
- Li, D.; Wang, C.; Jiang, H.; Peng, Z.; Yang, J.; Su, Y.; Song, J.; Chen, S. Monitoring Litchi Canopy Foliar Phosphorus Content Using Hyperspectral Data. Comput. Electron. Agric. 2018, 154, 176–186. [Google Scholar] [CrossRef]
- Chen, M.; Glaz, B.; Gilbert, R.A.; Daroub, S.H.; Barton, F.E.; Wan, Y. Near-Infrared Reflectance Spectroscopy Analysis of Phosphorus in Sugarcane Leaves. Agron. J. 2002, 94, 1324–1331. [Google Scholar] [CrossRef]
- Gao, J.; Meng, B.; Liang, T.; Feng, Q.; Ge, J.; Yin, J.; Wu, C.; Cui, X.; Hou, M.; Liu, J.; et al. Modeling Alpine Grassland Forage Phosphorus Based on Hyperspectral Remote Sensing and a Multi-Factor Machine Learning Algorithm in the East of Tibetan Plateau, China. ISPRS J. Photogramm. Remote Sens. 2019, 147, 104–117. [Google Scholar] [CrossRef]
- Peng, L.; Xin, H.-N.; Lv, C.-X.; Li, N.; Li, Y.-F.; Geng, Q.-L.; Chen, S.-H.; Lai, N. Inversion of Nitrogen and Phosphorus Contents in Cotton Leaves Based on the Gaussian Mixture Model and Differences in Hyperspectral Features of UAV. Spectrochim. Acta Part A Mol. Biomol. Spectrosc. 2025, 327, 125419. [Google Scholar] [CrossRef]
- Yu, F.; Xiang, S.; Guo, Z.; Zhang, H.; Bai, J.; Xu, T. Collaborative Inverse Modeling of Nitrogen and Phosphorus Content in Rice Based on WOA-ELM. Int. J. Precis. Agric. Aviat. 2022, 5, 1–5. [Google Scholar] [CrossRef]
- Baidengsha, M.; Sun, L.; Liu, Z.; Feng, G. Comparison of yield and nitrogen use efficiency-related traits of cotton cultivars released during the last sixty years. Chin. J. Eco-Agric. 2019, 27, 880–889. [Google Scholar] [CrossRef]
- Abulaiti, Y.; Sawut, M.; Maimaitiaili, B.; Ma, C. A Possible Fractional Order Derivative and Optimized Spectral Indices for Assessing Total Nitrogen Content in Cotton. Comput. Electron. Agric. 2020, 171, 105275. [Google Scholar] [CrossRef]
- Mistele, B.; Schmidhalter, U. Estimating the Nitrogen Nutrition Index Using Spectral Canopy Reflectance Measurements. Eur. J. Agron. 2008, 29, 184–190. [Google Scholar] [CrossRef]
- Yuanhua, M.A.; Caixia, Y.I.N.; Hongyu, W.; Yuxuan, L.I.U.; Qiantong, L.I.U.; Ze, Z. Estimation Model of Cotton Leaf Phosphorus Content Based on Hyperspectral Reflectance. Chin. Agric. Sci. Bull. 2023, 39, 123–132. [Google Scholar] [CrossRef]
- Zhang, Y.; Wang, T.; Li, Z.; Wang, T.; Cao, N. Based on Machine Learning Algorithms for Estimating Leaf Phosphorus Concentration of Rice Using Optimized Spectral Indices and Continuous Wavelet Transform. Front. Plant Sci. 2023, 14, 1185915. [Google Scholar] [CrossRef] [PubMed]
- Li, D.; Hu, Q.; Zhang, J.; Dian, Y.; Hu, C.; Zhou, J. Leaf Nitrogen and Phosphorus Variation and Estimation of Citrus Tree under Two Labor-Saving Cultivation Modes Using Hyperspectral Data. Remote Sens. 2024, 16, 3261. [Google Scholar] [CrossRef]
- Wang, J.; Xue, W.; Shi, X.; Xu, Y.; Dong, C. Adaboost-Based Machine Learning Improved the Modeling Robust and Estimation Accuracy of Pear Leaf Nitrogen Concentration by in-Field VIS-NIR Spectroscopy. Sensors 2021, 21, 6260. [Google Scholar] [CrossRef]

| Sample Set | Sample Size | Min | Max | Mean | SD | CV (%) |
|---|---|---|---|---|---|---|
| Calibration | 36 | 0.067 | 0.12 | 0.093 | 0.0135 | 14.5 |
| Validation | 24 | 0.06 | 0.107 | 0.085 | 0.0153 | 18.0 |
| Total | 60 | 0.06 | 0.12 | 0.090 | 0.0146 | 16.2 |
| FOD | |R| | Band (nm) | Band Number | FOD | |R| | Band (nm) | Band Number |
|---|---|---|---|---|---|---|---|
| 0 | 0.422 | 973 | 151 | 1.1 | 0.503 | 459 | 17 |
| 0.1 | 0.466 | 941 | 178 | 1.2 | 0.508 | 459 | 19 |
| 0.2 | 0.455 | 973 | 139 | 1.3 | 0.528 | 838 | 12 |
| 0.3 | 0.471 | 940 | 136 | 1.4 | 0.540 | 838 | 12 |
| 0.4 | 0.494 | 940 | 117 | 1.5 | 0.546 | 838 | 12 |
| 0.5 | 0.514 | 940 | 96 | 1.6 | 0.547 | 838 | 12 |
| 0.6 | 0.507 | 917 | 69 | 1.7 | 0.544 | 838 | 8 |
| 0.7 | 0.509 | 904 | 347 | 1.8 | 0.539 | 838 | 9 |
| 0.8 | 0.512 | 838 | 27 | 1.9 | 0.532 | 838 | 10 |
| 0.9 | 0.496 | 838 | 16 | 2 | 0.524 | 838 | 9 |
| 1 | 0.483 | 459 | 16 | / | / | / | / |
| Index | FOD | Variable (nm) | Calibration | Validation | ||
|---|---|---|---|---|---|---|
| R2 | RMSE | R2 | RMSE | |||
| NDSI | 0 | 835, 839 | 0.71 | 0.008 | 0.81 | 0.009 |
| 1 | 606, 1060 | |||||
| 1.6 | 491, 487 | |||||
| 2 | 522, 341 | |||||
| RSI | 0 | 835, 839 | 0.59 | 0.011 | 0.68 | 0.010 |
| 1 | 617, 1067 | |||||
| 1.6 | 852, 737 | |||||
| 2 | 606, 1060 | |||||
| DSI | 0 | 1062, 1065 | 0.78 | 0.008 | 0.85 | 0.007 |
| 1 | 675, 839 | |||||
| 1.6 | 839, 452 | |||||
| 2 | 839, 452 | |||||
Disclaimer/Publisher’s Note: The statements, opinions and data contained in all publications are solely those of the individual author(s) and contributor(s) and not of MDPI and/or the editor(s). MDPI and/or the editor(s) disclaim responsibility for any injury to people or property resulting from any ideas, methods, instructions or products referred to in the content. |
© 2025 by the authors. Licensee MDPI, Basel, Switzerland. This article is an open access article distributed under the terms and conditions of the Creative Commons Attribution (CC BY) license (https://creativecommons.org/licenses/by/4.0/).
Share and Cite
Sawut, M.; Hu, X.; Abulaiti, Y.; Yimaer, R.; Maimaitiaili, B.; Liu, S.; Pang, R. Estimation of Leaf Phosphorus Content in Cotton Using Fractional Order Differentially Optimized Spectral Indices. Plants 2025, 14, 1457. https://doi.org/10.3390/plants14101457
Sawut M, Hu X, Abulaiti Y, Yimaer R, Maimaitiaili B, Liu S, Pang R. Estimation of Leaf Phosphorus Content in Cotton Using Fractional Order Differentially Optimized Spectral Indices. Plants. 2025; 14(10):1457. https://doi.org/10.3390/plants14101457
Chicago/Turabian StyleSawut, Mamat, Xin Hu, Yierxiati Abulaiti, Rebiya Yimaer, Baidengsha Maimaitiaili, Shanshan Liu, and Ran Pang. 2025. "Estimation of Leaf Phosphorus Content in Cotton Using Fractional Order Differentially Optimized Spectral Indices" Plants 14, no. 10: 1457. https://doi.org/10.3390/plants14101457
APA StyleSawut, M., Hu, X., Abulaiti, Y., Yimaer, R., Maimaitiaili, B., Liu, S., & Pang, R. (2025). Estimation of Leaf Phosphorus Content in Cotton Using Fractional Order Differentially Optimized Spectral Indices. Plants, 14(10), 1457. https://doi.org/10.3390/plants14101457