Article

Impacts of Climate Change on the Spatial Distribution and Habitat Suitability of Nitraria tangutorum

1
Research Institute of Forestry, Chinese Academy of Forestry, Beijing 100091, China
2
Institute of Ecological Conservation and Restoration, Chinese Academy of Forestry, Beijing 100091, China
*
Authors to whom correspondence should be addressed.
Plants 2025, 14(10), 1446; https://doi.org/10.3390/plants14101446
Submission received: 7 April 2025 / Revised: 4 May 2025 / Accepted: 11 May 2025 / Published: 12 May 2025
(This article belongs to the Section Plant Response to Abiotic Stress and Climate Change)

Abstract

:
Nitraria tangutorum (Zygophyllaceae) is an ecologically and economically valuable shrub, locally dominant in the arid and semi-arid deserts of northwest China owing to its exceptional drought resistance and salt tolerance. In this study, environmental variable importance was evaluated within the MaxEnt model using percent-contribution metrics, based on 154 distribution records of N. tangutorum and 14 bioclimatic and soil-related environmental variables. We identified the five key variables of N. tangutorum distribution as follows: Precipitation of the Wettest Quarter (Bio16), Topsoil Sodicity (T_esp), Topsoil Electroconductibility (T_ece), Topsoil Car-bonate or lime content (T_CACO3), and Precipitation of the Driest Month (Bio14). The constructed MaxEnt model was then used to project the potential distribution areas of N. tangutorum under the four Shared Socioeconomic Pathways (SSP1-2.6, SSP2-4.5, SSP3-7.0, SSP5-8.5) for both current climate conditions and future climate conditions (2050s and 2090s). The results indicate that, under present-day conditions, high-suitability areas occur primarily in Xinjiang, Gansu, Qinghai, Inner Mongolia, and Ningxia; in future climate scenarios, the suitable habitat for N. tangutorum is anticipated to shrink by the 2050s but is expected to gradually recover by the 2090s. As time progresses, the suitable habitat areas will generally expand towards higher latitude regions. These findings demonstrate N. tangutorum’s strong adaptive potential to climate change and provide a scientific basis for its targeted introduction, cultivation, and long-term management in desert restoration and ecological rehabilitation projects.

1. Introduction

As a pivotal determinant of biodiversity, climate governs the growth, development, and geographical distribution of organisms [1]. Anthropogenic greenhouse gas emissions generated by societal progress have increased the frequency of extreme weather events, thereby imposing significant societal burdens. Simultaneously, the continually changing hydrothermal conditions have also disrupted the distribution of species [2,3]. Yet, plants can acclimate to climate change through phenotypic plasticity, such as modifications in phenological stages [4]. Under projected climate scenarios, plant populations unable to persist in their native environments typically migrate toward higher latitudes and altitudes, though a subset of species may exhibit reverse shifts to lower elevations and latitudes [5,6]. Species possess a limited capacity to adapt to climate change; however, if they cannot adapt or migrate to suitable habitats, some or even entire populations are at risk of extinction [7]. Therefore, investigating species distribution patterns enhances our understanding of how climate adaptation influences geographical ranges, providing a scientific foundation for biodiversity conservation and sustainable species management [2].
Species distribution models (SDMs), which utilize existing distribution data and environmental variables, are commonly employed to project species’ geographical patterns under climate change scenarios [8]. Among these frameworks, the Maxent model is widely recognized as a leading tool, leveraging machine learning principles and maximum entropy theory to estimate species’ potential geographic ranges [9]. Notably, even under conditions of poorly defined environmental relationships or sparse distribution data, Maxent enhances predictive accuracy, rendering it well-suited for species distribution modeling research [10]. While Maxent demonstrates robust performance in species distribution prediction, studies highlight that its default parameter settings can substantially influence outcomes. Thus, implementing the ENMeval package for parameter optimization effectively improves prediction precision [11].
Nitraria tangutorum is a hardy, drought-resistant shrub in the genus Nitraria of the Zygophyllaceae family, native and endemic to China [12]. This species exhibits exceptional resilience to harsh environmental conditions and robust regenerative capabilities. It has a well-developed root system and numerous branches, making it highly effective at stabilizing shifting sands and reducing wind speed. This species is a dominant and key constructive species in the arid desert regions of northwestern China, serving as an excellent plant for windbreak and sand-fixation purposes [13,14]. In addition to its exceptional ecological value, N. tangutorum also possesses significant economic and medicinal value [15]. Its fruit is referred to as the “desert cherry” due to its cherry-like color, shape, and flavor, and is rich in vitamins, amino acids, sugars, and trace elements [16]. Medicinally, it is used to strengthen the spleen and stomach, alleviate digestive disorders, and modulate blood pressure and glucose levels [12,17]. The leaves of N. tangutorum are high in protein and low in fiber, making them excellent forage with superior feed quality, suitable for advancing livestock farming [18]. Moreover, N. tangutorum acts as a host plant for the valuable medicinal species Cynomorium songaricum, further augmenting its economic significance [19]. However, projected climate changes and socio-economic developments may alter its distribution patterns. As a desert plant with pivotal ecological restoration value and promising economic potential, investigating climate change impacts on N. tangutorum’s distribution is critical for understanding resilient plant species’ dynamic responses to environmental shifts, underscoring the importance of this research.
Based on this, this study uses optimized parameters to construct the Maxent model, which investigates the main environmental factors influencing the distribution of N. tangutorum. It forecasts the geographical distribution of N. tangutorum under both current and various future climate scenarios, aiming to analyze the dynamic shifts in its suitable habitat. This research aims to develop effective conservation strategies that provide insight into the ecological adaptability of N. tangutorum and a basis for the rational use and protection of its germplasm resources.

2. Materials and Methods

2.1. N. tangutorum Distribution Point Collection

Geographical distribution data for N. tangutorum were obtained from the Global Biodiversity Information Facility (GBIF), the Chinese Virtual Herbarium (CVH), and the National Specimen Information Infrastructure (NSII), supplemented by field surveys and validated against the Flora of China and the relevant literature. To ensure data reliability, duplicate records and ambiguous data points were excluded. To reduce sampling bias and improve prediction accuracy, only one unique distribution point per 2.5′ × 2.5′ grid cell was retained [20]. The final dataset consisted of 154 species distribution points used in the model calculations (Figure 1).

2.2. Environmental Variable Screening and Processing

This study utilized 19 bioclimatic factors (bio1–bio19), 16 soil factors, and 3 topographic factors to develop species distribution models. Meteorological data were sourced from the World Climate Database (https://www.worldclim.org), covering three periods: the present (1970–2000), the future (2041–2060, 2050s), and the future (2081–2100, 2090s), with a spatial resolution of 2.5′. Projections of future climate conditions were derived from the BCC-CSM2-MR model, a component of the Coupled Model Intercomparison Project Phase 6 (CMIP6). The analysis incorporated four Shared Socio-economic Pathways (SSPs): SSP1-2.6, SSP2-4.5, SSP3-7.0, and SSP5-8.5 [21]. The BCC-CSM2-MR model has significantly improved the simulation of precipitation distribution in China and processes such as radiation budget, sea surface temperature, sea ice, stratospheric quasi-biennial oscillation (QBO), Atlantic meridional overturning circulation (AMOC), and Madden-Julian oscillation (MJO), enabling effective and accurate simulations of extreme temperature indices and trends in the region [22,23]. Soil factor data used in this study were obtained from the World Soil Database (https://www.fao.org/) at a spatial resolution of 2.5′. Environmental layers were converted to ASCII format using the SDMtoolbox plugin in ArcGIS 10.8 software [24].
To avoid multicollinearity among selected bioclimatic variables, which could cause model overfitting and result in unreliable species distribution predictions, the filtered N. tangutorum distribution data, along with standardized environmental variables in uniform format and resolution, were imported into the MaxEnt model. The model was run ten times to establish an initial model, and environmental variables with a contribution rate below 1% were excluded based on the averaged results. Subsequently, the correlation tool in ENMtools v1.4.4 software was used to analyze the relationships among the remaining environmental factors. When two environmental factors showed high correlation (|r| > 0.8), only the variable with the highest contribution rate was retained for model prediction [25]. Following these steps, fourteen environmental factors were finally screened.

2.3. Establishment, Optimization, and Evaluation of the MaxEnt Model

The performance of the MaxEnt model is highly contingent on parameter configuration, as different parameters significantly influence prediction outcomes. Feature Combination (FC) and Regularization Multiplier (RM) are critical parameters in this context. Optimizing these parameters aids in minimizing overfitting and substantially enhances the model’s predictive performance [26]. Parameter optimization via the ENMeval package in R v4.3.0 software reduces model complexity and overfitting, enabling more accurate predictions of species’ potential distribution areas [27]. The ENMeval v2.0.4 package was used to tune RM and FC parameters for the MaxEnt model [28]. The RM was set at eight levels ranging from 0.5 to 4.0, with 0.5 increments between levels. Six feature combinations were employed (H, L, LQ, LQH, LQHP, LQHPT), yielding 48 total combinations. Model accuracy and goodness-of-fit were evaluated using the Akaike Information Criterion (Delta.AICc). Model fit was assessed via the average difference between training-set AUC and test-set AUC (Avg.diff.AUC) and the mean value of the 10% training omission rate (Mean.OR10). The model with the lowest Delta.AICc value was selected as optimal [29].
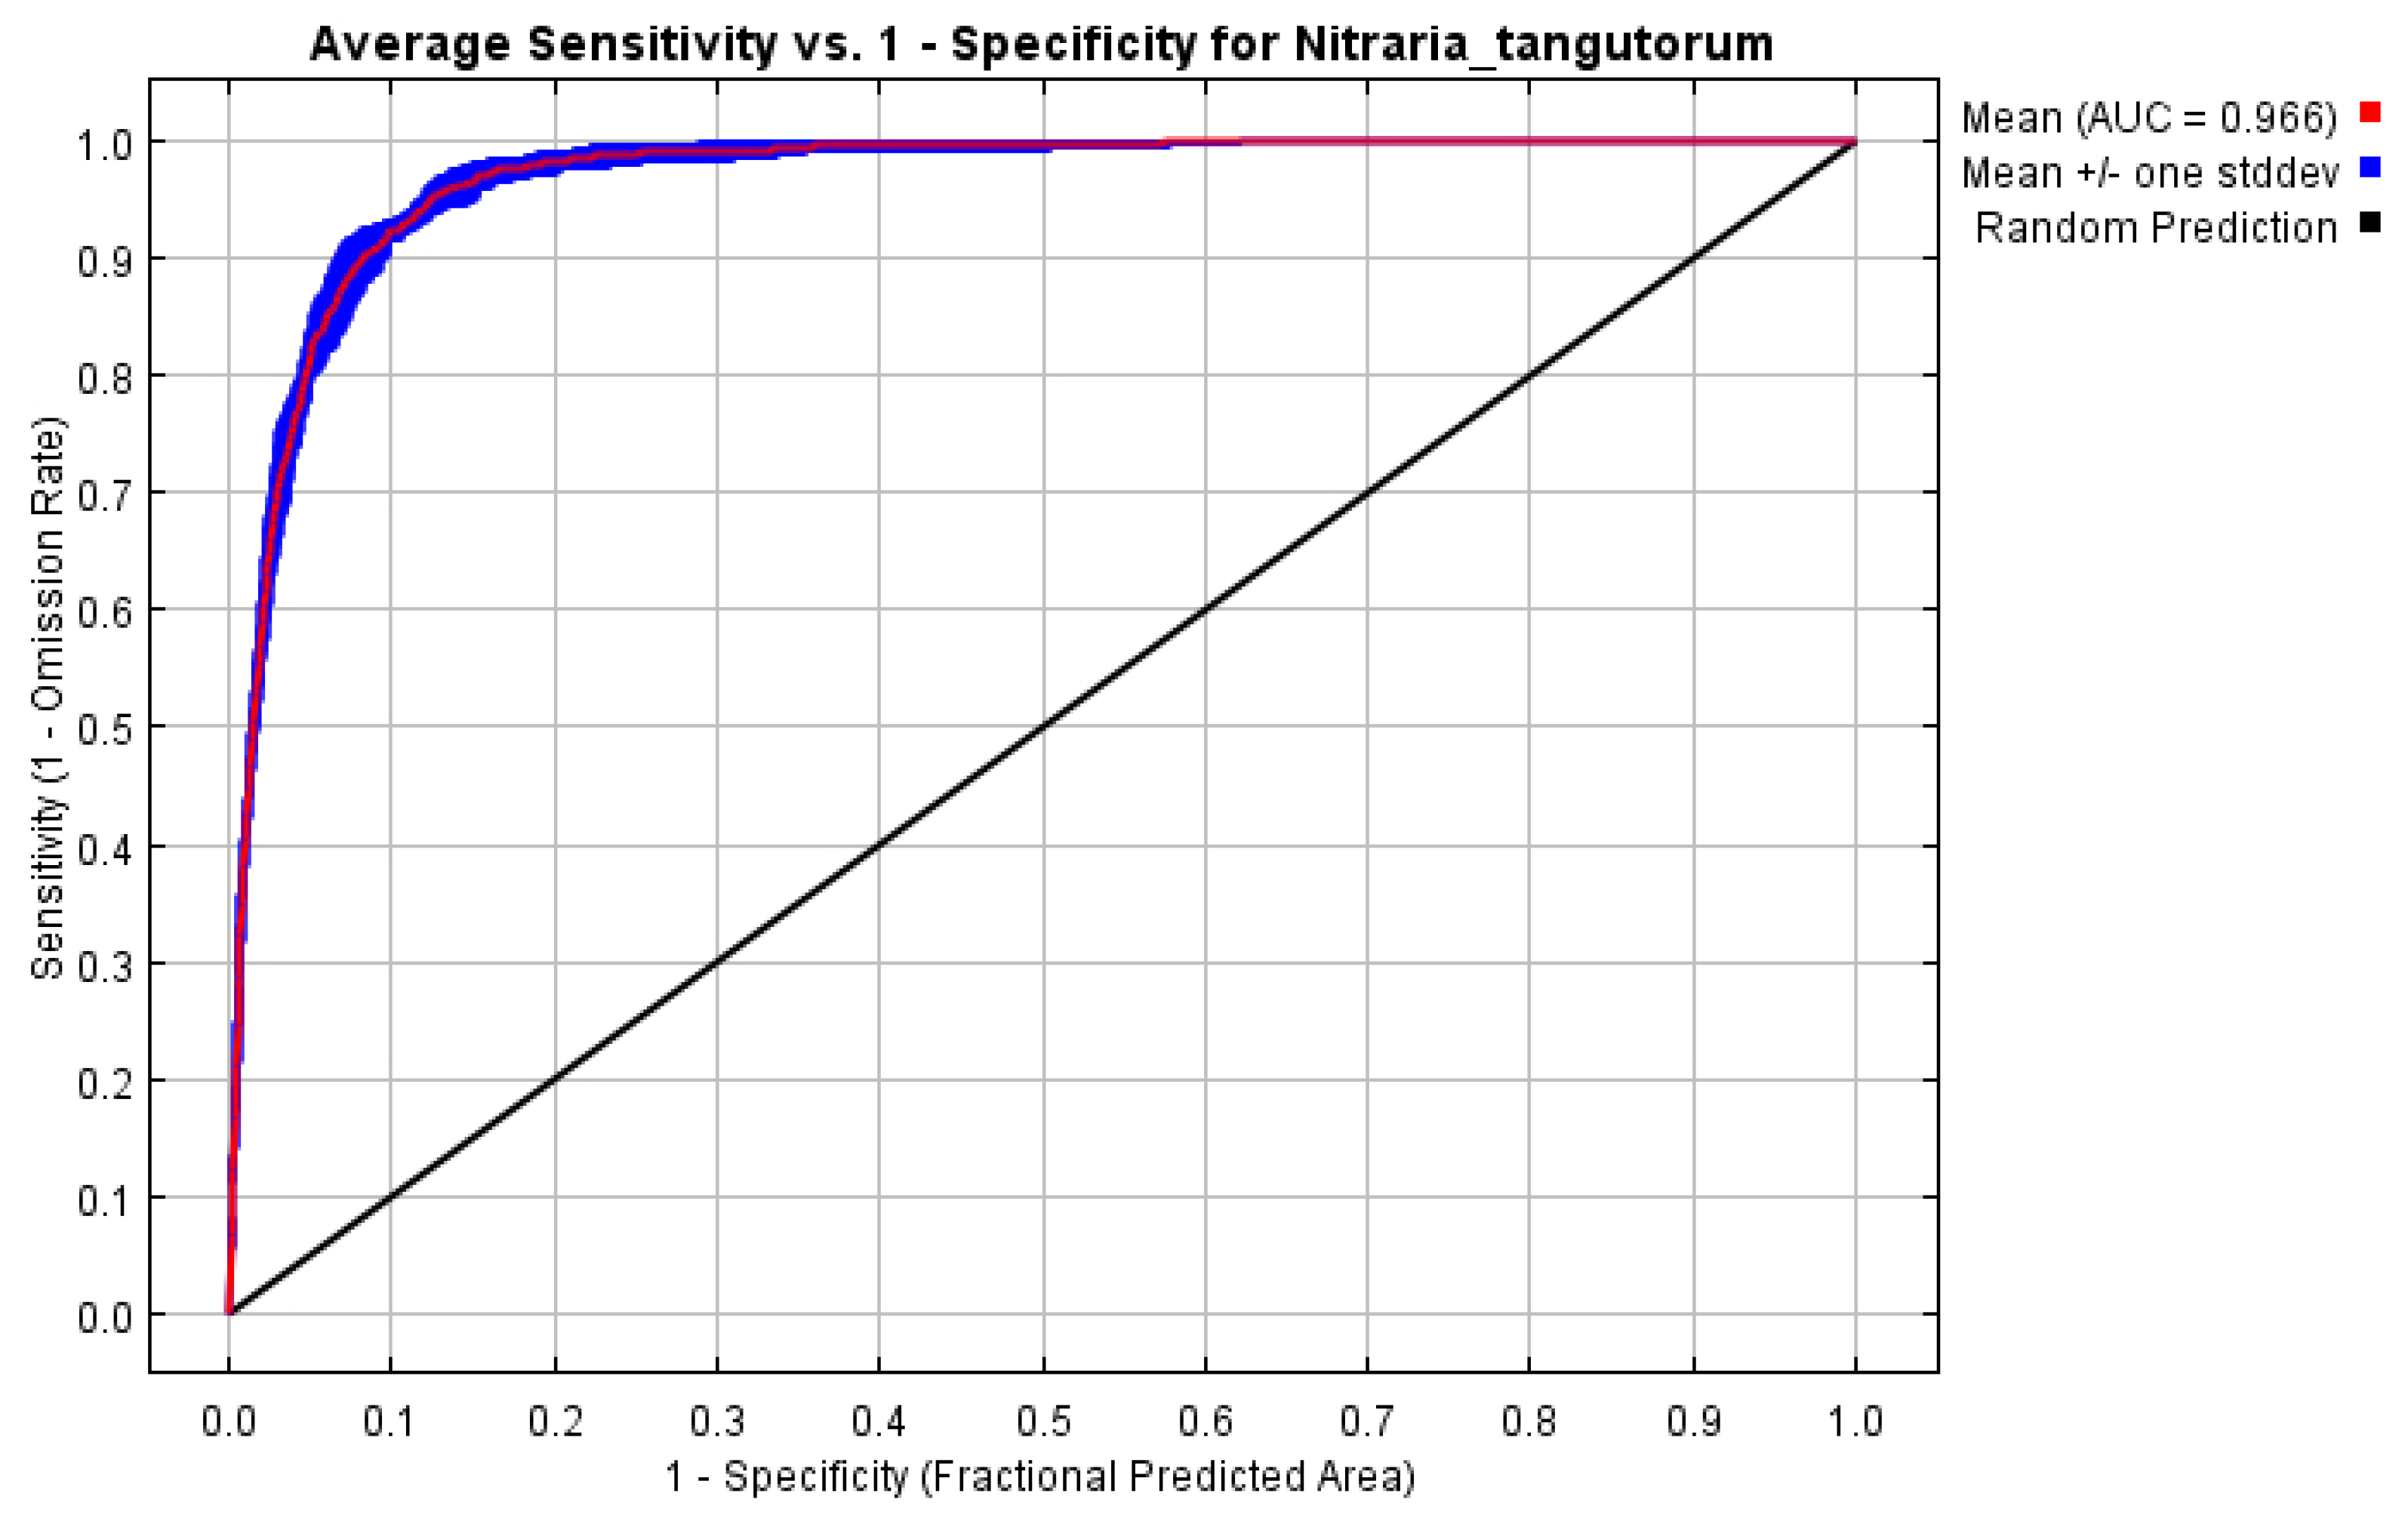
In this study, MaxEnt 3.4.1 was used to project the potential suitable habitats of N. tangutorum across different time periods. Selected environmental variables and species distribution data were input into the MaxEnt model, configured with the optimal parameter combination identified earlier. For model training, 75% of data was randomly selected as the training set, while 25% was reserved as the test set to validate predictive accuracy. The model was set to run for a maximum of 500 iterations with 10,000 background points. It was executed ten times using the Bootstrap method, with the average results recorded. To assess model performance, a Receiver Operating Characteristic (ROC) curve was generated, providing a measure of the model’s fit [30].
The Area Under the ROC Curve (AUC) value is unaffected by the threshold and serves as a quantitative measure for diagnosing the performance and strength of the model. Ranging from 0 to 1, higher AUC values indicate greater predictive accuracy [31]. Specifically, models with AUC ≤ 0.7 are considered unreliable; those with 0.7 < AUC ≤ 0.8 exhibit moderate predictive capability; 0.8 < AUC ≤ 0.9 signifies high accuracy; and AUC > 0.9 denotes exceptional predictive precision, enabling detailed characterization of species’ potential distributions [32].

2.4. Division of Potential Suitable Habitats for N. tangutorum

The output of the MaxEnt model was converted to a raster file in ArcGIS and then reclassified. Using the Natural Breaks classification method, suitability was divided into four categories: no suitability, low suitability, medium suitability, and high suitability areas. The proportion of each suitability zone was calculated using the raster layer attribute table in ArcGIS software, and the area of each category across different time periods was computed [33].

2.5. Centroid Migration of the Suitable Area

The dynamic shifts in suitability area centroids were analyzed using the SDMtoolbox v2.5 within ArcGIS v10.8. The “Centroid Changes (Lines)” tool was employed to compute a single centroid for each period’s sub-regions of N. tangutorum. Temporal variations in centroid locations reveal the migration trends and spatial shifts of the species’ suitable habitats [20].

3. Results

3.1. Model Optimization Results and Evaluation

To minimize the risk of model overfitting and ensure accurate predictions, this study utilized the ENMeval package to conduct cross-validation on the RM and FC (Table 1). A MaxEnt model was developed using 14 environmental variables and 154 N. tangutorum distribution points to simulate potential distribution areas. Setting default parameters (RM = 1, FC = LQHP) yielded a Delta.AICc value of 967.58, whereas optimized parameters reduced Delta.AICc to 0, with lower Mean.OR10 and Avg.diff.AUC values compared to the default model. These results indicate improved model performance, leading to the selection of the optimized parameter combination (RM = 3, FC = LQHPT) for final modeling based on the Akaike Information Criterion.
The optimal parameters were used in the MaxEnt model to perform ten simulations of the potential suitable habitats of N. tangutorum. The training AUC and test AUC of the model were calculated based on the ROC curve (Figure 2). The test AUC values ranged from 0.963 to 0.9687, with an average of 0.9662 ± 0.0018. Training AUC values spanned 0.895 to 0.9715, averaging 0.951 ± 0.0223. Collectively, these results demonstrate the model’s high predictive accuracy and robust reliability, confirming its suitability for characterizing species distribution dynamics.

3.2. Key Environmental Variables Affecting the Distribution of N. tangutorum

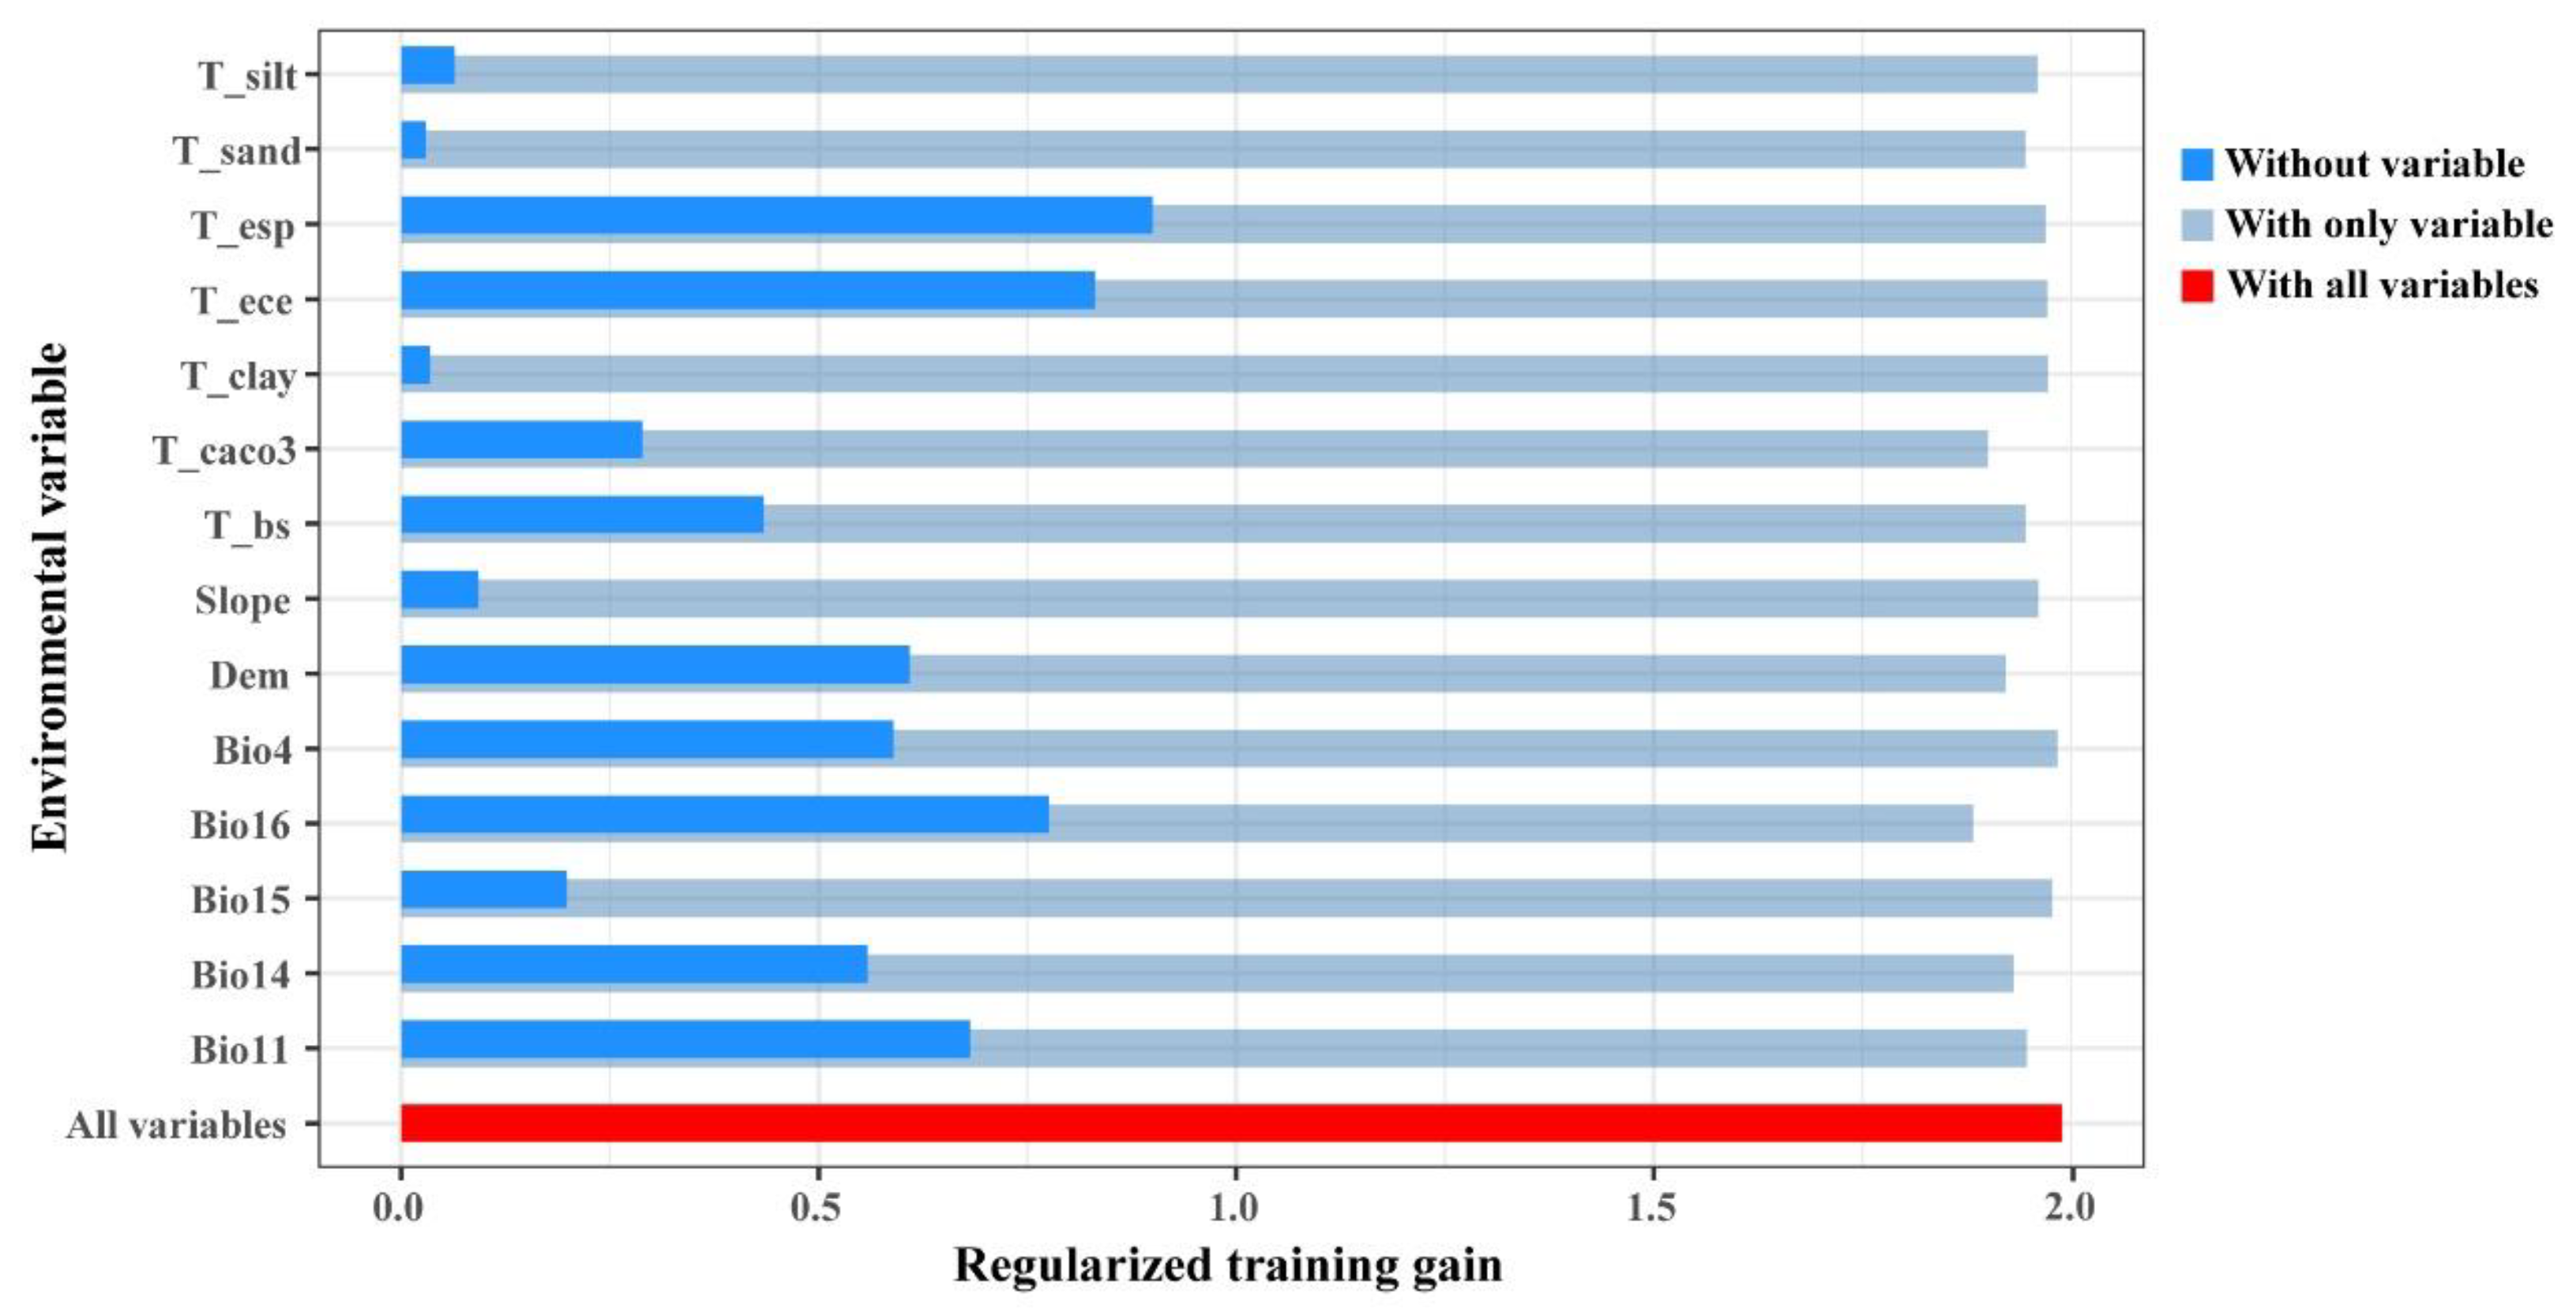
The influence of environmental variables on N. tangutorum suitable habitat distribution was evaluated through a comprehensive analysis of variable contribution rates and Jackknife test results. Contribution rate rankings identified the top five variables as Bio16, T_esp, T_ece, T_CACO3, and Bio14, collectively accounting for 71.4% of total contribution (Table 2). Among topographic factors, only DEM significantly impacted natural N. tangutorum distributions. Permutation importance—calculated by randomly permuting variable values in background training data—measures dependency strength, where higher values indicate greater influence. The top five variables by permutation importance contributed a cumulative 72.3% to model predictions. Overall, these results highlight precipitation and soil factors as primary drivers of N. tangutorum distribution patterns.
The Jackknife test indicated that the environmental variables T_esp, T_ece, Bio16, Bio11, and DEM had the most significant impact on regularized training gain when used individually. This suggests that these environmental variables contain unique information not captured by other variables and play a crucial role in determining the distribution of suitable habitats for N. tangutorum (Figure 3).
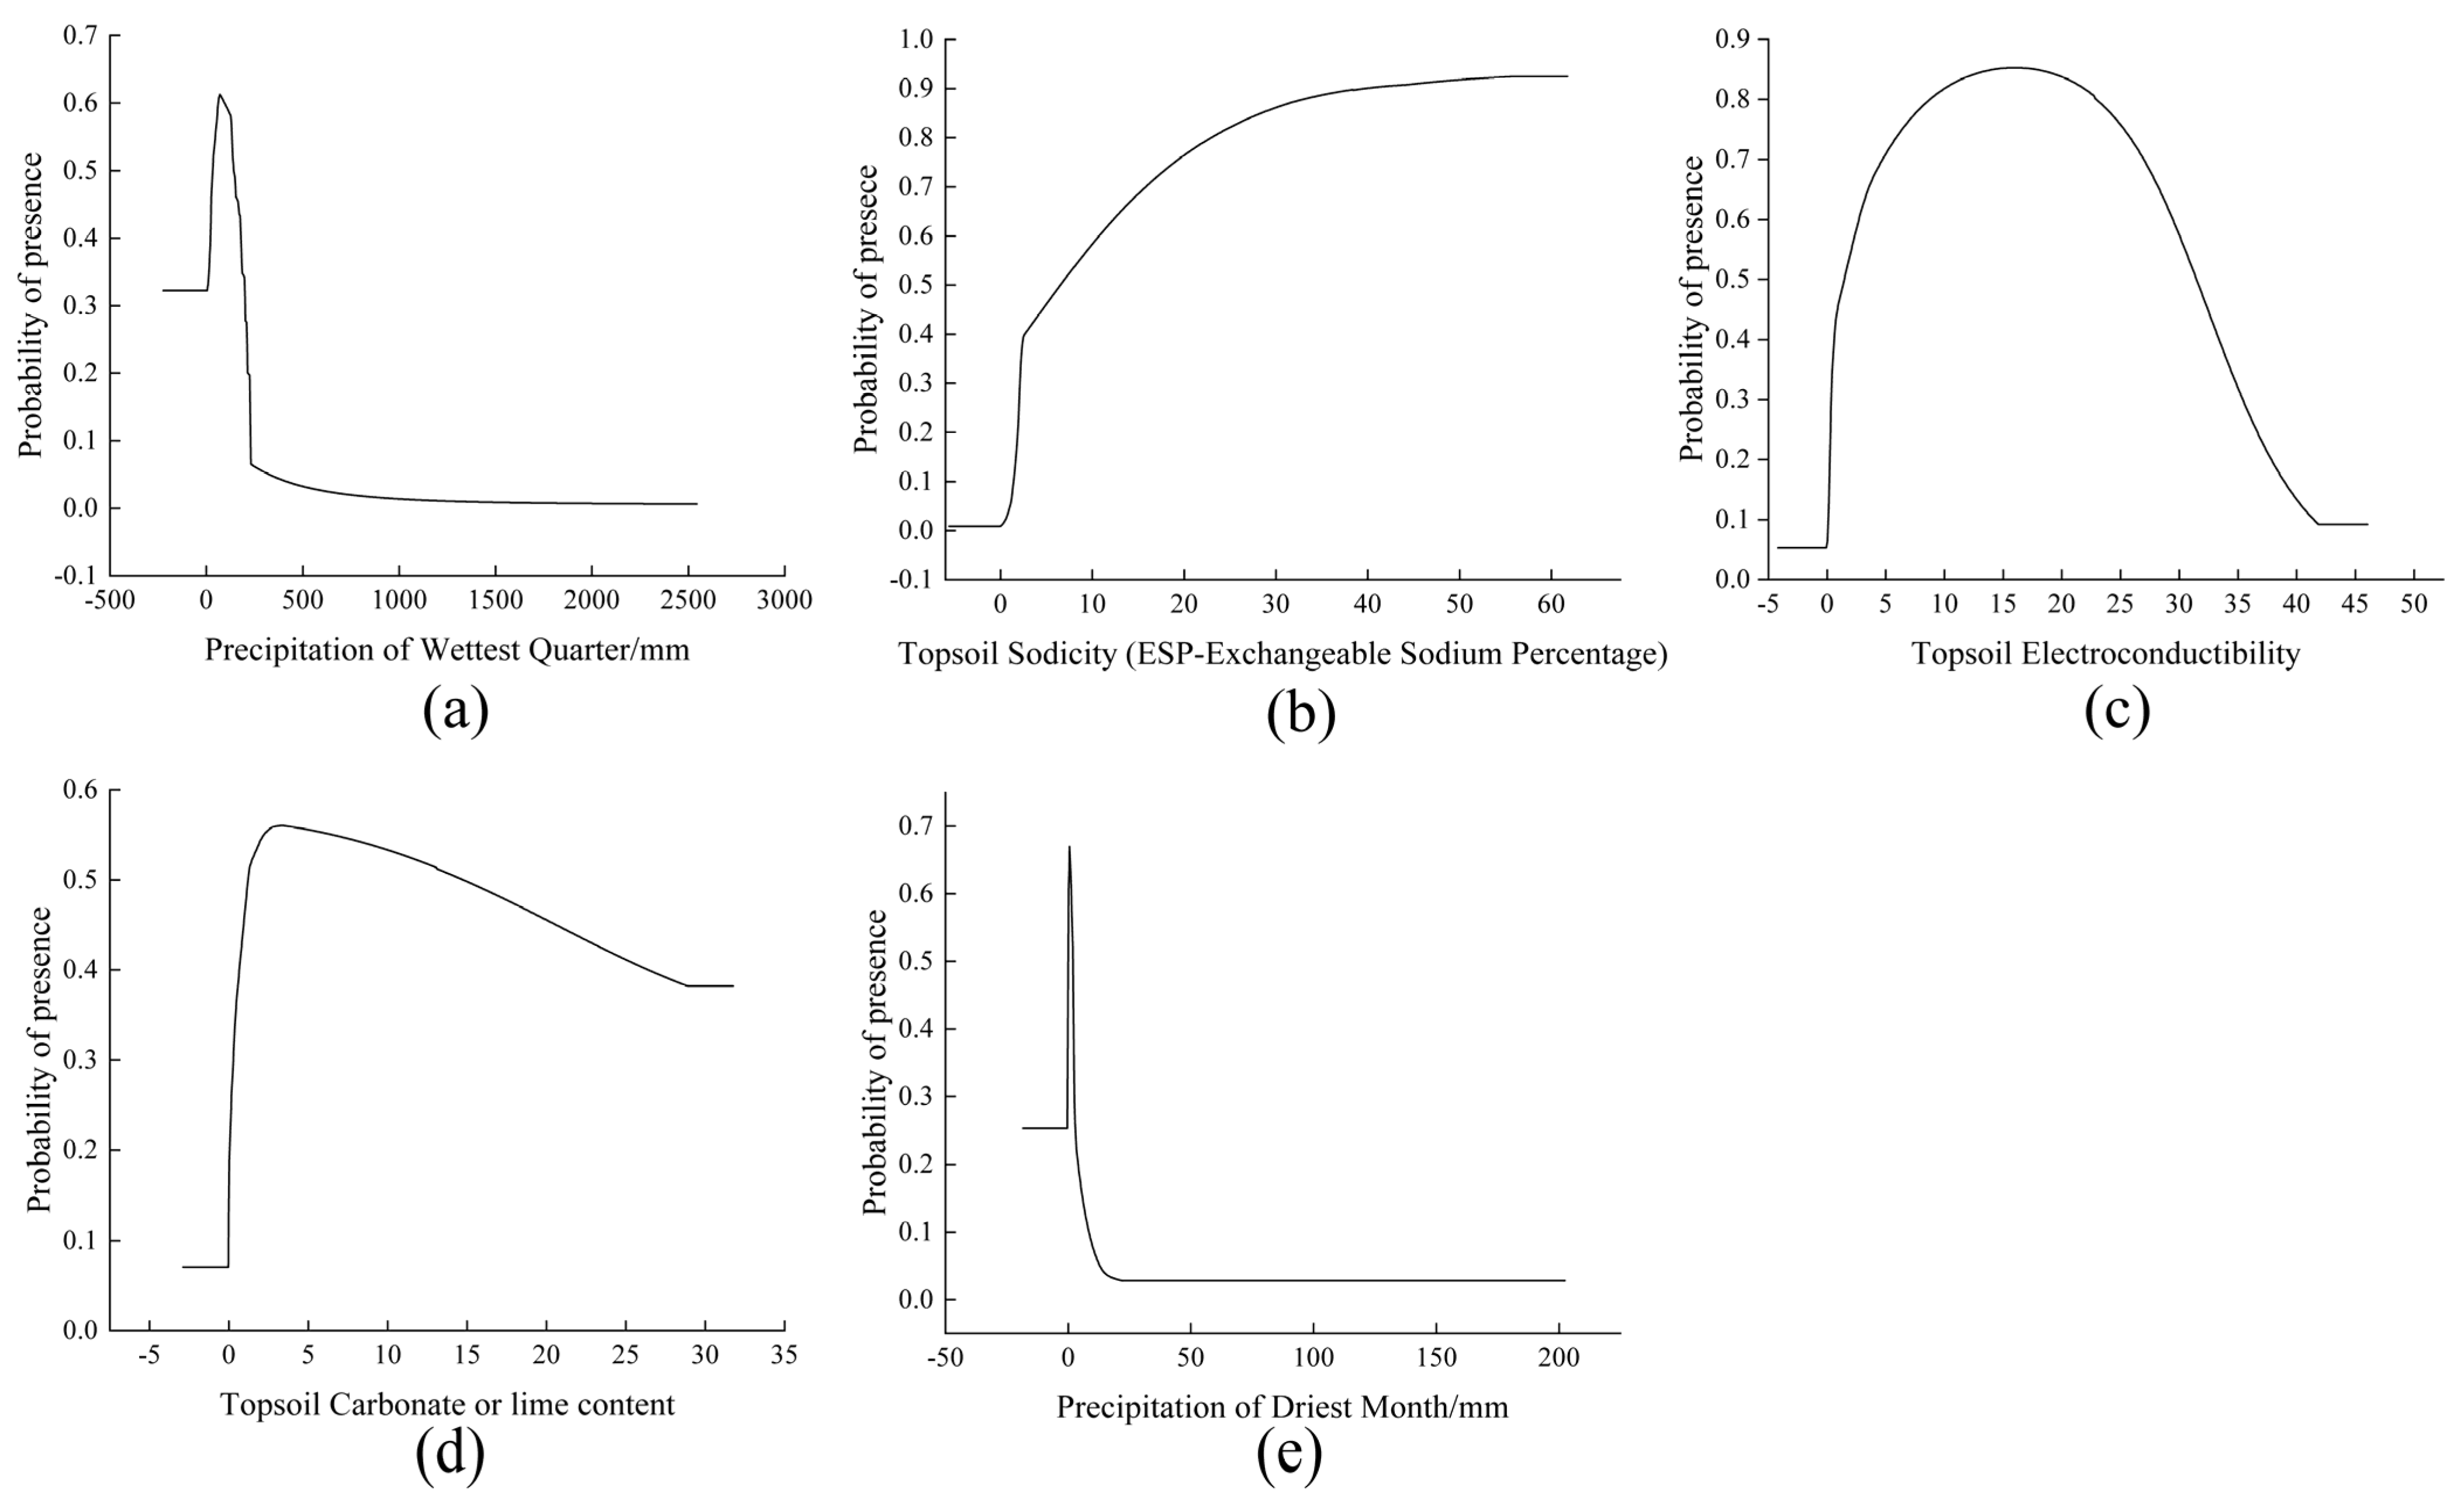
Plotting response curves for environmental variables clarifies the relationship between each factor and species distribution probability, facilitating the determination of N. tangutorum’s potential habitats. Among the variables included in the model, Bio16, T_esp, T_ece, T_CACO3, and Bio14 emerged as the most influential determinants of distribution, with their response curves shown in Figure 4. For all variables except T_esp, the probability of N. tangutorum occurrence increases with rising variable values, reaching a peak before declining as conditions exceed optimal thresholds. Within a specified interval, occurrence probability exhibits a positive correlation with T_esp, characterized by an initially steep increase followed by a gradual slowdown in growth rate. These results reinforce that precipitation (Bio16, Bio14) and soil properties (T_esp, T_ece, T_CACO3) are primary environmental drivers shaping N. tangutorum’s distribution patterns. Furthermore, using probability thresholds of 0.3 and 0.5 for the suitable habitat of N. tangutorum as criteria, suboptimal and optimal values for the dominant environmental variables were derived (Table 3). When environmental variable values fall within predefined optimal thresholds, the area is considered to satisfy the optimal growth conditions for N. tangutorum germplasm resources. The optimal threshold values (p > 0.5) for each environmental variable are as follows: Bio16 (34.17–139.32 mm), T_esp (6.58–61.74%), T_ece (1.49–31.43 dS·m−1), T_CACO3 (1.20–14.71%) and Bio14 (0.15–1.91 mm).

3.3. The Current Suitable Habitat Distribution of N. tangutorum

Following the optimization and implementation of the MaxEnt model, the potential suitable habitats for N. tangutorum under current climate conditions were predicted (Figure 5). The figure indicates that high-suitability areas for N. tangutorum are predominantly distributed in northwestern China, encompassing central and western Gansu, central and western Inner Mongolia, the Qaidam Basin in Qinghai, central and western Xinjiang, and central-northern Ningxia. The total area is 24.21 × 10⁴ km2, accounting for 12.72% of the total suitable area. Medium-suitability areas are primarily located in central Inner Mongolia, south-central Gansu, northern and southern Xinjiang, and parts of Tibet, with a total area of 57.73 × 10⁴ km2, comprising 30.34% of the total suitable area. Low-suitability areas are mainly found in Inner Mongolia, Xinjiang, and northern Shanxi, with scattered regions in Tibet, totaling 108.35 × 10⁴ km2, which accounts for 56.94% of the total suitable area. The model projections show that the predicted suitable habitats for N. tangutorum are concentrated in the arid and semi-arid zones north of the 400 mm annual precipitation line. The predicted potential distribution area is larger than the actual occurrence data of N. tangutorum, suggesting that under current climate conditions, these regions are suitable for the survival of N. tangutorum. If introduced and cultivated in these areas, the survival probability of N. tangutorum would be relatively high.
Upon comparing the actual distribution points of N. tangutorum with the predictions of potential distribution under current climate conditions, it becomes evident that over 80% of the effective distribution points fall within the medium and high suitability areas. This observation validates the relative accuracy of the model predictions.

3.4. The Future Suitable Habitat Distribution of N. tangutorum

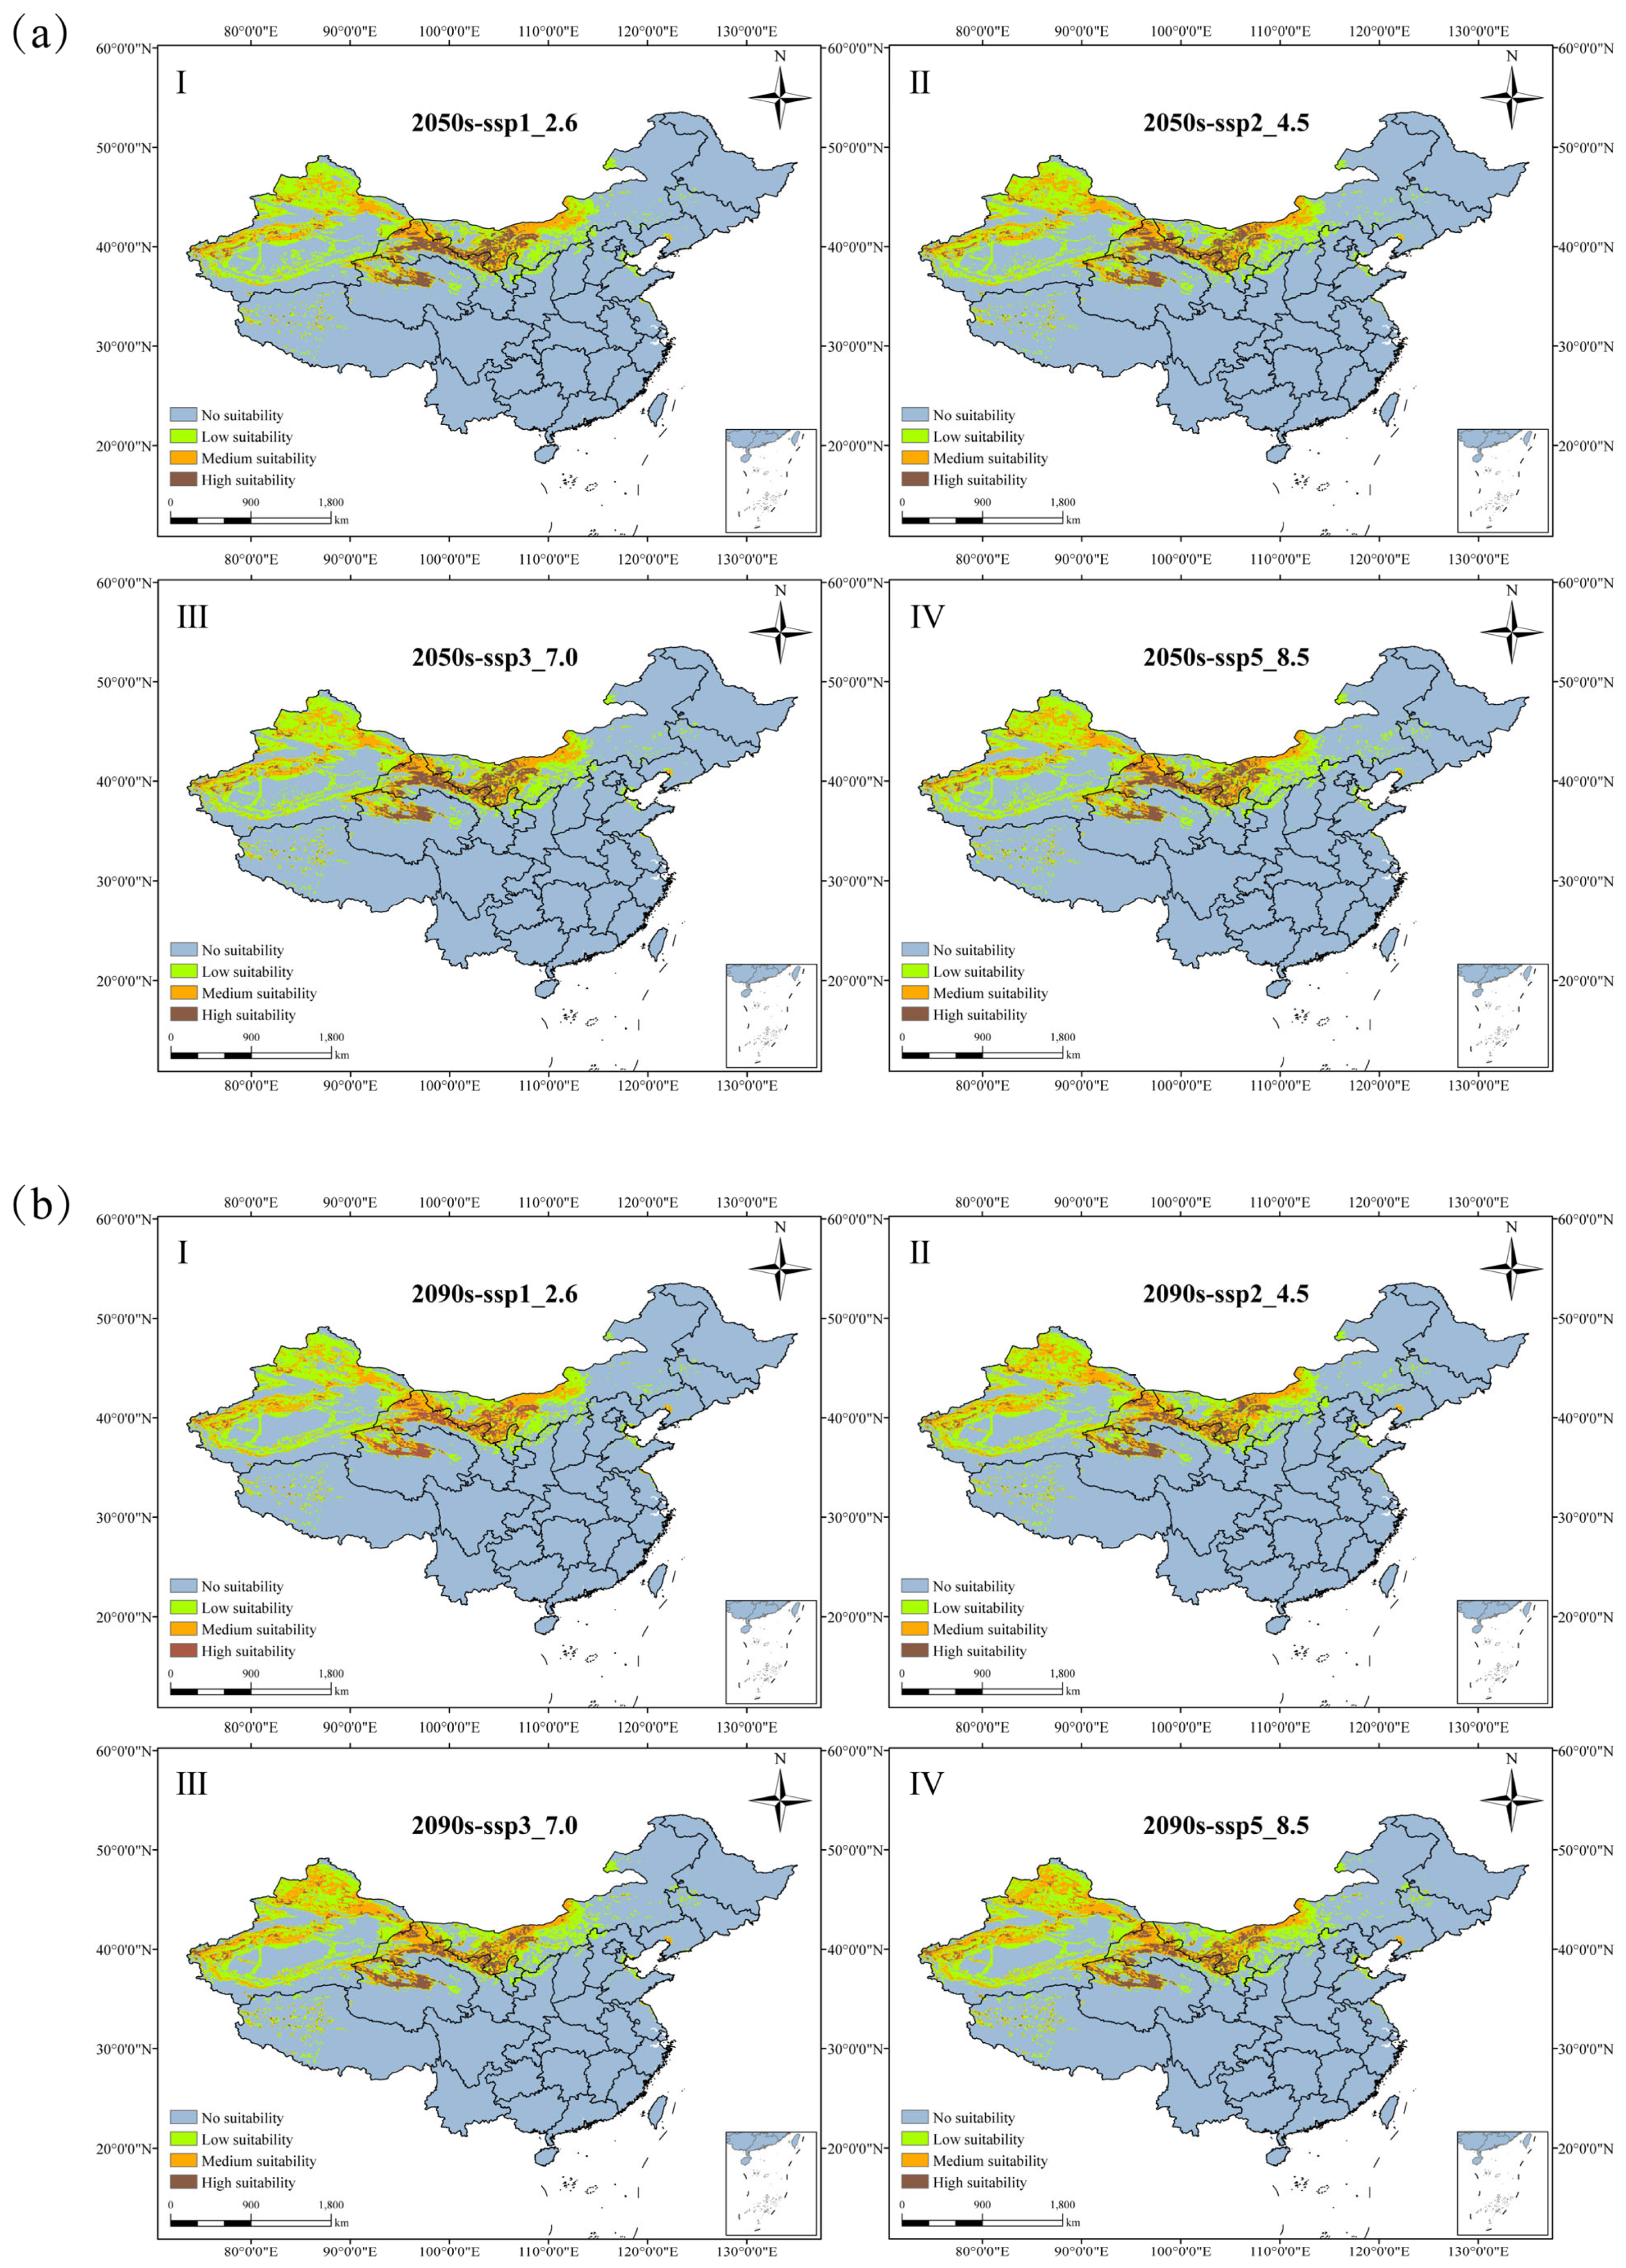
This investigation employs the MaxEnt modeling framework to forecast the prospective geographical distribution of N. tangutorum across four distinct future climatic scenarios, namely SSP216, SSP245, SSP370, and SSP585. The spatial delineation of potential habitats that are considered suitable is depicted in Figure 6, whereas the variations in the extent of habitat areas for each category are detailed in Table 4.
Comparing predicted habitat distributions of N. tangutorum under different future climate scenarios reveals divergent responses, with distinct trends in suitable area shifts. Under 2090s SSP370 and SSP585 scenarios, suitable habitat area is projected to expand relative to the current period, with expansion rates of 1.18% and 2.50%, respectively. In contrast, other future scenarios predict varying degrees of contraction. Across 2050s carbon emission scenarios, total suitable habitat area exhibits a declining trend compared to the present: projected reductions of 49,409 km2, 40,260 km2, 54,740 km2, and 16,145 km2 occur under respective scenarios. Relative to the 2050s, the 2090s see a 65,226 km2 reduction under SSP126, while SSP245, SSP370, and SSP585 scenarios drive increases of 25,834 km2, 77,171 km2, and 63,663 km2, respectively.
Under various emission scenarios for the 2050s and 2090s, the high suitability habitat area generally increases, except for a reduction under the 2090s-SSP126 scenario, which is characterized by a decrease of 14,513 km2 relative to the current period. The largest increase occurs under the 2050s-SSP245 scenario, with an expansion of 13.11%. The area of low suitability habitats in future periods is generally lower than the present period. However, the area changes in the 2050s under various scenarios are smaller compared to the 2090s. The most significant reduction occurs under the 2090s-SSP585, with a decrease of 66,614 km2.
There are different patterns of changes in the size of the medium suitability area under the future scenarios. In the 2050s, the area first decreases, reaching its lowest point under the 2050s-SSP370 at 53.87 × 10⁴ km2. Subsequently, during the 2090s, as the greenhouse effect intensifies, the area of medium suitability area gradually increases, reaching its highest value under the 2090s-SSP585 at 65.72 × 10⁴ km2.
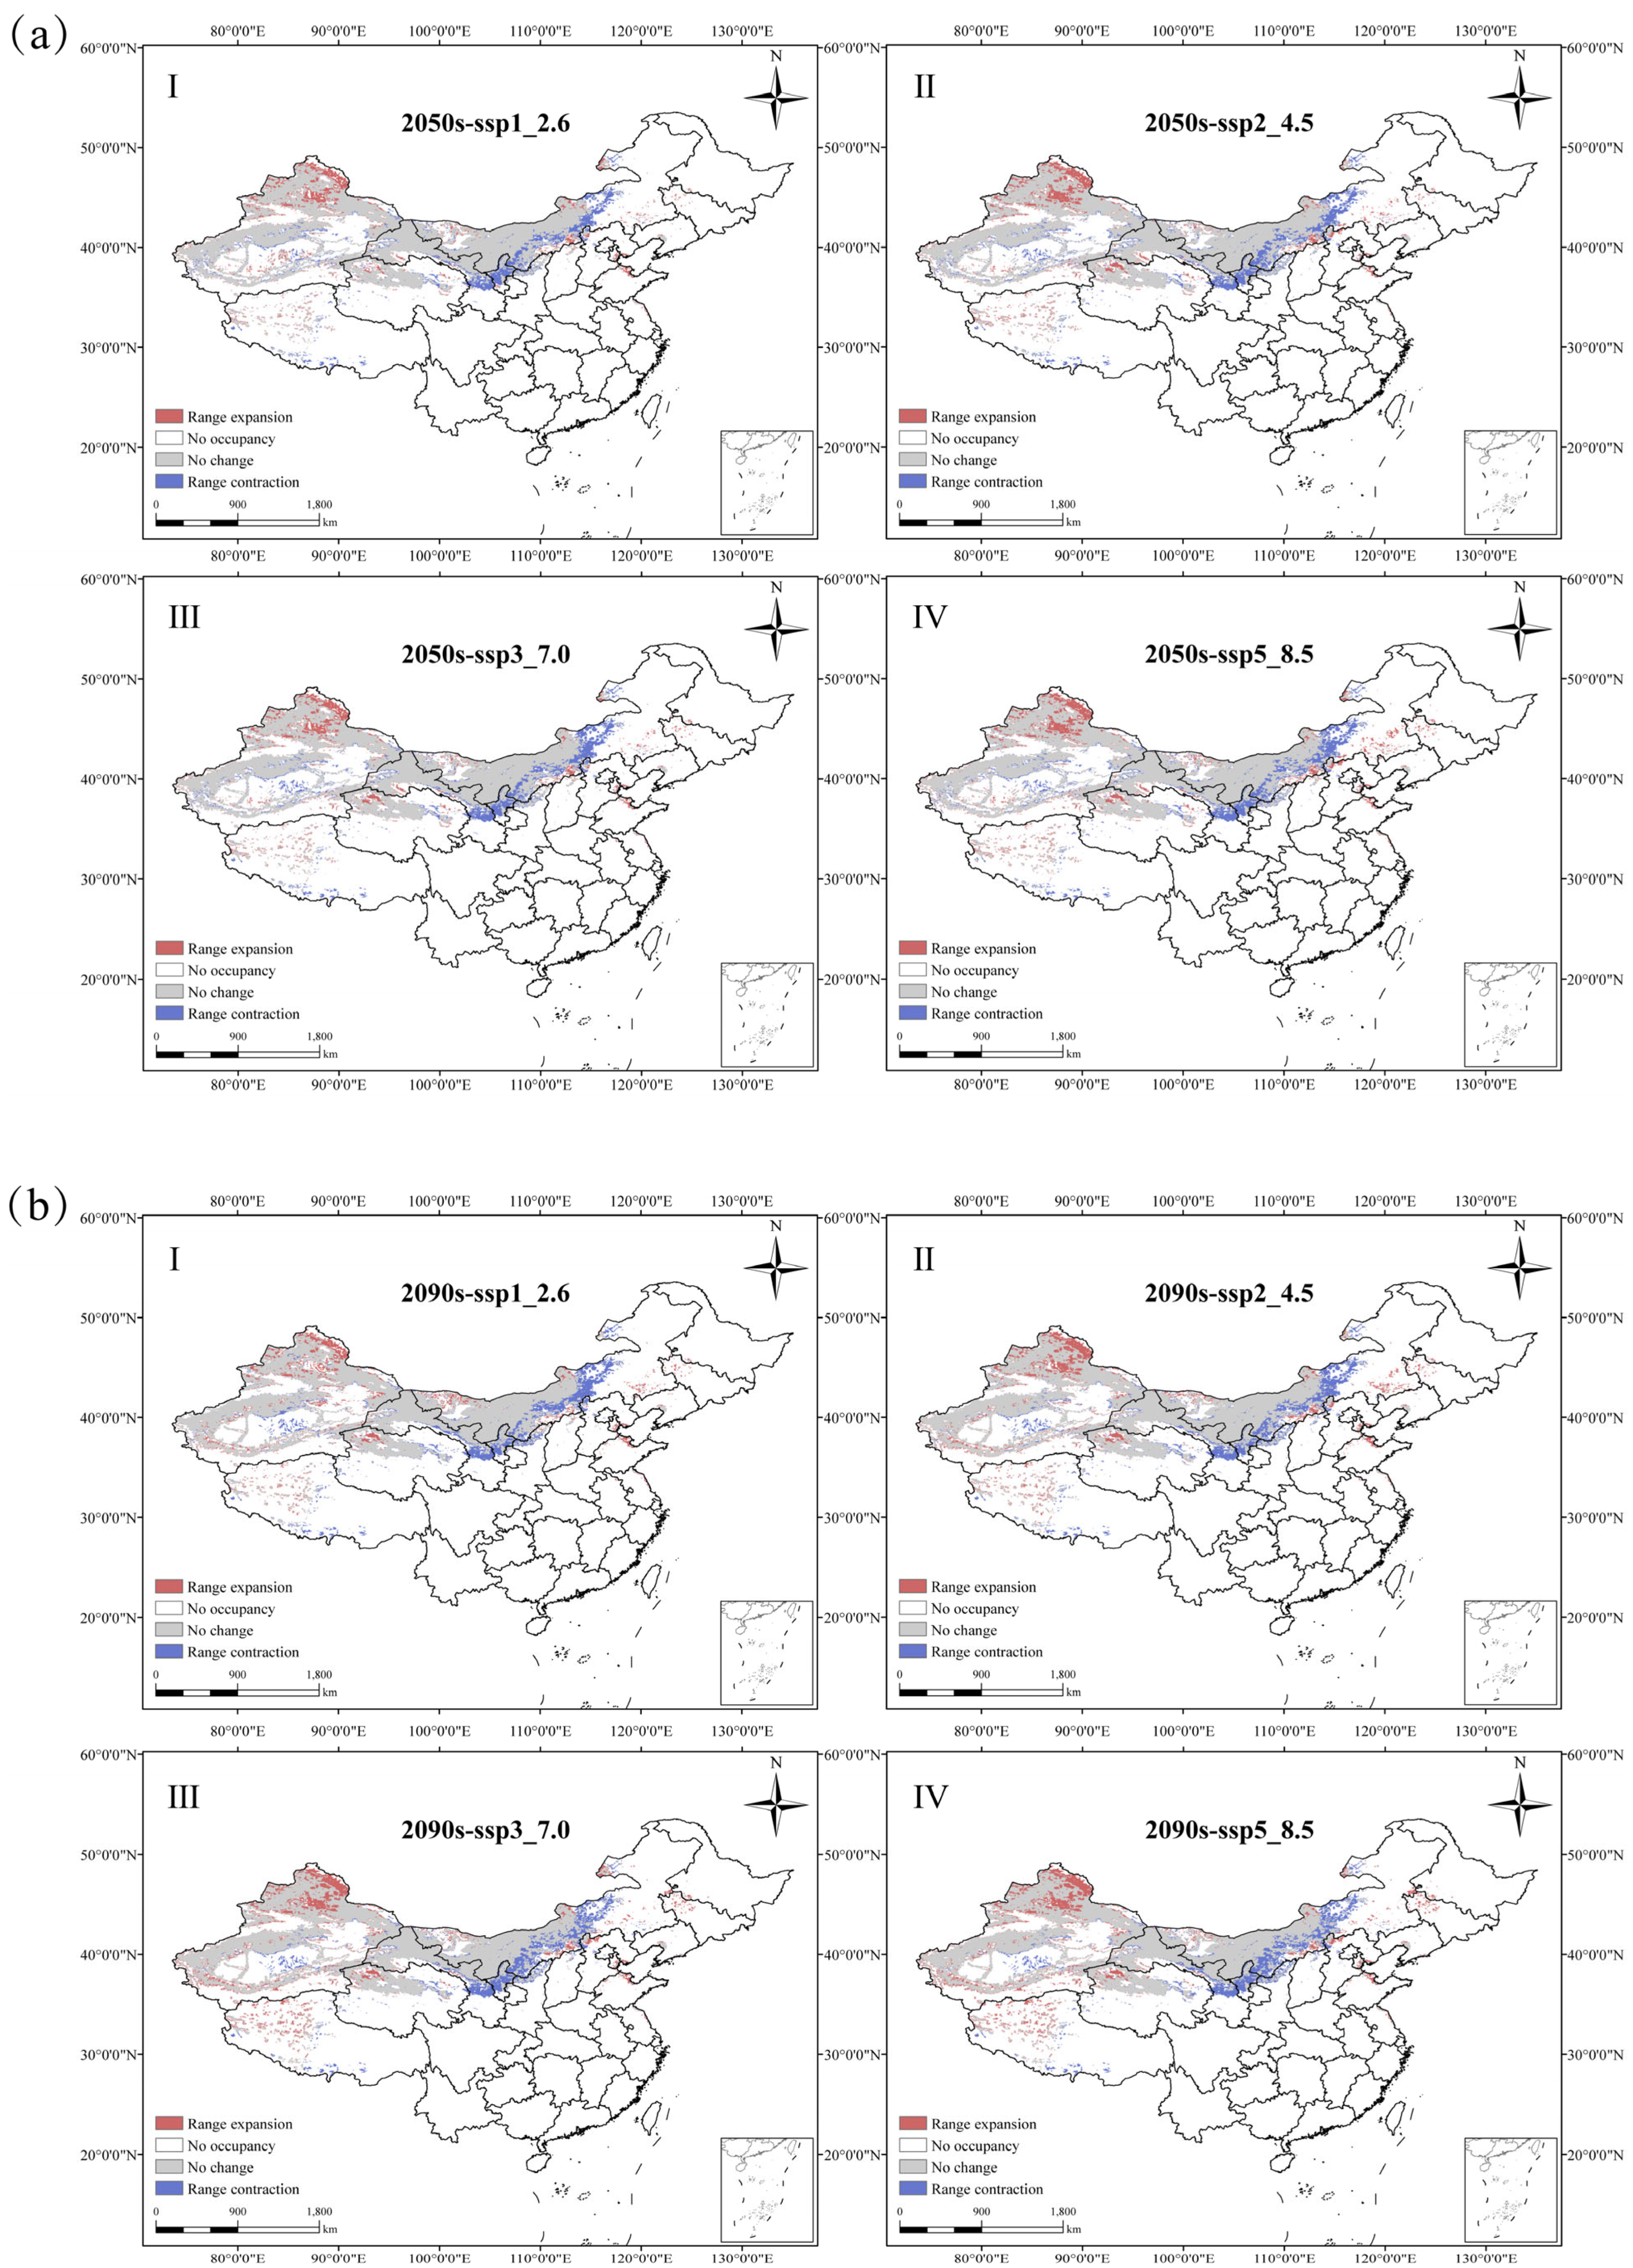
Analysis of the spatial pattern changes in N. tangutorum habitats under different future climate scenarios (Figure 7, Table 5) indicate that a majority of the current suitable habitats are maintained. Habitat retention rates remain within a narrow range of 79.41% to 80.85%, indicating remarkable stability amid climate fluctuations. These stable areas are predominantly concentrated in the Xinjiang, Inner Mongolia, Ningxia, Gansu, and Qinghai provinces. In the 2050s, retention rates of suitable habitats fluctuate between 79.42% and 80.85%, exhibiting a trend of initial decline followed by a slight increase. With rising emission levels, the area of contraction for suitable habitats consistently exceeds the area of expansion. The lost suitable habitats are primarily distributed in the southern part of Inner Mongolia, the central region of Ningxia, and the central areas of Gansu.
In the 2090s, under the SSP370 and SSP585 scenarios, the contraction rate of suitable habitats is greater than the expansion rate. In other periods, the contraction rate is consistently less than the expansion rate. During this period, the main areas of expansion are concentrated in northern Xinjiang and northern Qinghai. It is noteworthy that in the future, more suitable habitats for N. tangutorum are expected to emerge along the western coastal region of the Bohai Sea.

3.5. Centroid of Suitable Area of N. tangutorum Under Present and Different Future Climate Scenario

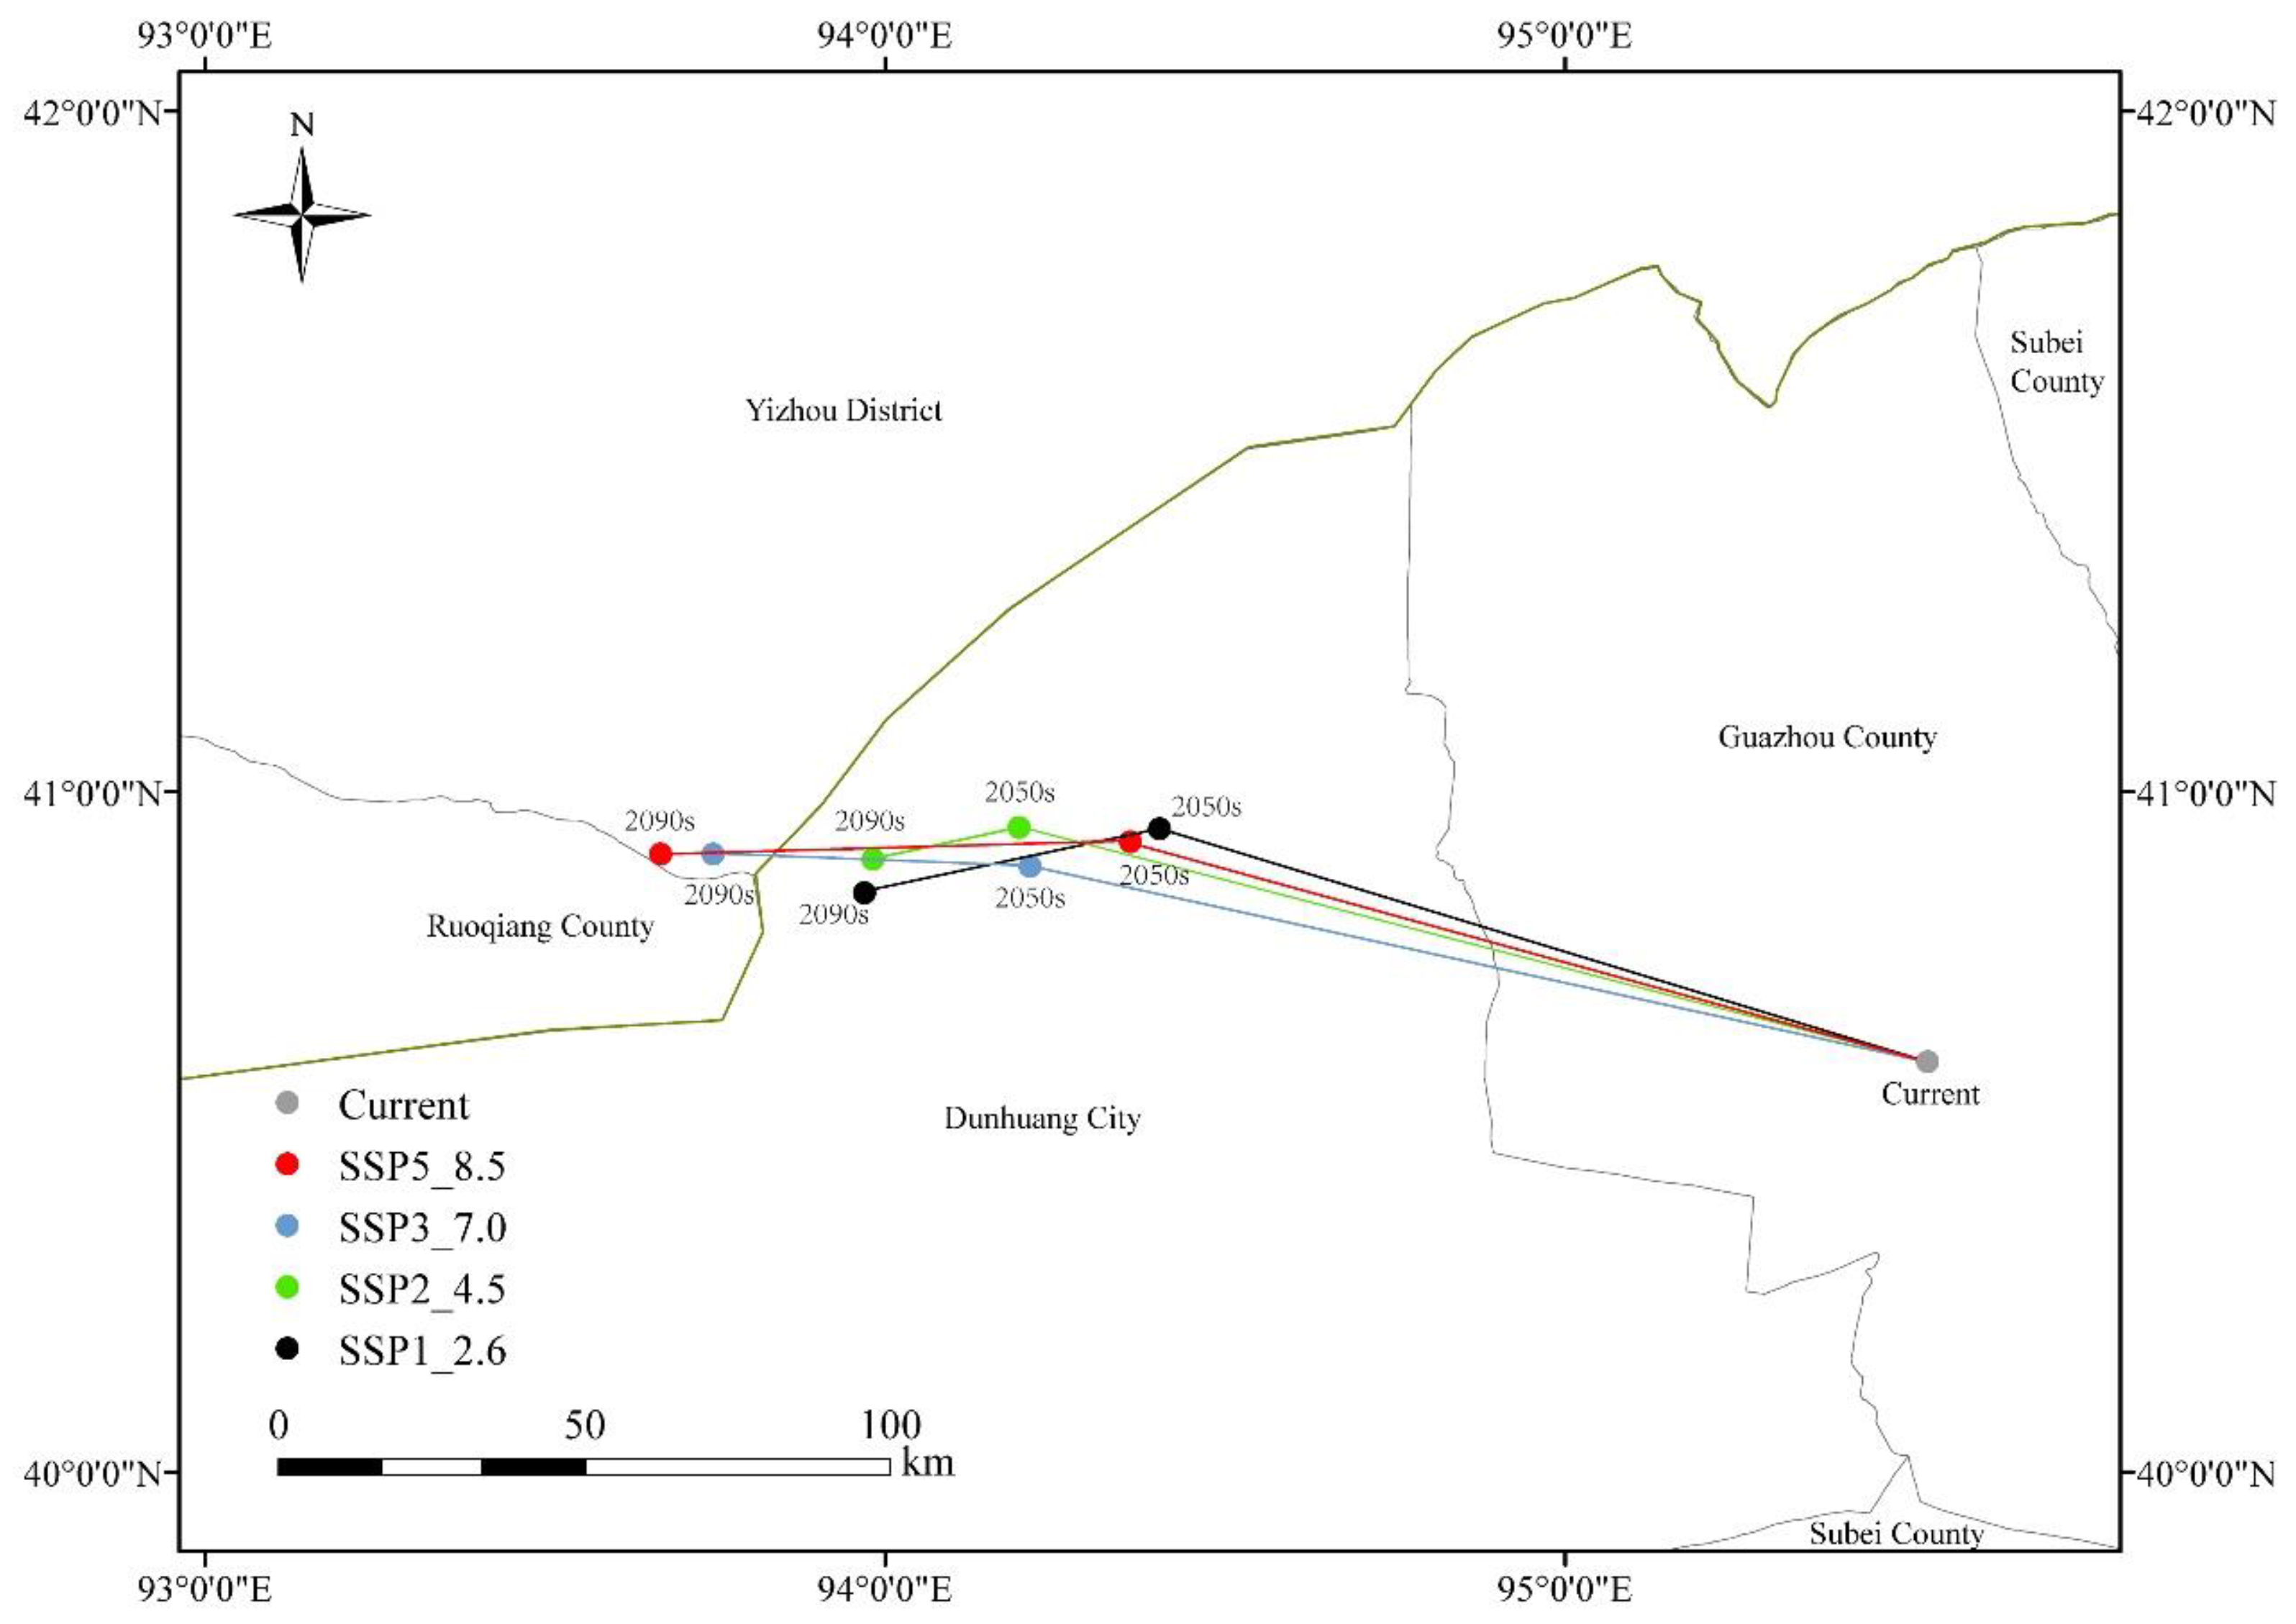
As illustrated in Figure 8, ArcGIS software was employed to calculate the centroid of N. tangutorum’s suitable habitat under current and future climate scenarios, enabling analysis of centroid shift direction and distance. Overall, the centroid of the suitable habitat for N. tangutorum tends to shift westward under future climate scenarios as carbon emission concentrations increase, although the extent of this movement varies. The results indicate that under the current climate conditions, the centroid of N. tangutorum is located in Guazhou County, Jiuquan City, at coordinates 95.5324° E, 40.6036° N. Under the SSP126 scenario, by 2050, the centroid of N. tangutorum migrates 102.5 km northwest to Dunhuang City (94.4032° E, 40.946° N). By the 2090s, it continues to shift southwest by 38.02 km to 93.9691° E, 40.8512° N. The migration trend of the centroid under the SSP245 scenario is similar to that under SSP126, remaining within the Dunhuang City area. However, the migration distances differ. By the 2050s, the centroid shifts to 94.1965° E, 40.9479° N. By the 2090s, it further migrates to 93.9817° E, 40.9009° N, with a distance of 18.8 km between the two points. Under the SSP380 and SSP585 scenarios, as time progresses, the centroid initially migrates northwest and then shifts westward by the 2090s. Both centroids are located in Yizhou District, Hami City, Xinjiang, at coordinates 93.74663° E, 40.90884° N and 93.66997° E, 40.90806° N, respectively. Among all scenarios, the most significant migration distance occurs under the 2090s-SSP585 scenario, where the centroid shifts 160.67 km compared to its position in the current period.

4. Discussion

4.1. Accuracy Analysis of the Optimized Model

In this study, we used the optimised MaxEnt model combined with ArcGIS software, incorporating 154 distribution records of N. tangutorum and 14 environmental variables, to simulate the potential distribution areas of the species in China in the current and future periods. Evaluating species distribution with default parameters can result in overfitting and increased complexity, thereby reducing the accuracy of prediction results. This often manifests as significant fluctuations in the response curves of environmental factors [34]. Optimizing the MaxEnt model with the ENMeval package solves these issues by determining the optimal parameter configuration, effectively matching species distribution data with environmental variables for more reliable predictions. The resulting environmental variable response curves align with Shelford’s law of tolerance, effectively preventing overfitting [35]. Optimal MaxEnt model parameters were identified based on species characteristics and data structure. Generally, when the Regularization Multiplier (RM) ranges from 2 to 4, the model yields optimal performance, which aligns with our study’s optimal RM value of 3 [31,36]. ROC curve analysis revealed that all period-specific predictions for N. tangutorum exhibited AUC values exceeding 0.9, underscoring the model’s excellent predictive capability and high reliability. The potential suitable habitats of N. tangutorum under present climate conditions are mainly distributed in Gansu, Xinjiang, west-central Inner Mongolia, Qinghai, and Ningxia. The predicted results closely align with field survey data, further validating the reliability of the model’s predictions.

4.2. Effects of Environmental Variables on N. tangutorum Distribution

Based on the MaxEnt model’s contribution percentage, permutation importance, and Jackknife test results, the key environmental variables influencing the distribution of N. tangutorum include Precipitation of Wettest Quarter (Bio16), Topsoil Sodicity (T_esp), Topsoil Electroconductibility (T_ece), Topsoil Carbonate or Lime Content (T_CACO3), and Precipitation of Driest Month (Bio14). In the model construction, the total contribution rate of precipitation-related factors is 41.3%, while soil-related factors account for 40.8%. These findings underscore the significant role of both precipitation and soil characteristics as key limiting factors influencing the present distribution of N. tangutorum. This is consistent with the findings for other drought-resistant plants, such as Tamarix taklamakanensis and Reaumuria kaschgarica, where precipitation is also the primary climate-related limiting factor [37,38]. It was shown that precipitation during the wettest season typically determines topsoil moisture, which influences rapid root system growth in plant seedlings and thereby affects the survival of N. tangutorum seedlings [39]. Precipitation significantly affected the growth of N. tangutorum populations in Minqin County, a high-suitability habitat area. Annual precipitation of approximately 110 mm in the peripheral region of Minqin Oasis was found to maintain their normal growth and development, which aligns with the results of this study [40].
As a highly xerophytic plant, N. tangutorum has a higher probability of survival when precipitation of driest month, demonstrating a strong adaptation to arid environments [41]. In the main distribution areas of N. tangutorum such as the Qaidam Basin, Tengger Desert, and Ulan Buh Desert, dry conditions are common in late winter to early spring. As plants shift from dormancy to active growth during this period, their cold resistance decreases. Excessive precipitation during this time can affect the growth and development of N. tangutorum. As a result, the precipitation of driest month (Bio14) significantly contributes to the delineation of its suitable habitats. This highlights N. tangutorum’s unique adaptation to arid environments and explains why it has become a dominant species in the arid regions of northwestern China [38].
Topsoil Sodicity (ESP—Exchangeable Sodium Percentage), an indicator of soil salinity, indicates the ratio of exchangeable sodium ions to total cations in the soil, reflecting soil sodium salinity levels [42]. N. tangutorum exhibits a higher probability of occurrence in areas with elevated T_esp values. In such environments, sodium ions in exchangeable sodium salts reduce soil water conductivity and infiltration rates while fostering conditions of relatively low salt content and slight alkalinity. This enhances the plant’s ability to withstand osmotic pressure and improves its tolerance to salinity and alkalinity, explaining its remarkable salt-alkali resistance [43,44]. High concentrations of Na+ ions can lead to soil dispersion, affecting soil structure and reducing soil aeration and water retention capacity. However, N. tangutorum may counter these adverse factors through specific root structures or metabolic pathways, thus gaining an adaptive advantage in such environments [45,46]. The topsoil electrical conductivity reflects the level of soil salinity. As a desert plant with extremely high salinity-alkalinity tolerance, N. tangutorum can occupy ecological niches in soils that are highly alkaline and saline [47]. Although this study identified the key environmental factors influencing the growth of N. tangutorum and their response curves, data limitations restricted the analysis to abiotic factors such as climate, soil, and topography, without incorporating biotic factors (e.g., interspecific interactions) and anthropogenic influences (e.g., land-use change). Despite these limitations, the optimized MaxEnt model can still reliably predict the species’ potential suitable habitat range in China. Future research could further integrate biotic interactions and anthropogenic variables to refine the distribution model, providing more precise scientific guidance for the conservation planning and resource utilization of N. tangutorum.

4.3. N. tangutorum Geographic Distribution and Spatial Pattern Change

Under current climate conditions, the potential suitable habitats for N. tangutorum in China are primarily distributed across the provinces of Xinjiang, Qinghai, Gansu, Inner Mongolia, and Ningxia. This observation is broadly consistent with the outcomes of modeling suitable habitats for six species within the Nitraria genus utilizing the MaxEnt model. However, our predicted suitable habitat range is smaller, likely because this study focuses solely on N. tangutorum, whereas Duan’s study includes six species of the Nitraria genus, resulting in a broader distribution range. Moreover, by incorporating soil and topographical factors, our study generated more comprehensive predictions, which likely explain the discrepancies in the results [48].
Under future global warming scenarios, the suitable habitat range for N. tangutorum is expected to change somewhat, but there won’t be large-scale migration. The study’s findings suggest that with rising carbon emission concentrations, the suitable habitat area generally decreases by the 2050s but rebounds in some scenarios by the 2090s. This indicates that the effects of climate change on suitable habitat is not simply a linear reduction, but rather a dynamic change, highlighting the complexity of climate change effects on species habitat suitability. In low emission scenarios, the study indicates a continuous decline in the suitable habitat area for N. tangutorum in both the 2050s and 2090s, with particularly significant reductions in areas of low and high suitability. This phenomenon aligns with the findings of the Pinus bungeana potential habitat study, possibly because climate warming under the low-emission scenario reduces environmental conditions suitable for N. tangutorum growth [49]. The SSP585 scenario would see a significant increase in the area of suitable habitat by the 1990s, particularly in areas of medium to high suitability. This increase is likely due to the carbon dioxide fertilization effect resulting from higher CO2 concentrations under high emission scenarios, which promotes plant growth. However, the positive fertilization effect could be offset by extreme temperatures and water resource shortages [50]. During this period, the total suitable habitat area for N. tangutorum increases significantly. This could be due to the fact that under high emission scenarios, some plants within the suitable habitat of N. tangutorum may degrade and disappear as they fail to adapt to the changing environment. Consequently, the community’s species composition shifts as N. tangutorum occupies the ecological niches previously held by these plants. This pattern mirrors observations made in the desert plant Hippophae rhamnoides [51].
With ongoing global warming, plants and animals are expected to gradually shift to higher altitudes or latitudes to adapt to changing climates [52]. However, long-distance dispersal is limited in many plants [53]. The salty-sweet edible fruits of N. tangutorum are considered an important food source for animals; thus, its dispersal relies on birds, mammals, and occasionally ants [54]. This zoochorous trait may mitigate the impact of climatic changes by facilitating seed dispersal to newly suitable habitats, thereby explaining the model’s prediction of range recovery by the 2090s despite mid-century habitat shrinkage. The expansion of suitable habitats typically occurs at the margins of currently suitable areas, which serve as critical and sensitive zones where species respond dynamically to climate change [55]. The results indicate that N. tangutorum primarily expands towards Altay and surrounding areas in northern Xinjiang. Areas of habitat expansion concentrate in the northern portion of existing suitable zones, whereas contractions are primarily observed in the southern regions of current suitable habitats. This aligns with the trend of suitable habitats migrating towards higher lati-tudes under global warming [56,57]. Across different time periods, the retention rate of N. tangutorum suitable habitats remains above 79%, suggesting strong resilience of the species’ core distribution areas to future climate change. This is likely attributed to the species’ robust stress tolerance.

4.4. Protection Strategies

Studying the effects of climate change on the geographic distribution of species is valuable in providing scientific data to support species conservation [58]. Currently, the development and utilization of wild N. tangutorum remain limited, as it primarily inhabits harsh environments in its main distribution areas, with few established artificial populations. Wild germplasm resources typically exhibit high genetic diversity and possess valuable stress-resistant genes [59]. Therefore, based on the findings of this study, extensive collection of N. tangutorum germplasm resources holds significant importance for its future artificial cultivation and industrial development.
Under future climate scenarios, suitable habitats for N. tangutorum in southern Inner Mongolia, central Ningxia, and central Gansu are projected to gradually disappear. Consequently, the collection and conservation of wild germplasm resources in these regions are urgently needed. Translocating populations from these areas to moderately suitable regions for assisted migration will help mitigate adverse climate impacts, facilitate population reproduction and expansion, and enhance the species’ overall resilience and adaptability [60]. Furthermore, as suitable habitats for N. tangutorum are predicted to expand northward toward higher latitude regions, we recommend establishing additional nature reserves in expansion zones, such as northern Xinjiang, to accommodate future migration.
Additionally, we propose implementing incentive policies for artificial cultivation of N. tangutorum in high-suitability areas, including the Qaidam Basin, Hexi Corridor, and Alxa region. Establishing cultivation bases and developing N. tangutorum based industries in these areas will promote ecological conservation while increasing income for local communities. Our research not only enhances the conservation of N. tangutorum germplasm resources but also contributes to improving cultivation quality and the efficiency of ecological restoration efforts. This enables the species to maximize its ecological benefits and economic potential effectively.

5. Conclusions

This study identifies key environmental drivers of N. tangutorum distribution and reveals its dynamic responses to climate change. Precipitation extremes (Bio14, Bio16) and soil characteristics (T_esp, T_ece, T_CACO3) emerge as critical factors limiting its distribution, reflecting adaptations to aridity, salinity, and alkaline substrates. Current high-suitability areas are concentrated in arid/semi-arid regions of northwest China, aligning with its known drought- and salt-tolerant traits. At present, the total suitable area for N. tangutorum in China is 190.30 × 10⁴ km2, with the high suitability area comprising 12.72% of the total suitable area. Under future climate scenarios, suitable habitats exhibit a temporal shift: a moderate contraction by the 2050s, followed by a gradual expansion by the 2090s, with a notable northward shift toward higher latitudes. Although this study only used the MaxEnt model to simulate the suitable habitat distribution of N. tangutorum, the research results can offer valuable insights for studies on desert plant distribution, biodiversity, and the formulation of conservation strategies. These insights deepen our understanding of N. tangutorum’s responses to combined bioclimatic and soil environmental changes, providing a scientific basis for prioritizing the conservation of its germplasm resources and optimizing cultivation strategies. Future studies will incorporate more factors into the habitat prediction of N. tangutorum, further providing a theoretical foundation for the protection of its germplasm resources and scientifically guided planting management.

Author Contributions

Conceptualization, project administration, and methodology, Z.J. and L.H.; formal analysis, investigation, and resources, L.L., Q.Y. and D.H.; writing—original draft preparation, L.L.; visualization, validation, and writing—review & editing, J.L. and P.Z. All authors have read and agreed to the published version of the manuscript.

Funding

This research was funded by the National Key Research and Development Program of China (Grant No. 2023YFF1304200) and the National Forestry and Grassland Germplasm Resources bank (2005DKA21003).

Data Availability Statement

The data are contained within the article.

Conflicts of Interest

The authors declare no conflicts of interest.

References

  1. Lawler, J.; Shafer, S.L.; White, D. Projected climate-induced faunal change in the Western Hemisphere. Ecology 2009, 90, 588–597. [Google Scholar] [CrossRef] [PubMed]
  2. Xu, J.; Liu, T.; Zang, G.; Zheng, Y. Prediction of suitable areas of Eremochloa ophiuroides in China under different climate scenarios based on MaxEnt model. J. Beijing For. Univ. 2024, 46, 91–102. (In Chinese) [Google Scholar] [CrossRef]
  3. Zhong, X.; Lei, C.; Liu, J.; Lin, C.; Qi, Y.; Li, H. FuXi-Extreme: Improving extreme rainfall and wind forecasts with diffusion model. Sci. China Earth Sci. 2024, 54, 3734–3747. (In Chinese) [Google Scholar] [CrossRef]
  4. Song, Z.; Du, Y.; Primack, R.; Miller-Rushing, A.; Ye, W.; Huang, Z. Surprising roles of climate in regulating flowering phenology in a subtropical ecosystem. Ecography 2021, 44, 1379–1390. [Google Scholar] [CrossRef]
  5. Liang, Q.; Xu, X.; Mao, K.; Wang, M.; Wang, K.; Xi, Z.; Liu, J. Shifts in plant distributions in response to climate warming in a biodiversity hotspot, the Hengduan Mountains. J. Biogeogr. 2018, 45, 1334–1344. [Google Scholar] [CrossRef]
  6. Crimmins, S.M.; Dobrowski, S.Z.; Greenberg, J.A.; Abatzoglou, J.T.; Mynsberge, A.R. Changes in climatic water balance drive downhill shifts in plant species’ optimum elevations. Science 2011, 331, 324–327. [Google Scholar] [CrossRef]
  7. Wiens, J. Climate-related local extinctions are already widespread among plant and animal species. PLoS Biol. 2016, 14, e2001104. [Google Scholar] [CrossRef]
  8. Hao, T.; Jane, E.; José, J.L.; Gurutzeta, G.A. Testing whether ensemble modelling is advantageous for maximising predictive performance of species distribution models. Ecography 2020, 43, 549–558. [Google Scholar] [CrossRef]
  9. Zhang, H.; Zhao, H.; Wang, H. Potential geographical distribution of Populus euphratica in China under future climate change scenarios based on MaxEnt model. Acta Ecol. Sin. 2020, 40, 6552–6563. (In Chinese) [Google Scholar]
  10. Pili, A.; Tingley, R.; Sy, E.; Diesmos, M.; Diesmos, A. Niche shifts and environmental non-equilibrium undermine the usefulness of ecological niche models for invasion risk assessments. Sci. Rep. 2020, 10, 7972. [Google Scholar] [CrossRef]
  11. Bao, R.; Li, X.; Zheng, J. Feature tuning improves MAXENT predictions of the potential distribution of Pedicularis longiflora Rudolph and its variant. PeerJ 2022, 10, e13337. [Google Scholar] [CrossRef] [PubMed]
  12. Yang, X.; Zhang, Y.; Wang, L.; Zhao, J. Nitraria resources in China and their utilization. World For. Res. 2013, 26, 64–68. (In Chinese) [Google Scholar] [CrossRef]
  13. Zhang, J.; Wu, B.; Zhu, Y.; Lu, Q.; Li, Y. Responses of Nitraria tangutorum branch morphology to increased rainfall in Minqin, Gansu Province. J. Desert Res. 2012, 32, 709–716. (In Chinese) [Google Scholar]
  14. Yang, Y.; Yang, F.; Li, X.; Shi, R.; Lu, J. Signal regulation of proline metabolism in callus of the halophyte Nitraria tangutorum Bobr. grown under salinity stress. Plant Cell Tissue Organ Cult. 2013, 112, 33–42. [Google Scholar] [CrossRef]
  15. Yang, Y.; Wei, X.; Shi, R.; Fan, Q.; An, L. Salinity-induced physiological modification in the callus from halophyte Nitraria tangutorum Bobr. J. Plant Growth Regul. 2010, 29, 465–476. [Google Scholar] [CrossRef]
  16. Wang, S.; Kang, X. Current research situation and suggestion on Nitraria tangutorum Bobr. J. Plant Genet. Resour. 2005, 2, 231–235. (In Chinese) [Google Scholar] [CrossRef]
  17. Jiang, S.; Li, J.; Wang, Y.; Zhang, Q. Hypoglycemic effect of Nitraria tangutorum fruit by inhibiting glycosidase and regulating IRS1/PI3K/AKT signalling pathway and its active ingredient identification by UPLC-MS. Food Funct. 2023, 14, 7869–7881. [Google Scholar] [CrossRef]
  18. Wu, Z.; Ma, Y.; Li, X.; Zhang, Y. Analysis and evaluation of forage quality of four Nitraria species. J. Gansu Agric. Univ. 2017, 52, 97–100. (In Chinese) [Google Scholar] [CrossRef]
  19. Wang, J.; Wang, W.; Li, M.; Zhou, Y.; Li, Y. Determination and analysis of nutritional components in Cynomorium songaricum parasitic on two species of Nitraria. J. Gansu Agric. Univ. 2023, 58, 130–136. (In Chinese) [Google Scholar] [CrossRef]
  20. Gao, X.; Li, Q.; Zhang, L.; Wang, H. Prediction of the potential distribution of raspberry (Rubus idaeus) in China based on MaxEnt model. Sci. Rep. 2024, 14, 24438. [Google Scholar] [CrossRef]
  21. Zhao, R.; Wang, S.; Chen, S. Predicting the potential habitat suitability of Saussurea species in China under future climate scenarios using the optimized Maximum Entropy (MaxEnt) model. J. Clean. Prod. 2024, 474, 143552. [Google Scholar] [CrossRef]
  22. Wu, T.; Lu, Y.; Fang, Y.; Jie, W. The Beijing Climate Center Climate System Model (BCC-CSM): The main progress from CMIP5 to CMIP6. Geosci. Model Dev. 2019, 12, 1573–1600. [Google Scholar] [CrossRef]
  23. Xin, X.; Zhang, H.; Zhang, W.; Wu, T. Introduction of BCC models and its participation in CMIP6. Clim. Change Res. 2019, 15, 533–539. (In Chinese) [Google Scholar] [CrossRef]
  24. Li, X.; Hu, K.; Zeng, A.; Dong, D. Potential distribution of Asystasia gangetica ssp. Micrantha in China based on the MaxEnt ecological niche model. Southwest China J. Agric. Sci. 2024, 37, 860–868. (In Chinese) [Google Scholar] [CrossRef]
  25. Chen, B.; Li, Y.; Wang, X.; Zhang, J. Distribution pattern and change prediction of Saposhnikovia divaricate suitable area in China under climate change. Ecol. Indic. 2022, 143, 109311. [Google Scholar] [CrossRef]
  26. Chen, S.; Liu, J.; Wang, L.; Li, H. Potential distribution of Apocynum based on MaxEnt optimization model. J. Beijing Norm. Univ. (Nat. Sci.) 2022, 59, 377–387. (In Chinese) [Google Scholar] [CrossRef]
  27. Kass, J.; Muscarella, R.; Galante, P.J.; Bohl, C.L.; Pinilla-Buitrago, G.E. ENMeval 2.0: Redesigned for customizable and reproducible modeling of species’ niches and distributions. Methods Ecol. Evol. 2021, 12, 1602–1608. [Google Scholar] [CrossRef]
  28. Li, Z.; Ma, Y.; Li, Y.; Liu, Y.; Wang, Y.; Wang, X. Spatial and temporal variations of the potential habitat of Asterothamnus centraliasiaticus on the Qinghai-Tibet Plateau under climate change. Chin. J. Ecol. 2024, 43, 1566–1575. (In Chinese) [Google Scholar] [CrossRef]
  29. Muscarella, R.; Galante, P.J.; Soley-Guardia, M.; Boria, R.A.; Kass, J.M. ENM eval: An R package for conducting spatially independent evaluations and estimating optimal model complexity for Maxent ecological niche models. Methods Ecol. Evol. 2014, 5, 1198–1205. [Google Scholar] [CrossRef]
  30. Geng, W.; Zhang, Y.; Liu, X.; Li, J. Prediction of the potential geographical distribution of Betula platyphylla Suk. in China under climate change scenarios. PLoS ONE 2022, 17, e0262540. [Google Scholar] [CrossRef]
  31. Syfert, M.M.; Smith, M.J.; Coomes, D.A. The effects of sampling bias and model complexity on the predictive performance of MaxEnt species distribution models. PLoS ONE 2013, 8, e55158. [Google Scholar] [CrossRef] [PubMed]
  32. Guo, X.; Wang, L.; Xu, X.; Tong, L. MaxEnt modeling for predicting potential suitable distribution areas of Styrax odoratissimus. Ecol. Sci. 2020, 39, 119–124. (In Chinese) [Google Scholar] [CrossRef]
  33. Han, M.; Li, X.; Zhang, Y.; Wang, H. Simulation of Elymus sibiricus L. distribution in Tibetan Plateau based on MaxEnt model. Acta Agrestia Sin. 2021, 29, 374–382. (In Chinese) [Google Scholar]
  34. Wang, P.; Li, J.; Zhang, Q.; Zhao, L. Prediction of the potential distribution of Curcuma in China under current and future climate scenarios. Acta Prataculturae Sin. 2024, 33, 14–27. (In Chinese) [Google Scholar] [CrossRef]
  35. Elena, A.E. Plant hormesis and Shelford’s tolerance law curve. J. For. Res. 2021, 32, 1789–1802. [Google Scholar] [CrossRef]
  36. Kong, W.; Li, X.; Zou, H. Optimizing MaxEnt model in the prediction of species distribution. Chin. J. Appl. Ecol. 2019, 30, 2116–2128. (In Chinese) [Google Scholar] [CrossRef]
  37. Perlman, P.; Chu, G.; Chang, Y.; Peng, M.; Wang, M. Prediction and analysis of two potential suitable areas of Reaumuria plants in Northwest China based on the maximum entropy (MaxEnt) model. J. Northwest For. Univ. 2020, 35, 18–25. (In Chinese) [Google Scholar] [CrossRef]
  38. Arman, J.; Nurbay, A.; Maidina, T.; Sayit, H. Predicting the potential geographic distribution and pattern of Tamarix taklamakanensis based on the maximum entropy model (Maxent). Jiangsu Agric. Sci. 2019, 47, 91–94. [Google Scholar] [CrossRef]
  39. Chang, H.; Liu, T.; Wang, D.; Ji, X. Haloxylon ammodendron’s potential distribution under climate change in arid areas of Northwest China. J. Desert Res. 2019, 39, 110–118. (In Chinese) [Google Scholar]
  40. Yang, Z.; Gao, Z. Impact of precipitation and underground water level in the edge of oases on growth and decline of Nitraria tangugtorum community. Chin. J. Appl. Ecol. 2000, 6, 923–926. (In Chinese) [Google Scholar] [CrossRef]
  41. Yao, Z.; Han, Q.; Lin, B. Prediction of distribution area of main noxious and miscellaneous weeds in Xinjiang based on Maxent model. Acta Ecol. Sin. 2023, 12, 5096–5109. (In Chinese) [Google Scholar] [CrossRef]
  42. Li, X.; Mao, Y.; Liu, X. Flue gas desulfurization gypsum application for enhancing the desalination of reclaimed tidal lands. Ecol. Eng. 2015, 82, 566–570. [Google Scholar] [CrossRef]
  43. Fang, H.; Wang, Y.; Zhang, L.; Li, J. Analysis on the potential habitat suitability of Spartina alterniflora based on MaxEnt model. Acta Agrestia Sin. 2023, 31, 3514–3524. (In Chinese) [Google Scholar] [CrossRef]
  44. Dilmurat, Y.; Arzigul, T.; Mamat, Y. Comparative analysis of salt stress on germination of five Nitraria species. J. Agric. 2018, 8, 19–22. (In Chinese) [Google Scholar]
  45. Kim, Y.; Choo, B.; Cho, J. Effect of gypsum and rice straw compost application on improvements of soil quality during desalination of reclaimed coastal tideland soils: Ten years of long-term experiments. Catena 2017, 156, 131–138. [Google Scholar] [CrossRef]
  46. Zhang, Z.; Li, X.; Wang, Y.; Liu, B. Biomass allocation and prediction in Nitraria nabkhas. Pratacult. Sci. 2021, 38, 1069–1077. (In Chinese) [Google Scholar] [CrossRef]
  47. Zhou, H.; Zhao, W.; Luo, W.; Liu, B. Species diversity and vegetation distribution in nebkhas of Nitraria tangutorum in the desert steppes of China. Ecol. Res. 2015, 30, 735–744. [Google Scholar] [CrossRef]
  48. Duan, Y.; Zhu, G.; Du, Z.; Li, Y.; Lu, K.; Shi, J. Simulation and analysis of the suitable environment for Nitraria L. in the arid area of Northwest China. J. Arid Land Resour. Environ. 2021, 35, 124–129. (In Chinese) [Google Scholar] [CrossRef]
  49. Fan, Y.; Wang, L.; Zhang, Q.; Li, J. Prediction of potential suitable distribution area of Pinus bungeana in China under the background of climate change. Arid Zone Res. 2024, 41, 1719–1730. (In Chinese) [Google Scholar] [CrossRef]
  50. Song, Y.; Tang, X.; Jia, Y.; Liu, X.; Cui, Y. Fertilization effect of carbon dioxide on ecosystems in Gannan, China. Acta Ecol. Sin. 2021, 41, 7301–7311. (In Chinese) [Google Scholar] [CrossRef]
  51. Chen, S.; Dong, H.; Yue, Y.; Hao, Y.; Liu, X.; Cao, X.; Ma, J. Geographical distribution and dynamic change prediction of Hippophae rhamnoides subsp. sinensis under different climate scenarios. Arid Zone Res. 2024, 41, 1560–1571. (In Chinese) [Google Scholar] [CrossRef]
  52. Lai, W.; Shi, C.; Wen, G.; Lü, Z.; Ye, L.; Huang, Q.; Zhang, G. Potential impacts of climate change on the distribution of the relict plant Shaniodendron subaequale. Heliyon 2023, 9, e14402. [Google Scholar] [CrossRef]
  53. Morgan, J.W.; Venn, S.E. Alpine plant species have limited capacity for long-distance seed dispersal. Plant Ecol. 2017, 218, 813–819. [Google Scholar] [CrossRef]
  54. Zhang, M.; Temirbayeva, K.; Sanderson, S.; Chen, X. Young dispersal of xerophil Nitraria lineages in intercontinental disjunctions of the Old World. Sci Rep. 2015, 5, 13840. [Google Scholar] [CrossRef]
  55. Diamond, S.E.; Frame, A.M.; Martin, R.A.; Buckley, L.B. Species’ traits predict phenological responses to climate change in butterflies. Ecology 2011, 92, 1005–1012. [Google Scholar] [CrossRef]
  56. Li, J.; Chang, H.; Liu, T.; Zhang, C. The potential geographical distribution of Haloxylon across Central Asia under climate change in the 21st century. Agric. For. Meteorol. 2019, 275, 275243–275254. [Google Scholar] [CrossRef]
  57. Yang, S.; Wang, H.; Jing, W.; Wang, Q.; Yan, H.; Qiu, X.; Jian, H. Simulation of climate change effect on the global distribution of Rosa multiflora. Chin. J. Appl. Ecol. 2024, 35, 1897–1906. [Google Scholar] [CrossRef]
  58. He, X.; Burgess, K.; Gao, L.; Li, D. Distributional responses to climate change for alpine species of Cyananthus and Primula endemic to the Himalaya-Hengduan Mountains. Plant Divers. 2018, 41, 26–32. [Google Scholar] [CrossRef]
  59. Lv, T.; Liu, Y.; Zhou, Y.; Liu, T.; Zhang, X.; Su, X. Germplasm Collection and Preliminary Studies on Genealogical Differentiation of A Desert Species—Psammochloa villosa. Acta Agrestia Sin. 2018, 26, 733–740. [Google Scholar] [CrossRef]
  60. Hao, S.; Zhang, D.; Wen, Y. Potential Geographical Distribution of Lagerstroemia excelsa under Climate Change. Agriculture 2024, 14, 191. [Google Scholar] [CrossRef]
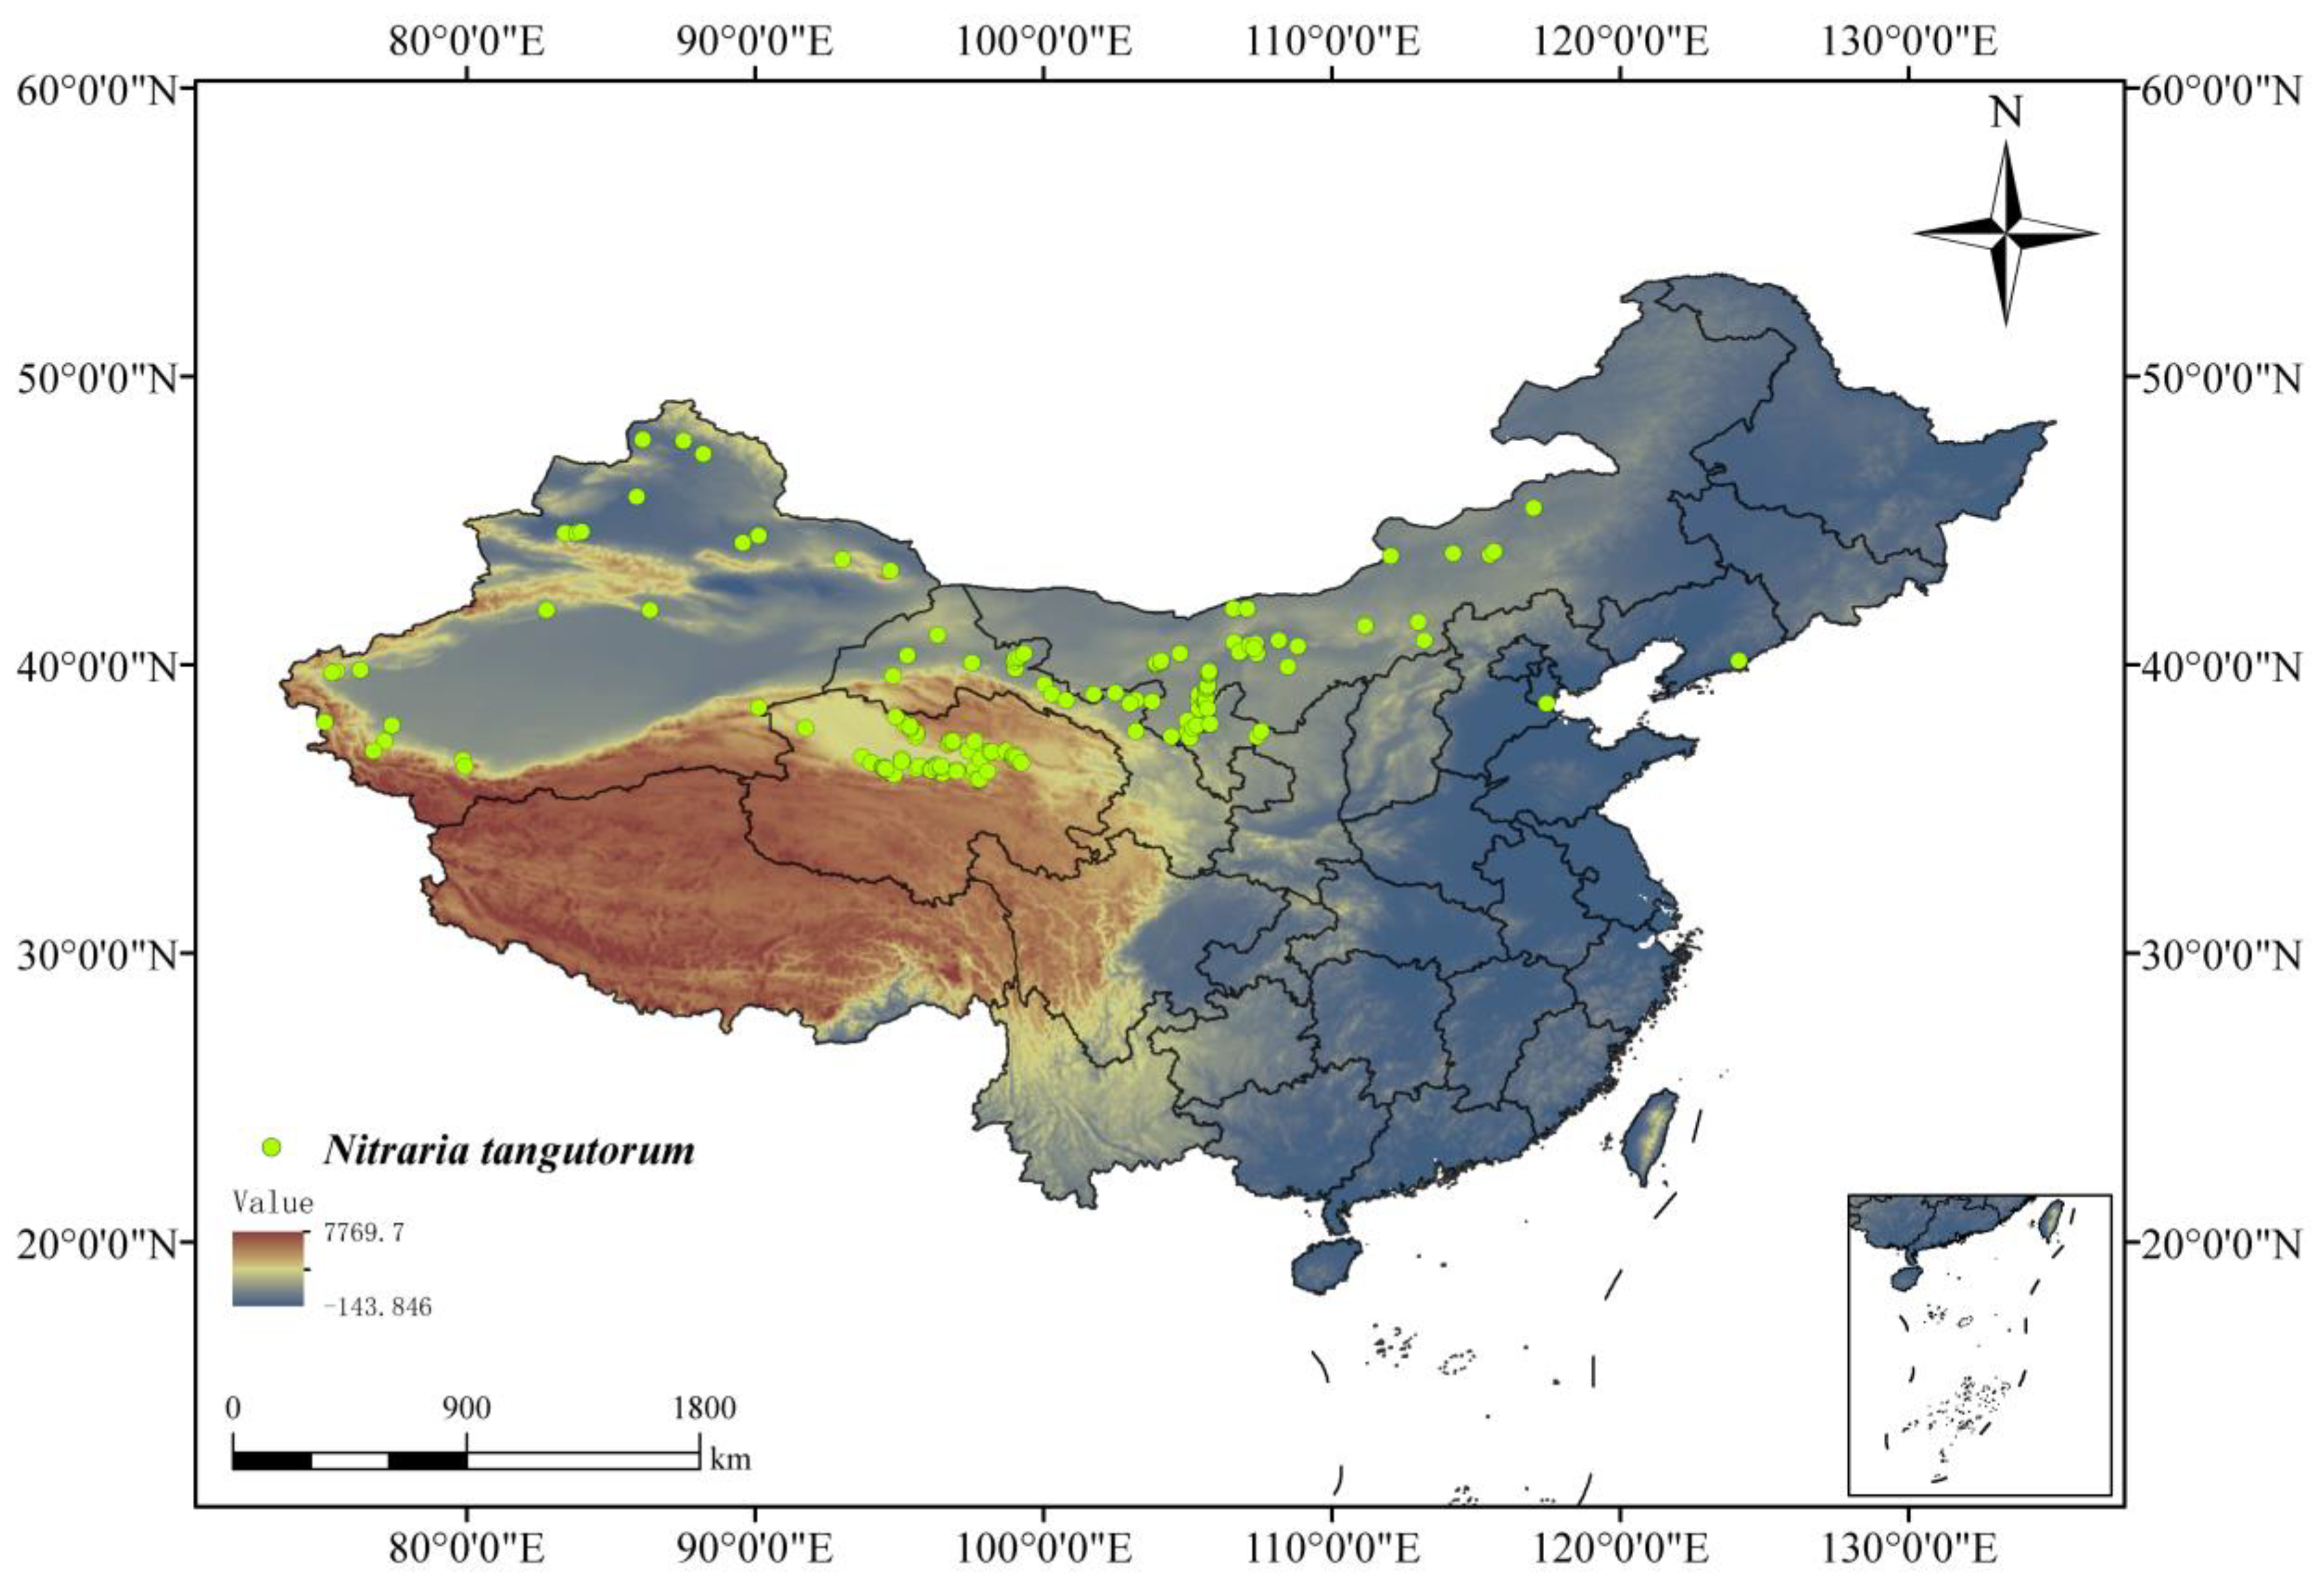
Figure 1. Location of Nitraria tangutorum sample points.
Plants 14 01446 g001
Figure 2. The ROC curve predicted by the MaxEnt model.
Plants 14 01446 g002
Figure 3. The results of the Jackknife test for the environmental factors.
Plants 14 01446 g003
Figure 4. Response curves of main bioclimatic factors. (a) The reaction curve of Precipitation of Wettest Quarter(Bio16) and the probability of presence; (b) The reaction curve of Topsoil Sodicity (T_esp) and the probability of presence; (c) The reaction curve of Topsoil Electroconductibility (T_ece) and the probability of presence; (d) The reaction curve of Topsoil Carbonate or lime content (T_CACO3) and the probability of presence; (e) The reaction curve of Precipitation of Driest Month (Bio14) and the probability of presence.
Plants 14 01446 g004
Figure 5. The suitable habitat of N. tangutorum under current climate conditions. The blue grey areas represent no suitability habitats, green areas represent low suitability habitats, orange areas represent medium suitability habitats, and brown areas represent high suitability habitats.
Plants 14 01446 g005
Figure 6. Projected habitats of N. tangutorum under four SSP scenarios (SSP1-2.6, SSP2-4.5, SSP3-7.0, SSP5-8.5) for the (a) 2050s and (b) 2090s. Subpanels I–IV in each panel (a,b) correspond to the four scenarios listed sequentially.
Plants 14 01446 g006
Figure 7. Spatial shifts in the geographic distribution of N. tangutorum under four SSP scenarios for the 2050s and 2070s. (a) 2050s; (b) 2070s. In each panel, I–IV denote SSP1-2.6, SSP2-4.5, SSP3-7.0 and SSP5-8.5, respectively; The red areas represent range expansion, white areas represent no occupancy, gray areas represent no change, and blue areas represent range contraction.
Plants 14 01446 g007
Figure 8. The migration of N. tangutorum centroid in different climatic scenarios.
Plants 14 01446 g008
Table 1. Comparison of model results between optimized parameters and default parameters.
TypeRMFCDelta.AICcMean.Diff.AUCMean.OR10
default1LQHP967.580.0520.21
optimized3LQHPT00.040.20
Table 2. Percentage contribution and permutation importance of environmental factors.
VariablesDescriptionPercent ContributionPermutation Importance
Bio16Precipitation of Wettest Quarter32.436
T_espTopsoil Sodicity (ESP-Exchangeable Sodium Percentage)13.71.4
T_eceTopsoil Electroconductibility9.81.5
T_CACO3Topsoil Carbonate or lime content9.210.2
Bio14Precipitation of Driest Month6.35.3
DemElevation68.8
Bio11Mean Temperature of Coldest Quarter5.29.5
Bio4Temperature Seasonality5.21.5
T_bsBasic saturation3.66
Bio15Precipitation Seasonality2.61.7
T_sandTopsoil sand content27.8
T_siltTopsoil silt content1.55.2
SlopeSlope variability1.31.7
T_clayTopsoil clay content13.4
Table 3. Optimal and suboptimal growing condition ranges of key environmental variables for N. tangutorum.
VariableSuboptimal RangesOptimal Ranges
Precipitation of Wettest Quarter
(Bio16)
0.96–200.20 mm34.17–139.32 mm
Topsoil Sodicity (ESP-Exchangeable Sodium Percentage)
(T_esp)
2.13–61.74%6.58–61.74%
Topsoil Electroconductibility
(T_ece)
0.39–35.40 dS·m−11.49–31.43 dS·m−1
Topsoil Carbonate or lime content
(T_CACO3)
0.30–31.75%1.20–14.71%
Precipitation of Driest Month
(Bio14)
0.15–2.35 mm0.15–1.91 mm
Table 4. Suitable area of N. tangutorum in different periods (unit: ×104 km2).
PeriodClimate ScenariosLow
Suitable Area
Medium
Suitable Area
High
Suitable Area
Total
Suitable Area
Compare with the Current Increase
Current 108.3557.7324.21190.300
2050sssp126105.1153.9126.34185.35−2.59%
ssp245104.5855.1326.56186.27−2.12%
ssp370103.8853.8727.07184.82−2.88%
ssp585106.4754.8227.39188.68−0.85%
2090sssp126101.7754.3022.76178.83−6.02%
ssp245101.6962.9224.24188.85−0.76%
ssp370103.0564.1025.38192.541.18%
ssp585103.5665.7225.77195.052.50%
Table 5. Change of N. tangutorum suitable area in different periods (unit: ×104 km2).
PeriodNo Change AreaNo Change Rate (%)Range Contraction AreaRange Contraction Rate (%)Range Expansion AreaRange Expansion Rate (%)
2050sSSP126153.8480.8523.6812.4419.1010.03
SSP245151.1379.4226.3913.8720.6810.87
SSP370151.5079.6126.0213.6718.759.85
SSP585151.5879.6625.9413.6322.1611.64
2090sSSP126151.1279.4126.4013.8719.2110.09
SSP245152.0879.9225.4413.3723.5612.38
SSP370151.8479.7925.6813.527.3714.38
SSP585151.2379.4726.3013.8228.3114.88
Disclaimer/Publisher’s Note: The statements, opinions and data contained in all publications are solely those of the individual author(s) and contributor(s) and not of MDPI and/or the editor(s). MDPI and/or the editor(s) disclaim responsibility for any injury to people or property resulting from any ideas, methods, instructions or products referred to in the content.